international textile machinery shipment statistics 2018
TRANSCRIPT

International Textile Machinery Shipment
Statistics 2019
Dr. Christian Schindler Director General
ITMF
ITMF Textile Machinery Workshop 2020
May 6th, 2020 – CANCELLED Frankfurt, Germany

ContentsGlobal Shipment of New Textile Machinery (2010-2019)
1. Spinning Machines 2. Texturing Machines 3. Weaving Machines 4. Circular Knitting Machines 5. Flat Knitting Machines 6. Finishing Machines

Spinning MachinesShort-Staple Spindles
Global Shipment of New Textile Machinery (2010-2019)

4
-20%YonY% (2019)
8.7 7.0
5
10
15
20
Shipped Short-Staple SpindlesWorld
2010 2011 2012 2013 2014 2015 2016 2017 2018 2019
(million units)

5
96% 94% 94% 93% 91% 91% 93% 95% 92% 92%
0%
20%
40%
60%
80%
100%
2010 2011 2012 2013 2014 2015 2016 2017 2018 2019
Shipped Short-Staple SpindlesBy Regions (Share to World Total)
Asia and Oceania Europe, Others America, North AfricaEurope, West America, South Europe, East
China'sshare 63% 62% 61% 54% 45% 36% 46% 46% 44% 51%

6
0.1
0.1
0.1
0.2
0.3
0.4
0.5
0.5
1.0
3.6
0.0 0.5 1.0 1.5 2.0 2.5 3.0 3.5 4.0
Indonesia
Honduras
Ethiopia
Turkey
Bangladesh
Pakistan
Vietnam
Uzbekistan
India
China
Shipped Short-Staple Spindles10 Biggest Investors (2019) (million units)

7
123456789
10
2010
2011
2012
2013
2014
2015
2016
2017
2018
2019
Shipped Short-Staple SpindlesSelected Countries
China India
0
200
400
600
800
1'000
1'200
2010
2011
2012
2013
2014
2015
2016
2017
2018
2019
Bangladesh IndonesiaPakistan Vietnam
(million units) (thousand units)

Spinning MachinesOpen-End Rotors
Global Shipment of New Textile Machinery (2010-2019)

9
721574
0
200
400
600
800
Shipped RotorsWorld
2010 2011 2012 2013 2014 2015 2016 2017 2018 2019
(thousand units)
-20%YonY% (2019)

10
83% 81%90%
79%64%
81%92% 85% 91% 90%
0%
20%
40%
60%
80%
100%
2010 2011 2012 2013 2014 2015 2016 2017 2018 2019
Shipped RotorsBy Regions (Share to World Total)
Asia and Oceania Europe, Others America, SouthEurope, West Africa America, NorthEurope, East Not specified (World)
China'sshare
72% 68%81%
61%36%
64% 74% 67% 64% 58%

11
8
11
13
15
21
26
29
41
62
330
0 50 100 150 200 250 300 350
Bangladesh
Turkey
Brazil
Pakistan
Not specified (World)
Indonesia
Uzbekistan
India
Vietnam
China
Shipped Rotors10 Biggest Investors (2019) (thousand units)

12
0
100
200
300
400
500
600
2010
2011
2012
2013
2014
2015
2016
2017
2018
2019
Shipped RotorsSelected Countries
China India
0
10
20
30
40
50
60
70
2010
2011
2012
2013
2014
2015
2016
2017
2018
2019
Bangladesh IndonesiaPakistan Vietnam
(thousand units) (thousand units)

Spinning MachinesLong-Staple Spindles
Global Shipment of New Textile Machinery (2010-2019)

14
120 41100
200
300
400
500
2001 2004 2007 2010 2013 2016 2019
Shipped Long-Staple SpindlesWorld (thousand units)
-66%YonY% (2019)

15
73%
50% 51%
72%
59%76% 64%
81%
52%
40% 43% 45%36%
21%
58%
39%
68%
54%
74%
0%
20%
40%
60%
80%
100%
2001 2004 2007 2010 2013 2016 2019
Shipped Long-Staple SpindlesBy Regions (Share to World Total)
Asia and Oceania Europe, Others America, North AfricaEurope, West America, South Europe, East
China'sshare
59%
25% 34%49% 45% 52% 49% 53%
21% 32% 21% 19%33%
14% 24% 15% 22% 18%
65%

16
0.2
0.3
0.3
0.3
0.4
0.5
2.9
3.8
5.3
26.2
5 10 15 20 25 30
Romania
South Africa
Norway
U.S.A.
Peru
Azerbaijan
Belgium
India
Italy
China
Shipped Long-Staple Spindles10 Biggest Investors (2019) (thousand units)

17
0
50
100
150
200
250
300
2001 2004 2007 2010 2013 2016 2019
Shipped Long-Staple SpindlesSelected Countries
China Iran Turkey
(thousand units)

Texturing MachinesFalse Twist – Single & Double Heater
Global Shipment of New Textile Machinery (2010-2019)

19
513 489
0
200
400
600
800
1'000
Shipped Texturing SpindlesWorld
2010 2011 2012 2013 2014 2015 2016 2017 2018 2019
(thousand units)
-5%YonY% (2019)

20
92% 94% 90% 90% 87%79% 83%
90% 93% 90%
0%
20%
40%
60%
80%
100%
2010 2011 2012 2013 2014 2015 2016 2017 2018 2019
Shipped Texturing SpindlesBy Regions (Share to World Total)
Asia and Oceania Europe, Others America, South Europe, WestAfrica America, North Europe, East
China'sshare
70% 75% 68% 72% 61% 56% 57% 66% 68% 69%
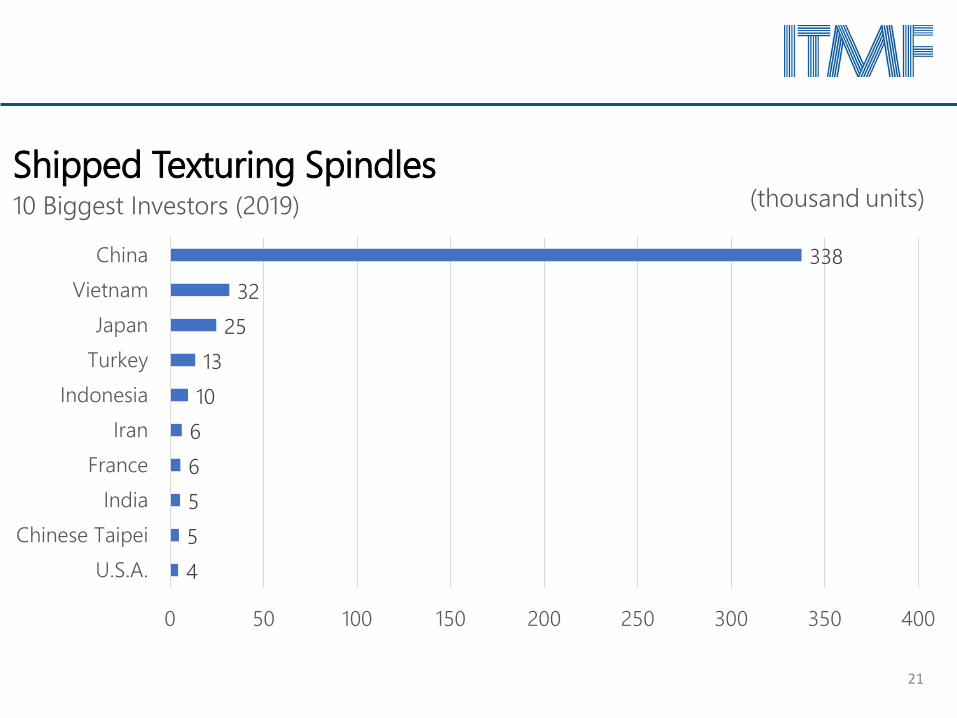
21
4
5
5
6
6
10
13
25
32
338
0 50 100 150 200 250 300 350 400
U.S.A.
Chinese Taipei
India
France
Iran
Indonesia
Turkey
Japan
Vietnam
China
Shipped Texturing Spindles10 Biggest Investors (2019) (thousand units)
22
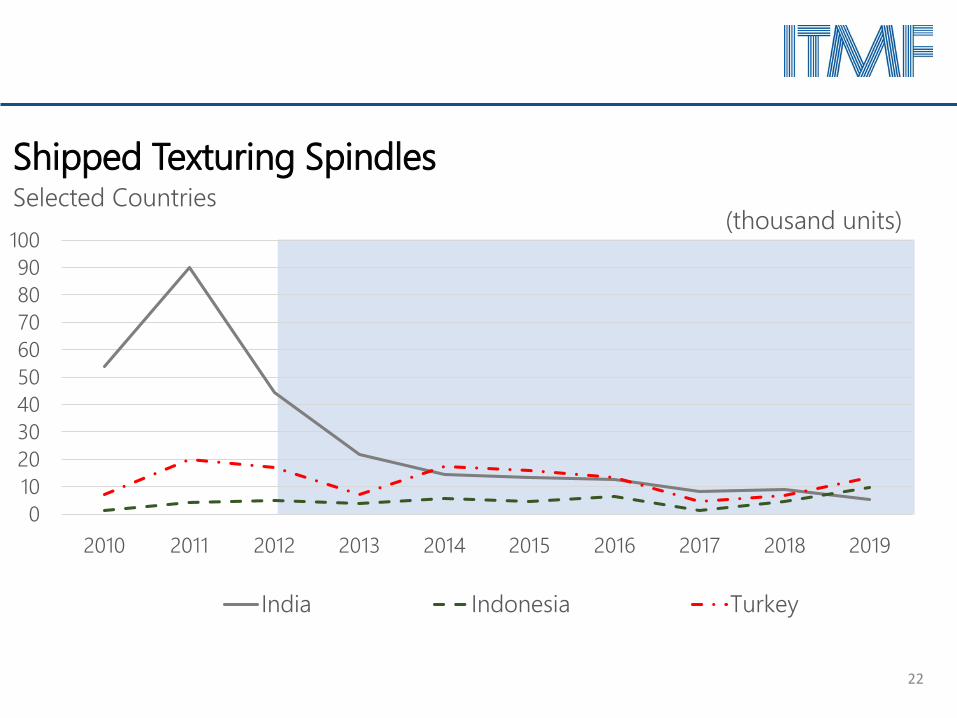
0102030405060708090
100
2010 2011 2012 2013 2014 2015 2016 2017 2018 2019
Shipped Texturing SpindlesSelected Countries
India Indonesia Turkey
(thousand units)

Weaving MachinesAir-Jet, Rapier and Projectile, Water-Jet
Global Shipment of New Textile Machinery (2010-2019)

24
134 133
0
50
100
150
200
Shipped Shuttle-Less LoomsWorld
2010 2011 2012 2013 2014 2015 2016 2017 2018 2019
(thousand units)
-1%YonY% (2019)

25
97% 97% 93% 92% 90% 93% 91% 91% 94% 95%
0%
20%
40%
60%
80%
100%
2010 2011 2012 2013 2014 2015 2016 2017 2018 2019
Shipped Shuttle-Less LoomsBy Regions (Share to World Total)
Asia and Oceania Europe, Others Africa Europe, WestEurope, East America, North America, South
China'sshare
84% 83%68% 66%
46% 50% 53% 52%68% 72%

26
1
1
2
2
2
2
2
5
16
96
0 20 40 60 80 100 120
Egypt
Chinese Taipei
Uzbekistan
Indonesia
Pakistan
Turkey
Vietnam
Bangladesh
India
China
Shipped Shuttle-Less Looms10 Biggest Investors (2019) (thousand units)

27
0
20
40
60
80
100
120
2010 2011 2012 2013 2014 2015 2016 2017 2018 2019
Shipped Shuttle-Less LoomsBy Sub-Category
Air-Jet Rapier and Projectile Water-Jet
(thousand units)

28
0
5
10
15
20
25
2010
2011
2012
2013
2014
2015
2016
2017
2018
2019
Shipped Shuttle-Less LoomsSelected Countries
Bangladesh IndiaIndonesia Vietnam
0
1
2
3
4
5
2010
2011
2012
2013
2014
2015
2016
2017
2018
2019
Japan Turkey U.S.A.
(thousand units) (thousand units)

Large Circular Knitting MachinesSingle (up to 24 inch), Single (26 inch or over)Double (up to 24 inch), Double (26 inch or over)
Global Shipment of New Textile Machinery (2010-2019)

30
26.4 26.9
0
10
20
30
40
Shipped Large Circular Knitting MachinesWorld
2010 2011 2012 2013 2014 2015 2016 2017 2018 2019
(thousand units)
2%YonY% (2019)

31
92% 91% 92% 91% 88% 88% 87% 85% 85% 86%
0%
20%
40%
60%
80%
100%
2010 2011 2012 2013 2014 2015 2016 2017 2018 2019
Shipped Large Circular Knitting MachinesBy Regions (Share to World Total)
Asia and Oceania Europe, Others AfricaEurope, West America, North America, SouthEurope, East Not specified (World)
China'sshare
77% 73% 77% 75%60% 52% 43% 40% 48% 49%

32
0.5
0.5
0.6
0.6
0.8
0.8
1.0
2.2
2.7
13.1
0 2 4 6 8 10 12 14
Chinese Taipei
Uzbekistan
Egypt
Indonesia
Pakistan
Turkey
Bangladesh
Vietnam
India
China
Shipped Large Circular Knitting Machines10 Biggest Investors (2019) (thousand units)

33
0
5
10
15
20
25
2010 2011 2012 2013 2014 2015 2016 2017 2018 2019
Shipped Large Circular Knitting MachinesBy Sub-Category
Double (26 inch or over) Single (26 inch or over)Double (up to 24 inch) Single (up to 24 inch)
(thousand units)

34
0
1
2
3
4
5
6
2010 2011 2012 2013 2014 2015 2016 2017 2018 2019
Shipped Large Circular Knitting MachinesSelected Countries
India Bangladesh Indonesia Turkey Vietnam
(thousand units)
Flat Knitting MachinesFlat Knitting Machines up to 70“Flat Knitting Machines 70" and over
Global Shipment of New Textile Machinery (2010-2019)

36
160
96
0
50
100
150
200
250
2010 2011 2012 2013 2014 2015 2016 2017 2018 2019
Shipped Electronic Flat Knitting MachinesWorld (thousand units)
-40%YonY% (2019)

37
94% 93% 89% 86% 86%93% 94% 96% 95% 92%
0%
20%
40%
60%
80%
100%
2010 2011 2012 2013 2014 2015 2016 2017 2018 2019
Shipped Electronic Flat Knitting MachinesBy Regions (Share to World Total)
Asia and Oceania Europe, Others Europe, West America, SouthAfrica Europe, East America, North
China'sshare
74% 78% 72%59%
42% 51%73% 77% 76% 72%

38
0.8
0.9
0.9
0.9
1.6
1.7
1.8
3.6
6.8
68.8
0 10 20 30 40 50 60 70 80
Bangladesh
Hong Kong, China
Italy
Indonesia
Myanmar
Turkey
Cambodia
Vietnam
India
China
Shipped Electronic Flat Knitting Machines10 Biggest Investors (2019) (thousand units)

39
0
4
8
12
16
20
2010 2011 2012 2013 2014 2015 2016 2017 2018 2019
Shipped Electronic Flat Knitting MachinesSelected Countries
Bangladesh India Turkey Vietnam
(thousand units)

Finishing MachinesFabric Continuous (woven & knit)[Bleaching – Line, Dyeing - Line (Hotflue), Dyeing - Line (CPB), Mercerizing – Line, Relax Dryers/Tumblers, Sanforizers/Compacters, Singeing Line, Stenters, Washing (stand-alone)]
Fabric Discontinuous (woven & knit) [Air Jet Dyeing, Jigger Dyeing / Beam Dyeing, Overflow Dyeing]
Global Shipment of New Textile Machinery (2015-2019)

41
Stenters
1'269
1'700
0200400600800
1'0001'2001'4001'6001'800
2015 2017 2019
Shipped Finishing Machines (Continuous)World & Region, per Sub-Category
Asia and Oceania Europe America Africa Not specified
(units)
Sanforizers/Compacters
Bleaching - Line Washing (stand-alone)
Relax Dryers/Tumblers202
74
050
100150200250
96 78
93 60
050
100150200250
2015 2017 2019
163 164
2015 2017 2019
*
*Data entails estimates for world market for the first time in 2019

42
64 51
0306090
120150
Shipped Finishing Machines (Continuous)World & Region, per Sub-Category
Asia and Oceania Europe America Africa Not specified
(units)
Mercerizing - Line
Dyeing - Line (Hotflue) Singeing Line
Dyeing - Line (CPB)
5635
56 46
0306090
120150
2015 2017 2019
12 0
2015 2017 2019

43
Overflow Dyeing
2'020
1'689
0
500
1'000
1'500
2'000
2'500
2015 2017 2019
Shipped Finishing Machines (Discontinuous)World & Region, per Sub-Category
Asia and Oceania Europe America Africa Not specified
(units)
Air Jet Dyeing Jigger Dyeing / Beam Dyeing
1'3221'218
2015 2017 2019
415561
2015 2017 2019

44
Thank you foryour attention