international workshop comparing ets and nir … · bbm launched the denk research project in 2011....
TRANSCRIPT

International Workshop Comparing ETS and NIR Monitoring Data 26th and 27th September 2011
CLIMATE CHANGE
22/2013

International Workshop Comparing ETS and NIR Monitoring Data 26th and 27th September 2011
by
Volker Handke Melanie Degel Institute for Futures Studies and Technology Assessment (IZT Berlin)
On behalf of the German Federal Environment Agency
UMWELTBUNDESAMT
| CLIMATE CHANGE | 22/2013
ENVIRONMENTAL RESEARCH OF THE GERMAN FEDERAL MINISTRY OF THE ENVIRONMENT, NATURE CONSERVATION AND NUCLEAR SAFETY
Project-no. (FKZ) 390 01 020 Report-no. (UBA-FB) 001884/E

This publication is only available online. It can be downloaded from https://www.umweltbundesamt.de/publikationen/international-workshop-comparing-ets-nir-monitoring
The contents of this publication do not necessarily reflect the official opinions.
ISSN 1862-4359
Study performed by: Institute For Futures Studies and Technology Assessment (IZT Berlin) Schopenhauerstr. 26 14129 Berlin
Study completed in: December 2012
Publisher: Federal Environment Agency (Umweltbundesamt) Wörlitzer Platz 1 06844 Dessau-Roßlau Germany Phone: +49-340-2103-0 Fax: +49-340-2103 2285 Email: [email protected] Internet: http://www.umweltbundesamt.de
http://fuer-mensch-und-umwelt.de/
Edited by: Section E 2.3 Economic Aspects of Emissions Trading, Monitoring, Evaluation Annett Hohlfeld and Volker Kathöfer
Dessau-Roßlau, January 2014

International Workshop – Comparing ETS and NIR Monitoring Data
Abstract
To prepare for upcoming reporting challenges under Monitoring Mechanism Regulation (MMR, EU/525/2013) and Monitoring and Reporting Regulation (MRR, EC/601/2012) joint by the Effort Sharing Decision (ESD, EC/409/2009), The Federal Environment Agency (Umweltbundesamt [UBA]), The German Emissions Trading Authority (DEHSt), The Institute for Futures Studies and Technology Assessment (IZT Berlin) and the engineering company Mueller BBM launched the DENK research project in 2011. The main subject of this project was the comparison between plant-specific data of the European Emission Trading System (EU ETS) and the data and methods used for preparation of source category-specific annual inventories, according to the EU monitoring mechanism and the national reporting under the United Nations Framework Convention on Climate Change (UNFCCC)
Project results were presented during a two-day workshop on 26 and 27 September 2011 in Berlin. The working field addressed was a comparison of the EU ETS and UNFCCC data and the reporting processes in the specific sectors. Subsequently, the results were discussed and, likewise, launched activities on this topic in other EU countries were presented. Ongoing activities of the EU concerning revision of the EU ETS, especially in relation to the EU Decision No 280/2004/EC and EU Directive 2003/87/EC, were not a core focus of this workshop. General information concerning emerging challenges and upcoming requirements associated with this revision were given as an outlook at the end of the workshop.
International experts from nine European countries (Belgium, Denmark, Finland, France, Germany, Greece, Norway, Sweden and the United Kingdom) presented their countries´ experiences at the workshop by using ETS data for inventory compilation. The main thematic focuses were refineries, the iron and steel sector, the energy sector and the mineral industry (i.e. cement and ceramics). In conclusion, an outlook was formulated regarding additional gases and activities which fall under the ETS from 2013 on.
The final conclusion emphasized that ETS data could enhance specific NIR data and vice versa – knowledge of both monitoring guidelines is pre-conditioned, appropriate by Article 5 of MMR (EC/525/2013) adopted in May 2013.
3
International Workshop – Comparing ETS and NIR Monitoring Data
Table of Contents
List of Figures ........................................................................................................................................... 5
List of Tables ............................................................................................................................................ 6
List of Abbreviations ............................................................................................................................... 7
1 Summary .......................................................................................................................................... 9
2 Presentations .................................................................................................................................11
2.1 Opening presentations ..........................................................................................................11
2.2 Sector-specific presentations ................................................................................................14
2.2.1 Refineries, Germany .........................................................................................................14
2.2.2 Refineries, UK ....................................................................................................................15
2.2.3 Iron and Steel, Sweden ....................................................................................................19
2.2.4 Energy, Germany ..............................................................................................................20
2.2.5 Energy, Belgium ...............................................................................................................21
2.2.6 Energy, Denmark ..............................................................................................................23
2.2.7 Cement Industry, Germany .............................................................................................24
2.2.8 Ceramic Industry, Germany ............................................................................................25
2.2.9 New Gases and Activities .................................................................................................26
3 Final Discussion .............................................................................................................................27
4 Conclusions and recommendations of the workshop ..............................................................29
5 List of the participants of the Workshop ...................................................................................31
6 References ......................................................................................................................................33
4

International Workshop – Comparing ETS and NIR Monitoring Data
List of Figures
Figure 1: Thematic background of the workshop .............................................................................. 11
Figure 2: Overall goals of the DENK research project ....................................................................... 12
Figure 3: Framework of ETS and national inventory ......................................................................... 12
Figure 4: DENK project tasks ................................................................................................................ 13
Figure 5: Workflow of the comparison between ETS and CRF categories for refineries ................................................................................................................. 14
Figure 6: Sources relying on ETS data used by UK inventory compilers ......................................... 15
Figure 7: UK GHG National Inventory System and the ETS .............................................................. 16
Figure 8: Mapping scheme of the comparison between ETS and CRF categories for the iron and steel sector ........................................................................................ 18
Figure 9: Swedish method before the EU ETS..................................................................................... 20
Figure 10: Emissions reporting and trading in Flanders .................................................................. 22
Figure 11: Consistency of time series with different implied emissions factors for Danish coal combustion ........................................................................................ 23
Figure 12: Main matching results for the German cement sector ................................................... 24
Figure 13: Main matching results for the German ceramic sector .................................................. 25
5

International Workshop – Comparing ETS and NIR Monitoring Data
List of Tables
Table 1: Emissions spreads in the public electricity and heat production sector .......................... 20
Table 2: Categorisation of New Gases and Activities for 2013 EU ETS ............................................ 27
6
International Workshop – Comparing ETS and NIR Monitoring Data
List of Abbreviations
AEAT AEA Technology plc
AGEB Working Group on Energy Balances (Arbeitsgemeinschaft Energiebilanzen)
AD Activity data
CH4 methane
CO2 carbon dioxide
CRF common reporting format
DEHSt German Emissions Trading authority at Federal Environment Agency (Deutsche missionshandelsstelle im Umweltbundesamt)
DENK Data Exchange between ETS and NIR (Datenaustauch zwischen Emissionshandel und Nationaler Klimaschutzberichterstattung)
EC European Commission
EEA European Environment Agency
EF emission factor
ETS European Emissions Trading Scheme
EU European Union
F-gases fluorinated gases (HFCs, PFCs, SF6)
Gg 1 gigagram = 109 g = 1 kilotonne (kt)
GHG greenhouse gas
GWP global warming potential
HFCs hydrofluorocarbons
IPCC Intergovernmental Panel on Climate Change
IZT Institute for Futures Studies and Technology Assessment (Institut für Zukunftsstudien und Technologiebewertung, Berlin)
KP Kyoto Protocol
LULUCF land use, land-use change and forestry
Mg 1 megagram = 106 g = 1 tonne (t)
MRG Monitoring and Reporting Guidelines
MW Megawatt
N2O nitrous oxide
NAP national allocation plan
NIR national inventory report
PFCs perfluorocarbons
SF6 sulphur hexafluoride
SNE Single National Entity
7

International Workshop – Comparing ETS and NIR Monitoring Data
t 1 tonne (metric) = 1 megagram (Mg) = 106 g
TJ 1 terajoule
VITO Flemish Institute for Technological Research
UBA Federal Environment Agency Germany (Umweltbundesamt)
UNFCCC United Nations Framework Convention on Climate Change
8

International Workshop – Comparing ETS and NIR Monitoring Data
1 Summary
To prepare for upcoming reporting challenges, The Federal Environment Agency (Umweltbundesamt [UBA]), The German Emissions Trading Authority (DEHSt), The Institute for Futures Studies and Technology Assessment (IZT Berlin) and the engineering company Mueller BBM launched the DENK research project in 2011. The main theme of this project was a comparison between plant-specific data of the European Emission Trading System (EU ETS) and the data and methods used for preparation of source category-specific annual inventories, according to the EU monitoring mechanism and the national reporting under the United Nations Framework Convention on Climate Change (UNFCCC) The data baseline used in the project was the reporting period from 2005 to 2009, with a focus on methodological comparisons of the various source categories covered, while taking into account the partly different approaches for the ETS data. It was also intended to calculate possible figures for the differing coverage of the ETS share in specific source categories.
The core aim of the DENK-project was to generate a syntactical interpretation and comparative aggregation of the information about fuels and input materials used by the EU ETS monitoring as well as by national UNFCCC reporting. A further project focus lay on quantitative analyses of the reported emissions covered by the emissions under the EU ETS. The primarily considered emission sources were refineries and the iron and steel sector. Additionally, an initial projection about new emission sources in the EU ETS for the period 2013–2020, based on their degree of coverage for the emissions reported from 2014, is to be formulated. The achieved results of the project will be used to verify national-level UNFCCC reporting, particularly with regard to the requirements for participation in flexible mechanisms beneath the UNFCCC level.
Project results were presented during a two-day workshop on 26 and 27 September 2011 in Berlin. The working field addressed was comparison of the EU ETS and UNFCCC data and the reporting processes in the specific sectors. Subsequently, the results were discussed and, likewise, launched activities on this topic in other EU countries were presented. Ongoing activities of the EU concerning revision of the EU ETS, especially in relation to EU Decision No 280/2004/EC and EU Directive 2003/87/EC, were not a core focus of the workshop. General information concerning emerging challenges and upcoming requirements associated with this revision were given as an outlook at the end of the workshop.
At the workshop, international experts from nine European countries (Belgium, Denmark, Finland, France, Germany, Greece, Norway, Sweden and the United Kingdom) presented their countries´ experiences with using ETS data for inventory compilation. The main thematic focuses were refineries, the iron and steel sector, the energy sector and the mineral industry (i.e. cement and ceramics). In concluding, an outlook was formulated regarding additional gases and activities which will fall under the ETS from 2013 on. More specifically, the experts for the refinery sector were from the German engineering company Mueller BBM and the British inventory agency AEAT; for the iron and steel sector, from Mueller BBM and from Statistics Sweden of the Swedish Environmental Protection Agency; for the energy sector, from the German Institute for Futures Studies and Technology Assessment (IZT), the Flemish Institute for Technological Research (VITO), and the Department of Environmental Science of Aarhus University (Denmark); and for the mineral industry and also the new gases and activities, again from the IZT.
In the final discussion, the following results were emphasised:
9
International Workshop – Comparing ETS and NIR Monitoring Data
• In some member states (MS) inventory compilers do not have direct access to detailed monitoring data of ETS installations. It would be helpful to generally grant all MS compilers access to ETS data, so that they can all obtain relevant and up-to-date data.
• Concerning accuracy, ETS data might be preferable to default values in the inventory, because they are checked and validated.
• Nevertheless, it is possible that ETS data contain mistakes, so they should still be checked by inventory compilers.
• Due to the variety of institutional organisations in a single MS, collaboration and workflow between energy statistics, inventory compilers and ETS authorities as well as industrial, business and trade associations as data sources, improvement potential varies in a wide range from MS to MS.
• Differentiation between public and industrial energy amounts is not indicated by ETS data, so this has to be calculated for every installation individually.
The following challenges for improving the inventory compilation process in the future were mentioned:
• To obtain knowledge of data completeness, it might be useful to compare both datasets plant by plant, aggregated sector by sector, aggregated fuel type by fuel type, respective material by material. Comparing sector by sector and material flow by material flow (as in Germany) would also likely improve completeness. The ETS has some thresholds, e.g. 20 MW for boilers, so it may not contain all facilities.
• Improving inventory accuracy may lead to inconsistent time series. Each data compiler has to decide individually when higher accuracy is more important than time series consistency.
Involvement of different authorities for GHG inventories and ETS necessitates consultation and coordination among all actors. Further harmonisation between the two data sets has to be achieved where possible.
10

International Workshop – Comparing ETS and NIR Monitoring Data
2 Presentations
2.1 Opening presentations
The workshop was opened by Jürgen Landgrebe, head of department E2 of the German Emissions Trading Authority (DEHSt). He gave an overview about the organizational structure of the DEHSt and its relationship to the German inventory authority as well as the targets and tasks of the DEHSt. He underlined the importance of the workshop and pointed out the necessity of collaboration between ETS and national inventories. So far, monitoring has been fitted the requirements of the next challenges under the Energy Services Directive (ESD). Figure 1 indicates some crucial tasks of relevance to the workshop.
Figure 1: Thematic background of the workshop
Volker Kathöfer, DEHSt, gave an overview of the DENK project. He explained the intention of the project and presented the parties and people involved in it. He stated that matching between the ETS and national inventories has always been more or less problematic and that the main goal of the DENK project is to solve or at least to diminish this problem. Furthermore, he clarified the scope and objectives of the project and the workshop, underlining that the intention of the workshop is to share experience and obtain knowledge of the work results of other participants. Figure 2 outlines the core goals of the DENK project
11

International Workshop – Comparing ETS and NIR Monitoring Data
Figure 2: Overall goals of the DENK research project
Michael Strogies, head of the emissions situation department of the German inventory authority, presented the responsibilities of his section, the different reporting products and their requirements, its working principles and the organization of its work flow.
Figure 3illustrates the different frameworks of the ETS and the German general structure of the national inventory
Figure 3: Framework of ETS and national inventory
He also gave some general information about the inventory compilation process in Germany. He underlined that during the last annual UNFCCC reviews the Expert Review Team (ERT) has encouraged Germany to continue using ETS data to verify country-specific Emission Factors (EF) and emissions estimates.
12

International Workshop – Comparing ETS and NIR Monitoring Data
Volker Handke, IZT, coordinator of the research agents on the DENK Project, gave an overview of the research being conducted for the DENK project. He outlined the tasks, defined the different working steps that had to be made in the project, and illustrated its challenges and envisaged results. Figure 4 gives an overview of the project tasks:
Figure 4: DENK project tasks
13

International Workshop – Comparing ETS and NIR Monitoring Data
2.2 Sector-specific presentations
2.2.1 Refineries, Germany
Matthias Bender, research agent of Mueller BBM, presented the tasks, approaches, encountered problems and results of the research work for the DENK project concerning the refinery sector. He defined the chosen methods used for identifying relevant installations, generating the data subset for the refinery sectors and analysing the data. He explained the following results and conclusions.
The subsets adequate for the common reporting format (CRF) categories in the German inventory can be deduced from EU ETS. Figure 5 provides an overview:
Figure 5: Workflow of the comparison between ETS and CRF categories for refineries
• 1.A.1.b Refineries/ Combustion,
• 1.B.2.c Venting and Flaring, and
• 2.B.5 Chemical Industry/ Catalyst Regeneration
1. Process emissions can be extracted from ETS data by referring to other CRF categories and can possibly be included elsewhere in the inventory.
2. For the category fuel combustion (1.A.1.b, main fraction of refinery emissions), the ETS emissions are slightly higher than the inventory emissions.
Data analysis of the level of material flows produced the following results:
• There is some consistency between ETS and the inventory, but it is not complete.
14

International Workshop – Comparing ETS and NIR Monitoring Data
• The material flows evaluated from ETS data are only partially congruent with the material flows of the inventory due to different fuel specifications (heavy fuel oil or residual oil, refinery gas or other gases and petrol coke)
• ETS and inventory data can be compared in terms of activity rates, but have to be corrected from effects of differing emission factors
• The remaining differences between ETS and inventory emissions need to be evaluated. Further analyses are necessary to check differences in activity rates. Moreover there is a need for additional information about the overlap between the refinery sector and chemical industry and mixed gases (basically refinery gas and natural gas) in ETS. Therefore it would be helpful to convert relevant ETS data to make it comparable to the national oil statistic.
2.2.2 Refineries, UK
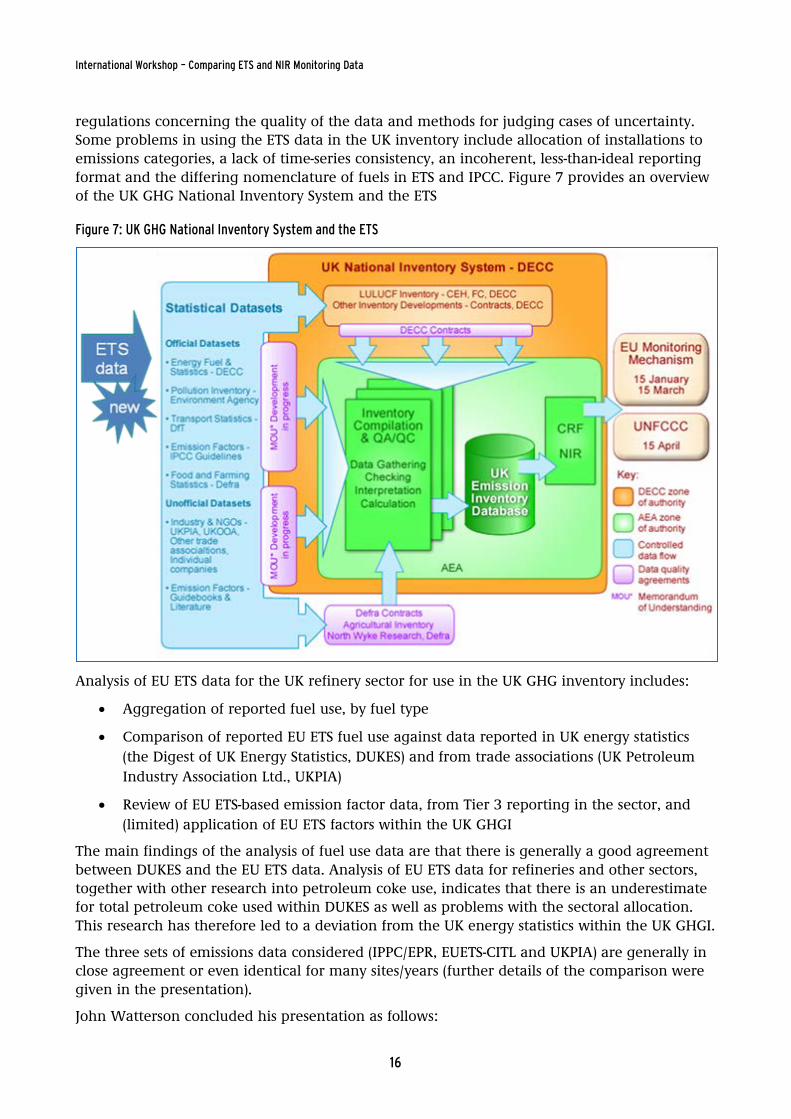
John Watterson, UK inventory agency AEAT, gave a presentation about the experience of the UK refinery sector as well as the chosen approaches for using ETS data there. Although he outlined the entire sector, Mr. Watterson concentrated on coal combustion, because that is where the majority of emissions come from. All UK refineries report under the EU ETS. Mr. Watterson began his presentation with an overview of the structure of how ETS data can be used by UK inventory compilers. Figure 6 provides an overview of this.
Figure 6: Sources relying on ETS data used by UK inventory compilers
Furthermore, he showed the relevance of ETS data for the UK inventory and presented examples of ETS data already used by the UK inventory. After explaining the organizational structure of the UK inventory system, noting some of its special features, Mr. Watterson highlighted some barriers to using ETS data in the UK inventory. He also talked about the strict
15
International Workshop – Comparing ETS and NIR Monitoring Data
regulations concerning the quality of the data and methods for judging cases of uncertainty. Some problems in using the ETS data in the UK inventory include allocation of installations to emissions categories, a lack of time-series consistency, an incoherent, less-than-ideal reporting format and the differing nomenclature of fuels in ETS and IPCC. Figure 7 provides an overview of the UK GHG National Inventory System and the ETS
Figure 7: UK GHG National Inventory System and the ETS
Analysis of EU ETS data for the UK refinery sector for use in the UK GHG inventory includes:
• Aggregation of reported fuel use, by fuel type
• Comparison of reported EU ETS fuel use against data reported in UK energy statistics (the Digest of UK Energy Statistics, DUKES) and from trade associations (UK Petroleum Industry Association Ltd., UKPIA)
• Review of EU ETS-based emission factor data, from Tier 3 reporting in the sector, and (limited) application of EU ETS factors within the UK GHGI
The main findings of the analysis of fuel use data are that there is generally a good agreement between DUKES and the EU ETS data. Analysis of EU ETS data for refineries and other sectors, together with other research into petroleum coke use, indicates that there is an underestimate for total petroleum coke used within DUKES as well as problems with the sectoral allocation. This research has therefore led to a deviation from the UK energy statistics within the UK GHGI.
The three sets of emissions data considered (IPPC/EPR, EUETS-CITL and UKPIA) are generally in close agreement or even identical for many sites/years (further details of the comparison were given in the presentation).
John Watterson concluded his presentation as follows:
16

International Workshop – Comparing ETS and NIR Monitoring Data
• ETS data may help to improve the EU GHG inventory in the following ways:
1. GHG inventory compilers should try to include facility level data in GHG inventories. It is likely to reduce the uncertainty in the inventory.
2. Reported verified emissions can be used directly in the GHG inventory to report CO2 emissions for a specific source category, provided that the coverage of the ETS emissions is complete and the ETS and CRF source categories follow the same definitions.
3. Emission factors (or other parameters such as oxidation factors) reported under the EU ETS can be used if the EU ETS provides improved information.
4. Activity data reported under the EU ETS can be used directly for the GHG inventory, in particular for source categories where energy statistics face difficulties in disaggregating fuel consumption to specific subcategories, e.g. to specific industrial sectors.
5. Data from EU ETS can be used for more general verification activities as part of national quality assurance (NQA) activities.
6. Data from EU ETS can improve completeness of the estimation of IPCC source categories.
7. The comparison of the data sets can be used to improve the uncertainty estimation for the GHG inventories, based on the ranges of data reported by installations.
• Uncertainties in the refinery ETS data sets are generally low and have improved over time.
1. The UK GHG inventory uses EU ETS refinery data, e.g. for emission factors, for Other Petroleum Gas (OPG), and natural gas burnt in refineries. This reduces uncertainty in the estimated emissions.
2. Mr. Watterson warned against taking ETS data as “definitive”. Effort needs to be invested in understanding the data, and even verified data may contain anomalies and inconsistencies.
3. The quality of reporting has improved over time, but despite verification there are still errors in the data.
4. For example, the OPG Implied Emission Factors (IEF) suggests that there might be reporting problems. Calculations suggests, for example, petroleum coke with >100% carbon content.
5. He advised, however, not to reject data just because they fall outside IPCC guideline values. There may be good reasons for that.
6. One should also be cautious with using “outliers” as a simple metric for quality control, because some fuels are naturally variable.
7. Using facility leveled data may allow a better estimate of the uncertainties associated with the emissions from a sector.
17
International Workshop – Comparing ETS and NIR Monitoring Data
8. When facilities move from default EFs to ones based on measurement, this will increase the variability of the data, but true uncertainties will then be revealed and can be quantified.
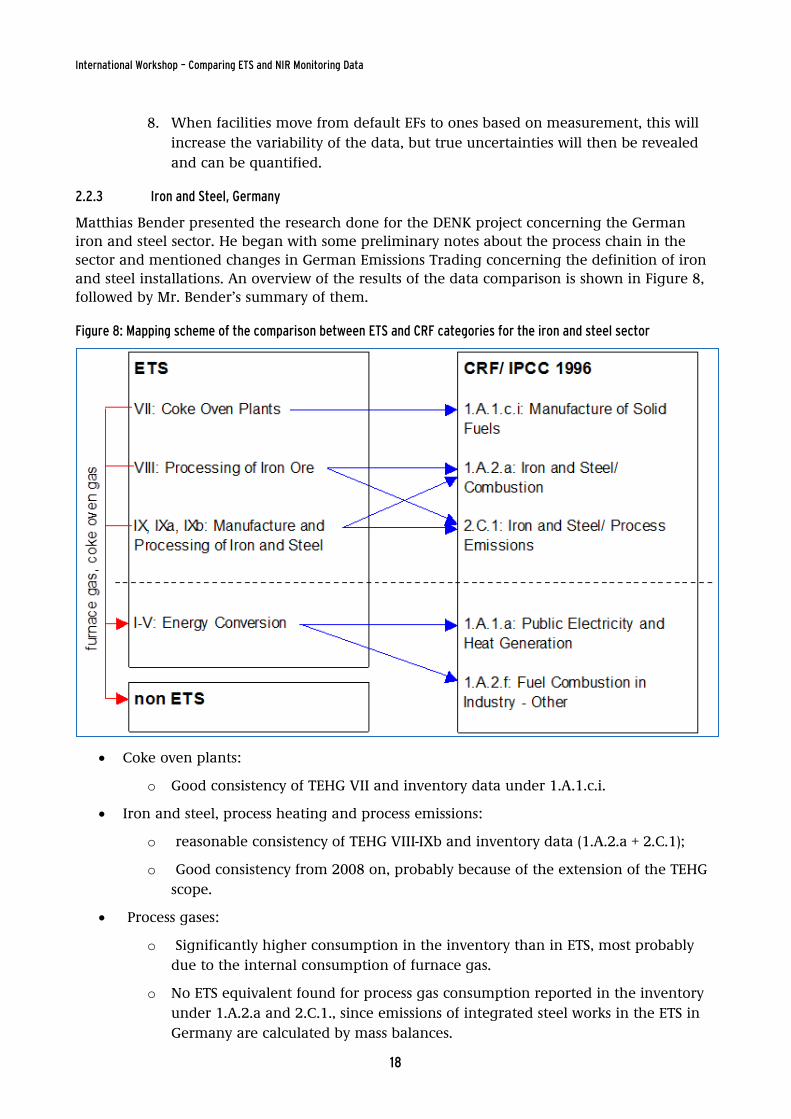
2.2.3 Iron and Steel, Germany
Matthias Bender presented the research done for the DENK project concerning the German iron and steel sector. He began with some preliminary notes about the process chain in the sector and mentioned changes in German Emissions Trading concerning the definition of iron and steel installations. An overview of the results of the data comparison is shown in Figure 8, followed by Mr. Bender’s summary of them.
Figure 8: Mapping scheme of the comparison between ETS and CRF categories for the iron and steel sector
• Coke oven plants:
o Good consistency of TEHG VII and inventory data under 1.A.1.c.i.
• Iron and steel, process heating and process emissions:
o reasonable consistency of TEHG VIII-IXb and inventory data (1.A.2.a + 2.C.1);
o Good consistency from 2008 on, probably because of the extension of the TEHG scope.
• Process gases:
o Significantly higher consumption in the inventory than in ETS, most probably due to the internal consumption of furnace gas.
o No ETS equivalent found for process gas consumption reported in the inventory under 1.A.2.a and 2.C.1., since emissions of integrated steel works in the ETS in Germany are calculated by mass balances.
18

International Workshop – Comparing ETS and NIR Monitoring Data
2.2.3 Iron and Steel, Sweden
Anna-Karin Nyström, Statistics Sweden, presented the Swedish experience of using ETS data in the iron and steel sector and the reporting mechanism used for CO2 emissions to the EU and the UNFCCC. She began with an overview of the process flow in the secondary steel production and described the Swedish approach of using ETS data. She explained that the GHG-emitting processes in the Swedish iron and steel sector are very complex, especially for primary iron and steel works, but also for secondary steel production. She pointed out that ETS data alone are not sufficient and have to be supplemented by other data sources, such as environmental reports and direct contact with installation operators. Ms. Nyström also gave an overview of primary steel production based on iron ore pellets and showed the Swedish approach to using a carbon mass balance for proper mapping of ETS data to the different process steps in iron and steel production. She ended her presentation with the following conclusions:
• For the sectors pig iron and steel, the data allow a division into:
o 1.A.1.c.: Coke Oven
o 1.A.2.a.: Combustion in Rolling Mills and Power and Heat Production
o 1.B.1.c.: Flaring of coke oven gas
o 2.C.1.2.: Blast Furnace and Steelworks (including Flaring of BFG and LD-gas)
• Revisions due to EU ETS:
o ETS data do not divide emissions in CRF sectors and did not include rolling mills before 2008.
o Activity data and emissions have been collected from legal environmental reports and by direct contact with the operators of plants since 2003.
o For 1990 to 2002, plant-specific data on CO2 emissions were used in combination with estimated data based on pig iron production.
• Primary iron based on iron powder:
o Before the ETS was introduced, only fuel data were reported, but not limestone or reducing agents (except for natural gas reported in the energy sector).
o Now the mass balance approach based on ETS data has been used since 2005, and plant-specific data were collected for 1990-2004.
o Emissions are verified using national energy statistics on coke, anthracite and output materials.
• In Sweden there is the ambition to use as much EU ETS data as possible, but there are difficulties:
o There are different reporting units in the energy sector.
o The Swedish energy statistics do not report by plant, but rather by company ; in the ETS there are company or plant-specific data
o The EU ETS does not cover all plants and fuels.
o There is a mass balance approach for the ETS, but a sectoral approach for GHG.
19

International Workshop – Comparing ETS and NIR Monitoring Data
Nevertheless, the use of ETS data promises a significant improvement, compared with the situation before the ETS system. Figure 9 gives an overview of the previous situation:
Figure 9: Swedish method before the EU ETS
Ms. Nyström also proposed reporting emissions to the UNFCCC partly from the energy sector and partly from the industrial process sector, as emissions arise from both fuels and reducing agents.
2.2.4 Energy, Germany
Volker Handke, IZT, gave a presentation about DENK research results of the public electricity and heat production sector. He began with some preliminary notes about the dominance of energy-related activities listed under the EU ETS in Germany. He described the boundaries of the sector, characterised the approaches applied for identifying installations by mapping fuels and materials from the ETS to the inventory, and explained how sector- and material-specific coverage rates are estimated. Furthermore, Mr. Handke provided results of a side analysis attempting to explain the emissions gap discovered for the fuels hard coal and natural gas, as listed in Table 1:
Table 1: Emissions spreads in the public electricity and heat production sector
Fuels kt CO2 in 2009 Coverage Emission spreadETS Inventory
Raw Lignite 152.613 154.480 99 % -1.866Hard coal 99.996 93.471 107 % 6.525Natural gas 46.919 37.141 126 % 9.779Heavy heating oil 2.008 1.605 125 % 403Blast-furnace and converter gas 1.846 3.300 56 % -1.455Lignite dust and fluidised bed coal 1.354 762 178 % 591Light heating oil 1.119 1.107 101 % 12Petrol coke 704 739 95 % ´-35
20

International Workshop – Comparing ETS and NIR Monitoring Data
Possible explanations for the emissions spreads of hard coal and natural gas were given:
• Too many ETS facilities are related to 1.A1.a, still including industrial plants
• Facilities may have been included elsewhere in the inventory. Possible source categories are:
o 1.A.1.c, Manufacture of solid fuels and other energy
o 1.A.2.f Other- other unspecific industrial power plants
Mr. Handke drew the following conclusions:
• Identification of facilities by TEHG activity, NACE code and semantic analysis is possible, but with some uncertainties:
o Public electricity and heat production is not clearly dividable from industrial and commercial facilities.
o Operator information is highly interpretable.
o There are two versions of the NACE code (the previous and current ones), and both are used by operators.
• The bottom-up approach of the ETS offers more usable differentiation of fuels, but includes the risk of inaccurate aggregation.
• With a relatively high overall coverage rate of 102%, it can be assumed that
o almost all 1.A.1.a. facilities are part of the ETS
o the inventory presents the activities in the sector almost completely.
• The over-coverage of hard coal and natural gas in the ETS suggests that there are too many ETS facilities related to 1.A.1.a and, therefore, industrial plants are still being included.
2.2.5 Energy, Belgium
Ms Kristien Aernouts, Flemish Institute for Technological Research (VITO), gave a presentation about a comparison between energy and emissions data reported under the ETS and the energy balance and GHG inventory of Flanders. Figure 10 provides basic geographical and institutional information on the general structure of energy reporting and trading in Flanders.
21

International Workshop – Comparing ETS and NIR Monitoring Data
Figure 10: Emissions reporting and trading in Flanders
Ms. Aernouts began with an overview of the responsibilities of the Flemish GHG inventory, the people and institutions involved. She explained the role of the energy balance in Flanders and gave some initial impressions of encountered problems:
• in the energy data from ETS, calorific values (especially a problem for ‘recovered fuels’) and biomass (only a memo item) are sometimes missing;
• ETS emissions factors are mainly reported in t/t;
• different allocations of CHP units in ETS data and in energy balance and GHG inventory need to be made comparable before comparing both data sets;
• allocation of CHP units is always a problem, because many large CHP units are joint ventures between electricity companies and the industry; and
• differentiation between ‘energy’ and ‘process’ (iron and steel, refineries) is different in ETS reporting and in the GHG inventory.
To solve these problems, Ms. Aernouts proposed reallocating CHP units until they are comparable, adding biomass and estimated calorific values if possible. Although this may create uncertainties, the level of comparison would become more detailed.
In 2010 a study was conducted, ordered by the Flemish Environmental Agency (VMM-MIRA), to compare the energy use and GHG emissions included in the ETS with the total energy use and GHG emissions in Flanders for the period 2005 to 2008. The main objective of this project was to develop indicators for the yearly assessment of ETS and non-ETS GHG emissions.
Results of comparisons of energy data from ETS and the national energy balance, on the one hand, and of CO2 emissions from ETS and GHG inventory, on the other, were shown for both total Flemish energy consumption as well as for the energy and industrial sector in particular.
Ms. Aernouts ended with the following conclusions:
• The involvement of different authorities for GHG inventories and ETS necessitates consultation and coordination among all actors.
• Further comparison and possible harmonisation of ETS and the national inventory is desirable.
22

International Workshop – Comparing ETS and NIR Monitoring Data
• A division between ETS and non-ETS sectors is needed not only for CO2 emissions, but also for everything to do with energy, because
o from 2013 onwards, for the ETS and non-ETS sectors, different GHG reduction targets for 2020 will be put in place. So it is recommended that national GHG inventories and projections report the division between ETS and non-ETS sectors.
o of the upcoming update ESD Directive 2006/32/EC (energy end-use efficiency and energy services). Since the workshop, the new directive on energy efficiency has been published (Directive 2012/27/EU)
2.2.6 Energy, Denmark
Ole-Kenneth Nielsen, Department of Environmental Science at Aarhus University, gave a presentation about the Danish experience in using EU ETS data for combustion installations. He began with an overview about the previous use of EU ETS data for public power and heat production in the Danish inventory. Since 2006, Denmark has been using data reported under the EU ETS in the Danish GHG inventory. In Denmark, energy statistics and ETS data are perfectly consistent with each other. Mr. Nielsen´s department has full access to the databases from the Danish Energy Agency, so they can simply compare these with energy data that they have for individual plants, which means they can obtain information at the most detailed level currently attainable as well as some background material.
Subsequently, Mr. Nielsen displayed results of a comparison of EFs. Only data from plants which were using emission factors calculated individually were used.
Figure 11shows results of analyses of the consistency of times series with different implied emissions factors (IEF) used for coal combustion under the EU ETS:
Figure 11: Consistency of time series with different implied emissions factors for Danish coal combustion
Mr. Nielsen then identified some challenges, such as the variability of parameters e.g. calorific values or oxidation factors. Furthermore, he gave examples of errors he and his colleagues discovered in the ETS datasets.
91,592,092,593,093,594,094,595,095,596,096,5
23,0 23,5 24,0 24,5 25,0 25,5 26,0NCV, GJ per tonne
CO
2 IE
F, k
g pe
r GJ
CO2 IEF 2009 CO2 IEF 2008 CO2 IEF 2007 CO2 IEF 2006
23

International Workshop – Comparing ETS and NIR Monitoring Data
Finally he spoke about experiences with UNFCCC reviews. After the review of 2009, documentation in the inventory report was increased substantially, and it was ensured that only higher-tier levels were used. For 2010, documentation was also provided that some quality control checks of the data were done, because even though they were based on ETS data, it does not automatically mean that the latter were correct.
Mr. Nielsen ended with the following conclusions:
• Denmark has had good experiences using ETS data for its inventory,
• ETS data are important for achieving consistency with energy statistics,
• the use of ETS data has improved the accuracy of the inventory
• though greater improvements in accuracy rather than in time-series consistency,
• ETS data offer much valuable and detailed information
• but users have to be aware of usage boundaries and should also check the correctness of the ETS data, and
• it is necessary for inventory compilers gain access to data at the most detailed level possible.
2.2.7 Cement Industry, Germany
Volker Handke, IZT, presented results from the DENK project concerning the German cement industry. He began with an overview of the chosen approaches to identify installations and map fuels and materials from the ETS to the German inventory. The results of the data comparison show that 19 ETS fuels and materials could be matched directly to 1.A.2.f cement fuels and materials in the inventory, and 9 ETS fuels and materials could be matched to fuels and materials in the inventory as a whole, though not directly in the CRF context.
Figure 12 gives an overview of the matching results.
Figure 12: Main matching results for the German cement sector
24

International Workshop – Comparing ETS and NIR Monitoring Data
Mr. Handke then displayed the sector and material-specific coverage rates. There are high coverage rates for energy- and process-related emissions. Thus, it can be said that cement installations belong completely under the ETS. The inventory presents the sector completely, but the low coverage rate of hard coal needs further investigation.
Mr. Handke ended with the following conclusions:
• Facility identification by TEHG activity and NACE code is well possible.
• Fuels and materials in the cement industry are highly heterogeneous, with a broad variety of secondary fuels used.
• With coverage rates of 99 % for energy-related emissions and 101 % for process-related emissions,
• Cement facilities are completely part of the ETS, and the German inventory presents the sector completely.
• The low coverage of hard coal needs further in-depth investigation.
2.2.8 Ceramic Industry, Germany
Volker Handke gave a further presentation about DENK project results concerning the ceramic industry. He gives an overview about the chosen approaches to identify the installations, and to map the fuels and materials from the ETS in the inventory. Figure 13 shows the results of the mapping.
Figure 13: Main matching results for the German ceramic sector
Mr. Handke then presented the results of the data comparison and the sector and material-specific coverage rates. Notably, he pointed out that the comparison of ETS and inventory data in the ceramic sector has methodological boundaries. As a result of these boundaries, ETS material cannot relate seriously to 2.A.7 ceramic in the German inventory because:
• UNFCCC (IPCC-GL 1996) has no method for ceramics that is comparable with this material-flow-based approach.
• The process-related emissions in the inventory are counted strictly product-based.
Kt CO2ETS Materials & Fuels in 1.A.2.f
Ceramic632 Natural gas
56 Heavy heating oil31 LP gas 20 Fibre/de-inking residues19 Light heating oil
3 Hard coal3 Residual (solid)
764 99% of ETS CO2 Emission related to1.A.2.f-Ceramic
1.A.2.fCeramic
Inventory
25

International Workshop – Comparing ETS and NIR Monitoring Data
Mr. Handke ended with the following conclusions:
• Facility identification by TEHG activity and NACE codes is well possible.
• With a range of 50 %, coverage of energy-related emissions is moderate, as small ceramic facilities do not fall under the EU ETS.
• With a coverage of 140 %, the process-related emissions in the ETS are higher than in the inventory
o The inventory includes process-related emissions only from the production of bricks.
o Further research is needed to see if other process-related emissions are of relevance. If so, further investigation is needed about the EFs of process-related emissions.
• Considering loam and auxiliary materials like porosity agents in the inventory (differentiated into fossil and biogenic) could be a promising approach.
In summary it can be said that the ceramic sector has great room for improvement
2.2.9 New Gases and Activities
In the last presentation of the workshop, Melanie Degel, IZT, provided an outlook concerning new gases and activities that will be involved in the ETS from 2013 on as well as entailed tasks for inventory compilation in Germany. The general approach is to prepare the German inventory for upcoming challenges of new gases and activities in the ETS, with the main concrete task being identification of CRF codes in the German inventory for the new gases and activities, differentiated between process-related and energy-related emissions.
There are 700 new facilities, of which 500 already participated in the ETS in the first and second trading periods, meaning that 200 new facilities will participate in the third trading period. The focused-on compounds will primary be aluminium (CO2, PFC), nitric acid and adipic acid (N2O), and ammonia (CO2).
Ms. Degel provided an overview of the new participants in the three focused-upon groups (i.e. CO2, N2O and CO2 & PFC), described the CRF categories used in the German inventory for these new participants, and showed in detail the process-related emissions of the focused-upon compounds, as shown in Table 2: Categorisation of New Gases and Activities for 2013 EU ETS
26

International Workshop – Comparing ETS and NIR Monitoring Data
Table 2: Categorisation of New Gases and Activities for 2013 EU ETS
Ms. Degel concluded that, to strengthen the German inventory for the new requirements, the following steps would have to be taken:
• Identification of the related
o CRF categories
o Materials and fuels
• Future relation of ETS facilities to the German inventory by
o NACE codes
o Facility names
• Future relation of ETS materials to the German inventory ones
o Raw materials
o Fuels
o Products
• Differentiation of
o Process-related emissions
o Energy-related emissions
3 Final Discussion The workshop ended with a final discussion that led to the following key conclusions and recommendations:
• It would be a good idea to check implied emission factors by using ETS data.
GHG Participant 2013
CO2
Hydrogen and Synthetic Gas Production (no refinery part) capacity > 25 t/day
Ammonia Production
Non-Ferrous Metals Production and further Processing combustion heat performance > 20 MW
Ferrous metals Production and further Processing of > 20 MW
Organic Basic Chemicals capacity > 100 t/day
SodaAsh Production
Gypsum Production and Products of Gypsum combustion heat performance > 20 MW
SecondaryAluminium Production combustion heat performance > 20 MW
Keramic manufactures Production capacity > 75 t/day
Calcination or Sintering (including Metal ore Pelletization)
Magnesite Production
GHG Physical Vapor
GHG Transportation
GHG Geological Storage
CO2 & N2ONitric Acid Production
Adipic Acid Production
GlyoxylicAcid & Glyoxal Production
CO2 & PFC Primary Aluminium Production
27

International Workshop – Comparing ETS and NIR Monitoring Data
• A differentiation is needed between process emissions and emissions from energy use.
• The confidentiality of data is a problem for some countries, but not for all (for example Denmark).
• A promising method might be using Tier 3 emission factors, especially for fuels which are highly variable.
• A carbon balance should always be included in verification, because it is the best way to get control over carbon dioxide streams.
• Installation operators should be asked for more data or more detailed data.
• Generally, there should be a better access for inventory compilers to the data in every member state.
• There can be also a valuable feedback the other way around, from national inventories to the ETS, when inventory compilers discover errors in ETS data during their work.
• It is also important to achieve consistency between energy balance and ETS data, because the inventory always has to use energy statistics.
• Plant-specific emission factors should be established with the help of ETS data.
To put the final discussion in a compact phrase, the expression
“Use usable data”
could suffice.
28
International Workshop – Comparing ETS and NIR Monitoring Data
4 Conclusions and recommendations of the workshop The following list provides an overview of the most important discussion points and the derived recommendations of the workshop:
1. Allow all inventory compilers access to ETS data!
In some member states (MS), inventory compilers do not have direct access to detailed monitoring data of ETS installations. But it would be helpful (see following points) to grant access to all compilers, so that they can all use usable data.
An efficient way to achieve this could be to give energy statisticians the opportunity to improve their data and also give access to detailed energy data to inventory compilers.
2. Accuracy
Because they are checked and validated, the quality of ETS data might be better than default values in national inventories. If it is assured that the ETS data are from higher tiers and also fit the IPCC requirements, then compilers can use usable data.
3. ETS data might be incorrect
See the presentations of Ole-Kenneth Nielsen and John Watterson on this point. It is possible that even detailed verified ETS data may contain mistakes. Be sure to use only useable data!
4. Process’ vs. ‘Energy’
IPCC forces CRF differentiation between process- and energy-related emissions. In some cases – for example in cement or ceramic sector – ETS data may give hints for this differentiation, but ETS cannot indicate the differentiation between public and industrial energy amounts.
5. Completeness
This is an advantage even for both systems: ETS and national inventories. To obtain knowledge of completeness, it may be useful to compare both datasets plant by plant, sector by sector, fuel type by fuel type and material by material. This is a big effort especially for countries with many facilities like Germany. The approach of Germany of comparing sector by sector and material flow by material flow fits this means of improving completeness. The ETS has some thresholds, such as 20 MW for boilers. Therefore ETS may not contain all facilities.
6. Time series
It might be useful to improve the accuracy of an inventory, but this might also result in inconsistent time series. Decisions then need to be made regarding when higher accuracy is more appropriate than consistency in time. You have to find workarounds for back propagation of the “new” accuracy, which were accepted by the UNFCCC Expert Review Teams.
7. Specific problems
Usually the National Energy Balances doesn´t contain flares. It´s not always easy to identify the flaring in ETS data sets. Sometimes fuel consumption of flares is summarized with other fuel consumption. Furthermore there are some mixed gases reported in ETS whose composition isn’t entirely clear.
8. Realise improvement potential
The potential of ETS data to improve the national inventories and vice versa depends greatly on circumstances. Because of different institutional organisation, collaboration and workflows
29

International Workshop – Comparing ETS and NIR Monitoring Data
between energy statistics, inventory compilers, ETS authority as well as industrial, business and trade associations as data sources, improvement potential can vary from member state to member state. Because of the diversity of the sectors, the complexity of the sectors and emission processes, the fuels and materials used, the tier level used and relevance as an emission source, improvement potential can also vary from sector to sector.
Since feasible improvements vary according to national circumstances and sectors, it is recommended that every member state identify sectors with high improvement potential, taking into account their relevance as emission sources as well as effort required for using ETS data and for overcoming possible constraints. At this point, it could be a good idea for every member state to work out a roadmap of improvements so as to prioritize their actions, trying to ensure efficiency with regard to efforts required for currently achievable improvements. Accordingly, usage of ETS data should likely begin with sectors requiring low effort but with high improvement potential and end with sectors which need greater effort for lower possible improvements.
30

International Workshop – Comparing ETS and NIR Monitoring Data
5 List of the participants of the Workshop
Name Institution e-mail
Anke Herold Öko Institut e.V., Berlin a.herold(a t )oeko.de
Anna-Karin Nyström Swedish EPA, Statistics Sweden anna-karin.nystrom(a t )scb.se
Annett Hohlfeld German Emissions Trading Authority (DEHSt) at the Federal Environment Agency (UBA – Germany), section E 2.3
annett.hohlfeld(a t )uba.de
Annicken Hoel The Climate and Pollution Agency annicken.hoel(a t )klif.no
Christoph Kühleis German Emissions Trading Authority (DEHSt) at the Federal Environment Agency (UBA – Germany), head of section E 2.3
christoph.kuehleis(a t )uba.de
Coralie Jeannot CITEPA (Centre Interprofessionnel Technique d'Etudes de la Pollution Atmosphérique)
coralie.jeannot(a t )citepa.org
David Kuntze Federal Environment Agency (UBA – Germany), section I 2.6 david.kuntze(a t )uba.de
Detlef Langer Müller BBM – Munich detlef.langer(a t )muellerbbm.de
Ioannis Sebos National Technical University of Athens isebos(a t )mail.ntua.gr
Jens Langenfeld Federal Environment Agency (UBA – Germany), section I 2.5 jens.langenfeld(a t )uba.de
John D. Watterson AEA Technology plc john.d.watterson(a t )aeat.co.uk
Jürgen Landgrebe German Emissions Trading Authority (DEHSt) at the Federal Environment Agency (UBA – Germany), head of division E 2
juergen.landgrebe(a t )uba.de
Kari Grönfors Statistics Finland kari.gronfors(a t )stat.fin
Katja Ekroll Jahren The Climate and Pollution Agency katja.ekroll.jahren(a t )klif.no
Kristien Aernouts VITO (Flemish Institute for Technological Research) kristien.aernouts(a t )vito.be
Kristina Juhrich Federal Environment Agency (UBA – Germany), Section I 2.6 kristina.juhrich(a t )uba.de
Lisa Buchner German Emissions Trading Authority (DEHSt) at the Federal Environment Agency (UBA – Germany), section E 2.3
lisa.buchner(a t )uba
Matthias Bender Müller BBM – Munich matthias.bender(a t )muellerbbm.de
Melanie Degel Institute for Futures Studies and Technology Assessment (IZT Berlin) m.degel(a t )izt.de
Michael Strogies Federal Environment Agency (UBA – Germany), head of section I 2.6 michael.strogies(a t )uba.de
Nicolas Toufexis UK Department of Energy & Climate Change nicolas.toufexis(a t )decc.gsi.gov.uk
Ole-Kenneth Nielsen Department of Environmental Science, Aarhus University okn(a t )dmu.dk
Robert Kludt Federal Environment Agency (UBA – Germany), section I 2.6 robert.kludt(a t )uba.de
31

International Workshop – Comparing ETS and NIR Monitoring Data
Name Institution e-mail
Stian Rein Andersen The Climate and Pollution Agency stian.andresen(-a- t-klif.no
Trine Berntzen The Climate and Pollution Agency trine.berntzen(a t )klif.no
Volker Handke Institute for Futures Studies and Technology Assessment (IZT Berlin) v.handke(a t )izt.de
Volker Kathöfer German Emissions Trading Authority (DEHSt) at the Federal Environment Agency (UBA – Germany), section E 2.3
volker.kathoefer(a t )uba.de
Wolfram Jörß Öko Institut e.V. w.joerss(a t )oeko.de
32

International Workshop – Comparing ETS and NIR Monitoring Data
6 References
EC/409/2009 (ESD) Decision no 406/2009/EC of the European Parliament and of the Council of 23 April 2009 on the effort of Member States to reduce their greenhouse gas emissions to meet the Community’s greenhouse gas emission reduction commitments up to 2020 http://eur-lex.europa.eu/LexUriServ/LexUriServ.do?uri=OJ:L:2009:140:0136:0148:EN:PDF
EU/601/2012 (MRR) Commission Regulation (EU) No 601/2012 of 21 June 2012 on the monitoring and reporting of greenhouse gas emissions pursuant to Directive 2003/87/EC of the European Parliament and of the Council http://eur-lex.europa.eu/LexUriServ/LexUriServ.do?uri=OJ:L:2012:181:0030:0104:EN:PDF
EU/525/2013 (MMR) REGULATION (EU) No 525/2013 OF THE EUROPEAN PARLIAMENT AND OF THE COUNCIL of 21 May 2013 on a mechanism for monitoring and reporting greenhouse gas emissions and for reporting other information at national and Union level relevant to climate change and repealing Decision No 280/2004/EC http://eur-lex.europa.eu/LexUriServ/LexUriServ.do?uri=OJ:L:2013:165:0013:0040:EN:PDF
33