internet industry competition dynamics: peering
TRANSCRIPT

Journal of International Technology and Information Management Journal of International Technology and Information Management
Volume 16 Issue 4 Article 5
2007
Internet Industry Competition Dynamics: Peering Limitations, Internet Industry Competition Dynamics: Peering Limitations,
Exposure, and Counter Strategies Exposure, and Counter Strategies
Seungjae Shin Mississippi State University, Meridian
Jack E. Tucci Mississippi State University, Meridian
Follow this and additional works at: https://scholarworks.lib.csusb.edu/jitim
Part of the Business Intelligence Commons, E-Commerce Commons, Management Information
Systems Commons, Management Sciences and Quantitative Methods Commons, Operational Research
Commons, and the Technology and Innovation Commons
Recommended Citation Recommended Citation Shin, Seungjae and Tucci, Jack E. (2007) "Internet Industry Competition Dynamics: Peering Limitations, Exposure, and Counter Strategies," Journal of International Technology and Information Management: Vol. 16 : Iss. 4 , Article 5. Available at: https://scholarworks.lib.csusb.edu/jitim/vol16/iss4/5
This Article is brought to you for free and open access by CSUSB ScholarWorks. It has been accepted for inclusion in Journal of International Technology and Information Management by an authorized editor of CSUSB ScholarWorks. For more information, please contact [email protected].
Internet Industry Competition Dynamics Journal of International Technology and Information Management
61
Internet Industry Competition Dynamics: Peering Limitations, Exposure, and Counter Strategies
Seungjae Shin Jack E. Tucci
Mississippi State University, Meridian
ABSTRACT
The Internet industry is vertically integrated with Internet Backbone Providers (IBPs) and Internet Service Providers (ISPs.) Although there are many ISPs and IBPs in each stream, both markets are considered independent oligopolies in that there are a few dominant competitors in each market. It is generally accepted that the Internet industry structure has evolved into a four-tier hierarchical structure. The synergistic and codependent nature of the Internet industry is the key element in understanding the competitive environment in which both IBP’s and ISP’s cooperate. Peering is an efficient way to exchange traffic freely within the access tier, nevertheless competitive constraints limit within tier exchanges. This paper combines the value chain model, competitive force model and a game model to illustrate the interconnection competitive perspective between IBP and ISPs and demonstrate why peering is difficult in the local access market.
INTRODUCTION
The Internet is a system that makes it possible to send and receive information among all the individual and institutional computers associated with it. It is called a network of networks. As a rough approximation it can be said the Internet infrastructure industry are classified into two categories: Internet Backbone Providers (IBPs) that transfer communications in bulk among network exchange points, and Internet Service Providers (ISPs) that (1) receive communications from individuals or institutions and transfer them to an IBP’s network, and (2) receive communications from IBPs and transfer them to their destination. The number of ISPs increased rapidly from the mid 90’ and the structure of the industry continues to change. It is widely accepted that today’s Internet industry is a vertical structure: over 40 Internet Backbone Providers (IBPs) including 10 top-tier backbones constitute the upstream industry (Kende, 2000) and over 10,000 ISPs for accessing the Internet make up the downstream industry (Weinburg, 2000). A backbone provider service is critical for any ISPs desiring to connect to the Internet. There are manifold interconnections between ISPs and IBPs. Moving data from one interconnection (tier-to-tier, i.e., IBP-to-ISP, IBP-to-IBP, ISP-to-ISP) to another is the catalyst changing the Internet market structure. There are two kinds of interconnection methods among IBPs and ISPs: peering and transit. Peering interconnection is exchanging traffic without a fee and transit interconnection is exchanging traffic with a fee. The only difference among these types is in the financial rights and obligations that they generate to their customers (Weiss & Shin, 2004). Peering in a backbone market occurs between IBPs but in a local access market peering is rare. In this first part of this paper, we survey the dynamic Internet industry from the point of interconnection strategy and analyze it using a competitive force model. In the latter part we analyze an Internet interconnection market using a game theory. In conclusion, this paper presents support for Internet policy makers to review the Internet interconnection policies.
INTERNET INTERCONNECTION STRATEGY
History of Interconnection To understand the relationship between peering and transit, it is necessary to review the situation before the commercialization of the Internet in 1995. During the early development of the Internet, there was only one backbone and only one customer, the military, so interconnection was not an issue. In the 1980s, as the Internet was

S. Shin & J. E. Tucci 2007 Volume 16, Issue 4
62
opened to academic and research institutions, and the National Science Foundation (NSF) funded the NSFNET as an Internet backbone. Around that time, the Federal Internet Exchange (FIX) served as a first point of interconnection between federal and academic networks. At the time that commercial networks began appearing, general commercial activity on the Internet was restricted by Acceptable Use Policy (AUP), which prevented the commercial networks from exchanging traffic with one another using the NSFNET as the backbone (Kende, 2000). In the early 1990s, a number of commercial backbone operators including PSINet, UUNET, and CerfNET established the Commercial Internet Exchange (CIX) for the purpose of interconnecting backbones and exchanging end users’ traffic. The NSF decided to cease to operate the NSF backbone, which was replaced by four Network Access Points (NAPs1) (Minoli & Schmidt, 1999). The role of NAPs is similar to that of CIX. After the advent of CIX and NAPs, commercial backbones developed a system of interconnection known as peering. From the interconnection perspective, NAPs are the place for public peering. Anyone who is a member of a NAP can exchange traffic based on the equal cost sharing. Members pay for their own router to connect to the NAP plus the connectivity fee charged by the NAP. In public peering, there was no discrimination for interconnection among the service providers (no priority given or taken based on usage). As the Internet traffic grew, the NAPs suffered from congestion, because of the enormous traffic loads. Because of the resulting poor performance, private direct interconnections between big IBPs were introduced, thereby creating their own peering points. Private peering at a NAP is different than public peering because of network limitations of the four major exchange points. It is estimated that 80 percent of Internet traffic is exchanged via private peering (Kende, 2000). Two Interconnection Strategies The term “peering” is sometimes used generically to refer to Internet interconnection with no financial settlement, known as a “Sender Keeps All (SKA)” or “Bill and Keep,” which can be thought of as payments or financial transfers between ISPs in return for interconnection and interoperability (Cawley, 1997). Peering can be divided into several categories: (1) according to its openness, it can be private peering or public peering, (2) according to the number of peering partners it can be Bilateral Peering Arrangement (BLPA) or Multilateral Peering Arrangement (MLPA), and (3) according to the market in which it occurs, it can be primary peering in the backbone market or secondary peering in the downstream market (Weiss & Shin, 2004).
A peering arrangement is based on equality, that is, ISPs of equal size generally would peer. The measures of size could be (i) geographic coverage, (ii) network capacity, (iii) traffic volume, (iv) size of customer base, or (v) a position in the market. The ISPs would peer when they perceive equal benefit from peering based on their own subjective terms (Kende, 2000).
ISPs are free to make local peering arrangements with other ISPs. Cremer and Tirole (2000) call this “local secondary peering.” The Pittsburgh Internet Exchange (PITX) is an example of local peering arrangement. Without this local peering, all network traffic passing from one Pittsburgh network to another had to be sent through Washington, D.C., Chicago, or New York City. The sending and receiving networks paid an unnecessary cost for this inefficient handling of data that should have remained local. Participants in this local exchange point reduced their costs and improved performance and reliability for their local Internet traffic with the equal basis of cost recovery. However, this kind of peering was confined to local Internet traffic. Outbound traffic (connected to other networks through an IBP) to other areas still has to depend on the IBP’s transit service. Therefore, ISP’s connection to the IBP is indispensable to the ISP’s business.
Transit is an alternative arrangement between ISPs, in which one pays another to deliver traffic between its customers and the customers of other provider. The relationship of transit arrangement is hierarchical and is a provider-customer relationship. Unlike a peering relationship, a transit provider will route traffic from the transit customer to its peering partners. With transit agreements, usually small, regional IBPs are able to receive and send communications using the facilities of large, national IBPs, and must pay a fee for these services. A concern related to transit is that while small IBPs do not have to pay in the case of peering through NAPs, they must pay a transit fee if they directly connect to one of the large IBPs.
Before the commercialization of the Internet, carriers interconnected without a settlement fee, regardless of their size. However, after the Internet’s commercialization, the large IBPs announced their requirements for a peering
Internet Industry Competition Dynamics Journal of International Technology and Information Management
63
arrangement, and any carrier who could not meet those terms would be required to pay a transit fee in addition to the interconnection costs. An IBP with many transit customers has a better position when negotiating a peering arrangement with other IBPs. De-peering and Four-tier Hierarchical Industry Structure Large internet backbones interconnect by peering, which is a settlement-free interconnection regime. Peering works when the networks have similar scale and scope, which typically results in relatively symmetric traffic flows across the interconnection point. If this traffic is asymmetrical on balance, the larger network typically assumes more of the traffic, hence more of the costs, of a smaller network, and will be discouraged from continuing this relationship. In a circumstance like this, a peering relationship becomes a transit relationship, in which the smaller IBP is required to pay fees to the larger.
From the end of 1990s, a series of IBPs have announced that they were ending peering with many of their previous peering partners and were no longer accepting peering arrangements from other networks whose infrastructure would not allow the exchange of similar levels of traffic access. Instead of peering, they would charge those smaller ISPs for transit. Finally, the large IBPs moved away from public NAPs to private peering or maintained relatively small capacities like T32 in the NAPs and then placed themselves in a new hierarchy, so called top-tier IBPs (Jew & Nicholls, 1999). Most top-tier IBPs are subsidiaries or affiliates of the major facilities-based telecommunication carriers. They don’t need transit service from others and they make peering arrangement with each other. Over 80% of the U.S. backbone traffic is estimated to pass through their systems and switches (Weiss & Shin, 2004). The rest of IBPs, tier-2 IBPs, make peering arrangements among themselves and simultaneously purchase transit services from the top tier IBPs.
There are three cases for which peering is generally refused: (1) Regional IBPs which do not have a national backbone network, (2) content providers or web hosting companies, so called web farms, and (3) new entrant without enough customer base. The main reason for this refusal is a free-rider issue. Peering partners generally exist in a number of geographically dispersed locations. In order to decide where to pass traffic to another, they have adopted what is known as “hot-potato routing,” where an ISP will pass traffic to another backbone at the earliest point of exchange. Under the hot-potato routing rule, someone who does not have a national backbone network must transport its traffic on the others’ backbone networks. In addition to that, asymmetric traffic patterns, which occur in file transfer or web surfing, result in increased capacity costs without commensurate revenues.
Some of the top-tier IBPs recently disclosed their policies for peering but some of them still do not. There is an unwritten rule shared by them about their peering standard. They require coast-to-coast national backbone with a minimum level of bandwidth requirement, a minimum number of presences in the major exchange points, 24/7 staffing of a Network Operation Center (NOC) with highly experienced technical personnel, and a minimum inbound-outbound traffic ratio level, usually around 1:4. It is uncertain what the exact requirements for the private peering are since peering agreements are under non-disclosure. Without a doubt, these requirements could be a significant entry barrier for any new entrant.
The latest peering dispute was between Level 3 and Cogent Communications, two major top-tier backbone providers in 2005. Level 3 broke a peering agreement with Cogent Communications because of asymmetric traffic balance and Cogent’s below cost pricing. Two days after de-peering, the connection was restored with a conditional peering agreement. If Cogent can’t meet the new peering agreement, the agreement specifies a tariff.
PSINet, which was one of the large IBPs, used a peering standard called “open peering policy,” that was different from the top tier IBPs. It would peer with any ISP including local, regional, and national except for companies whose primary business was web hosting or content collection. Some of the top tier IBPs did not want to peer with PSINet, because some of PSINet’s private peering partners are transit customers of the top-tier IBPs. Whenever they upgrade their networks, they upgrade their peering policy. From the tier-2 IBP’s point of view, peering requirements are getting more stringent. Nobody can enter into the top tier group without their approval. This cartel-like behavior has become an important issue in the Internet industry and will eventually become a sticking point with the Federal Trade Commission and the Federal Communications Commission in the future.

S. Shin & J. E. Tucci 2007 Volume 16, Issue 4
After being refused peering in the backbone market many ISPs in the downstream access market often try to peer among themselves in a limited geographic region. This is a major factor in proliferation of local and regional Internet exchange points. Through de-peering in one tier and peering in the lower tier in both markets, the four-tier hierarchical structure has emerged; in the backbone market, tier-1 IBPs with their nationwide backbones interconnect each other and make a core network in the Internet and tier-2 IBPs with their regional backbones interconnect each other and pay tier-1 IBPs for connectivity to the rest of Internet, which means they are customers of tier-1 providers. A few of the large nationwide ISPs are also a member of tier-2 group. In the access market, tier-3 regional ISPs are customers of tier-1 or tier-2 connecting them to the rest of Internet. Local, small ISPs are tier-4 providers and they are customers of higher tier providers. However, the demarcation between the tiers is not clear. As the hierarchy goes up from tier-4 to tier-1, the number of IBPs/ISPs goes smaller and smaller and the overall picture of Internet industry seems like a pyramid. New Approach for Peering To overcome issues of free-rider and asymmetric traffic pattern under the current peering arrangement, new approaches are introduced: (1) Best Exit Routing and (2) Traffic Ratio-Based Peering. The peering burden upon the ISPs’ networks is aggravated by the hot potato routing. The only solution to overcome this scenario is “best exit routing,” which involves imposing responsibility on the web farm to carry the traffic to an exit point closest to the location of the IBP’s customers. To overcome the current free peering problem, a traffic-ratio based paid peering model is emerging. In this approach, peering is free until traffic asymmetry reaches a certain ratio, i.e., 4:1. At this point, the net source of traffic will pay the net sink of traffic a fee based upon traffic flow above this ratio. (Norton, 2001) The next generation Internet using IPv6 will have different characteristics from the current IPv4 Internet (White, et al., 2005). The IPv6 Internet protocol changes could change peering relationships as they have evolved over the last two decades.
COMPETITIVE FORCE ANALYSIS Vertical Industry Structure and Value Chain Generally speaking, the Internet industry has a vertical structure in which upstream IBPs provide an intermediate service and downstream ISPs using this input sell connectivity to their customers. Simplified, we suggest the analogy that the relationship between IBPs and ISPs is very much like that of “wholesalers and retailers.” In reality the Internet is much more complex. The ISPs themselves are networks of users that may directly exchange information among each other and they are interconnected with each other. In addition, the IBPs may provide services directly to users and also may interconnect with other IBPs. In this sense, the Internet is a network of networks that is accessible in many parts of the world. Telecommunications industry, which provides transmission media like fiber optics transmission lines to the Internet industry, is tightly intertwined with the Internet industry. Figure 1 shows the Industry value chain. This industry infrastructure provides the foundation on which most of Internet service providers exist (Chan, 2007). In the following section, we explain ISP market and IBP market and present a competitive analysis of ISP.
Telecom Carrier
Backbone Network
Access Network
Figure 1: Internet Industry Value Chain. Rivalry among Competitors An ISP’s product is public access to the Internet, which includes login authorization, e-mail services, some storage space, and possibly personal web pages. The competition in the Internet access market is very competitive. The ISP’s coverage area is usually determined by the existence of an ISP’s POP3 within the local geographic area
64

Internet Industry Competition Dynamics Journal of International Technology and Information Management
65
measured generally in terms of telephone area codes. ISPs are classified as local, regional, and national according to the scope of their service coverage. The distribution of ISPs is presented in the table 1. Among 307 telephone area codes in U.S., the largest ISP covers 282 area codes and the smallest covers only 1 area code. The ISPs with 1 to 10 area codes constitute 79.81% of the total number of ISPs. This explains that most of ISPs in the downstream market are small, local companies. Some of these small ISPs are subsidiaries or affiliates of CLECs (Competitive Local Exchange Carriers), which are small telephone companies established in the 1990s as a result of telephone industry deregulation.
Table 1: Distribution of ISPs by their coverage (Erickson, 2001).
Telephone area codes covered by ISP Percentage Type 1 35.14% Local
2-10 44.67% Local / Regional 11-24 4.11% Regional 25-282 16.08% National
AOL-Time Warner is a dominant player in the Internet access market. According to Goldman (2005), AOL-Time Warner had 21.7 million subscribers in the 1st Quarter of 2005. One of the most common measure of concentration in an industry is the share of sales by the four largest firms, called the ‘C4’ ratio. Generally speaking, if the C4 ratio is over 60, the market is considered a tight oligopoly and if it is between 40 and 60, the market is considered a loose oligopoly. The C4 ratio of ISP is 43. Compared to the number of ISPs, the national ISPs are highly concentrated. The following table lists the top 10 U.S. ISPs by number of subscribers as of June 2006 (Goldman, 2006).
Table 2. Top 10 U.S. ISPs (Goldman, 2006).
ISP Subscribers Market Share ISP Subscribers Market Share (1) AOL 17.7M 19.1% (6) EarthLink 5.3M 5.7% (2) Comcast 9.3M 10.1% (7) BellSouth 3.3M 3.5%
(3) SBC (AT&T) 7.8M 8.4% (8) Coax 3.0M 3.2% (4) Verizon 6.1M 6.6% (9) United Online 2.6M 2.8% (5) Road Runner 5.6M 6.1% (10) Charter 2.4M 2.6%
The Internet access technologies are roughly divided into two categories: narrow band access using dial-up modem technology and broadband access such as cable-modem, DSL, and wireless broadband access technology. According to Leichtman Research Group (2004), the twenty largest cable and DSL providers in the US account for about 95% of the market in high speed internet access. The top broadband providers now account for over 30.9 million high-speed Internet subscribers, with cable having nearly 18.8 million broadband subscribers, and DSL trailing behind at 12.2 million subscribers. If we confine the access market into the broadband technology, the C4 ratio in this market is 55 which is considered oligarchic. There is a digital divide according to the availability of broadband services. When comparing the U.S. to ROW (rest of world), deployment of broadband Internet access networks in the U.S. has been very slow (Nath & Murthy, 2003; 2004). The following table shows the top 10 broadband access providers in the U.S.
Table 3: Top 10 U.S. Broadband ISPs, 2004 (Lehichman Research Group, 2004).
ISP Subscriber Market Share
ISP Subscriber Market Share
(1) Comcast (Cable) 6.5M 20% (6) Bell South (DSL) 1.9M 6% (2) SBC (DSL) 4.7M 14% (7) Charter (Cable) 1.8M 6% (3) Time Warner (Cable)
3.7M 11% (8) Cablevision (Cable)
1.3M 4%

S. Shin & J. E. Tucci 2007 Volume 16, Issue 4
66
(4) Verizon (DSL) 3.3M 10% (9) Adelphia (Cable) 1.3M 4% (5) Cox (Cable) 2.4M 7% (10) Qwest (DSL) 1.0M 3%
With some simplification, it can be said that the IBPs receive communications in bulk from Point of Presences (POPs) or NAPs and distribute them to other POPs or NAPs close to the destination. To make the Internet a seamless network, the IBPs have multiple POPs with world wide distribution. Most frequently they are located in large urban centers. These POPs are connected to each other with owned or leased optical carrier lines. Typically, these lines are 10 Gbps (OC-192) or 40 Gbps (OC-768) circuits or larger, as defined by the SONET hierarchy, a standard for connecting fiber-optic transmission systems. These POPs and optical carrier lines make up the IBP backbone network. The IBP’s POPs, are also connected with the POPs of many ISPs. The relationship between an ISP’s POP and IBP’s is the same as that of ISPs and IBPs. According to Erickson (2001), the North American backbone market had around 36 IBPs. According to the ISP-Planet.com’s Backbone directory4, the number of IBP for 2006 is 37. Some IBPs have changed their name through merges and acquisitions, but the number of IBPs has remained relatively constant at around 40 since 2000. However, these numbers misinterpret the Internet backbone market structure because this market is also highly concentrated. The C4 ratio of IBP is 51, which is more concentrated than national ISP market. The following table shows the U.S. Internet backbone capacity based on the 20 largest Internet routes.
Table 4: Share of Capacity by IBPs (TeleGeography, 2002).
IBP Share of Capacity IBP Share of Capacity (1) WorldCom 29% (6) Sprint 6% (2) Qwest 8% (7) France Telecom 5% (3) Cogent 7% (8) XO 5% (4) Level 3 7% (9) AT&T 4% (5) Genuity 6% (10) C&W 4%
Bargaining Power of Supplier and Buyer
As we mentioned earlier, the bargaining power of IBP is much greater than that of ISP. Several of the large IBPs are subsidiaries of large telephone companies such as AT&T, Verizon, Sprint, etc. Since these companies own the infrastructure needed for telephone services, they are very favorably positioned to provide the facilities and equipment required by the IBPs. In addition, due to their economies of scale, they are able to offer large volume discount rates or bundling agreements of both telephone and Internet lines for the services they provide. This is possible because the Internet industry is lightly regulated. In particular, there are no regulations with respect to the tariffs that can be charged for the services provided and interconnection method between IBPs, which is only one of business strategies. From these observations it follows that the large IBPs, supported by the large telephone companies, are in a position to capture larger shares of the upstream market. ISPs can exchange traffic through public NAPs but they are congested with a significant amount of traffic. To give a better service to their customers, ISPs have to buy transit services from IBPs. Some of the ISPs buy transit services from multiple IBPs for the purpose of its network reliability.
Buyers of Internet access are Internet users. According to the report from U.S. Department of Commerce (2004), among the 112.6 million households in the U.S. 54.6% connect the Internet at 2003. According to the Downes and Greenstein (2002), the number of counties which have more than 21 ISPs is 1208 out of 3110 counties. Among these 1208 counties 60% are classified as urban area. The Internet users in the urban area have more than 21 choices to select their ISP, which means Internet access buyers have a bargaining power and they easily switch to other ISPs. The following table is the number of ISPs in the market, county of residence and all counties within 30 miles.

Internet Industry Competition Dynamics Journal of International Technology and Information Management
67
Table 5: Number of ISPs in the market (Downes and Greenstein, 2002).
Number of ISPs Number of Counties Percent of Urban Counties 0-5 1130 4.76%
5-10 395 10.26% 11-15 223 10.31% 16-20 153 10.46%
21 or more 1208 59.69%
Threat of New Entrant
The IBP market’s entry barrier is high because there is a large sunk cost for nationwide backbone lines and switching equipment. The number of IBPs for the past three years shows just how high the entry barrier in the backbone market is: 43 (1999), 41(2000), and 36 (2001) (Erickson, 2001). The slight reduction for last three years was caused by mergers and acquisitions, which is common for any maturing industry. According to the number of players, we conclude that the overall backbone market is stable although oligarchic. In addition there are significant economies of scale and the rapid pace of technological change generates a large amount of uncertainty about the future return on investments. It is not easy to enter this market without significant investment in labor, capital, and advanced technology.
There are 9~10 IBPs which make a group of top-tier providers5. They are in the global routing table in the routing hierarchy. These companies make a peering arrangement with each other and they do not need to buy transit service from others. A new entrant with a nationwide backbone can enter into the backbone market, but if it can not make a peering arrangement with these top-tier IBPs, it will need to stay at the second tier level, which is dependent on the top-tier backbone’s inter-connections.
However, the entry barrier in the downstream market is much lower than in the backbone market. The experience of ISPs for the past several years is evidence of a low entry barrier in the downstream market: 1447 (1996), 3640 (1997), 4470 (1998), 5078 (1999), 7463 (2000), and 7288 (2001) (Erickson, 2001). Since subscribers can utilize the Public Switched Telephone Network (PSTN) line, to connect ISPs’ modems and ISPs purchase business telephone lines from a LEC, ISPs for dial-up service do not have to invest in access lines to individual subscribers. They can build POPs to link to the PSTN and other ISPs. Since T1 lines prices and telecom equipment prices are currently dropping quickly, a large number of small ISPs are possible, especially in the less densely populated areas.
Threat of Substitute WiFi (Wireless Fidelity) is a wireless broadband Internet access method. Because it uses an unlicensed spectrum and its service area can be expanded spot-by-spot, the entry barrier is relatively low. Therefore, it is possible for WiFi to have a community based free service or revenue sharing between infrastructure providers and location owners. T-mobile USA, is the fourth largest wireless carrier6 in the U.S., and it provides wireless Hot-Spots using IEEE 802.11b technology. T-mobile USA has more than 6,700 Hot-Spots including major airports. Another WiFi provider, Wayport, has 12,000 Hop-Spots including 6,300 McDonlad’s7. WiFi’s price is $30 per month with a one year subscription. Even though there is a service coverage limitation, 300 feet of radius, crowded public places, such as airports, hotel, coffee shop, etc, are a target area. The market share of WiFi is relatively small compared to those of wired ISPs. But in a near future, WiFi based Wireless ISP could be a big threat to the wired ISPs. In the backbone market, there is no big threat. A satellite based Internet backbone market is relatively very small and the combination of satellite backbone and WiFi access focuses on rural, remote area or a small niche segment such as train, maritime, and airplane.
The following figure summarizes the above analysis. Considering the external environment of Internet industry, downstream Internet access market is much more competitive and upstream Internet backbone market has much more market power.

S. Shin & J. E. Tucci 2007 Volume 16, Issue 4
HHiigghh BBaarrggaaiinniinngg PPoowweerr ooff UUsseerrss
Very High Competition Among ISPs
Low Entry
Barrier
Threat of WiFi
HHiigghh BBaarrggaaiinniinngg PPoowweerr ooff TTeelleeccoomm CCaarrrriieerrss
Low Competition Among IBPs
High Entry
Barrier
Low Threat of
Substitute
High Bargaining Power of IBPs
Low Bargaining
Power of ISPs
Internet Industry
Backbone Access
Figure 2: Competitive Analysis of ISPs.
INTERNET INTERCONNECTION GAME MODEL
ISPs/IBPs are competitors and cooperators simultaneously: competitors for market share and cooperators for global connectivity. One ISP/IBP’s decision has an influence on other ISP/IBP’s decisions. Thus, they have a strong dependence on each beyond just competitive factors. From the ISPs’ point of view, IBPs’ interconnection services are critical to the ISPs’ business. These characteristics make the Internet provision industry suitable for game theoretic analysis. Because we focus on the interconnection between IBP and ISPs, we only consider IBP’s revenue and ISP’s cost, which originate from interconnection and we ignore customers in the market and the other parts of revenue and cost. Model components Based on the Internet industry structure and interconnection type, we build an Internet interconnection game model. In our model there are three players in the interconnection market: one regional IBP (tier-2) and two local ISPs (tier-3/4). Because T1 transit line is a major service product in the local Internet interconnection market, we assume that the IBP sells a T1 transit service to the ISPs in this market. The IBP is a regional IBP and two ISPs are local ISPs. We assume that the size of ISP1 and ISP2 is the same and they need the same number of T1 transit lines from the IBP. If the two ISPs can make a peering arrangement to exchange local traffic freely and they can reduce the number of T1 transit lines half for their outgoing traffic to the Internet. The following figure shows the transit and peering interconnection between IBP and ISPs.
Figure 3: Transit and Peering Interconnection.
68
Internet Industry Competition Dynamics Journal of International Technology and Information Management
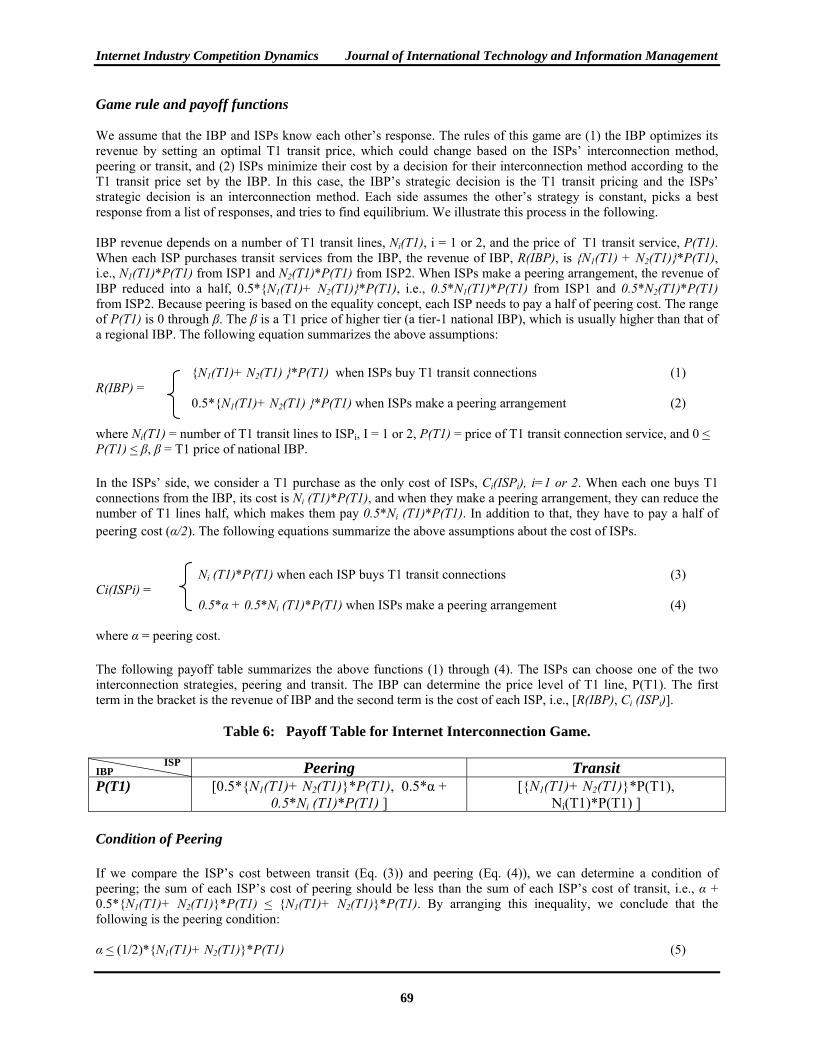
Game rule and payoff functions We assume that the IBP and ISPs know each other’s response. The rules of this game are (1) the IBP optimizes its revenue by setting an optimal T1 transit price, which could change based on the ISPs’ interconnection method, peering or transit, and (2) ISPs minimize their cost by a decision for their interconnection method according to the T1 transit price set by the IBP. In this case, the IBP’s strategic decision is the T1 transit pricing and the ISPs’ strategic decision is an interconnection method. Each side assumes the other’s strategy is constant, picks a best response from a list of responses, and tries to find equilibrium. We illustrate this process in the following.
IBP revenue depends on a number of T1 transit lines, Ni(T1), i = 1 or 2, and the price of T1 transit service, P(T1). When each ISP purchases transit services from the IBP, the revenue of IBP, R(IBP), is {N1(T1) + N2(T1)}*P(T1), i.e., N1(T1)*P(T1) from ISP1 and N2(T1)*P(T1) from ISP2. When ISPs make a peering arrangement, the revenue of IBP reduced into a half, 0.5*{N1(T1)+ N2(T1)}*P(T1), i.e., 0.5*N1(T1)*P(T1) from ISP1 and 0.5*N2(T1)*P(T1) from ISP2. Because peering is based on the equality concept, each ISP needs to pay a half of peering cost. The range of P(T1) is 0 through β. The β is a T1 price of higher tier (a tier-1 national IBP), which is usually higher than that of a regional IBP. The following equation summarizes the above assumptions:
{N1(T1)+ N2(T1) }*P(T1) when ISPs buy T1 transit connections (1)
69
R(IBP) = 0.5*{N1(T1)+ N2(T1) }*P(T1) when ISPs make a peering arrangement (2)
where Ni(T1) = number of T1 transit lines to ISPi, I = 1 or 2, P(T1) = price of T1 transit connection service, and 0 < P(T1) < β, β = T1 price of national IBP.
In the ISPs’ side, we consider a T1 purchase as the only cost of ISPs, Ci(ISPi), i=1 or 2. When each one buys T1 connections from the IBP, its cost is Ni (T1)*P(T1), and when they make a peering arrangement, they can reduce the number of T1 lines half, which makes them pay 0.5*Ni (T1)*P(T1). In addition to that, they have to pay a half of peering cost (α/2). The following equations summarize the above assumptions about the cost of ISPs.
Ni (T1)*P(T1) when each ISP buys T1 transit connections (3) Ci(ISPi) =
0.5*α + 0.5*Ni (T1)*P(T1) when ISPs make a peering arrangement (4) where α = peering cost. The following payoff table summarizes the above functions (1) through (4). The ISPs can choose one of the two interconnection strategies, peering and transit. The IBP can determine the price level of T1 line, P(T1). The first term in the bracket is the revenue of IBP and the second term is the cost of each ISP, i.e., [R(IBP), Ci (ISPi)].
Table 6: Payoff Table for Internet Interconnection Game.
IBP ISP Peering Transit P(T1) [0.5*{N1(T1)+ N2(T1)}*P(T1), 0.5*α +
0.5*Ni (T1)*P(T1) ] [{N1(T1)+ N2(T1)}*P(T1),
Ni(T1)*P(T1) ] Condition of Peering If we compare the ISP’s cost between transit (Eq. (3)) and peering (Eq. (4)), we can determine a condition of peering; the sum of each ISP’s cost of peering should be less than the sum of each ISP’s cost of transit, i.e., α + 0.5*{N1(T1)+ N2(T1)}*P(T1) < {N1(T1)+ N2(T1)}*P(T1). By arranging this inequality, we conclude that the following is the peering condition: α < (1/2)*{N1(T1)+ N2(T1)}*P(T1) (5)

S. Shin & J. E. Tucci 2007 Volume 16, Issue 4
Equilibrium Analysis The following graph shows ISPs’ best response between transit and peering according to the peering condition when α = $20,0008. The X-axis represents the number of T1 lines and the Y-axis represents the annual price of T1 line. We assume that β is $12,000/year (= $1000/month * 12 months), which means that the price range of a T1 transit line is from $0 to $12,000 per year. In this graph, we can see that (1) when the number of T1 lines is one, ISP’s best response is transit regardless of the price of T1, and (2) when the number of T1 lines are greater than one, an ISP’s best response depends on the price of T1, i.e., as the price of T1 increases or the number of T1 lines increases, ISP’s best response turns from transit to peering.
$0
$2,000
$4,000
$6,000
$8,000
$10,000
$12,000
1 2 3 4 5 6 7
N(T1)
P(T
1) TransitPeering
Figure 4: ISP’s Best Response of Interconnection, Peering or Transit.
Based on the best response of ISPs (peering or transit), the following graph illustrates the ISP’s best response cost.
12,0
00
10,0
00
8,00
0
6,00
0
4,00
0
2,00
0
1
50
10000
20000
30000
40000
50000
60000
Cost
P(T1)
N(T1)
Figure 5: ISP’s Best Response Cost based on the its Interconnection Strategy. On the other hand, IBP’s best response is always P*(T1) = $12,000, whether each ISP chooses transit or peering because the higher price of T1 guarantees higher IBP’s revenue. The following graphs shows IBPs’ revenue with $12,000 of the T1 price when each ISP selects transit or peering for data handling.
70

Internet Industry Competition Dynamics Journal of International Technology and Information Management
$0$20,000$40,000$60,000$80,000
$100,000$120,000$140,000$160,000$180,000
1 2 3 4 5 6 7
N(T1)
IBP'
s R
even
ue
PeeringTransit
Figure 6: IBP’s Annual Revenue with P(T1) = $12,000.
The following table displays the payoff when N(T1) = 1. The dominant strategy for an IBP should be P(T1) = $12,000, which yields higher revenues than any other pricing. The dominant strategy for the ISPs is transit, which gives a lower cost than peering. Thus, [$24,000, $12,000] is equilibrium for ISPs and IBP and its equilibrium strategy set is {$12,000, transit}.Thus, this result shows that even if peering is an efficient interconnection method, it is hard to make a peering arrangement for the small ISP with little traffic and a limited number of subscribers, i.e., a small ISP with one T1 line is enough to support its customers and in that case, transit is the best option for small ISPs.
Table 7: Payoff Table for Internet Interconnection Game at Equilibrium with N(T1) = 1.
IBP ISP Peering Transit
P(T1) = $12,000 [$12,000*, $16,000] [$24,000, $12,000*]P(T1) = $11,000 [$11,000, $15,500] [$22,000, $11,000*] P(T1) = $10,000 [$10,000, $15,000] [$20,000, $10,000*] P(T1) = $9,000 [$9,000, $14,500] [$18,000, $9,000*] P(T1) = $8,000 [$8,000, $14,000] [$16,000, $8,000*] P(T1) = $7,000 [$7,000, $13,500] [$14,000, $7,000*] P(T1) = $6,000 [$6,000, $13,000] [$12,000, $6,000*] P(T1) = $5,000 [$5,000, $12,500] [$10,000, $5,000*] P(T1) = $4,000 [$4,000, $12,000] [$8,000, $4,000*] P(T1) = $3,000 [$3,000, $11,500] [$6,000, $3,000*] P(T1) = $2,000 [$2,000, $11,000] [$4,000, $2,000*] P(T1) = $1000 [$1,000, $10,500] [$2,000, $1,000*]
Generalized Peering Condition If we extend this model with n ISPs, the sum of n ISP’s cost of peering should be less than the sum of n ISP’s cost of transit, i.e., α + (1/n)*∑Ni(T1)*P(T1) < ∑Ni(T1) *P(T1). By arranging this inequality, a new peering condition is: α < {(n-1)/n}* ∑Ni(T1) *P(T1) (6)
71
S. Shin & J. E. Tucci 2007 Volume 16, Issue 4
72
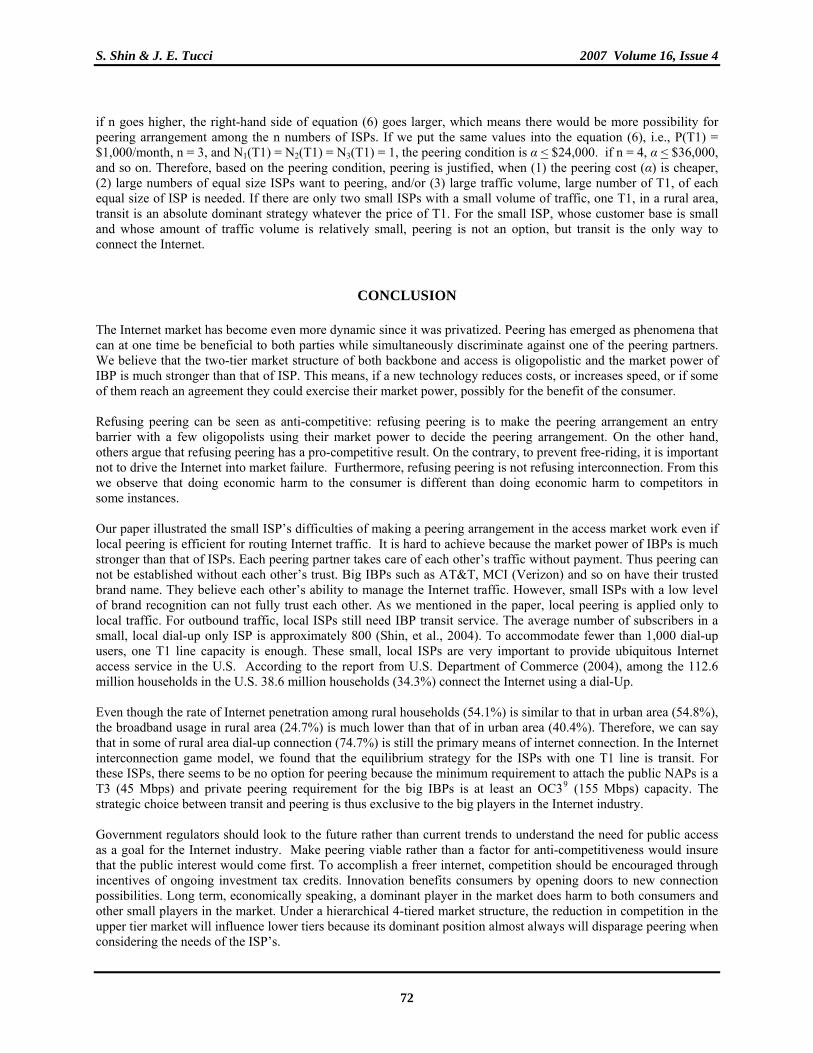
if n goes higher, the right-hand side of equation (6) goes larger, which means there would be more possibility for peering arrangement among the n numbers of ISPs. If we put the same values into the equation (6), i.e., P(T1) = $1,000/month, n = 3, and N1(T1) = N2(T1) = N3(T1) = 1, the peering condition is α < $24,000. if n = 4, α < $36,000, and so on. Therefore, based on the peering condition, peering is justified, when (1) the peering cost (α) is cheaper, (2) large numbers of equal size ISPs want to peering, and/or (3) large traffic volume, large number of T1, of each equal size of ISP is needed. If there are only two small ISPs with a small volume of traffic, one T1, in a rural area, transit is an absolute dominant strategy whatever the price of T1. For the small ISP, whose customer base is small and whose amount of traffic volume is relatively small, peering is not an option, but transit is the only way to connect the Internet.
CONCLUSION
The Internet market has become even more dynamic since it was privatized. Peering has emerged as phenomena that can at one time be beneficial to both parties while simultaneously discriminate against one of the peering partners. We believe that the two-tier market structure of both backbone and access is oligopolistic and the market power of IBP is much stronger than that of ISP. This means, if a new technology reduces costs, or increases speed, or if some of them reach an agreement they could exercise their market power, possibly for the benefit of the consumer.
Refusing peering can be seen as anti-competitive: refusing peering is to make the peering arrangement an entry barrier with a few oligopolists using their market power to decide the peering arrangement. On the other hand, others argue that refusing peering has a pro-competitive result. On the contrary, to prevent free-riding, it is important not to drive the Internet into market failure. Furthermore, refusing peering is not refusing interconnection. From this we observe that doing economic harm to the consumer is different than doing economic harm to competitors in some instances.
Our paper illustrated the small ISP’s difficulties of making a peering arrangement in the access market work even if local peering is efficient for routing Internet traffic. It is hard to achieve because the market power of IBPs is much stronger than that of ISPs. Each peering partner takes care of each other’s traffic without payment. Thus peering can not be established without each other’s trust. Big IBPs such as AT&T, MCI (Verizon) and so on have their trusted brand name. They believe each other’s ability to manage the Internet traffic. However, small ISPs with a low level of brand recognition can not fully trust each other. As we mentioned in the paper, local peering is applied only to local traffic. For outbound traffic, local ISPs still need IBP transit service. The average number of subscribers in a small, local dial-up only ISP is approximately 800 (Shin, et al., 2004). To accommodate fewer than 1,000 dial-up users, one T1 line capacity is enough. These small, local ISPs are very important to provide ubiquitous Internet access service in the U.S. According to the report from U.S. Department of Commerce (2004), among the 112.6 million households in the U.S. 38.6 million households (34.3%) connect the Internet using a dial-Up. Even though the rate of Internet penetration among rural households (54.1%) is similar to that in urban area (54.8%), the broadband usage in rural area (24.7%) is much lower than that of in urban area (40.4%). Therefore, we can say that in some of rural area dial-up connection (74.7%) is still the primary means of internet connection. In the Internet interconnection game model, we found that the equilibrium strategy for the ISPs with one T1 line is transit. For these ISPs, there seems to be no option for peering because the minimum requirement to attach the public NAPs is a T3 (45 Mbps) and private peering requirement for the big IBPs is at least an OC39 (155 Mbps) capacity. The strategic choice between transit and peering is thus exclusive to the big players in the Internet industry.
Government regulators should look to the future rather than current trends to understand the need for public access as a goal for the Internet industry. Make peering viable rather than a factor for anti-competitiveness would insure that the public interest would come first. To accomplish a freer internet, competition should be encouraged through incentives of ongoing investment tax credits. Innovation benefits consumers by opening doors to new connection possibilities. Long term, economically speaking, a dominant player in the market does harm to both consumers and other small players in the market. Under a hierarchical 4-tiered market structure, the reduction in competition in the upper tier market will influence lower tiers because its dominant position almost always will disparage peering when considering the needs of the ISP’s.

Internet Industry Competition Dynamics Journal of International Technology and Information Management
73
REFERENCES
Cawley, R.A. (1997). Interconnection, pricing, and settlements: Some healthy jostling in the growth of the Internet, 346-76, in Kahin, B. & Keller, J.(Eds), Coordinating the Internet. Boston: MIT Press.
Chan, J.O., (2007). A Predictive Analytic Model for Value Chain Management, Journal of International Technology
and Information Management, 16(1), 31-42. Cremer, J., Rey, P., & Tiroel, J. (2000). Connectivity in the Commercial Internet, The Journal of Industrial
Economics, 40(8), 433-472. Downes T. & Greenstein, S. (2002). Universal access and local internet markets in the US, Research Policy 31,
1035-1052. Erickson, T. (2001). Introduction to the Directory of Internet Service Providers 13th Edition, Boardwatch Magazine.
http://www.ispworld.com/isp. Goldman, A. (2005). Top 22 U.S. ISPs by Subscriber: Q1 2005, ISP-Planet magazine. http://www.isp-
planet.com/research/ranking/usa.html. Jew, B. & Nicholls, R. (1999). Internet Connectivity: Open Competition In the Face of Commercial Expansion, in
Proceeding of Pacific Telecommunications Conference, Honolulu HI. Kende, M. (2000). The Digital Handshake: Connecting Internet Backbones, FCC-OPP Working Paper No. 32,
http://www.fcc.gov/Bureaus/OPP/working_papers/oppwp32.pdf. Lehichman Research Group (2004). Research Notes: Actionable Research on the Adoption and Impact of
Broadband Media, http://www.leichtmanresearch.com/research/notes03_2005.pdf. McCarthy, B. (2000). Introduction to the Directory of Internet Service Providers 12th Edition, Boardwatch,
Magazine. Available http://www.ispworld.com/isp. Minoli, D. & Schmidt, A. (1999). Internet Architectures, New York: Wiley. Nath R. & Murthy,N.R. V. (2003). An Examination of the Relationship between Digital Divide and Economic
Freedom: An International Perspective, Journal of International Technology and Information Management, 12(1), 15-24.
Nath R. & Murthy, N. R. V. (2004). A Study of the Relationship between Internet Diffusion and Culture, Journal
of International Technology and Information Management, 13(2), 123-132. Norton, W. B. (2001). Internet Service Providers and Peering, draft version 2.5,
http://www.equinix.com/pdf/whitepapers/PeeringWP.2.pdf. Shin, S., Weiss, M., & Correa, H. (2004). A Progressive Analysis of Internet Market: from best effort to quality of
service, Telecommunications Policy, 28(5-6), 363-89. TeleGeography (2002). WorldCom Controls the Most Internet Bandwidth, Connections, and Revenue, Available
http://www.telegeography.com/press/releases/2002-07-10.php. U.S. Department of Commerce, (2004). A Nation Online: Entering the Broadband Age, Available
http://www.ntia.doc.gov/reports/anol/NationOnlineBroadband04.pdf. Weinberg, N. (2000). Backbone Bullies, Forbes, June 12 Edition, 236-37.

S. Shin & J. E. Tucci 2007 Volume 16, Issue 4
74
Weiss, M., & Shin, S. (2004). Internet interconnection economic model and its analysis: Peering and settlement, Netnomics, 6, 43-57.
White, G.L., Shah, J. R. & Cook, J. R. (2005). Internet Technology in2010: The Issue of IPv6 Adoption in the
U.S.A., Journal of International Technology and Information Management, 14(3), 55-66.
1 Four NAPs are Chicago NAP (Ameritech), San Francisco NAP (Pacific Bell), New York NAP (Sprint), and
Washington D.C. NAP (Metropolitan Fiber Systems). 2 A carrier of 45 Mbps bandwidth. One T3 channel can carry 28 T1 channels. 3 The function of the POP is to interconnect networks so that now any site where networks interconnect may be
referred to as a POP. 4 http://www.isp-planet.com/resources/backbones/index.html. 5 AOL Transit Data Network (ATDN), AT&T , Cogent, T Global Crossing (GX), Level 3, Verizon Business , Nippon
Telegraph and Telephone (NTT) , Qwest , SAVVIS , Sprint Nextel Corporation. 6 Cingular (AT&T Wireless), Verizon, Sprint/Nextel are the other three. 7 http://www.wifinetnews.com. 8 ISPs need at least one distribution layer router ($10,000) to connect both access routers, and they need a T1 line to
connect each other plus one-year co-location fee ($10,000). 9 Short for Optical Carrier, used to specify speed of fiber optic network.