internet initiative japan inc. - iij.ad.jp · cloud compiting service ”iij gio” monthly...
TRANSCRIPT

Internet Initiative Japan Inc.
Bank of America Merrill LynchBank of America Merrill LynchJapan Conference 2011
September 13-14, 2011
http://www.iij.ad.jp/en/IR
TSE1:3774 NASDAQ:IIJI

Key Investment HighlightsKey Investment Highlights
1 Top IP Engineering Company in Japan1 Top IP Engineering Company in Japan
Target Blue-chip and Governmental Organizations2
Target Blue chip and Governmental Organizations in Japan with dominant position
3Best Positioned in the Growing Outsourcing & Cloud Computing Market in Japan
4Stable revenue growth from the accumulating recurring revenuerecurring revenue
5 Solid Growth Strategy5 Solid Growth Strategydetails to follow

TOP IP Engineering Company in Japan
The first established full-scale ISP in Japan A group of highly motivated and skilled TOP Level IP Engineers Pioneer of Network Technologies in Japan
In-housed development Operate one of the largest Internet Backbone in Japan Operate one of the largest Internet Backbone in Japan Fully develop its service and back office facilities
• Internet Connectivity & Firewall Service, IP Multicast Delivery Service, IPv6 Service• NetBSD based Router Product Development (SEIL Series)
“IIJ” brand among the Japanese IT marketWell known for its high engineering skills and network support skillsHigh customer Satisfaction with long term relationshipg g pAround 6,500 clients, mainly governmental and large enterprise
At the leading edge of IP R&D IPv6 Mobile IPv6(MIPv6) NetBSD
Company Profile (as of June 2011)
E t bli h d D b 1992 IPv6, Mobile IPv6(MIPv6), NetBSD Distributed and Parallel Processing Platform
for very large data sets Participation in world-wide research
Established December 1992
Number of Employees
Consolidated: 1,953(approx 70% engineers)
Listed Markets NASDAQ(IIJI), TSE1(3774)
3
p Board Member of “Telecom-ISAC Japan” Large
Shareholders(as of March 2011)
NTT(24.4%), Koichi Suzuki(6.3%), Itochu Corp.(5.1%), NTTCom(4.9%)

Entrepreneur of Network TechnologiesBusiness and Service Development to Initiate the Market The first full-scale ISP in Japan FX
P to PLarge Volume
DataDistribution
SystemOperation
Systems
ApplicationDevelopment IPTV
Platform
CloudComputing“IIJ GIO”
In-housed development At leading edge of IP R&D IP Specialists Smart
Mobile
InternetVPNManaged
Ser ice
RFID
Distribution
DCiBPS
Integration
GDXPlatform
LaIT
WebGateway
M to M
InternetLAN
IP Multicast
SMF
Anti-spamSolution
Service
CDN
SEIL
Asia
ISPin U.S. hi-ho
C
WideLAN
IIJMobile
DDoS
Gateway
MVNE
GlobalWAN
Dial-upservice
IPv6FirewallService
Asia Backbone
SLAIX
ConsumerISP
IIJ4U
IIJmioHope Page
Service
1995 19961992“IIJ Group” 1997 1998 2004 2006 2007 2008
Web HostingService
2010
4

Strategic Shift in Business ModelFrom “ISP” to “Total Network Solution Provider”
(Revenue, JPY million) EMERGECloud
80,000
90,000 Internet Connectivity Services
Outsourcing Service
Systems OperationListed on
TSE
Cloud ComputingENDURE
Tough economic situationWAN Service
Recurring revenue
60,000
70,000Systems Construction
y p
BLOOMHarvesting the
TSEOne-time revenue
40,000
50,000
TransitionChange in Business
Total Network Solution Provider
Harvesting the flower ofNASDAQ
IPO
WAN
20,000
30,000Business
Model
BirthEarned its
WAN Business (M&A)
0
10,000
FY94 FY95 FY96 FY97 FY98 FY99 FY00 FY01 FY02 FY03 FY04 FY05 FY06 FY07 FY08 FY09 FY10
enduring Client Base
Japanese economy at
bottom
Rapid Economic Recovery
Sudden down turn
in economy
5
Merger of corporate ISPs
Heavy Price Competition
CWC filed for corporate
reorganization
Rise in needs for Cloud
/Outsourcing
Increase in number of ISPs

Recurring Business ModelCross Selling of Total Network Solutions
• Network-related IntegrationSite to Site Network Construction•Dedicated Line Connectivity
• Application-related DevelopmentOn-line Security SystemSite-to-Site Network Construction
Content Delivery PlatformEmail System for ISPs etc.
Dedicated Line ConnectivityIP Service (64kbps to over Gbps) etc.
•Broadband ConnectivityOptical FiberADSL
•Mobile Connectivity (IIJ Mobile)
On-line Security SystemTicketing SystemOn-line Shopping System etc.
Internet Systems
Construction
•Mobile Connectivity (IIJ Mobile)3G/DSDPA
& WANConnectivity Service
Over 6,500Outsourcing &
SystemsOperation
,Client Base
Operation
•Network RelatedManaged Router ServiceSMF-VPN SolutionIIJ I t t LAN S i t
•Security RelatedManaged Firewall Service
•Server RelatedWeb Hosting Service
•Data Center RelatedFacility Management
6
IIJ Internet-LAN Service etc. Managed Firewall ServiceURL Filtering ServiceDDoS Solution etc.
gEmail ServiceDNS ServiceFile Exchange Service etc.
y gOperation etc.
•Customer Support•IIJ GIO (Cloud Service)

Excellent Blue-chip Client Base
Top Tiers Enduring Relationship with leading companies
ElectronicElectronic Information/Information/
10/10 10/10PrecisionPrecision
10/10ElectronicElectronicappliancesappliances
Information/Information/telecommunicationstelecommunications
PrecisionPrecisionEquipmentEquipment
8/109/10 9/10
InsuranceInsurance
8/10
BanksBanks
9/10SecuritiesSecurities
9/10
MachineryMachinery
9/10WholesaleWholesale
9/10
ConstructionConstruction
8/10
Ministry of
The YomiuriShimbun
Imperial Household
• The number of contracts we have among 10 major companieslisted by annual consolidated revenue in each industry.
Ministry ofEnvironment
st y oJustice
pAgency
National PoliceAgency
7
listed by annual consolidated revenue in each industry. • Revenue data based on Toyo Keizai Shimpo “Kaisha Shikiho,” and
Nihon Keizai Shimbun “Nikkei Industry Map”
and more…

Broad Client BaseRevenue Distribution by
IndustryRevenue Distribution by
Clients
21.3%6%
5% 2%Construction
2%
Government/ Public sector
Top 501-21%
Retail
5%
3.4%
32%
12%
Communication/ITMachinery/
Manufacturing
Public sector
6%
Top 401-500 4% 51% of revenue3.4%
4.8%
32%
Financial
12%4%
Top 301-400 5%
Top 1-100 Clients
from
7.2%15%
Media/Service
28%
sector
15% Top 201-3007%
12.2%28%
Source: IIJ’s consolidated data for FY2010Source: IIJ’s consolidated data for FY2010
•Not dependent on specific industry
Top 101-20012%
8
Not dependent on specific industry•Financial sector increased with the M&A of IIJ Global
•Not dependent on specific company

Business Developments

Customer Retention Strategy
(JPY million)Revenues by Customer
Increase revenueper customer
Provide high quality/reliable
Cross Selling of Services
g q ytotal network solution
Introduce new services
Increase recurring revenues for Stable revenues and profit growth
Number of Customers( 6 500)
Stable revenues and profit growth
(~6,500)
• Rise in demands from Outsourcing/Cloud Computing
10
Rise in demands from Outsourcing/Cloud Computing• IT spending is indispensable in the mid/long term

Increasing IIJ Business Opportunities in Cloud Computing(1)Systems Integrators
Operates customer systems t i i
monitor
Each systems built exclusively for each individual customer
on one outsourcing service platform IIJ Outsourcing
monitor
C C S
・SAP Servers・Web Servers・DB Servers etc
Cloud is like outsourcing but more evolved with more flexibility
FY2010: Cloud Computing Start-up Year
Some of the systems built exclusively for each customer
ill b t d t Cl dDB Servers etc・IIJ GIO/Component・IIJ GIO/Hosting Package
will be outsourced to Cloud servicesExpected Cloud Market Size
Billion Yen YoY %
IIJ is Best Positioned ・Holds one of the largest
FY2011- Spread of Cloud Computing
150
200
250Billion Yen YoY %
Holds one of the largest backbone network necessary for cloud use・Experience in outsourcing services of over 10 years
50
100
11
Positioned for the coming cloud computing market
services of over 10 years・Customer base of 6,500 clients
(Source: IDC)
Increasing IIJ Business Opportunities in Cloud Computing(2)
IIJ GIO monthly revenue for June 2011: over JPY180 million
Cloud compiting service ”IIJ GIO” Monthly revenues and project numbers of IIJ GIO
600
700
180
200
projectprojectJYP millionJYP million
millionComponents (customized cloud. Revenue recognized in SI operation and maintenance), Hosting package ( packaged cloud. Revenue recognized in outsourcing services)Number of projects as of June 2011: approx 600 projects
400
500
100
120
140
160
Number of Projects
- Introduced to all different industries. IIJ GIO is now introduced to Web-based systems, internal information systems and operational systems.
- Several large usages by Social Application Providers (SAP)Revenue for FY2010 : approx JPY0.6 billionR t t f FY2011 JPY3 0 billi 100
200
300
40
60
80
Monthly Revenues
Revenue target for FY2011: over JPY3.0 billion
Matsue Data Center Park
Opened the first container type data center using outside air cooling in Japan (April 2011)
00
20
September
30, 2010
December
31, 2010
March 31,
2011
June 30,
2011
It can expand its facilities in a shorter period of time with less investments compared to building type DCEfficient power usage. Reduces CO2 emission
Matsue Data Center Parkg g p ( p )
Facilities IT Modules IT Modules : Max. 24, Racks : Max. 216
Electric power equipment
Power capacity2,000 kVATwo power lines, each from a different substation
Emergency power generator Cold-start diesel generator
12
Fire equipment Advanced fire detection system / N2 gas fire extinguishing equipment
SecurityIntruder detection, surveillance cameras, and access management system.24-hour on-site monitoring personnel

Enhancing business scope by AT&T Japan M&A<Outline of Acquisition>
・Acquired mainly the domestic network outsourcing service business such as WAN
< IIJ Global Solutions Area of Expertise>
・ 1,600 blue-chip corporate clients such as in financial or manufacturing industries
from AT&T Japan
・Acquisition completed on Sep 1, 2010
・Successfully completed acquisition of 1,600 clients and approx 240 personnel
g
- For example, closed network for mega banks and large scale site-to site network system
・ Especially strong in providing WAN services
-Long experience in providing network services to blue-chipclients and approx 240 personnel
・Purchase price: JPY9.2 billion (mainly short-term bank borrowings)
Long experience in providing network services to blue chip clients
- Carrier free network integration
-Business tie-ups with AT&T and other foreign carriers to provide global services
< Effects to FY10 Consolidated Financial Results>・Strong Sales Force and business tie ups with IBM for sales activities
< Effects to FY10 Consolidated Financial Results>
<Future business developments and synergies>
(B/S) *As of March 31, 2011Current AssetsNoncurrent Assets
Intangible Assets
JPY11,021 millionJPY8,922 millionJPY5 763 million
・Full year contribution for FY2011 results
*1Q11 Revenue: JPY6.5 billion, Operating Income: JPY0.4 billion (on track)
・Started IIJ & IIJ-GS sales cooperation. Already
Intangible AssetsCurrent LiabilitiesNoncurrent Liabilities
JPY5,763 million
JPY8,198 millionJPY1,937 million
(P/L) *7 months from Sep 2010 to March 2011 Started IIJ & IIJ GS sales cooperation. Already acquired cross selling contracts
・Strengthen Global Network Outsourcing Service from March 2011 in Asia and European countries for Japanese customers working abroad
Revenues Costs SG&A/R&D Operating Income
JPY15,094 millionJPY12,137 millionJPY1,767 millionJPY1,190 million
13
Japanese customers working abroad
・To further enhance group synergy and reduce costs and expenses, moved to the same building as IIJ.
Operating Margin Ratio-Amortization of
Customer relationship
7.9%
JPY255 million
ATM Operation Business Developments
< ATM Operation Business Results >・FY2010 Revenue: JPY0.5 billion,
< Number of ATMs >
・FY08: Completed field test in Kanto AreaOperating loss: JPY0.6 billion
・Number of ATM places as of August 12, 2011: 320 ATMs
*Th l t d f ATM d d i M
FY08: Completed field test in Kanto Area(10 ATMs)
・FY09: Begun placing ATMs in Kanto and Kansai Region
FY10 B l i ATM i f 2H10*The placement speed of ATMs were down during May and June affected by the March 11 earthquake
・Number of daily transactions are increasing from April and as of today
・FY10: Begun placing ATMs again from 2H10.
Begun placing in Kyushu area
・FY11: Planned to place ATMs in Kanto, Kansai and Kyushu area
・Break even point improved after the reduced outsourcing related expenses from 1Q10
and Kyushu area
< About Trust Networks >・Operates ATM operation business
(JPY millions)
1Q10 2Q10 3Q10 4Q10 1Q11 Operates ATM operation business
・Established July 2007 (77.8% ownership)
・Receives commission from each withdrawal
・ATM machines are leased
1Q10 2Q10 3Q10 4Q10 1Q11
Revenue 106 123 125 164 244
Cost 229 227 247 297 311
Expenses 37 36 42 44 43
S 266 263 289 341 354 ATM machines are leased
・The total number of ATMs placed and the daily usage per ATM is the key to profit growth
Sum 266 263 289 341 354
Operating Loss (161) (140) (165) (177) (111)
14

Historical Revenue & Income and FY11 Target
Revenue & Gross Margin Operating Income & Operating Income Ratio
& Net Income& Net Income
6 000
7,000 4.2%5.0% 5.0%
6.3%
100,000
19.5%
20.5%20.1%
82 418
100,000JPY millionsJPY millions
6,300
3 000
4,000
5,000
6,000
60,000
80,000 69,731 68,006
82,418
2,9173,412
4,141
1,000
2,000
3,000
20,000
40,000
1,419 2,234 3,203 3,400
Internet Connectivity Services
Outsourcing Service SI
WAN Service
0
FY08 FY09 FY10 FY11(E)0
FY08 FY09 FY10 FY11(E)
•Continuous growth of stock revenue•SI fluctuated due to economic situation
15
•Solid income growth along with stock revenue accumulation•Further growth opportunity with (1) cloud computing (2) M&A of IIJ Global
FY2011 Financial TargetUnit: JPY billion(except for Net Income andCash Dividend per Share)
g
1H11 Target(11/4~11/9)
Total 82 4
FY11 Target(11/4~12/3)
FY10 Actual(10/4~11/3)
100 047 5 +17 6 21 3%
YoY(Revised FY10 to FY09 Acutal)
52.1%6.3OperatingIncome +2.24.12.0
Revenues 82.4100.047.5 +17.6 21.3%
Income beforeIncome Tax
Expense (Benefit)5.6 3.8 46.1%+1.81.7
JPY 4 934
6.1%
JPY 16 775 JPY 15 761 JPY 1 014 6 4%Net Income
Net Incomeattributable to IIJ 3.4 +0.23.21.0
JPY 4,934
JPY 1,500 9.1%
JPY 16,775 JPY 15,761 JPY +1,014 6.4%
JPY 3,000 JPY 2,750 JPY +250Cash Dividendper Share
attributable to IIJper Share
16
(Interim) (Annual) (Annual)per Share

1Q11C lid t d Fi i l R ltConsolidated Financial Results
(Announced on August 12 2011)(Announced on August 12, 2011)

Agenda
Ⅰ. Summary of 1Q FY2011Financial Results
Ⅱ. Consolidated Financial Results for 1Q FY2011Q
Ⅲ. Reference Materials
18

I. Summary of 1Q FY2011 Financial Results
•Total revenues•Gross margin
<1st Quarter Financial Results>JPY23,362 millionJPY4,502 million
(up 47.7% YoY)(up 48.8% YoY)g
•Operating income•Income before income tax expense•Net income attributable to IIJ
,JPY915 millionJPY865 millionJPY512 million
( p )(up 244.2% YoY)(up 210.0% YoY)(up 107.4% YoY)
Recorded the highest revenue and operating income for first quarter results A good start for the first quarter with financial results in line with target Financial results related to IIJ-Global, a newly acquired subsidiary from Sep. 1, 2010 : Revenues of JPY6.5 billion,
costs of JPY5 2 billion SG&A expenses of JPY0 9 billion and operating income of JPY0 4 billioncosts of JPY5.2 billion, SG&A expenses of JPY0.9 billion and operating income of JPY0.4 billion
Network service and SI both increased YoY Network service revenues were up 66.8% YoY, SI revenues were up 15.4% YoY Outsourcing service continued to increase with the development in data center-related, web security-related services
Business developments: addition to solution line-ups and DC & facility investments St th d it i li d f t f l d ti i “IIJ GIO”
Cloud service “IIJ GIO” revenues are increasing and the number of projects reached 600 as of June 2011 (up 170 YoY) SI projects are small- to mid-sized. There were no large-scale down of a project during 1Q11 compared to 1Q10
Strengthened its service line-ups and features of our cloud computing service “IIJ GIO” “IIJ GIO Storage Service FV/S with REST API” The reconstruction of its Cloud Service Operations structure in Preparation for Receipt of SSAE16 Type 2
Opened the “Matsue DC”, the first container type data center using outside air cooling in Japan
19
Opened a lease based “Kozu DC” in the Kansai area for the increasing demands for BCP and disaster recovery Developed a system to monitor electricity use using the platform of IIJ’s proprietary management service “SACM” Internet Multifeed to provide “transix”, a IPv6 Internet connectivity service for ISPs

II-1. Consolidated Results for 1Q FY2011Unit: JPY billion
% of Revenues % of Revenues % of Revenues
1Q11 1Q10 FY10 Target(11/4~11/6) (10/4~10/6) (11/4~12/3)
YoY(11/4~11/6) (10/4~10/6) (11/4~12/3)
80 7% 80 9%
100.0TotalRevenues 23.4 47.7%15.8
80.7% 80.9%
18.9 12.819.3% 19.1%
4 5 3 0Gross Margin 48 8%
Total Costs 47.5% ―
―4.5 3.015.4% 17.5%
3.6 2.8
Gross Margin 48.8%
SG&A/R&D 30.0% ―
3.9% 1.7% 6.3%
0.9 0.3 6.33.7% 1.8% 5.6%
OperatingIncome 244.2%
0.9 0.3 5.62.2% 1.6% 3.4%
Income before IncomeTax Expense 210.0%
Net Income Attributable 107 4%
20
0.5 0.2 3.4to IIJ 107.4%

II-2. Revenues Unit: JPY million
Equipment SalesSystems Construction
Systems Operation and Maintenance
Outsourcing ServicesInternet Connectivity Services One-time
RevenuesRecurring Revenues ATM Operation BusinessWAN Services
247164
244
FY09: 68,006 (down 2.5% YoY)
15,835 16,441 16,038 15,81319,694 18,459 22,52525,622
FY10: 82,418 (up 21.2% YoY)
23,362
4 376 4 643 4 704
2,4225,016
2,517
173 129
318226
179
247376
7 31 70
98
106123
125244, , , ,, , ,
One-time revenue
631 633 643 647 653 2,6446,405 6,398 6,3104,761 4,715 4,555 4,687 4,248
4,241
4,376 4,643 4,704
1,804 2,344 1,9875,219
2,0112,487137 173 129 144
Recurring revenue
5,146 5,151 5,204 5,200 5,160 5,133 5,114 5,123 5,065
3,349 3,394 3,450 3,525 3,491 3,605 3,905 4,031 4,146631 633 643 647 653 revenue
1Q09 2Q09 3Q09 4Q09 1Q10 2Q10 3Q10 4Q10 1Q11
Recurring revenues: JPY20,226 million (up 49.2% YoY, up 0.2% QoQ)One-time revenues: JPY2,893 million (up 34.2%YoY)IIJ Gl b l ti i JPY6 464 illi
YoY = 1Q11 compared to 1Q10QoQ = 1Q11 compared to 4Q10
21
IIJ-Global operating income: JPY6,464 million(2Q10: JPY2,246 million, 3Q10: JPY6,406 million, 4Q10: JPY6,442 million) (mainly WAN service revenues, partly SI)
ATM operation business: JPY244 million (up JPY138 million YoY, up JPY80 million QoQ)
QoQ 1Q11 compared to 4Q10

II-3. Cost of Revenues and Gross Margin Ratio Unit: JPY million
25.7% 26.7% 28.1% 27.8%
%24.7%
26.2%IIJ Global 2Q10 3Q10 4Q10 1Q11
Network Services Equipment SalesSISI
Cost of RevenuesGross Margin Ratio Total Gross Margin RatioNetwork Services
ATM OperationBusiness
19.8% 19.9%18.9%
19.7%21.1%
22.0%
19.1%20.7% 20.9%
23.4%%
21.4%20.1%
IIJ-Global Q(1month)
3Q10 4Q10 1Q11
Cost of Revenue 1,761 5,215 5,160 5,173
Gross Margin 21 6% 18 6% 19 9% 20 0%
16.2% 16.5%18.6% 18.3% 17.8%
19.6% 19.6% 19.7% 19.3%
20,57118,860
Margin Ratio
21.6% 18.6% 19.9% 20.0%
FY09 : 54 051FY10 : 65,828
(gross margin: 20.1%)
5 066
5,0177,590 5,770
119 150 111269
119194
160210
339
192 215 277
281 229
227
247 297
311 12,65613,20012,837
15,35812,788 14,642
17,82718,860FY09 : 54,051
(gross margin: 20.5%)
7,651 7,661 7,567 7,655 7,647 9,15612,402 12,474 12,440
4,876 5,174 4,7027,152
4,7935,066119 111 9
1Q09 2Q09 3Q09 4Q09 1Q10 2Q10 3Q10 4Q10 1Q11Gross margin: JPY4,502 million (up JPY1,476 million YoY, down JPY549 million QoQ)Network service gross margin: up JPY1,424 million YoY due to the additional gross margin related to
IIJ Global and the continuous increase in revenues of Internet connectivity and outsourcing service
YoY = 1Q11 compared to 1Q10QoQ = 1Q11 compared to 4Q10
22
IIJ-Global and the continuous increase in revenues of Internet connectivity and outsourcing serviceSI gross margin: down JPY14 million YoY due to initial costs burden of IIJ GIO and several SI projects,
which a large portion consisted of purchased goods such as equipmentsATM operation business gross loss: JPY68 million (1Q10: JPY123 million, 4Q10: JPY133 million)
II-4. Network ServicesInternet Connectivity Services for Home Use
(1) Revenues Unit: JPY million
647 2 650 4 660 9 702.5 702.0 733.4 791.0
Internet Connectivity Services for Corporate Use
Outsourcing Services
Internet Connectivity Services for Home Use
WAN Services
6,405 6,398 6,310
584.7 619.8 647.2 650.4 660.9
FY09: 36,973
FY10: 51,662Total ContractedBandwidth (Gbps)
3,349 3,394 3,450 3,525 3,491 3,605 3,905 4,031 4,146
631 633 643 647 653 2,644
6,405 , ,
3,448 3,439 3,480 3,480 3,466 3,475 3,492 3,572 3,580
1,698 1,712 1,724 1,720 1,694 1,657 1,623 1,551 1,485
1Q09 2Q09 3Q09 4Q09 1Q10 2Q10 3Q10 4Q10 1Q11
Internet connectivity service for corporate use: JPY3,580 million (up 3.3% YoY, up 0.2% QoQ)IP service revenues increased by 0.6% QoQ due to the accumulation of new contracts despite the price down pressure which are common at the
beginning of the fiscal year Contracts of over 1Gbps as of June 2011: 131 contracts (up 8 contracts YoY up 5 contracts QoQ)beginning of the fiscal year. Contracts of over 1Gbps as of June 2011: 131 contracts (up 8 contracts YoY, up 5 contracts QoQ)IIJ mobile increased its number of contracts with the sales of iPad solution (Mobile service contracts reached over 52,000 contracts as of June 2011)Broadband connectivity service contracts as of June 2011 was 42,266 contracts (up 13,575 contracts YoY, down 585 contracts QoQ))
Internet connectivity service for home use was JPY1,485 million (down 12.4% YoY, down 4.2% QoQ), due to continuous cancellation ofold network services and the exemption of service fees related to the March 11 earthquake of approx JPY25 million for April 2011
23
Outsourcing services: JPY4,146 million (up 18.8% YoY, up 2.8% QoQ)Services such as Data center (“DC”) related, web security related and IIJ GIO Hosting package steadily increased. IIJ GIO monthly revenue for June
2011 (including revenue recognized in Systems operation and maintenance) has reached over JPY180 million from JPY 120 million for March 2011.

II-4. Network Services (2) Cost of Revenues Unit: JPY million
12 402 12 474 12 440
Purchasing CostsOthersOutsourcing Costs
Personnel Related CostsNetwork Operation Related CostsCircuit Related Costs
FY09: 30,534
FY10: 41,678(Gross Margin: 19.3%)
2,045 2,245 2,145
616 557 552
0 0 0
9 156
12,402 12,474 12,440(Gross Margin: 17.4%)
1,894 1,909 1,944
1,155 1,154 1,132
1,485
,
526 529 481 502 567
5878 9 7 3 0
07,6477,650 7,661
9,156
7,567 7,655
1,771 1,751 1,700 1,716 1,758
1,867931 921 931 964 962
9671,262 1,270 1,385 1,359 1,274
3,153 3,180 3,063 3,112 3,0854,250
6,692 6,609 6,667,
1Q09 2Q09 3Q09 4Q09 1Q10 2Q10 3Q10 4Q10 1Q11
Total cost of network service
24
Up 62.7% YoY due to additional costs from IIJ-GlobalTotal costs excluding costs of IIJ-Global decreased QoQ
YoY = 1Q11 compared to 1Q10QoQ = 1Q11 compared to 4Q10
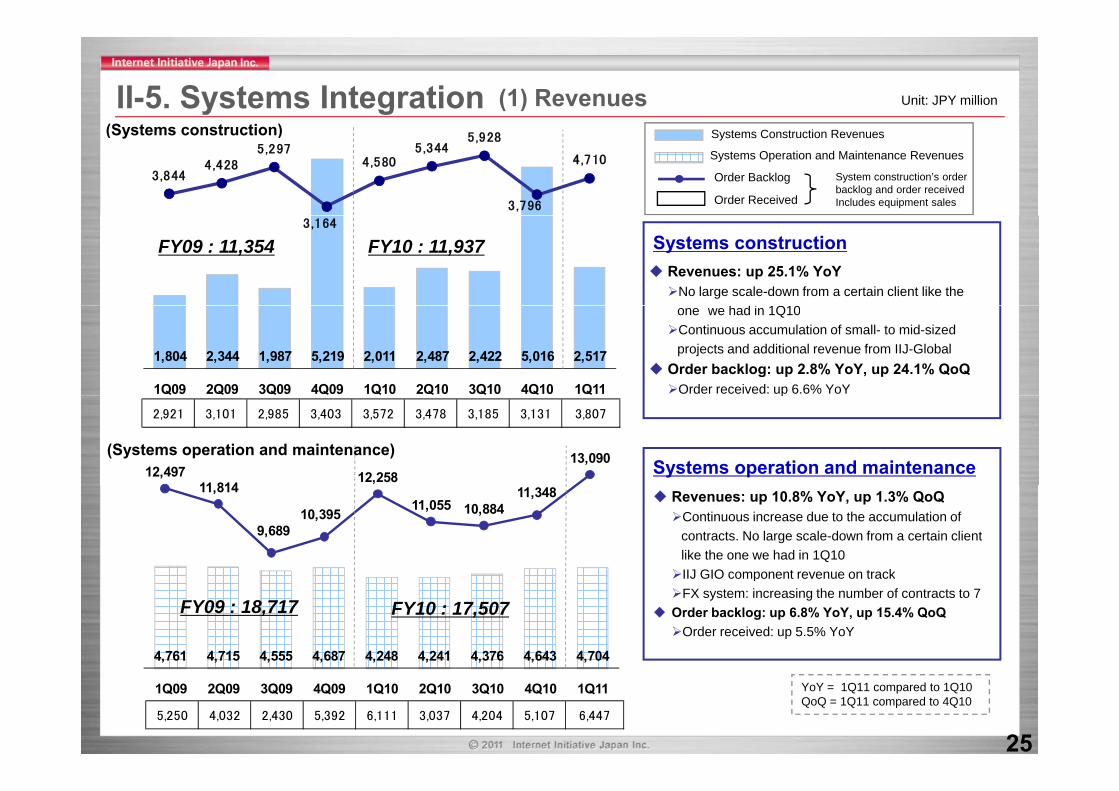
II-5. Systems Integration (1) Revenues Unit: JPY million
(S t t ti )
3,844 4,428
5,297 4,580
5,344 5,928
3,796
4,710 Order Backlog
Systems Construction Revenues
Systems Operation and Maintenance Revenues
System construction’s order backlog and order received Includes equipment salesOrder Received
(Systems construction)
3,164
Revenues: up 25.1% YoYNo large scale-down from a certain client like the
h d i 1Q10
Systems constructionFY09 : 11,354 FY10 : 11,937
1,804 2,344 1,987 5,219 2,011 2,487 2,422 5,016 2,517
1Q09 2Q09 3Q09 4Q09 1Q10 2Q10 3Q10 4Q10 1Q11
one we had in 1Q10Continuous accumulation of small- to mid-sized
projects and additional revenue from IIJ-Global Order backlog: up 2.8% YoY, up 24.1% QoQOrder received: up 6.6% YoY
12,497 11 814
12,258 13,090
p
Systems operation and maintenance
2,921 3,101 2,985 3,403 3,572 3,478 3,185 3,131 3,807
(Systems operation and maintenance)
11,814
9,689 10,395 11,055 10,884
11,348 Revenues: up 10.8% YoY, up 1.3% QoQContinuous increase due to the accumulation of
contracts. No large scale-down from a certain client like the one we had in 1Q10IIJ GIO component revenue on track
4,761 4,715 4,555 4,687 4,248 4,241 4,376 4,643 4,704
IIJ GIO component revenue on trackFX system: increasing the number of contracts to 7
Order backlog: up 6.8% YoY, up 15.4% QoQOrder received: up 5.5% YoY
FY09 : 18,717 FY10 : 17,507
25
1Q09 2Q09 3Q09 4Q09 1Q10 2Q10 3Q10 4Q10 1Q11
5,250 4,032 2,430 5,392 6,111 3,037 4,204 5,107 6,447
YoY = 1Q11 compared to 1Q10QoQ = 1Q11 compared to 4Q10

II-5. Systems Integration (2) Cost of Revenues Unit: JPY million
7 590FY10: 22,466
Purchasing Costs
OthersOutsourcing Costs
Personnel Related CostsNetwork Operation Related Costs
3 230 5 770
7,590Personnel Related Costs
FY09: 21,904 7,152
1,2351,412
985
2,705
854972 987
3,230
1,1984,876 4,7935,174 5,066
4,7025,017
5,770
328333
293 193 261 2601,541 1,591 1,543
1,7621,638
1,535 1,4721,657 1,837
, 35 985
718 740 730 732 738 863 929 884 882
1,078 1,119 1,1261,625
1,2291,403 1,436 1,558 1,592
304 312 318 333
718 740 730 732 738
1Q09 2Q09 3Q09 4Q09 1Q10 2Q10 3Q10 4Q10 1Q11
Total cost of SI: up 20.4% YoY, down 24.0% QoQ YoY = 1Q11 compared to 1Q10QoQ = 1Q11 compared to 4Q10
26
The number of full-time outsourcing personnel was 397 personnel (up 56 YoY, up 22 QoQ)Outsourcing and network operation related costs increased in relation to the business development of IIJ GIO
QoQ = 1Q11 compared to 4Q10
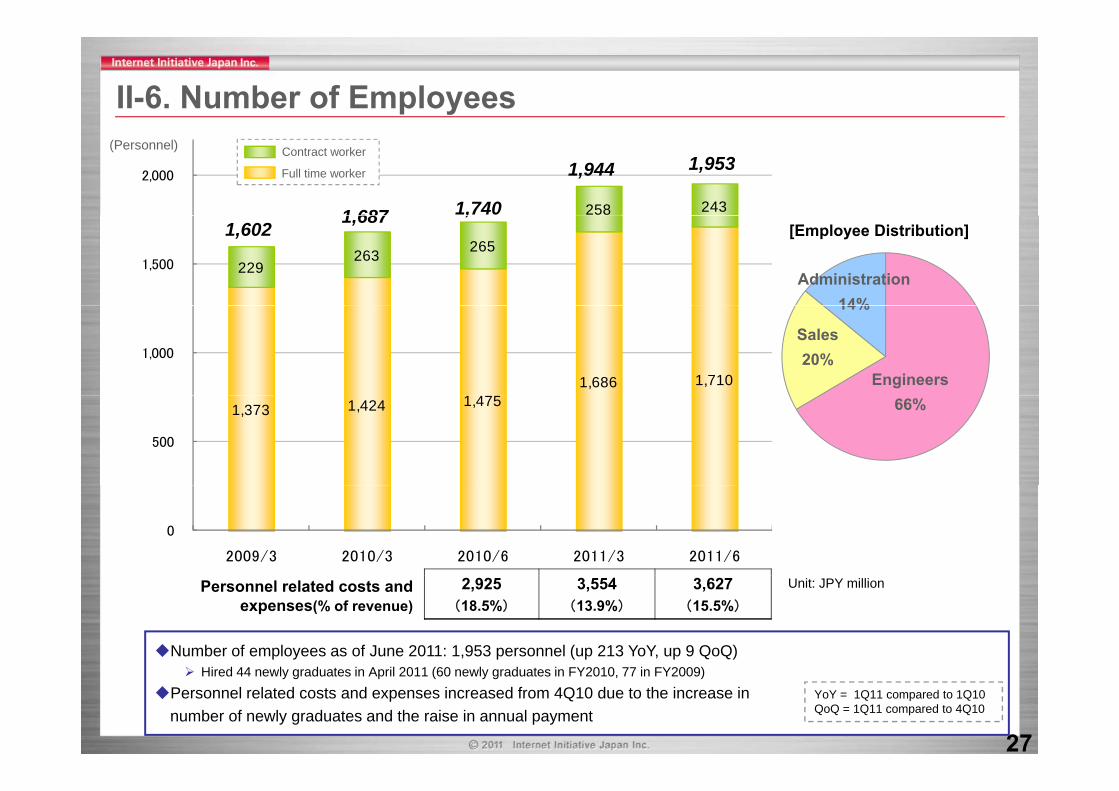
II-6. Number of Employees
258 243
2,000
1,7401 687
1,944 1,953(Personnel) Contract worker
Full time worker
229 263 265
1,500
1,602,1,687
Administration14%
[Employee Distribution]
1 4751,686 1,710
1,000
Engineers
Sales20%
14%
1,373 1,424 1,475
500
66%
0
2009/3 2010/3 2010/6 2011/3 2011/6
2,925(18.5%)
3,554(13.9%)
3,627(15.5%)
Number of employees as of June 2011: 1,953 personnel (up 213 YoY, up 9 QoQ)
Personnel related costs and expenses(% of revenue)
Unit: JPY million
27
Hired 44 newly graduates in April 2011 (60 newly graduates in FY2010, 77 in FY2009)Personnel related costs and expenses increased from 4Q10 due to the increase in
number of newly graduates and the raise in annual paymentYoY = 1Q11 compared to 1Q10QoQ = 1Q11 compared to 4Q10

II-7. SG&A Expenses/R&D Unit: JPY million
IIJ-Global 2Q10(1month)
3Q10 4Q10 1Q11
SG&A 224 777 767 856
Amortization of
Sales and Marketing ExpensesGeneral and Administrative Expenses
Research and Development% of Revenues( )
79
FY09 : 10,544(15.5%)
3,469(15.4%)
customer relationships
20 109 125 106
3,339
FY10 : 12,449(15.1%)
3,587(15.4%)
1,491 1,385 1,553 77 78
72 88
65
106 95 79
2,647(16.7%) 2,426
(14.8%)
2,540(15.8%)
2,931(14.9%) 2,759
(17.5%)
2,881(15.6%)
(6 6%)
( ) ,(13.0%)
(6 6%)
1,245 1,071 1,128
1,382 1,265 1,339
,86 78
(7.9%)(6.5%) (7.0%)
(7.0%)(8.0%)
(7.3%)
(6.6%)(5.4%)
(6.6%)
1,325 1,269 1,334 1,477 1,406 1,477 1,873 1,860 1,956
(8.4%) (7.7%) (8.3%) (7.5%) (8.9%) (8.0%)
(8.3%) (7.3%) (8.4%)
1Q09 2Q09 3Q09 4Q09 1Q10 2Q10 3Q10 4Q10 1Q11SG&A expenses: up 30.0% YoY, up 7.4% QoQExcluding expenses related to IIJ-Global: JPY2 731 million a decrease YoY YoY = 1Q11 compared to 1Q10
Q Q 1Q11 d 4Q10
28
Excluding expenses related to IIJ Global: JPY2,731 million, a decrease YoYRelocation, restoration and disposal expenses (a one-time expense) was JPY70 million (IIJ-Global and
some departments of IIJ moved its offices into the same building as IIJ) Total yearly rent expense are expected to decrease by approx. JPY100 million YoY
QoQ = 1Q11 compared to 4Q10

II-8. Operating Income and Net Income Unit: JPY million
Operating Income: JPY915 million7.1% 6 7%
Operating income : 3,412
Net income attributable to IIJ: 2,234
Operating income : 4,141
Net income attributable to IIJ: 3,203
Operating IncomeNet Income Attributable to IIJOperating Margin Ratio
YoY = 1Q11 compared to 1Q10QoQ = 1Q11 compared to 4Q10
p gOperating income related to IIJ-Global: JPY436 million
(2Q10 JPY261 million, 3Q10: JPY414 million,4Q10: JPY515 million)
Network service gross margin increasedOperating loss related to ATM operation business1,404
1,711
2.2%
5.0% 5.2% 5.1% 5.5%6.7%
3.9%Operating loss related to ATM operation business
decreasedIncome before income tax expense: JPY865 millionNet income attributable to IIJ: JPY512 millionNet loss attributable to noncontrolling interests related to
815 841935
1,229
9151,101 1,1381,206
1.7%
Trust NetworksEquity in net income of equity method investees related to
i-revo and Internet Multifeed
ATM operation business351
815 841
535 418612
512
Placed 320 ATMs as of August 12, 2011The placement speed of ATMs were down during May
and June affected by the March 11 earthquakeOperating loss decreased due to the continuous increase
in number of transactions and number of ATMs
266
180247
1Q09 2Q09 3Q09 4Q09 1Q10 2Q10 3Q10 4Q10 1Q11
1Q10 2Q10 3Q10 4Q10 1Q11
Income Tax Expenses 120 160 179 496 425
Deferred tax expense 88 75 78 365 306
in number of transactions and number of ATMs
1Q10 2Q10 3Q10 4Q10 1Q11
Revenue 106 123 125 164 244
Cost 229 227 247 297 311
(JPY millions)
29
Equity in net income(loss) of equity method investees 34 (3) 98 (7) 40
Net loss attributable to noncontrolling interests 54 48 51 50 31
Expenses 37 36 42 44 43
Sum 266 263 289 341 354
Operating Loss (161) (140) (165) (177) (111)

Unit: JPY millionII-9. Consolidated Balance Sheets March 31,
2011June 30,
2011 Changes
Cash and Cash Equivalents 13,314 11,435 (1,879)Increased due to bonus payments and
payments for operation and maintenancefee for SI projects
Nonmarketableequity securities: JPY1 943 million
Accounts Receivable 16,431 14,063 (2,368)
Inventories 601 809 +208
Non-amortized
equity securities: JPY1,943 millionAvailable for sale
equity securities: JPY796 millionOthers: JPY155million
Prepaid Expenses 1,680 3,288 +1,608
Other Investments 2,794 2,894 +100
intangible assets: JPY5,980 million•Goodwill; JPY5,788 million
(IIJ-Global: JPY2,288 million)•Trademark: JPY192 million
Amortized intangible assets(Customer relationships): JPY5 690 million
Property and Equipment 16,481 16,732 +252
Goodwill andOther Intangible Assets 11,843 11,689 (154)
Accounts payable 13 574 10 020 (3 554) (Customer relationships): JPY5,690 million(IIJ-Global: JPY3,360 million)
Accounts payable 13,574 10,020 (3,554)
Borrowings(Short-term) 13,430 13,430 +0
Accumulated Deficit (14,023) (13,815) +208 Decreased in relation to the payment of
Accumulated OtherComprehensive Income (85) (82) +3
Total IIJ Shareholders'Equity 29,652 29,864 +211
p yaccounts payable of property andequipment (Matsue DC and others)
IIJ Sh h ld ’ it ti
30
Total Assets 71,473 69,147 (2,326)IIJ Shareholder’s equity ratio:
•June 30, 2011: 43.2%•March 31, 2011: 41.5%
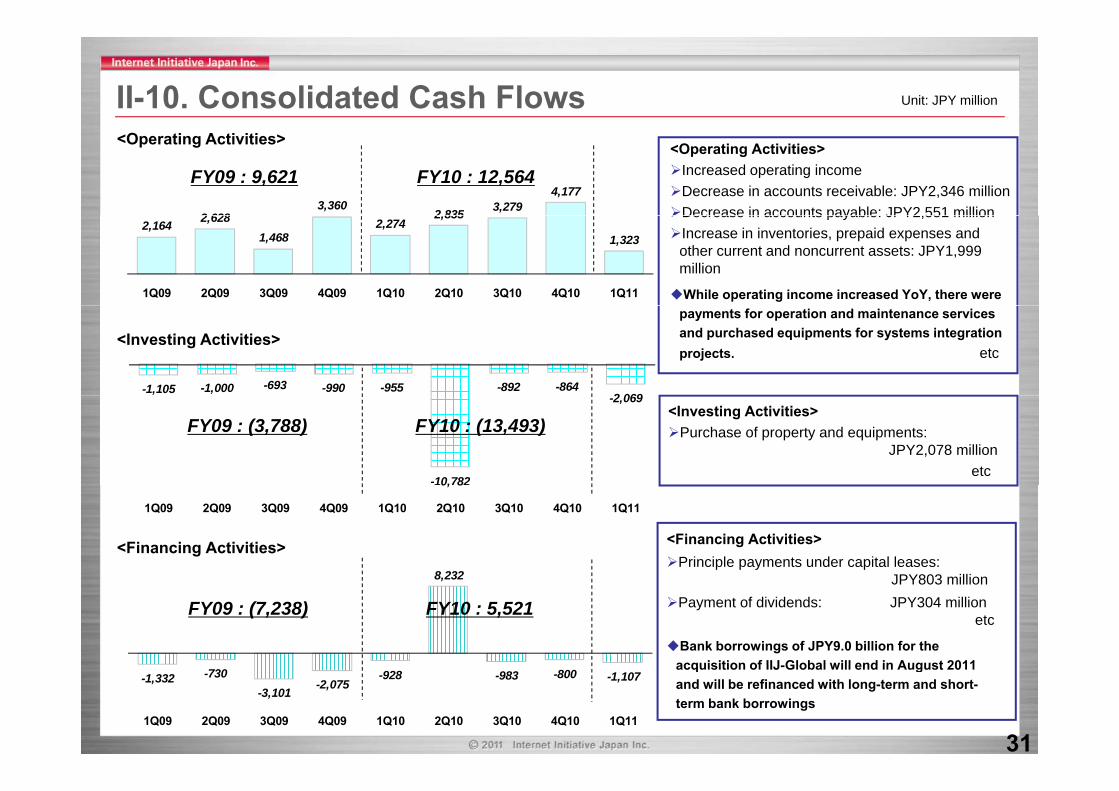
II-10. Consolidated Cash Flows Unit: JPY million
2 6283,360
2 835 3,2794,177
<Operating Activities>Increased operating incomeDecrease in accounts receivable: JPY2,346 millionDecrease in accounts payable: JPY2,551 million
FY09 : 9,621 FY10 : 12,564
<Operating Activities>
2,164 2,6281,468
2,2742,835
1,323
1Q09 2Q09 3Q09 4Q09 1Q10 2Q10 3Q10 4Q10 1Q11
Decrease in accounts payable: JPY2,551 millionIncrease in inventories, prepaid expenses and
other current and noncurrent assets: JPY1,999 million
While operating income increased YoY, there were
-1,105 -1,000 -693 -990 -955 -892 -8642 069
payments for operation and maintenance services and purchased equipments for systems integration projects. etc
<Investing Activities>
-10,782
-2,069<Investing Activities>Purchase of property and equipments:
JPY2,078 millionetc
FY09 : (3,788) FY10 : (13,493)
0, 8
1Q09 2Q09 3Q09 4Q09 1Q10 2Q10 3Q10 4Q10 1Q11
8 232
<Financing Activities>Principle payments under capital leases:
JPY803 illi
<Financing Activities>8,232 JPY803 million
Payment of dividends: JPY304 millionetc
Bank borrowings of JPY9.0 billion for the acquisition of IIJ Global will end in August 2011
FY09 : (7,238) FY10 : 5,521
31
-1,332 -730-3,101
-2,075-928 -983 -800 -1,107
1Q09 2Q09 3Q09 4Q09 1Q10 2Q10 3Q10 4Q10 1Q11
acquisition of IIJ-Global will end in August 2011 and will be refinanced with long-term and short-term bank borrowings

Unit: JPY millionII-11. Other Financial Data (CAPEX etc.)
Matsue DC: JPY889 million
IIJ-Global: JPY233 million
ATM operation business: JPY148 million
2,878FY09 : 5,584 FY10 : 6,752
CAPEX (Include Capital Lease)
ATM operation business: JPY148 million
1,4891,124
1,752
1,218 1,221
1,8041,515
2,212
Adjusted EBITDA
2,777 2,747
3,543
2 5781Q09 2Q09 3Q09 4Q09 1Q10 2Q10 3Q10 4Q10 1Q11
FY09 : 8,718 FY10 : 10,210
1,7112,099 2,132
1,517
2,4032,5781Q09 2Q09 3Q09 4Q09 1Q10 2Q10 3Q10 4Q10 1Q11
FY09 : 5,307 FY10 : 6,069Depreciation and Amortization
1Q09 2Q09 3Q09 4Q09 1Q10 2Q10 3Q10 4Q10 1Q11
, ,
1,360 1,284 1,291 1,3721 251
1,468 1,518
1,8321,664
, , 1,251
32
1Q09 2Q09 3Q09 4Q09 1Q10 2Q10 3Q10 4Q10 1Q11

IIJ Group Companies (As of July 31, 2011)
Company Name Ownership Main Business
Net Care IncProvides a full range of network operation and management services, from customer support end-user help desks monitoring andNet Care, Inc. from customer support, end user help desks, monitoring and troubleshooting to integrated management services.
Net Chart Japan Inc.Provides network construction services, primarily for LANs, such as network installation wiring, installation and set-up of equipment, installation of applications, and operational support.
Provides quality Internet services in the U S with a focus on U S based
Consolidated Subsidiaries
100%IIJ America Inc.
Provides quality Internet services in the U.S. with a focus on U.S.-based enterprises doing business in the Asia-Pacific region. Also IIJ-A constructs and operates on U.S. Internet backbone network.
hi-ho, Inc. Supports customer's safe, secure and comfortable Internet life based on ISP business for personal users.
IIJ Innovation Institute Inc. An incubation business for the next generation internet. (R&D)
IIJ Global Solutions Inc. Provides domestic network outsourcing related services including WANservice and international network related services
Trust Networks Inc. 77.8% Operates ATM network systems placed in designated facilities. Receives commission for each withdrawal transaction from a bank account.
Internet Multifeed Co. 32%Provides mutual access with other major ISPs and content distribution services based on Multifeed technology. Also MFEED operates JPNAP, a distributed IX service.
Equity Method Investees Internet Revolution, Inc. 30% Operates a comprehensive portal site that provides various contents,
such as SNS, blogs, stunning games, videos, and music.
Trinity Inc. 45% Provides operation of reward point management system
33

Forward Looking StatementStatements made in this presentation regarding IIJ’s or management’s intentions,
beliefs, expectations, or predictions for the future are forward-looking statements that are based on IIJ’s and managements’ current expectations, assumptions, estimates and projections about its business and the industry These forward looking statements suchprojections about its business and the industry. These forward-looking statements, such as statements regarding revenues and operating and net profitability, are subject to various risks, uncertainties and other factors that could cause IIJ’s actual results to differ materially from those contained in any forward-looking statement. These risks,
t i ti d th f t i l d th ibilit d f t diuncertainties and other factors include: the possibility a decrease of corporate spending or capital expenditure due to depression in Japanese economy and/or corporate earnings decreased; the possibility that less of reliability for our services and loss of business chances due to interrupt or suspend of our services; the possibility an increase over estimate in network rerated cost and outsourcing cost, personnel cost etc. ;increase in competition and strong pricing pressure; the recording of an impairment loss as a results of an impairment test on the non-amortized intangible assets such as goodwill; a decline in value and trending value of our holding securities;assets such as goodwill; a decline in value and trending value of our holding securities; the amount and timing of the recognition of deferred tax benefits or expenses; and other risks referred to from time to time in IIJ’s filings on Form 20-F of its annual report and other filings with the United States Securities and Exchange Commission ("SEC").
Internet Initiative Japan Inc. (Finance Department )
Contact Informationp p
Jinbocho Mitsui Bldg., 1-105 Kanda Jinbo-cho, Chiyoda-ku, Tokyo, 101-0051, Japan
TEL: 03-5259-6500 FAX: 03-5259-6311 URL: http://www.iij.ad.jp/IR E-Mail: [email protected]