interpretability and
TRANSCRIPT
INTERPRETABILITY AND EXPLAINABILITY
FROM A CAUSAL LENS
Judea Pearl IPAM WorkshopOctober 16, 2019
Twitter: @yudapearl
To help protect your privacy, PowerPoint has blocked automatic download of this picture.

OUTLINE
• What is a causal lens?• Why causal understanding needs a new logic,
and a new inference engine• The two fundamental laws ("double-helix") of
causal inference• The Seven Pillars (Tools) of Causal Wisdom
o how they are revolutionizing science,o how they clarify social, legal, and ethical
questions
WHAT IS A CAUSAL LENS?
• There exists an unknown but true Data Generating Process (DGP) that explains the world.
• The DGP comes as a set of CAUSAL equations• Task: Infer properties of the DGP using data
and assumptions about other properties of the DGP.
• Central: Consequences of pending policies on various populations or subpopulations.
• Central: Qualitative understanding of the DGP structure (in graphical form).
WHAT IS CAUSAL INFERENCE?
• A method of taking three inputs and producing answers to two types of causal questions.
Inputs: (1) What we wish to know(2) What we do already know(3) Available data
Outputs: (1a) effects of pending interventions(1b) effects of undoing past events
TYPICAL CAUSAL QUESTIONS
1. How effective is a given treatment in preventinga disease?
2. Was it the new tax break that caused our sales to go up? Or our marketing campaign?
3. What is the annual health-care costs attributedto obesity?
4. Can hiring records prove an employer guilty of sex discrimination?
5. I am about to quit my job, will I regret it?• Unarticulatable in the standard grammar
of science.
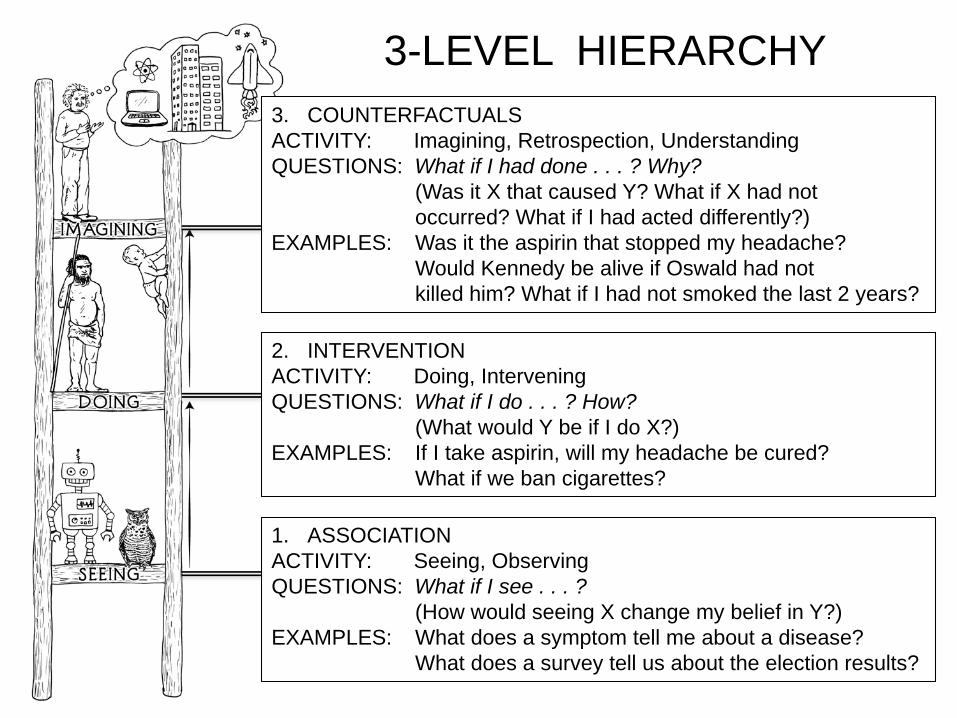
2. INTERVENTIONACTIVITY: Doing, InterveningQUESTIONS: What if I do . . . ? How?
(What would Y be if I do X?) EXAMPLES: If I take aspirin, will my headache be cured?
What if we ban cigarettes?
1. ASSOCIATIONACTIVITY: Seeing, ObservingQUESTIONS: What if I see . . . ?
(How would seeing X change my belief in Y?) EXAMPLES: What does a symptom tell me about a disease?
What does a survey tell us about the election results?
3. COUNTERFACTUALSACTIVITY: Imagining, Retrospection, UnderstandingQUESTIONS: What if I had done . . . ? Why?
(Was it X that caused Y? What if X had not occurred? What if I had acted differently?)
EXAMPLES: Was it the aspirin that stopped my headache?Would Kennedy be alive if Oswald had not killed him? What if I had not smoked the last 2 years?
3-LEVEL HIERARCHY
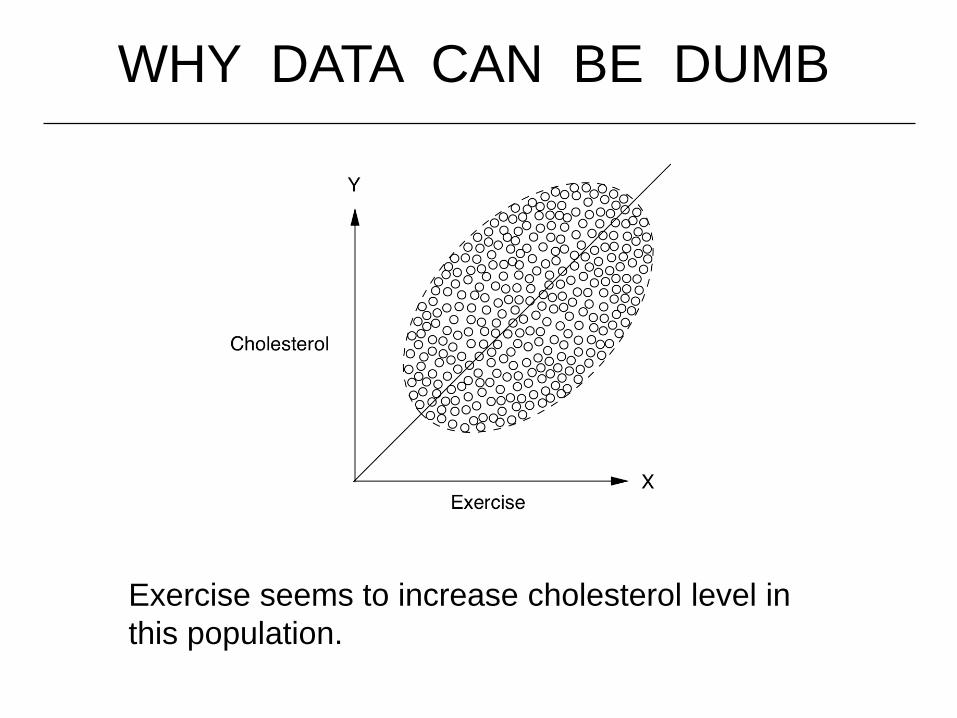
WHY DATA CAN BE DUMB
Exercise seems to increase cholesterol level in this population.
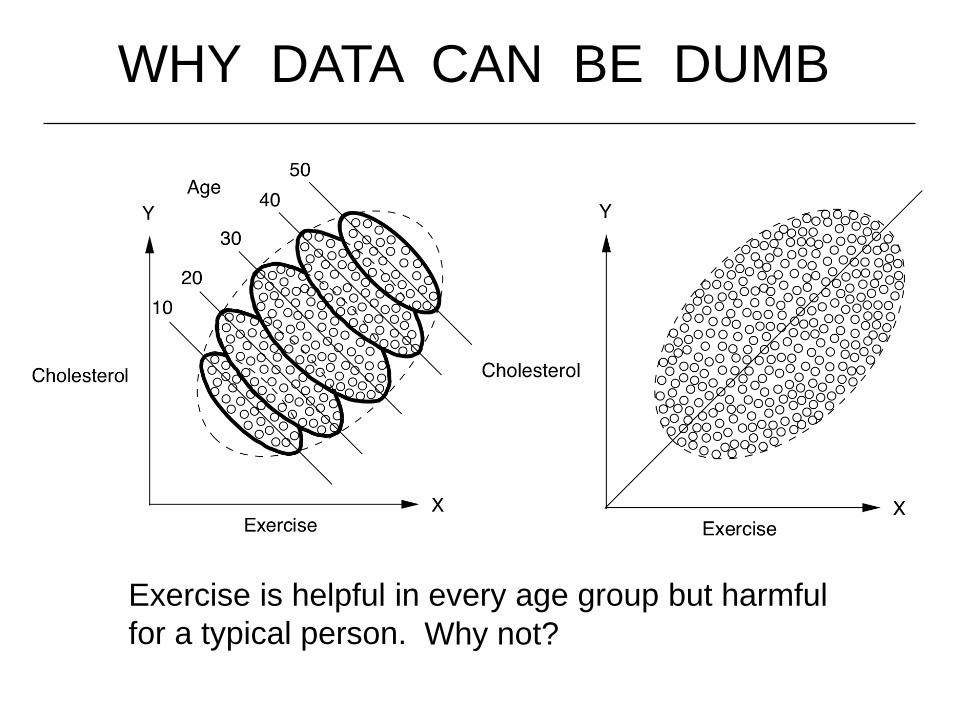
WHY DATA CAN BE DUMB
Exercise is helpful in every age group but harmful for a typical person. Why not?
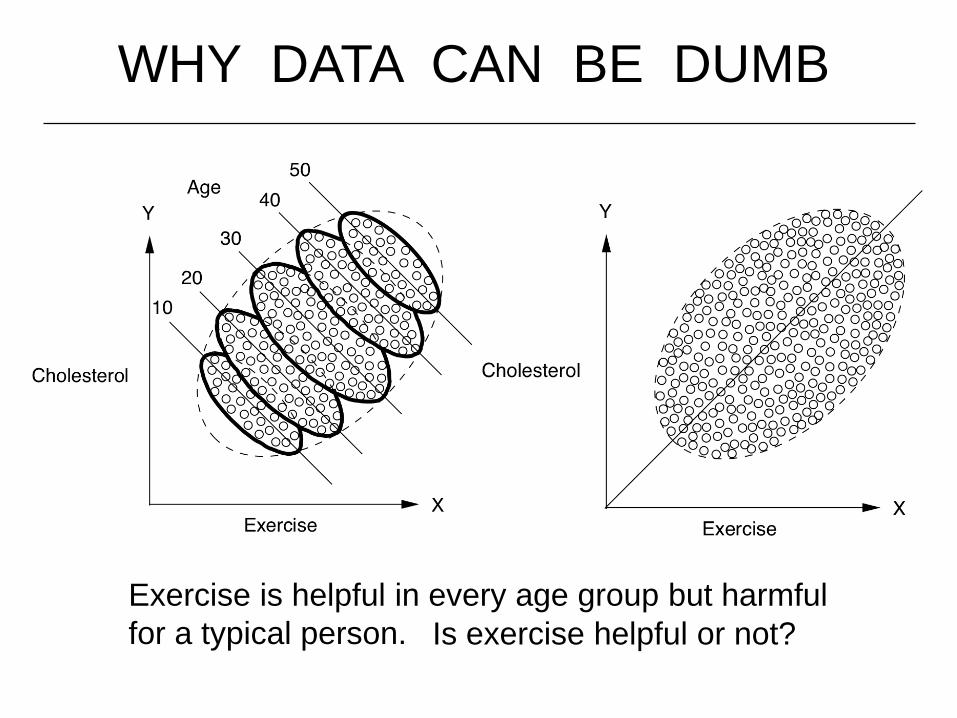
WHY DATA CAN BE DUMB
Exercise is helpful in every age group but harmful for a typical person. Is exercise helpful or not?
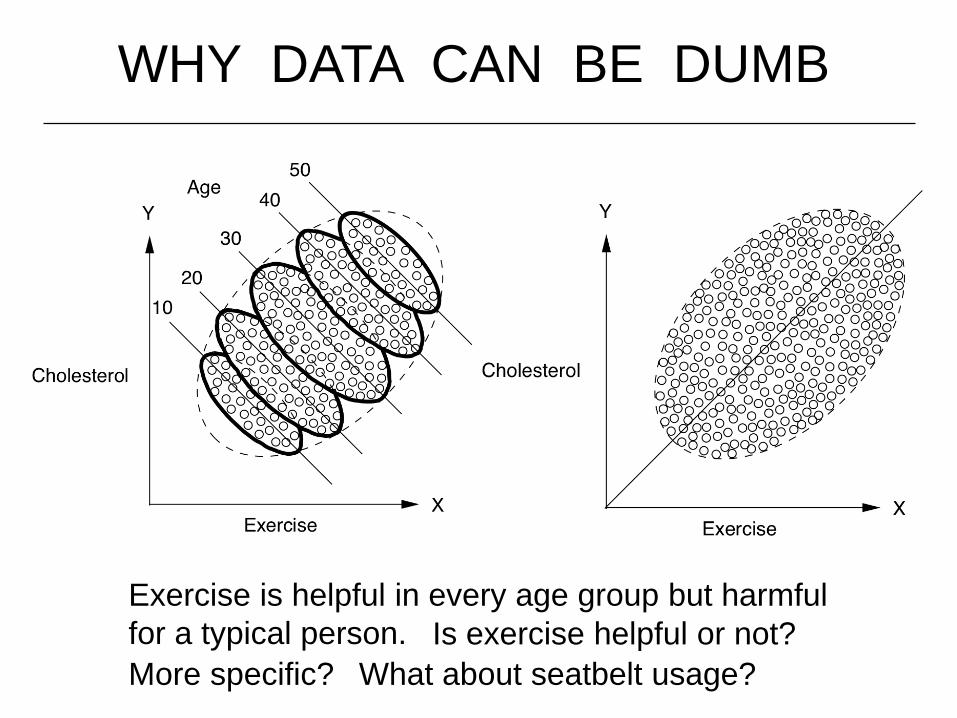
WHY DATA CAN BE DUMB
Exercise is helpful in every age group but harmful for a typical person.More specific?
Is exercise helpful or not?What about seatbelt usage?
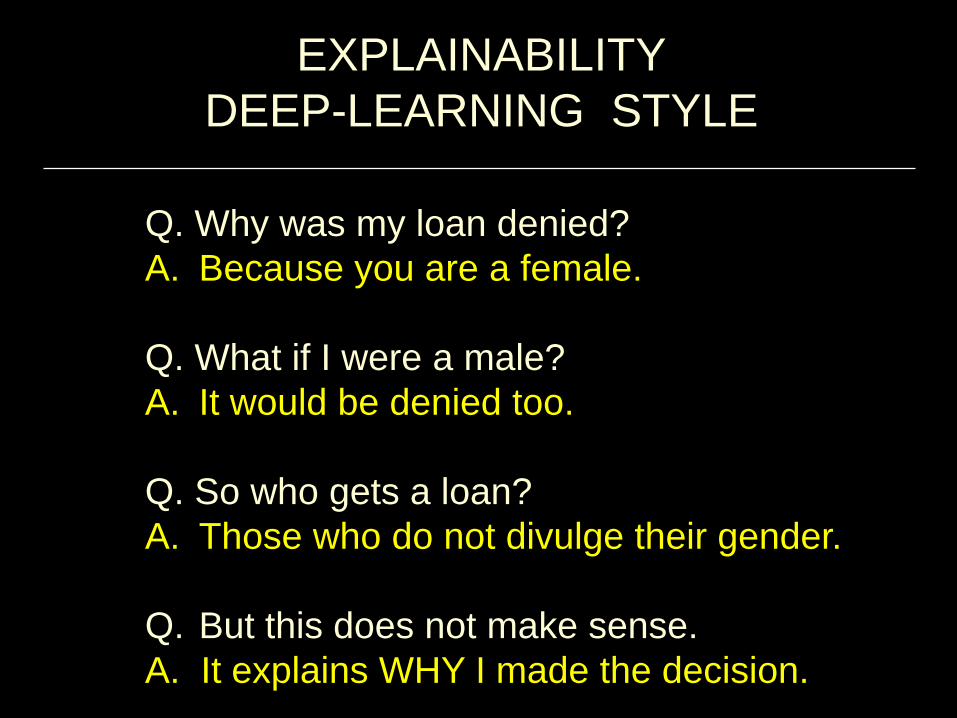
Q. Why was my loan denied?A. Because you are a female.
Q. What if I were a male?A. It would be denied too.
Q. So who gets a loan?A. Those who do not divulge their gender.
Q. But this does not make sense.A. It explains WHY I made the decision.
EXPLAINABILITYDEEP-LEARNING STYLE
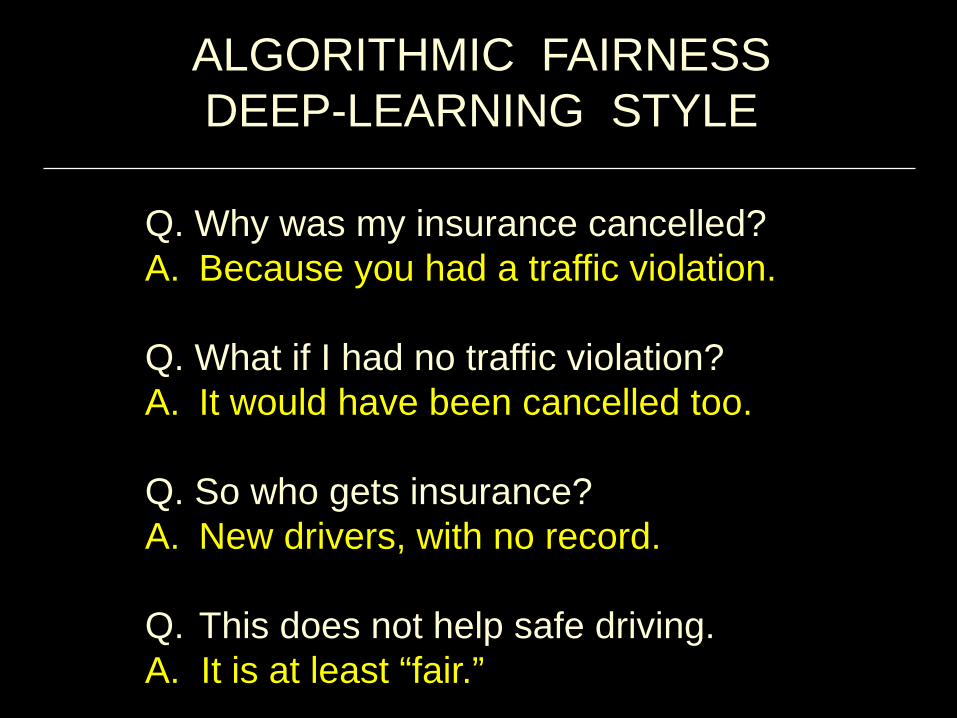
Q. Why was my insurance cancelled?A. Because you had a traffic violation.
Q. What if I had no traffic violation?A. It would have been cancelled too.
Q. So who gets insurance?A. New drivers, with no record.
Q. This does not help safe driving.A. It is at least “fair.”
ALGORITHMIC FAIRNESSDEEP-LEARNING STYLE
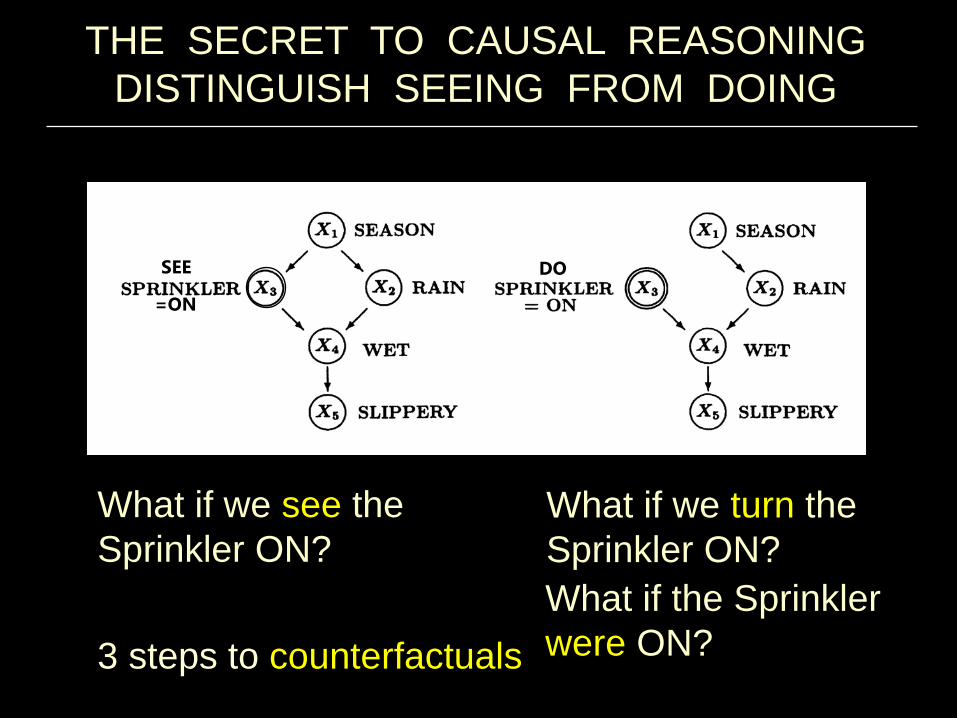
THE SECRET TO CAUSAL REASONING DISTINGUISH SEEING FROM DOING
What if we see the Sprinkler ON?
What if we turn the Sprinkler ON?
=ON
DOSEE
3 steps to counterfactualsWhat if the Sprinkler were ON?
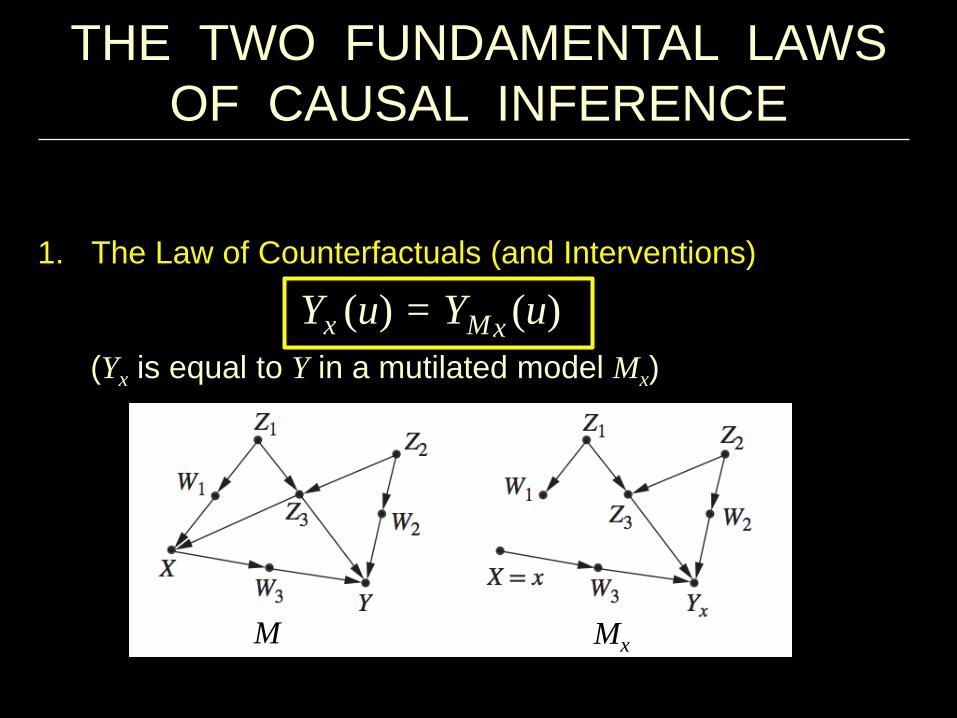
THE TWO FUNDAMENTAL LAWSOF CAUSAL INFERENCE
1. The Law of Counterfactuals (and Interventions)
(Yx is equal to Y in a mutilated model Mx)
M Mx
Yx (u) = YM (u)x

THE TWO FUNDAMENTAL LAWSOF CAUSAL INFERENCE
1. The Law of Counterfactuals (and Interventions)
(Yx is equal to Y in a mutilated model Mx.)
2. The Law of Conditional Independence (d-separation)
(Separation in the model ⇒ independence in the distribution.)
Yx (u) = YM (u)x
(X sep Y | Z)G(M)⇒ (X ⊥ Y | Z) = P(v)⊥

C (Climate)
R(Rain)
S(Sprinkler)
W (Wetness)
READING INDEPENDENCIES
Graph (G) Model (M)
Every missing arrow advertises an independency, conditional on a separating set.

C (Climate)
R(Rain)
S(Sprinkler)
W (Wetness)Every missing arrow advertises an independency, conditional on a separating set.
Applications:1. Model testing 2. Structure learning3. Reducing scientific questions to symbolic calculus
Graph (G) Model (M)
READING INDEPENDENCIES

Estimand(Recipe for
answering the query)Query
Data
Assumptions(Graphical model)
Fit Indices
Estimate(Answer to query)
ES
ES
F
THE STRUCTURAL CAUSAL MODEL (SCM)INFERENCE ENGINE
INPUTS OUTPUTS

EstimandQuery
Data
Assumptions
Fit Indices
Estimate(Answer to query)
ES
ES
F
THE INFERENCE ENGINEIN ACTION
INPUTS OUTPUTS
Z
X Y
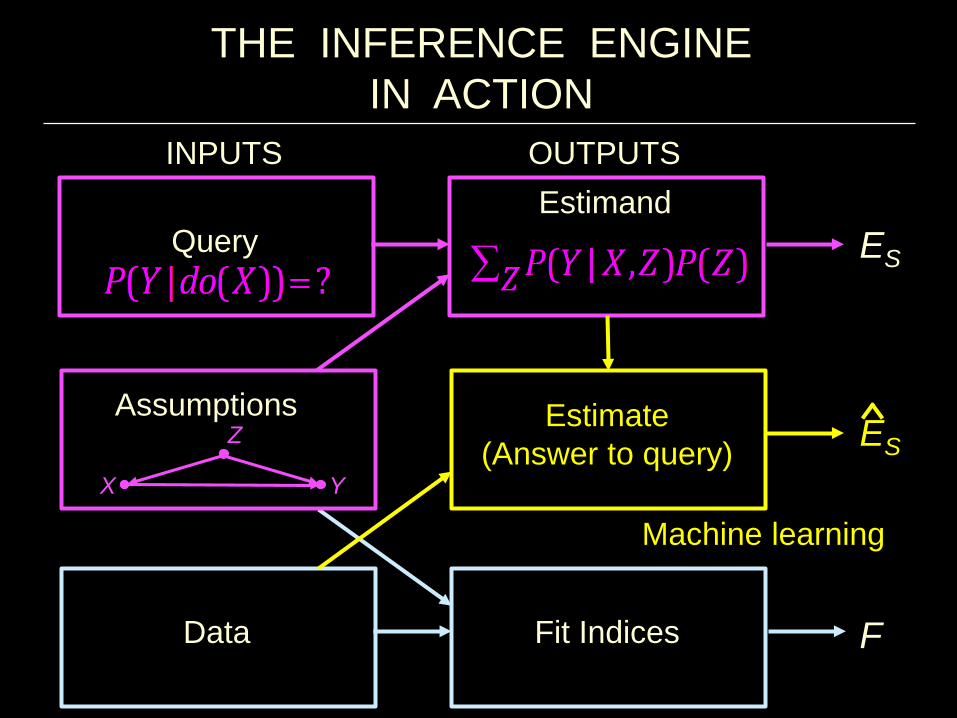
EstimandQuery
Data
Assumptions
Fit Indices
Estimate(Answer to query)
ES
ES
F
THE INFERENCE ENGINEIN ACTION
INPUTS OUTPUTS
Z
X Y
Machine learning
EstimandQuery
Data
Assumptions
Fit Indices
Estimate(Answer to query)
ES
ES
F
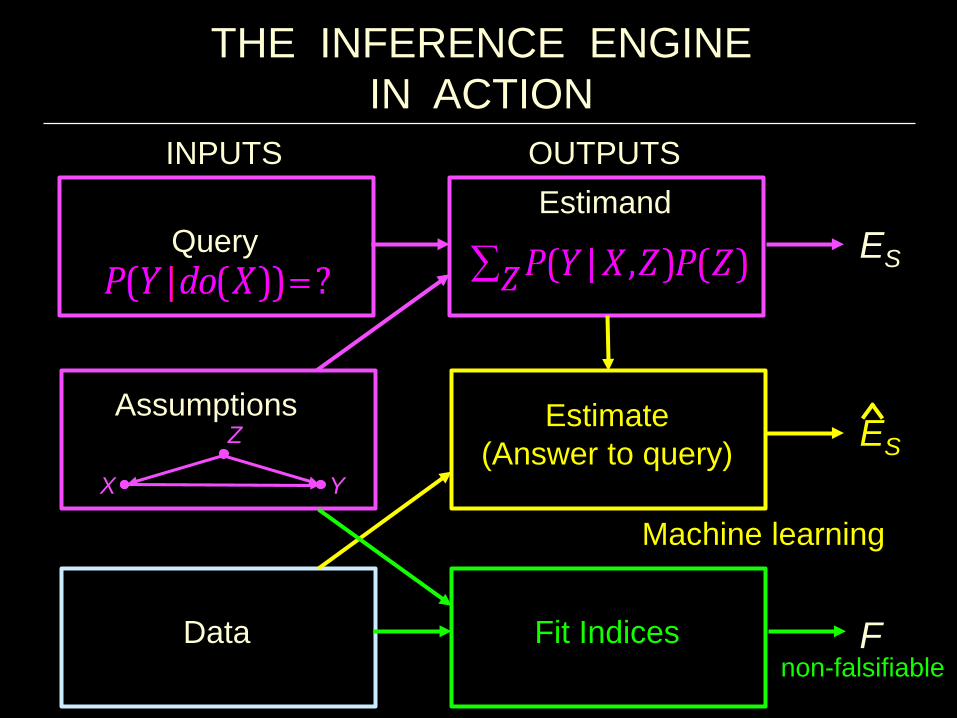
THE INFERENCE ENGINEIN ACTION
INPUTS OUTPUTS
Z
X Y
Machine learning
non-falsifiable

THE SEVEN PILLARS
Pillar 1: Transparency and Testability of Causal Assumptions
Pillar 2: Effect of Policies - EstimabilityPillar 3: Counterfactuals Algorithmitized
(attribution, explanation, susceptibility)Pillar 4: Direct and Indirect Effects
(discrimination and inequities)Pillar 5: External Validity and Sample Selection BiasPillar 6: Missing DataPillar 7: Causal Discovery
PILLAR 1: MEANINGFUL COMPACT REPRESENTATION
FOR CAUSAL ASSUMPTIONS
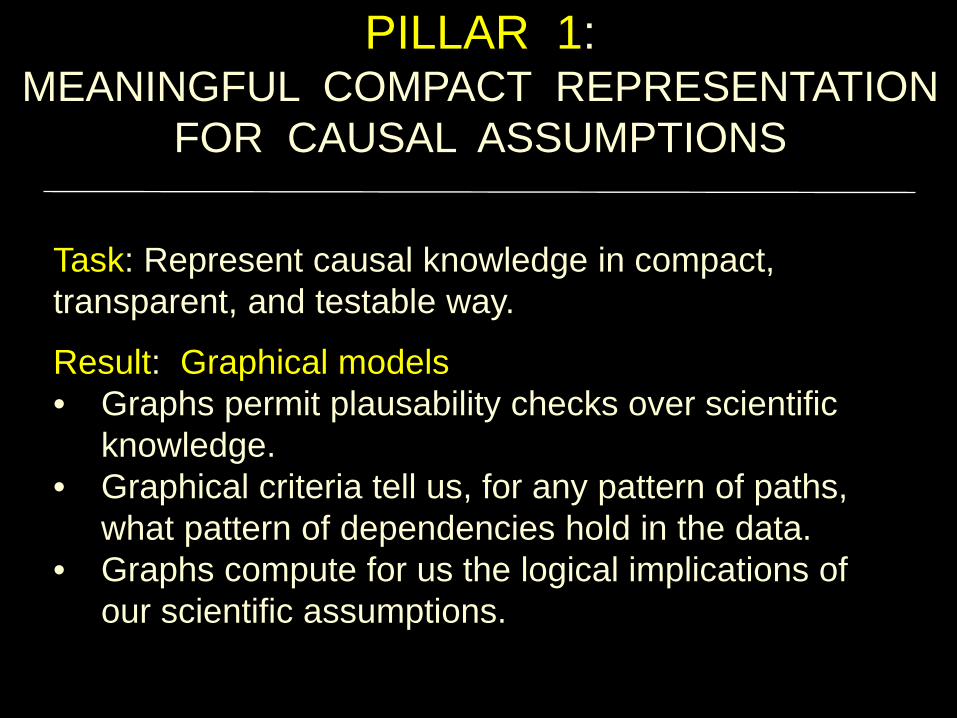
Task: Represent causal knowledge in compact, transparent, and testable way.
PILLAR 1: MEANINGFUL COMPACT REPRESENTATION
FOR CAUSAL ASSUMPTIONS
Task: Represent causal knowledge in compact, transparent, and testable way.
Result: Graphical models • Graphs permit plausability checks over scientific
knowledge.• Graphical criteria tell us, for any pattern of paths,
what pattern of dependencies hold in the data. • Graphs compute for us the logical implications of
our scientific assumptions.
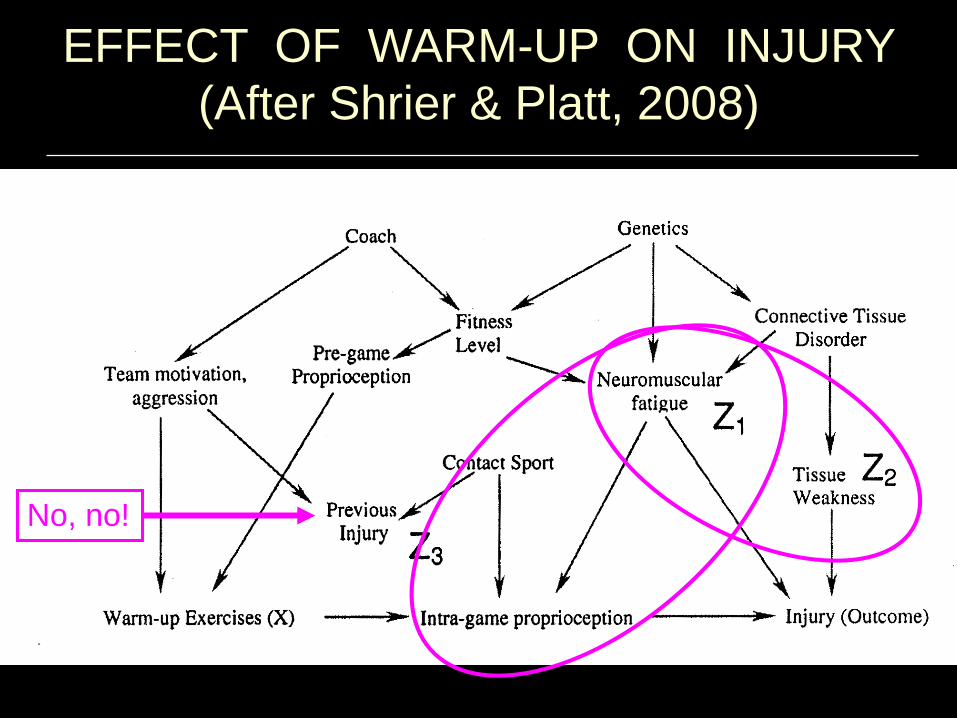
EFFECT OF WARM-UP ON INJURY (After Shrier & Platt, 2008)
No, no!
PILLAR 2: EVALUATING EFFECTS OF
NEW POLICIES
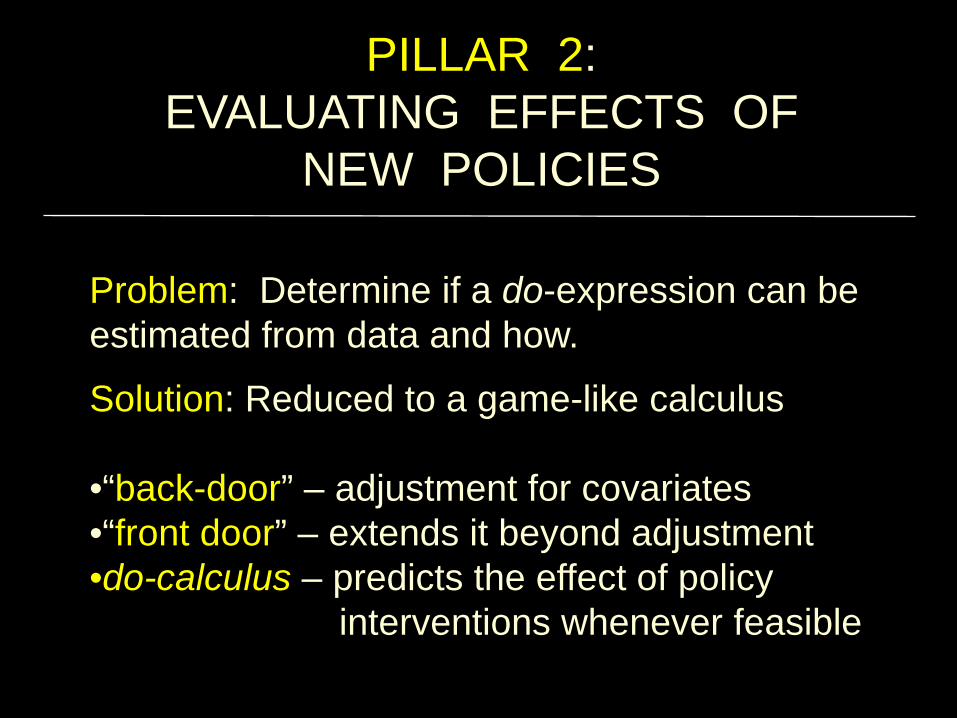
Problem: Determine if a do-expression can be estimated from data and how.
Solution: Reduced to a game-like calculus
•“back-door” – adjustment for covariates•“front door” – extends it beyond adjustment•do-calculus – predicts the effect of policy
interventions whenever feasible

EFFECT OF WARM-UP ON INJURY (After Shrier & Platt, 2008)
No, no!

FORMULATING A PROBLEMIN THREE LANGUAGES
X YZ
U
U
ZX Y
2. Structural:Find: P(Y = y | do(X = x))
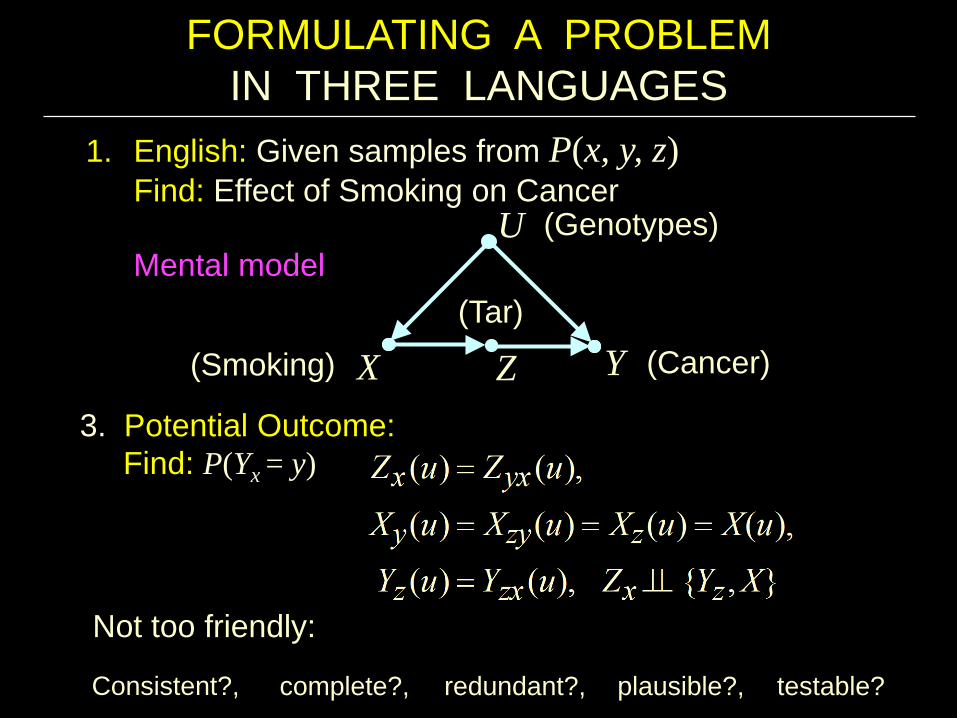
1. English: Given samples from P(x, y, z)Find: Effect of Smoking on Cancer
(Genotypes)
(Tar)(Cancer)(Smoking)
Mental model
FORMULATING A PROBLEMIN THREE LANGUAGES
testable?
Not too friendly:
Consistent?, complete?, redundant?, plausible?,
3. Potential Outcome:Find: P(Yx = y)
X YZ
U
1. English: Given samples from P(x, y, z)Find: Effect of Smoking on Cancer
(Genotypes)
(Tar)(Cancer)(Smoking)
Mental model
PILLAR 3: THE ALGORITHMIZATION OF
COUNTERFACTUALS
Task: Given {Model + Data}, determine what Joe's salary would be, had he had one more year of education.
Solution: The probability of every counterfactual can be computed or bounded using the "surgery" procedure.
Corollary: "Causes of effects" and "Attribution" formalized.
ATTRIBUTION
•
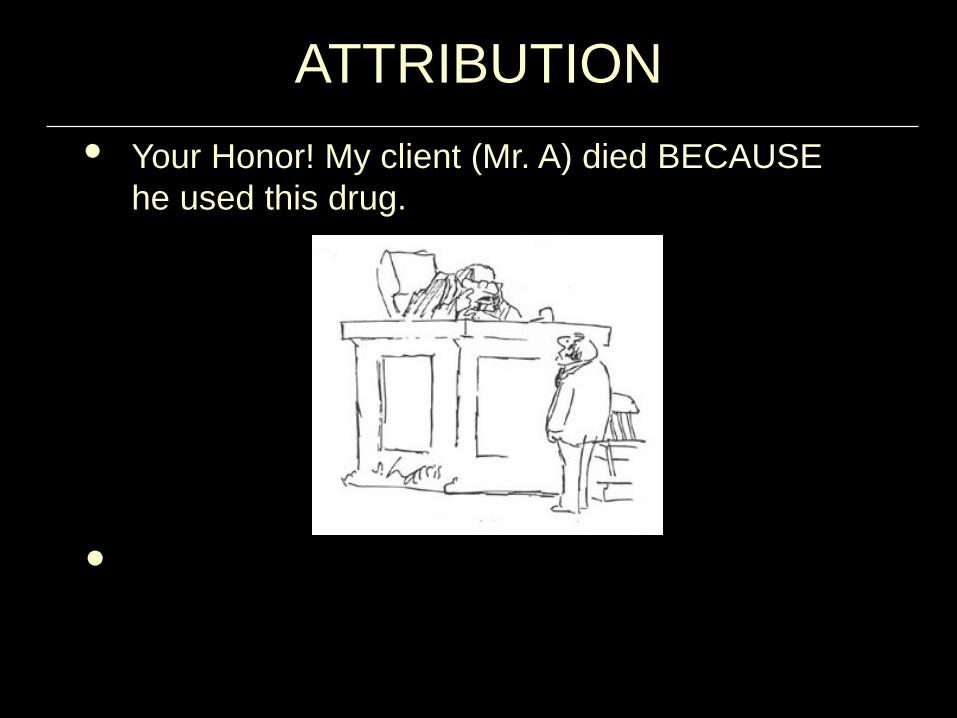
• Your Honor! My client (Mr. A) died BECAUSEhe used this drug.
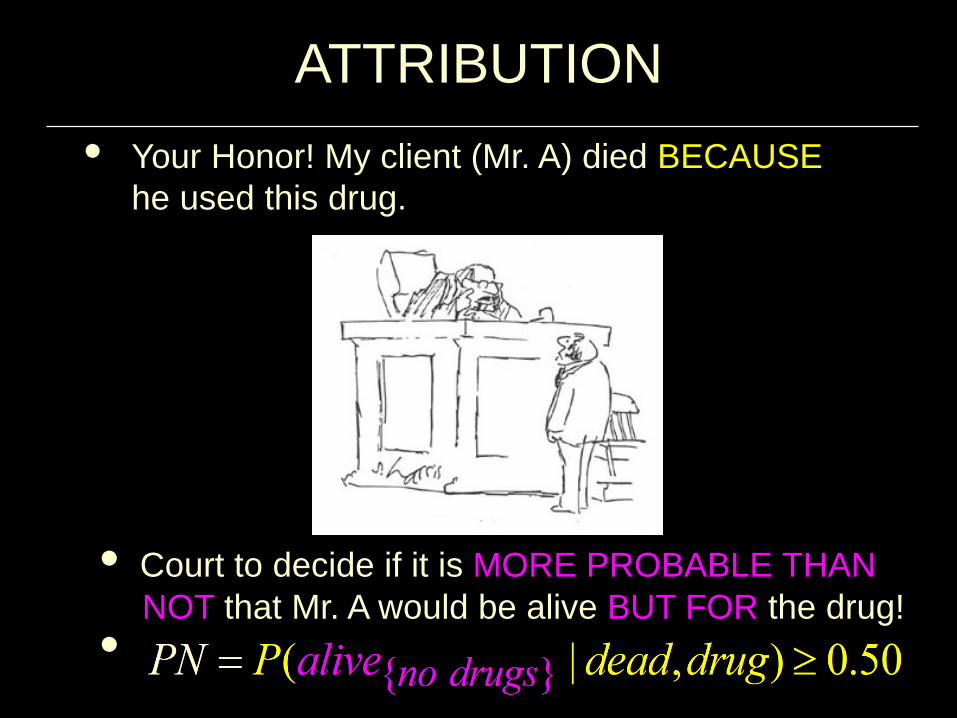
• Your Honor! My client (Mr. A) died BECAUSEhe used this drug.
• Court to decide if it is MORE PROBABLE THANNOT that Mr. A would be alive BUT FOR the drug!
•
ATTRIBUTION

CAN FREQUENCY DATA DETERMINE LIABILITY?
• WITH PROBABILITY ONE
• Combined data tell more that each study alone
Sometimes:When PN is bounded above 0.50.
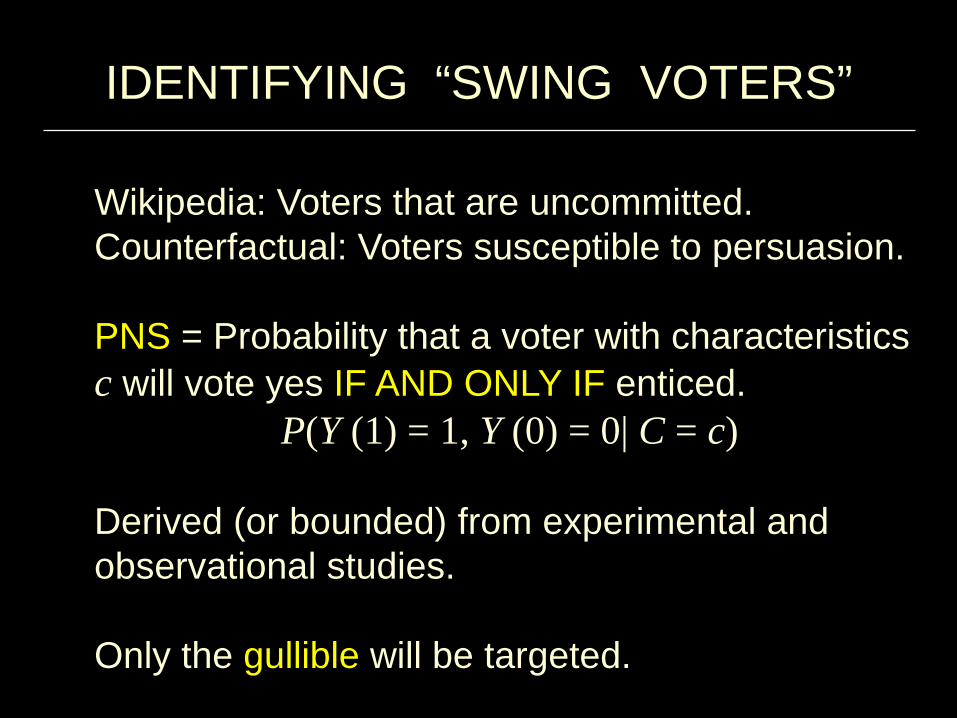
Wikipedia: Voters that are uncommitted.Counterfactual: Voters susceptible to persuasion.
PNS = Probability that a voter with characteristics c will vote yes IF AND ONLY IF enticed.
P(Y (1) = 1, Y (0) = 0| C = c)
Derived (or bounded) from experimental and observational studies.
Only the gullible will be targeted.
IDENTIFYING “SWING VOTERS”
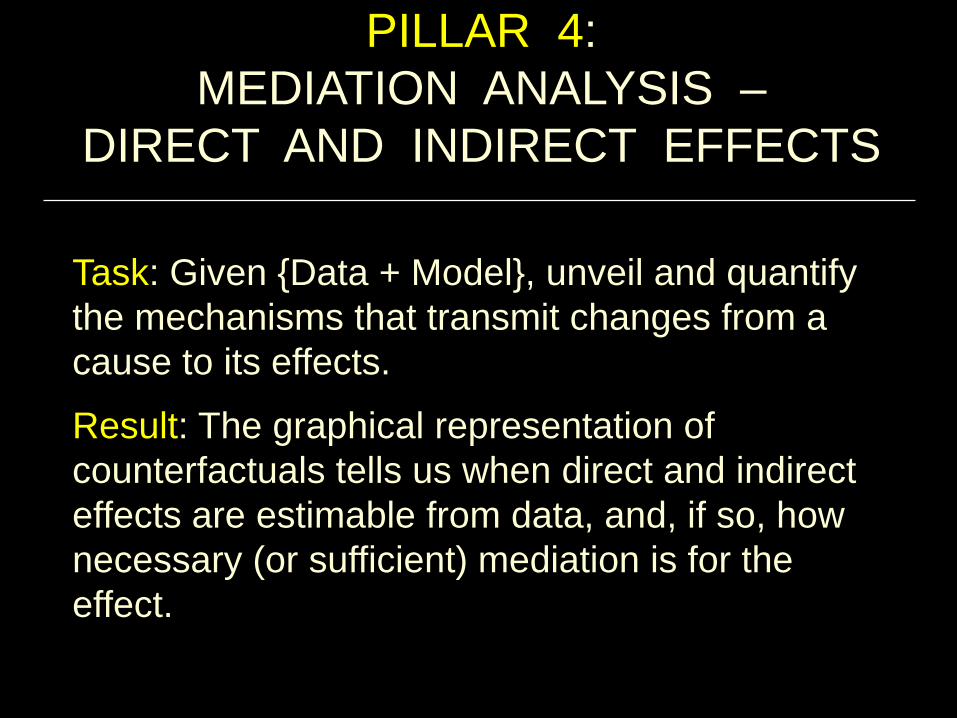
PILLAR 4: MEDIATION ANALYSIS –
DIRECT AND INDIRECT EFFECTS
Task: Given {Data + Model}, unveil and quantify the mechanisms that transmit changes from a cause to its effects.
Result: The graphical representation of counterfactuals tells us when direct and indirect effects are estimable from data, and, if so, how necessary (or sufficient) mediation is for the effect.
X M
Y
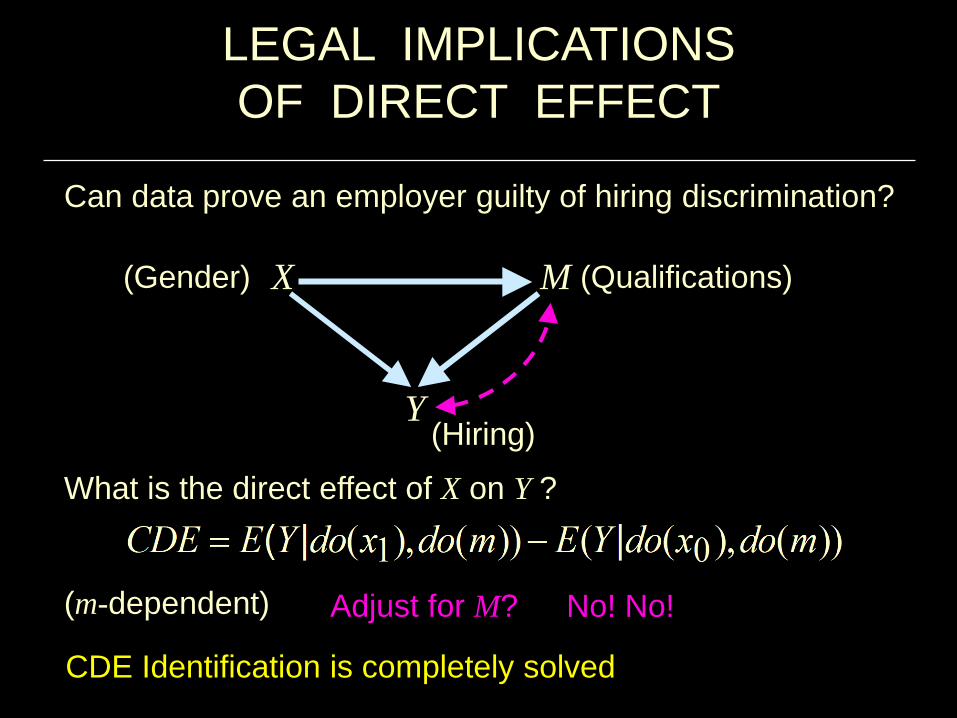
LEGAL IMPLICATIONSOF DIRECT EFFECT
What is the direct effect of X on Y ?
(m-dependent)
(Qualifications)
(Hiring)
(Gender)
Can data prove an employer guilty of hiring discrimination?
Adjust for M?
CDE Identification is completely solved
No! No!
43
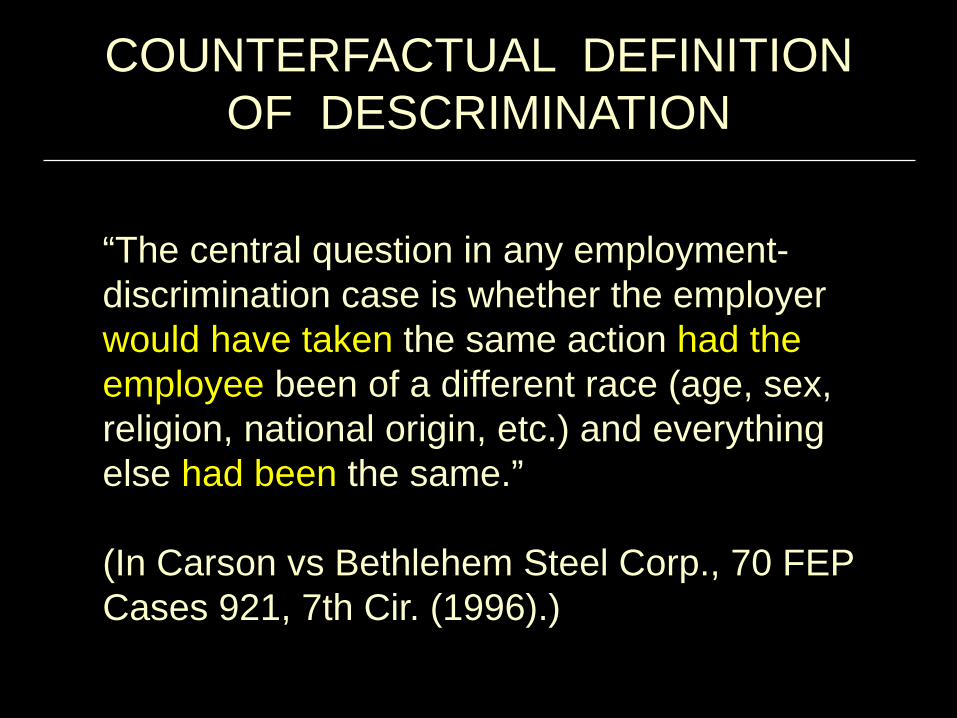
COUNTERFACTUAL DEFINITIONOF DESCRIMINATION
“The central question in any employment-discrimination case is whether the employer would have taken the same action had the employee been of a different race (age, sex, religion, national origin, etc.) and everything else had been the same.”
(In Carson vs Bethlehem Steel Corp., 70 FEP Cases 921, 7th Cir. (1996).)
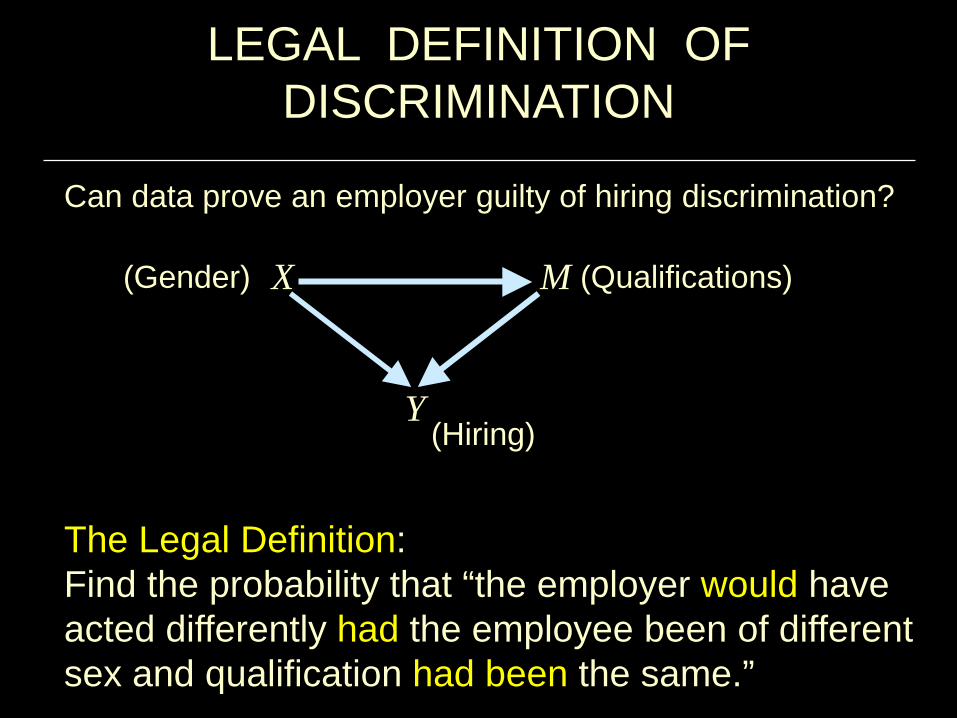
X M
Y
LEGAL DEFINITION OF DISCRIMINATION
(Qualifications)
(Hiring)
(Gender)
Can data prove an employer guilty of hiring discrimination?
The Legal Definition:Find the probability that “the employer would have acted differently had the employee been of different sex and qualification had been the same.”
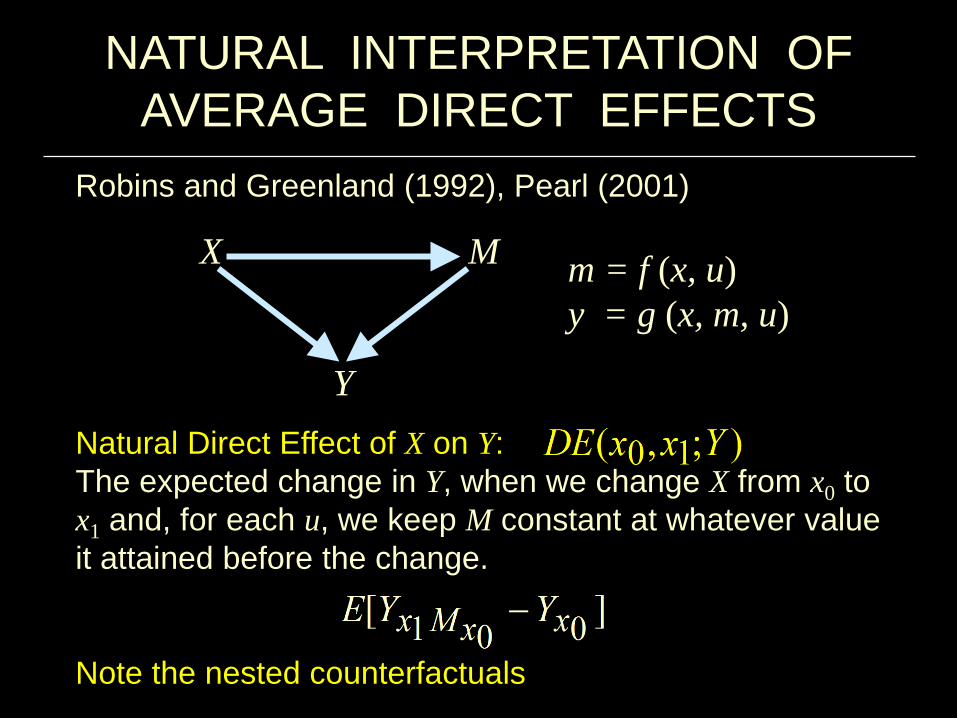
m = f (x, u)y = g (x, m, u)
X M
Y
NATURAL INTERPRETATION OFAVERAGE DIRECT EFFECTS
Natural Direct Effect of X on Y:The expected change in Y, when we change X from x0 to x1 and, for each u, we keep M constant at whatever value it attained before the change.
Note the nested counterfactuals
Robins and Greenland (1992), Pearl (2001)
The problem
• How to combine results of several experimentaland observational studies, each conducted on a different population and under a different set of conditions,
• so as to construct a valid estimate of effect size in yet a new population, unmatched by any of those studied.
PILLAR 5: GENERALIZABILITYAND DATA FUSION

(b) New York
Survey data
Resembling target
(c) Los Angeles
Survey data
Younger population
(e) San Francisco
High post-treatment blood pressure
(d) Boston
Age not recorded
Mostly successful lawyers
(f) Texas
Mostly Spanish subjects
High attrition
(h) Utah
RCT, paid volunteers, unemployed
(g) Toronto
Randomized trial
College students
(i) Wyoming
RCT, young athletes
THE PROBLEM IN REAL LIFETarget population Query of interest: Q = P*(y | do(x))(a) Arkansas
Survey data available
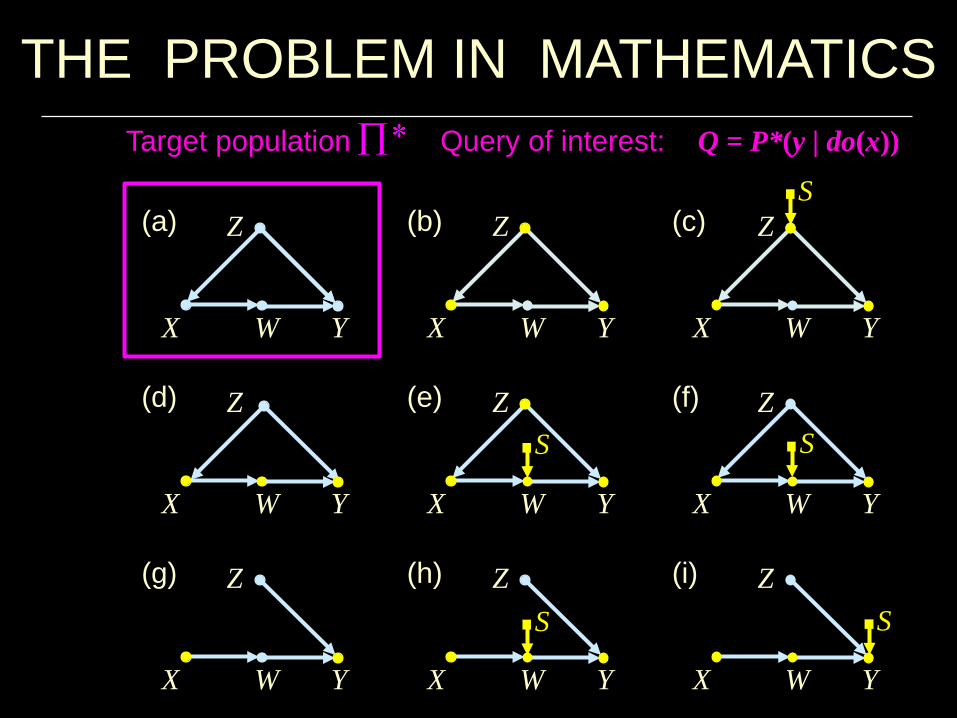
X Y
(f) Z
W
X Y
(b) Z
W X Y
(c) ZS
WX Y
(a) Z
W
X Y
(g) Z
W
X Y
(e) Z
W
S S
X Y
(h) Z
W X Y
(i) ZS
W
S
X Y
(d) Z
W
THE PROBLEM IN MATHEMATICSTarget population Query of interest: Q = P*(y | do(x))
PILLAR 6: MISSING DATA (Mohan, 2017)
Problem: Given data corrupted by missing values and a model of what causes missingness. Determine when relations of interest can be estimated consistently “as if no data were missing.”
Results: Graphical criteria unveil when estimability is possible, when it is not, and how.
Missing Data is a causal problem.
PILLAR 7: CAUSAL DISCOVERY
Task: Search for a set of models (graphs) that are compatible with the data, and represent them compactly.
Results: In certain circumstances, and under weak assumptions, causal queries can be estimated directly from this compatibility set.
(Spirtes, Glymour and Scheines (2000); Jonas Peters etal (2018))
CONCLUSIONS
“More has been learned about causal inference in the last few decades than the sum total of everything that had been learned about it in all prior recorded history.”
(Gary King, Harvard, 2014)
The peak of this revolution is still ahead of us(social intelligence, free-will, compassion).
UCLA has all the credentials to be its epi-center.
THANK YOU
Joint work with: Elias BareinboimKarthika MohanIlya ShpitserJin TianMany more . . .
Paper available: http://ftp.cs.ucla.edu/pub/stat_ser/r475.pdfRefs: http://bayes.cs.ucla.edu/jp_home.html
Time for a short commercial

For a trailer, click WHY on my home page.
