interpreting cgm data - american diabetes association · june 22, 2018 16 june 22, 2018 17 cgm...
TRANSCRIPT
INTERPRETING CGM DATA
Richard M. Bergenstal, MD
Executive Director
International Diabetes Center
Park Nicollet and HealthPartners Institute
Minneapolis, MN
June 22, 2018 2
• I have participated in clinical research, been a member of a
scientific advisory board, or served as a consultant for Abbott
Diabetes Care, Dexcom, Eli Lilly and Company, Hygieia, Johnson &
Johnson, Medtronic, Novo Nordisk, Onduo, Roche, Sanofi, and
United HealthCare.
• I have been a stock shareholder in Merck.
• I am a volunteer for the American Diabetes Association and JDRF.
• My institution receives National Institutes of Health funding for
closed-loop studies.
• My employer, the nonprofit HealthPartners Institute, contracts for
my services, and I receive no personal income from these activities.
DISCLOSURES
June 22, 2018 3
INTERPRETING CGM DATA
Using CGM data to guide:
• Starting and adjusting diabetes medications
• Establishing a therapeutic action plan
• A plan to: TIR and TIHypo
• Use CGM to: A1C and TIHypo

CGM Metrics
AGP:
Patterns
Daily Glucose Views
12 Pages
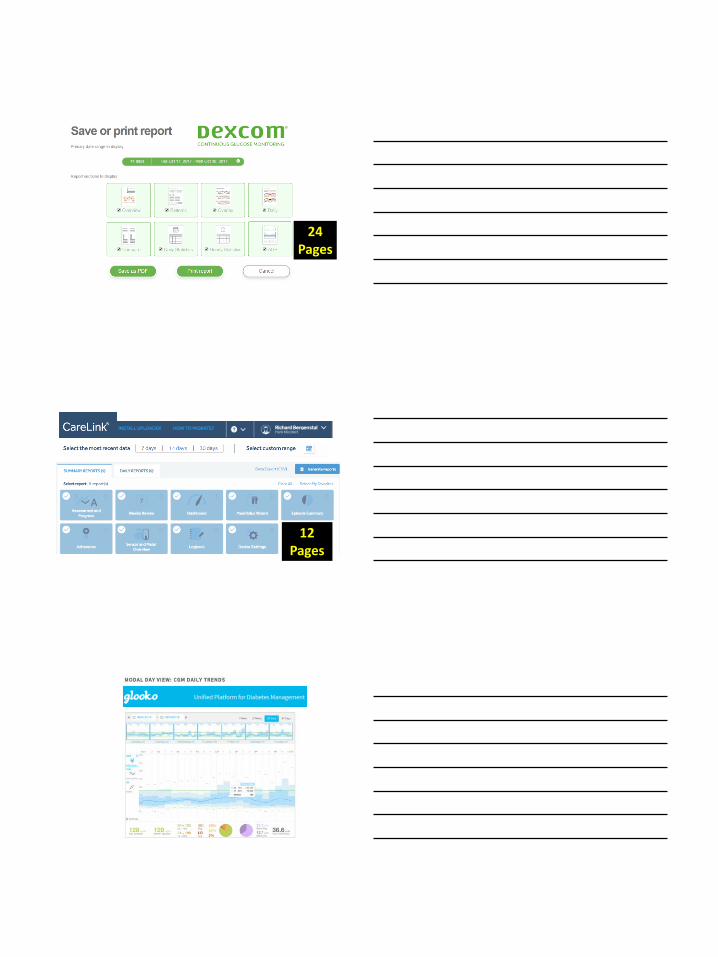
24 Pages
12 Pages

June 22, 2018 11
June 22, 2018 12
June 22, 2018 13
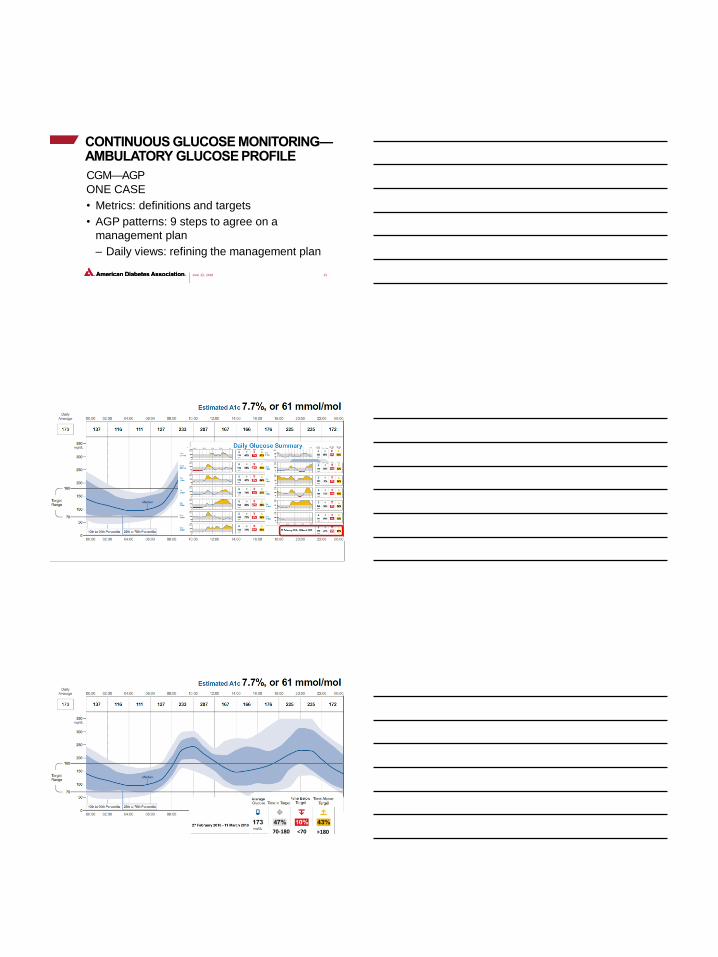
ONE CASE
• Metrics: definitions and targets
• AGP patterns: 9 steps to agree on a
management plan
– Daily views: refining the management plan
CONTINUOUS GLUCOSE MONITORING—AMBULATORY GLUCOSE PROFILE
CGM—AGP
June 22, 2018 14
June 22, 2018 15<70 >18070-180
June 22, 2018 16
June 22, 2018 17
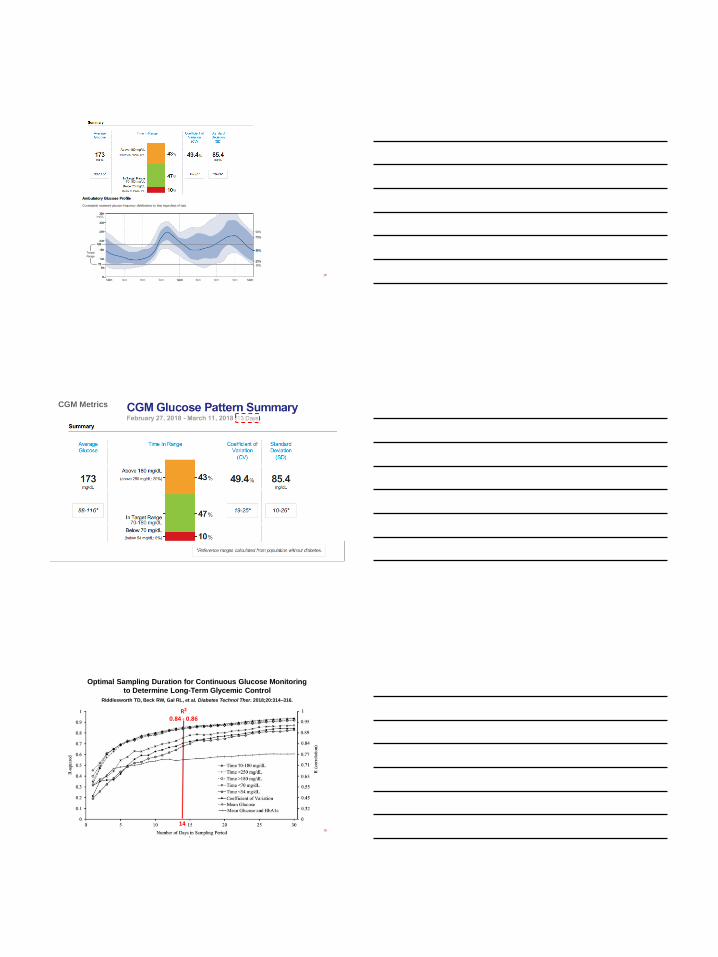
CGM Metrics
June 22, 2018 18
14
R2
0.84 - 0.86
Optimal Sampling Duration for Continuous Glucose Monitoring
to Determine Long-Term Glycemic Control
Riddlesworth TD, Beck RW, Gal RL, et al. Diabetes Technol Ther. 2018;20:314–316.

June 22, 2018 19
CGM Metrics
June 22, 2018 20
most studies AG is
99–100 mg/dLin normals
Mazze RS, Strock E, Wesley D, et al. Diabetes Technol Ther. 2008;10:149–159.
33 Individuals without diabetes (CGM Normal Study )
Insert Date 21
CGM Metrics
?

June 22, 2018 22
June 22, 2018 23
Estimated A1C
(eA1C)
7.7%
(61 mmol/mol)
June 22, 2018 24
Glucose Management
Indicator (GMI) *
7.7%
(61 mmol/mol)
*GMI proposed to FDA and diabetes community to replace eA1C

June 22, 2018 25
4%
6%
Level 2 hyperglycemia
Level 1 hyperglycemia
Level 1 hypoglycemia
Level 2 hypoglycemia
(Hypoglycemia Alert)
(Immediate Action)
June 22, 2018 26
4%
6%
5%
20%
72%
2%1%
25%
72%
3%
Advanced Technology
670G HCL Data
HCL, hybrid closed-loop.
Bergenstal RM, Garg S, Weinzimer SA, et al. JAMA. 2016;316:1407–1408.
June 22, 2018 27
TIME IN RANGE AND A1C CORRELATION
Measured TIR
A1C 95% CI
40% 8.1% 7.1-9.1%
50% 7.7% 6.7-8.7%
60% 7.3% 6.3-8.3%
70% 6.9% 5.9-7.9%
80% 6.5% 5.5-7.5%
R. Beck, personal communication; secondary analysis of data from Beck RW, Connor CG, Mullen DM, Wesley DM,
Bergenstal RM. Diabetes Care. 2017;40:994–999.
Δ = 0.4%
Δ = 0.4%
Δ = 0.4%
Δ = 0.4%

June 22, 2018 28
Does Time-in-Range Matter? Perspectives From People With
Diabetes in the Success of Current Therapies and the
Drivers of Improved Outcomes
Runge AS, Kennedy L, Brown AS, et al. Clin Diabetes. 2018;36:112–119.
June 22, 2018 29
Glucose Management
Indicator (GMI) *
7.7%
(61 mmol/mol)
*GMI proposed to FDA & Diabetes Community to replace eA1c
*GMI proposed to FDA and diabetes community to replace eA1C
June 22, 2018 30
MEASURES OF GLUCOSE VARIABILITY
StableGlucose Profile
SD < AG/3
Hirsch IB, Amiel SA, Blumer IR, et al. Diabetes Technol Ther. 2012;14:973–983.
Stable Glucose Profile
<36%
Monnier L, Colette C, Wojtusciszyn A, et al. Diabetes Care. 2017;40:832–838.

June 22, 2018 31
Glucose Management
Indicator (GMI) *
7.7%
Daily Glucose Summary
NINE STEPS TO INTERPRETING AN AGP
Carlson AL, Mullen DM, Bergenstal RM. Clinical use of
continuous glucose monitoring in adults with type 2 diabetes.
Diabetes Technol Ther. 2017;19(Suppl. 2):S4–S11.
June 22, 2018 32
Interpreting
an AGP:
Nine Steps Step 1: Check for
adequate data. ✓Glucose Management
Indicator (GMI) *
7.7%
June 22, 2018 33
✓
62 yo. ;T2D for 15 yrs.; No hx. of known CVD; 90 kg; eGFR >60
✓Step 2: Mark up the AGP, noting factors that may
affect the management plan.
Metformin 1,000 mg 1,000mg
Degludec 20 U
Lispro 10 U 8U 12U
W B l D BTx x x x snack
7 11 5 8

June 22, 2018 34
✓
62 yo. ;T2D for 15 yrs.; No hx. of known CVD; 90 kg; eGFR >60
✓ Step 3: Ask the patient “What do you see?” Listen.
Metformin 1,000 mg 1,000mg
Degludec 20 U
Lispro 10 U 8U 12U
W B l D BTx x x x snack
7 11 5 8
4%
6%
5%
20%
72%
2%1%
Corr. Factor
June 22, 2018 35
✓
62 yo. ;T2D for 15 yrs.; No hx. of known CVD; 90 kg; eGFR >60
Step 4: Look for patterns of low glucose levels.
Metformin 1,000 mg 1,000mg
Degludec 20 U
Lispro 10 U 8U 12U
W B l D BTx x x x snack
7 11 5 8
1
June 22, 2018 36
✓
62 yo. ;T2D for 15 yrs.; No hx. of known CVD; 90 kg; eGFR >60
Step 4: Look for patterns of low glucose levels.
Metformin 1,000 mg 1,000mg
Degludec 20 U
Lispro 10 U 8U 12U Corr.Factor
Treat the CLOUD!
16
CF
W B l D BTx x x x snack
7 11 5 8
1 2

June 22, 2018 38
✓
62 yo. ;T2D for 15 yrs.; No hx. of known CVD; 90 kg; eGFR >60
✓
Metformin 1,000 mg 1,000mg
Degludec 20 U
Lispro 10 U 8U 12U Corr.Factor
Treat the CLOUD!
16
CFpre-meal
CF
W B l D BTx x x x snack
7 11 5 8
1 2
Step 4: Look for patterns of low glucose levels.
June 22, 2018 39
✓
62 yo. ;T2D for 15 yrs.; No hx. of known CVD; 90 kg; eGFR >60
✓
Metformin 1,000 mg 1,000mg
Degludec 20 U
Lispro 10 U 8U 12U Corr.Factor
16
CF
Step 5: Look for patterns of high glucose levels.
pre-meal
?13 CF
W B l D BTx x x x snack
7 11 5 8
12

June 22, 2018 40
✓
62 yo. ;T2D for 15 yrs.; No hx. of known CVD; 90 kg; eGFR >60
✓
Metformin 1,000 mg 1,000mg
Degludec 20 U
Lispro 10 U 8U 12U Corr.Factor
16
CFpre-meal
?13
Step 6: Look for areas of wide glucose variability.
CF
GV is about timing or amount
• Timing: insulin and meals, weekday and weekend, snacks, exercise, stress
• Amount: insulin (daily dose or carb counting), insulin:carb ratio, exercise intensity
GV
W B l D BTx x x x snack
7 11 5 8
June 22, 2018 41
✓
62 yo. ;T2D for 15 yrs.; No hx. of known CVD; 90 kg; eGFR >60
✓
Metformin 1,000 mg 1,000mg
Degludec 20 U
Lispro 10 U 8U 12U Corr.Factor
16
CFpre-meal
?13 CF
Step 7: Compare to past AGP and reinforce successful strategies.
4%6%
W B l D BTx x x x snack
7 11 5 8
June 22, 2018 42
✓
62 yo. ;T2D for 15 yrs.; No hx. of known CVD; 90 kg; eGFR >60
✓
Metformin 1,000 mg 1,000mg
Degludec 20 U
Lispro 10 U 8U 12U Corr.Factor
16
CFpre-meal
?13 CF
Step 8: Agree on an action plan with patient.
4%6%
15%
31%
50%
3 %1 %
W B l D BTx x x x snack
7 11 5 8
Action Plan:
1. Get rid lows overnight: long-acting insulin + correction factor
2. Reduce variability: insulin timing, amount of food, consider carb counting
3. As you treat the cloud, remember to look forward 12–18 hours for
secondary effects on glucose
4. As you treat lows first, small or no in TIR initially so schedule repeat
look at 2-week profile soon to address highs (series of 3–4 adjustments)
5. Continue using CGM (real-time or retrospective intermittently)
• If real-time CGM: also teach how to use trend arrows

June 22, 2018 4362 yo. ;T2D for 15 yrs.; No hx. of known CVD; 90 kg; eGFR >60
✓
Metformin 1,000 mg 1,000mg
Degludec 20 U
Lispro 10 U 8U 12U Corr.Factor
16
CFpre-meal
CF
Step 9: Copy the AGP for the patient and the EMR.
W B l D BTx x x x snack
7 11 5 8
June 22, 2018 44
Thank You