interpreting pan-concentrate analyses of stream sediments ... · interpreting pan-concentrate...
TRANSCRIPT
GEOLOGICAL SURVEY CIRCULAR 592
Interpreting Pan-Concentrate
Analyses of Stream Sediments in
Geochemical Exploration for Gold

Interpreting Pan-Concentrate
Analyses of Stream Sediments in
Geochemical Exploration for Gold
By R. P. Fischer and F. 5. Fisher
G E 0 L 0 G I C A L S U R V E Y C I R C U l A R 592
Washington 1968
United States Department of the Interior WALTER J. HICKEL, Secretory
Geological Survey William T. Pecora, Director
First printing 1 968
Second printing 1969
Free on application to the U.S. Geological Survey, Washington, D.C. 20242
Abstract- - - - - - - - - - - - - - - - - - -Introduction- - - - - - - - - - - - - - - - -Sampling and analytical techniques- - - - -Sample data and analytical results - - - - -
Consistency of analytical results - - - -
CONTENTS
Page
1 1 1 2 2
Sample data and analytical results--Continued Quantitative compatibility of samples
with known geologic relations - - - - -Conclusions - - - - - - - - - - - - - - - - -Reference cited- - - - - - - - - - - - - - -
ILLUSTRATIONS
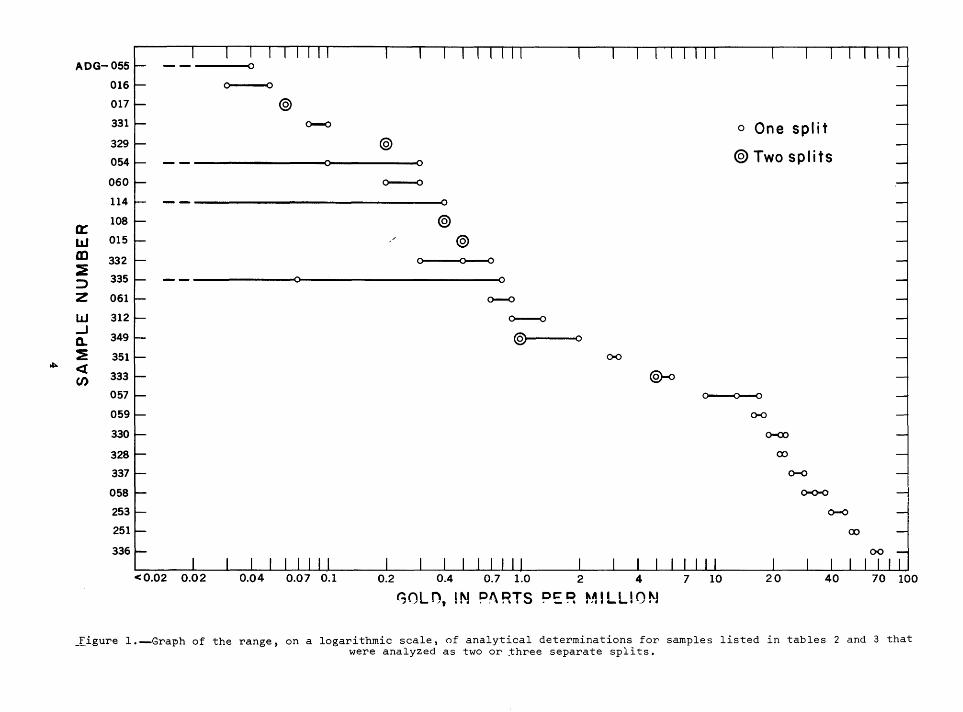
Figure 1. Graph of the range, on a logarithmic scale, of analytical determinations for samples listed in tables 2 and 3 that were analyzed as two or three separate splits - - - - - - - - - - - - - - - - - - - - - - - - - - - - - - - - - - - - - - - - - - - -
2. Map showing sample localities and character of mineralized areas in San Juan Mountains, Colo - - - - - - - - - - - - - - - - - - - - - - - - - - - - - - - - - - - - - -
TABLES
Table 1. Samples from streams draining apparently barren areas - - - - - - - - - - - - - - - - -.-2. Samples from streams draining weakly mineralized areas that contain only a few
veins and prospects or small mines - - - - - - - - - - - - - - - - - - - - - - - - - - - -3. Samples from streams draining well-mineralized areas that contain numerous
veins and some very productive mines - - - - - - - - - - - - - - - - - - - - - - - - - - -
111
Page
2 2 2
Page
4
5
Page
6
6
8

Interpreting Pan-Concentrate Analyses of Stream Sediments in
Geochemical Exploration for Gold
By R. P. Fischer and F. S. fisher
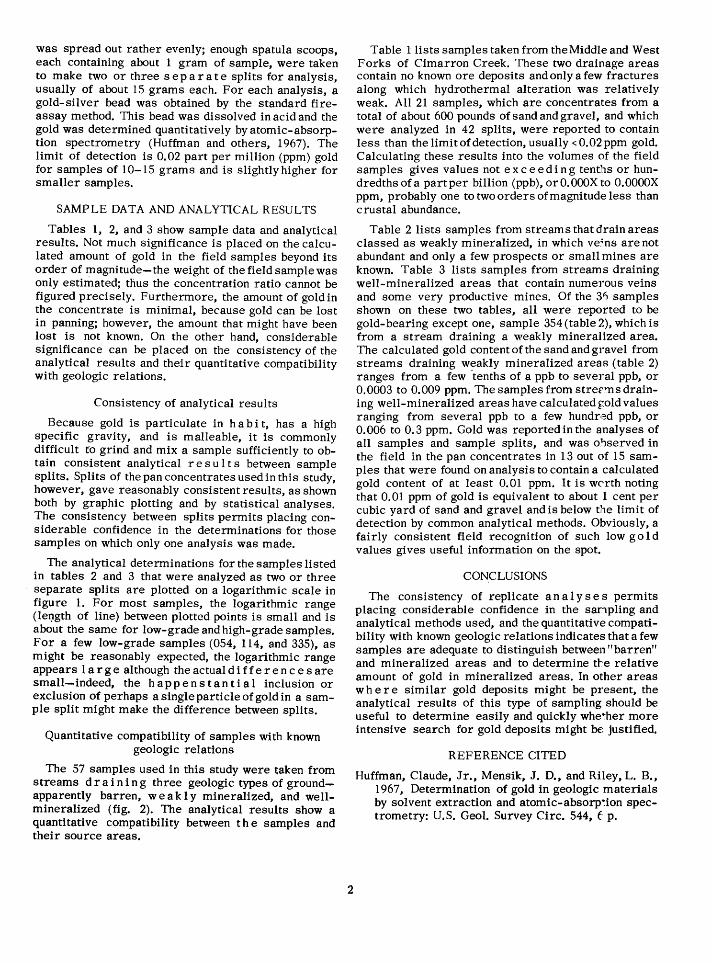
Abstract A study of methods of collecting and processing samples to de
termine whether or not gold is present in areas of moderate size was undertaken in the northwestern part of the San Juan Mountains, Colo. As part of this study, 57 samples of pan concentrates were taken from streams draining three types of areas: (1) "barren" areas, where gold mineralization might be geologically possible but no deposits are known, (2) slightly mineralized areas that contain only a few known veins and prospects and small mines, and (3) well-mineralized areas that contain numerous veins and some very productive mines. The concentrate samples were analyzed by the fire-assay-atomic-absorption method.
Replicate analyses of large samples gave results consistent enough to permit placing considerable confidence in the results obtained for smaller samples on which only one analysis was made. For general field practice, it isnecessarytopan only enough sand and gravel to yield about 15 grams of concentrate.
The analytical results are also quantitatively compatihle with known geologic relations and indicate that a few samples from a stream are adequate to distinguish between "barren" and mineralized areas and to deter m i n e the relative amount of gold in mineralized areas. In other areas of similar gold deposits, data of this type should help decide whether more intensive search for gold deposits is justified.
INTRODUCTION
As part of its Heavy Metals program to appraise and enhance domestic resources of mineral raw materials that are in short supply, the U.S. Geological Survey is studying techniques of geologic sampling and their application to mineral exploration. In 1967 a project was started in the northwestern San Juan Mountains, Colo., to study several methods of collecting and processing samples in order to determine easily and quickly whether or not gold is present in areas of a few square miles. One method tried is described here. It consisted of panning known amounts of sand and gravel from selected streams, weighing the heavymineral concentrates and analyzing them by fire assay and atomic absorption. The panning practice used did not differ from that of the oldtime prospector, but the more sensitive analytical procedure available today offers a distinct advantage. Reasonably reproducible results that seem to be quantitatively meaningful were obtained from 57 samples. This type of s amp 1 in g should be usable in other areas where similar gold deposits might be present, and the results should help decide whether more intensive search for gold deposits might be justified.
Willard Leedy and Mark Voultsos help~d in the collection and panning of samples in the field. W. D. Goss, L. B. Riley, Claude Huffman, Jr., and J. A. Thomas of the U.S. Geological Survey did the g:'lld analyses.
SAMPLING AND ANALYTICAL TEC~-INIQUES
All samples were sand and gravel from the upper part of the alluvial fill, and at each sample locality this material was taken from one or more places along the stream where placer gold is apt to accumulate, such as the head or foot of stream bars, behind boulders, in moss-covered banks, and in ratural riffles on bedrock. The samples were taken to· determine the presence of gold in the stream sediments and its relative amount; they were not adequate to determine or estimate the gold content of the streamb~d fill.
Samples were panned in the field in ll- and 14-inch gold pans. They were not weighed individually, but it was determined that the small pan contain~d about 3,500 grams (nearly 8 pounds) of sand and gra,·~l when filled and the large pan, about 7,000 gramf' (nearly 16 pounds). Samples ranged in size from those thatfilled only one small pan to those th~t filled seven or eight pans of both sizes and totaled 40,000 to 50,000 grams, or about 1 00 pounds. The samples were concentrated by panning until most ofthe light-colored(light weight) mineral grains were washed from the pan. Concentrates consisted mostly ofdark-ccloredheavy minerals, commonly with some fresh sulfides, mainly pyrite. At each locality where twoormor~pans of sand and gravel were taken, the concentrates from each pan were combined into one sample for anal~·sis. Samples of concentrate ranged in weight from a fe·111 grams to as much as 775 grams. Some samples were panned by one person alone; others, by two, three, cr four people.
In the 1 a b o r at o r y, concentrate sam pies weighing more than about 50 grams were split in a Jones splitter to samples of about 50 grams. Using ceramic plates, these 50-gram splits were then ground to about 80 to 100- mesh. If the original concentrate sa-nple was less than about 50 grams, the entire sample was ground. If the ground sample weighed less than ab:>ut 15 grams, the whole sample was analyzed in one run. If the ground sample weighed more than about 15 grams, it was poured into a cone-shaped pile on a fla': surface, and
was spread out rather evenly; enough spatula scoops, each containing about 1 gram of sample, were taken to make two or three separate splits for analysis, usually of about 15 grams each. For each analysis, a gold-silver bead was obtained by the standard fireassay method. This bead was dissolved in acid and the gold was determined quantitatively by atomic-absorption spectrometry (Huffman and others, 1967). The limit of detection is 0.02 part per million (ppm) gold for samples of 10-15 grams and is slightlyhigher for smaller samples.
SAMPLE DATA AND ANALYTICAL RESULTS
Tables 1, 2, and 3 show sample data and analytical results. Not much significance is placed on the calculated amount of gold in the field samples beyond its order of magnitude- the weight of the field sample was only estimated; thus the concentration ratio cannot be figured precisely. Furthermore, the amount of gold in the concentrate is minimal, because gold can be lost in panning; however, the amount that might have been lost is not known. On the other hand, considerable significance can be placed on the consistency of the analytical results and their quantitative compatibility with geologic relations.
Consistency of analytical results
Because gold is particulate in habit, has a high specific gravity, and is malleable, it is commonly difficult to grind and mix a sample sufficiently to obtain consistent analytical res u 1 t s between sample splits. Splits of the pan concentrates used in this study, however, gave reasonably consistent results, as shown both by graphic plotting and by statistical analyses. The consistency between splits permits placing considerable confidence in the determinations for those samples on which only one analysis was made.
The analytical determinations for the samples listed in tables 2 and 3 that were analyzed as two or three separate splits are plotted on a logarithmic scale in figure 1. For most samples, the logarithmic range (le~gth of line) between plotted points is small and is about the same for low-grade and high-grade samples. For a few low-grade samples (054, 114, and 335), as might be reasonably expected, the logarithmic range appears I a r g e although the actual differences are small-indeed, the happens tan t i a 1 inclusion or exclusion of perhaps a single particle of gold in a sample split might make the difference between splits.
Quantitative compatibility of samples with known geologic relations
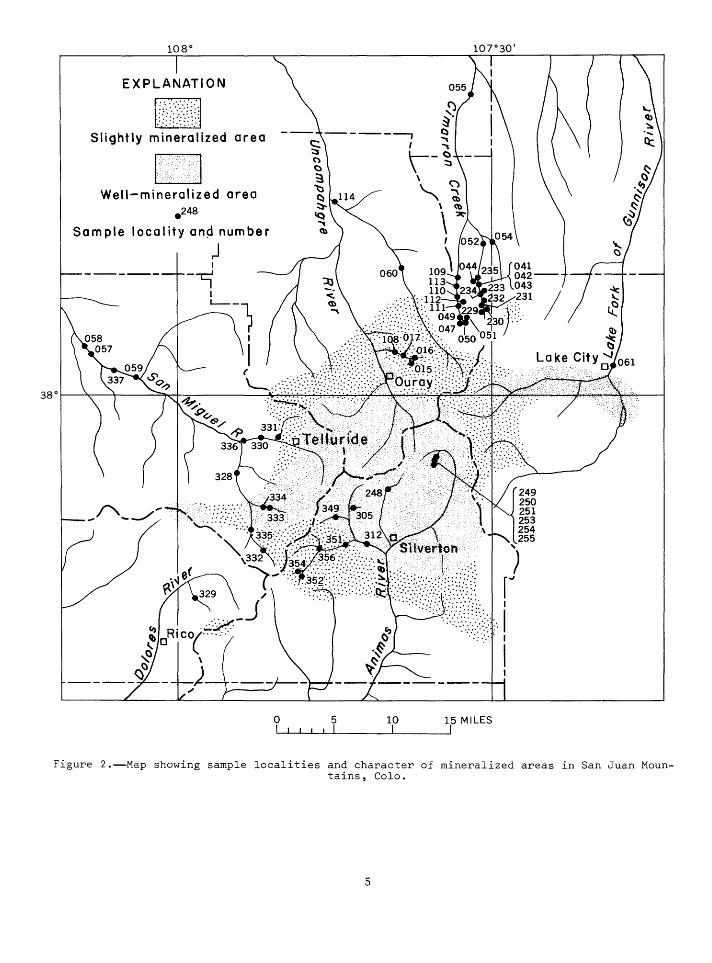
The 57 samples used in this study were taken from streams draining three geologic types of groundapparently barren, weak 1 y mineralized, and wellmineralized (fig. 2). The analytical results show a quantitative compatibility between the samples and their source areas.
2
Table 1 lists samples taken from the Middle and West Forks of Cimarron Creek. These two drainage areas contain no known ore deposits and only a few fractures along which hydrothermal alteration was relatively weak. All 21 samples, which are concentrates from a total of about 600 pounds of sand and gravel, and which were analyzed in 42 splits, were reported to contain less than the limit of detection, usually< 0.02 ppm gold. Calculating these results into the volumes of the field samples gives values not exceeding tenths or hundredths of a part per billion (ppb), or O.OOOX to O.OOOOX ppm, probably one to two orders of magnitude less than crustal abundance.
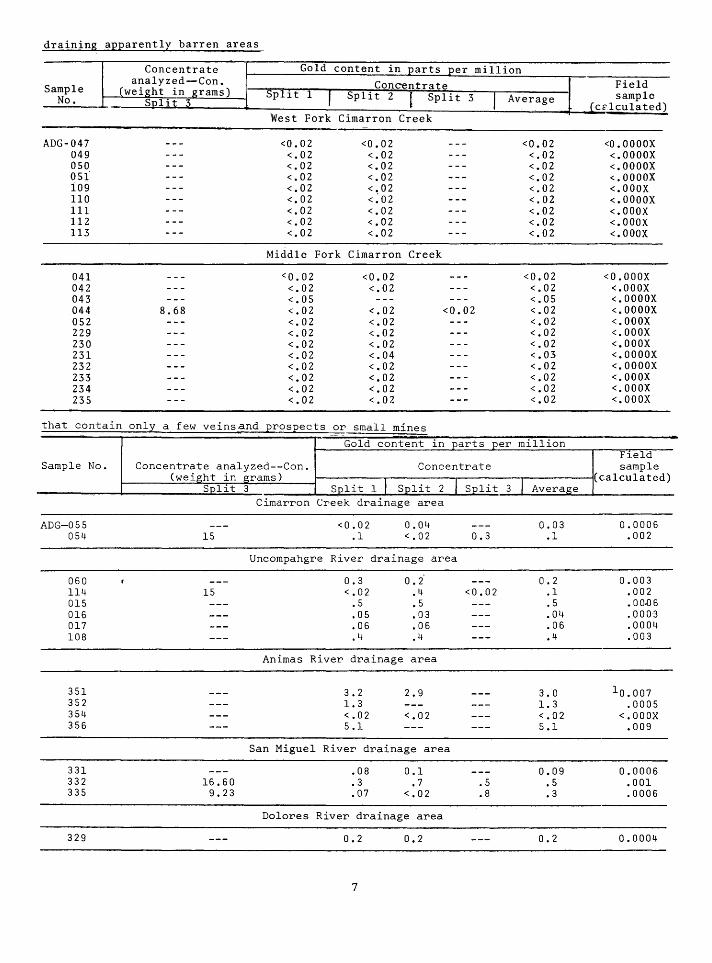
Table 2 lists samples from streams that drain areas classed as weakly mineralized, in which ve~ns are not abundant and only a few prospects or small mines are known. Table 3 lists samples from streams draining well-mineralized areas that contain numerous veins and some very productive mines. Of the 31) samples shown on these two tables, all were reported to be gold-bearing except one, sample 354 (table 2), which is from a stream draining a weakly mineralized area. The calculated gold content of the sand and gravel from streams draining weakly mineralized areas (table 2) ranges from a few ·tenths of a ppb to several ppb, or 0.0003 to 0.009 ppm. The samples from streE'ms draining well-mineralized areas have calculatedr-old values ranging from several ppb to a few hundr1ed ppb, or 0. 006 to 0. 3 ppm. Gold was reported in the analyses of all samples and sample splits, and was o:':>served in the field in the pan concentrates in 13 out of 15 samples that were found on analysis to contain a calculated gold content of at least 0.01 ppm. It is WC'rth noting that 0.01 ppm of gold is equivalent to about 1 cent per cubic yard of sand and gravel and is below the limit of detection by common analytical methods. Obviously, a fairly consistent field recognition of such low go 1 d values gives useful information on the spot.
CONCLUSIONS
The consistency of replicate an a I y s e s permits placing considerable confidence in the sanpling and analytical methods used, and the quantitative compatibility with known geologic relations indicates that a few samples are adequate to distinguish between "barren" and mineralized areas and to determine tte relative amount of gold in mineralized areas. In other areas where similar gold deposits might be present, the analytical results of this type of sampling should be useful to determine easily and quickly whe':her more intensive search for gold deposits might be justified.
REFERENCE CITED
Huffman, Claude, Jr., Mensik, J. D., and Riley, L. B., 1967, Determination of gold in geologic materials by solvent extraction and atomic-absorp':ion spectrometry: U.S. Geol. Survey Circ. 544, f p.
FIGURES 1, 2 AND TABLES 1-3
~
ADG-055
016
017
331
329
054
060
114
0:: 108
LLJ 015 m 332 :E :::> 335
z 061
w 312 _J
349 Q..
~ 351 <I (J) 333
057
059
330
328
337
058
253
251
336
o----<>
© ()-()
@
-------------<>-------o o---<>
---------------------o ©
'/ © ~
----------a------------------o o--o
o---o (0'1 0
0()
@-o
<0.02 0.02 0.04 0.07 0.1 0.2 0.4 0.7 1.0 2 4
GOLn, IN ?!\RTS PER ~J1!LLION
o One split
(§)Two splits
o---o--o
o-o
<><X>
00
o-o
o-o-o
o-o
7 10 2.0 40
00
70 100
_[igure 1.--Graph of the range, on a logarithmic scale, of analytical determinations for samples listed in tables 2 and 3 that were analyzed as two or ~hree separate splits.
EXPLANATION
~ Slightly mineralized area
UJ "
. "
Well-mineralized area
Sample
--- -------, § C)
0 3 "tJ I:) ::,. q
"" Q)
0 5 I I I I I I
10 I
15 MILES I
Figure 2.--Map showing sample localities and character of mineralized areas in San Juan Mountains, Colo.
5
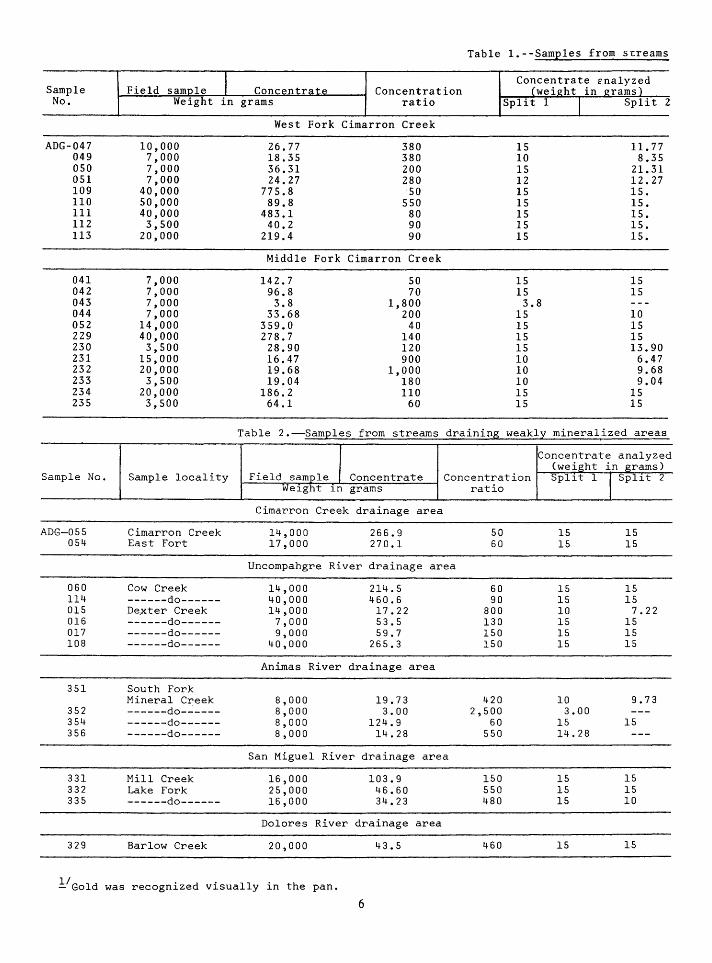
Table I.--Samples from s~reams
Sample Field sample I Concentrate ~nalyzed Concentrate Concentration (weillht in llrams)
No. Weight in grams ratio Split 1 I Split 2
West Fork Cimarron Creek
ADG-047 10,000 26.77 380 IS 11.77 049 7,000 18.3S 380 10 8.3S oso 7,000 36.31 200 IS 21.31 OS! 7,000 24.27 280 12 12.27 109 40,000 77S.8 so IS IS. 110 so,ooo 89.8 sso IS 15. 111 40,000 483.1 80 IS IS. 112 3,500 40.2 90 IS IS. 113 20,000 219.4 90 IS 15.
Middle Fork Cimarron Creek
041 7,000 142.7 so 15 IS 042 7,000 96.8 70 IS IS 043 7,000 3.8 1,800 3.8 044 7,000 33.68 200 IS 10 052 14,000 359.0 40 IS IS 229 40,000 278.7 140 15 IS 230 3,SOO 28.90 120 15 13.90 231 1S,OOO 16.47 900 10 6.47 232 20,000 19.68 1,000 10 9.68 233 3,500 19.04 180 10 9.04 234 20,000 186.2 110 lS 15 23S 3,SOO 64.1 60 IS IS
Table 2 --Samples from streams draining weakly mineralized areas
Concentrate analyzed (weight in grams)
Sample No. Sample locality Field sample Concentrate Concentration Spllt 1 I Spll t 2 Welght 1n grams ratio
Cimarron Creek drainage area
ADG-055 Cimarron Creek 14,000 266.9 50 15 15 054 East Fort 17,000 270.1 60 15 15
Uncompahgre River drainage area
060 Cow Creek 14,000 214.5 60 15 15 114 ------do------ 40,000 460.6 90 15 15 015 De.xter Creek 14,000 17.22 800 10 7.22 016 ------do------ 7,000 53.5 130 15 15 017 ------do------ 9,000 59.7 150 15 15 108 ------do------ 40,000 265.3 150 15 15
Animas River drainage area
351 South Fork Mineral Creek 8,000 19.73 420 10 9.73
352 ------do-_: ____ 8,000 3.00 2,500 3.00 354 ------do------ 8,000 124.9 60 15 15 356 ------do------ 8,000 14.28 550 14.28
San Miguel River drainage area
331 Mill Creek 16,000 103.9 150 15 15 332 Lake Fork 25,000 46.60 550 15 15 335 ------do------ 16,000 34.23 480 15 10
Dolores River drainage area
329 Barlow Creek 20,000 43.5 460 15 15
!/Gold was recognized visually in the pan.
6
draining apparently barren areas
Concentrate Gold content in parts per million
Sample analyzed-Con. Concentrate I Field
No. (weight in grams) Spl1t 1 I Split 2 ( Split 3 I Average l sample
Solit 3 (c~lculated) West Fork C1marron Creek
ADG-047 <0.02 <0.02 <0.02 <0. oooox 049 <.02 <.02 <.02 <.OOOOX 050 <.02 <.02 <.02 <.OOOOX 05i <.02 <.02 <.02 <.OOOOX :i09 <.02 <.02 <.02 <.OOOX 110 <.02 <~02 <.02 <.OOOOX 111 <.02 <.02 <.02 <.OOOX 112 <.02 <,02 <.02 <.OOOX 113 <.02 <.02 <.02 <.OOOX
Middle Fork Cimarron Creek
041 <0.02 <0.02 <0.02 <O.OOOX 042 <.02 <.02 <.02 <.OOOX 043 <.05 <.OS <.OOOOX 044 8.68 <.02 <.02 <0.02 <.02 <.OOOOX 052 <.02 <.02 <.02 <.OOOX 229 <.02 <.02 <.02 <.OOOX 230 <.02 <.02 <.02 <,OOOX 231 <.02 <.04 <,03 <.OOOOX 232 <.02 <,02 <.02 <.OOOOX 233 <.02 <.02 <,02 <,OOOX 234 <.02 <.02 <.02 <,OOOX 235 <.02 <.02 <.02 <,OOOX
that contain only a few veins and prospects or small mines
Gold content in parts per million Field
Sample No. Concentrate analyzed--Con. Concentrate sample (weight in grams)
1 I I Split 3 I Average (calculated)
Sol it 3 Split Split 2 Cimarron Creek drainage area
ADG-055 <0.02 0.04 0.03 0.0006 054 15 .l <.02 0.3 .l .002
Uncompahgre River drainage area
060 0.3 0.2 0.2 0.003 114 15 <.02 .4 <0.02 .l .002 015 • 5 • 5 . 5 • 0 0.06 016 .05 .03 .04 .0003 017 .06 .06 .06 .0004 108 . 4 .4 .4 .003
Animas River drainage area
351 3. 2 2.9 3.0 lo.oo7 352 1.3 1.3 .0005 354 <.02 <.02 <.02 <.OOOX 356 5.1 5.1 .009
San Miguel River drainage area
331 .08 0.1 0.09 0.0006 332 16.60 . 3 . 7 . 5 . 5 .001 335 9.23 .07 <.02 • 8 • 3 .0006
Dolores River drainage area
329 0.2 0.2 0.2 0.0004
7
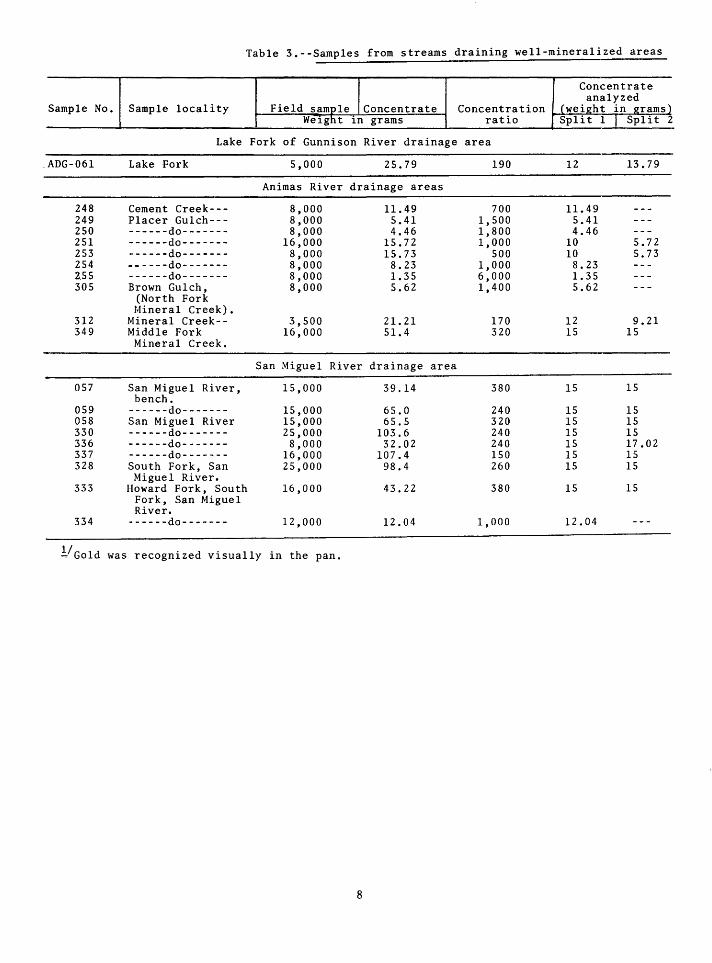
Table 3.--Samples from streams draining well-mineralized areas
Field sample !concentrate
Concentrate analyzed
Sample No. Sample locality Concentration (wei£ht in £rams) We1ght 1n grams ratio Split 1 I Split 2
Lake Fork of Gunnison River drainage area
ADG-061 Lake Fork s,ooo 2S.79 190 12 13.79
Animas River drainage areas
248 Cement Creek--- 8,000 11.49 700 11.49 249 Placer Gulch--- 8,000 5.41 1,500 5.41 2SO ------do------- 8,000 4.46 1,800 4.46 2Sl ------do------- 16,000 1S.72 1,000 10 S.72 253 ------do------- 8,000 1S.73 soo 10 S.73 254 ------do------- 8,000 8.23 1,000 8.23 ass ------do------- 8,000 1.35 6,000 1.3S 30S Brown Gulch, 8,000 S.62 1,400 S.62
(North Fork Mineral Creek).
312 Mineral Creek-- 3,500 21.21 170 12 9.21 349 Middle Fork 16,000 S1.4 320 15 lS
Mineral Creek.
San Miguel River drainage area
OS7 San Miguel River, lS,OOO 39.14 380 15 15 bench.
059 ------do------- 15,000 65.0 240 15 15 058 San Miguel River 15,000 65.5 320 15 15 330 ------do------- 25,000 103.6 240 15 1S 336 ------do------- 8,000 32.02 240 15 17.02 337 ------do------- 16,000 107.4 150 15 15 328 South Fork, San 2S,OOO 98.4 260 15 lS
Miguel River. 333 Howard Fork, South 16,000 43.22 380 15 15
Fork, San Miguel River.
334 ------do------- 12,000 12.04 1,000 12.04
.!/Gold was recognized visually in the pan,
8

that contain numerous veins and some very productive mines
Gold content in parts per million Concentrate analyzed--Con. ____ _iwe~&h!.~i7n_~2r~a~m~s~•)~------+-~~~,---r-~~~C~o~n~c~e~n~t~r~a~t~e~~~~--~~~~ Split 3 Split l 1 Spllt z 1 Spl1t 3 1 Average
15
9.14
15 15
13.22
Lake Fork of Gunnison River drainage area--Continued
0.7 0.9
Animas River drainage areas--Continued
98 41 32 52 40 45 71 9.3
1.3 2
San Miguel
9
18 43 23 71 25 23
6
River
5.8
54 47
.9 1
drainage
13
16 39 19 67 29 22
5
9
1
area--Continued
17
47 22
5
0.8
98 41 32 53 44 45 71 9.3
1.1 1.3
13
17 43 21 69 27 22
5
5.8
Field sample
(calculated)
0.004
.006
.044
!/ 0. 03
1/ T/.01 - .2 1/"09
rr 3
rr 2 - .09
!l.o1
.006
GPO 881 728