interpreting three-way interactions using sas®analytics.ncsu.edu/sesug/2008/st-139.pdf ·...
TRANSCRIPT

Paper ST-139
Interpreting Three-way Interactions Using SAS® Anh Le and Maribeth Johnson
Medical College of Georgia, Augusta, GA
ABSTRACT When factors such as treatment group, sex, or race are in interaction with a continuous variable, testing for homogeneity of slopes is straightforward. However, when there is a significant 3-way interaction between two continuous variables and a categorical variable for analysis of a continuous dependent variable, the interpretations become complex. The next step should be to look at the parameter estimates to look for trends for interpretation purposes but this is a daunting task since the interaction involves multiple continuous values. This paper will present an approach that will dichotomize one of the continuous variables at the median, obtain the parameter estimates of the slopes for the all combinations of categorical variables, and then graphically represent the separate trends across the levels of the continuous variable. The technique is then repeated for the other continuous variable. The method requires assessing two different graphs where the dependent variable is regressed over a different continuous variable in each graph. This has proven to be an easier approach for interpretation and graphically reporting of the outcomes. INTRODUCTION Adolescence is a period of rapid growth and development during which youth undergo changes in not only adiposity but also bone mineral density (BMD). This early development has life-long consequences for health. It has been shown that osteoporosis ordinarily occurs late in life due to age-related reductions in bone mineral density as shown in Figure 1 [1]. Thus, it is important to understand the influences on the development of body composition early in life. Our goal in this analysis is examine the relationship between BMD with predisposing factors such as RACE, SEX, and AGE and percent body fat (PERFAT). Figure 1. Changes in BMD with respect to age.
00.20.40.60.8
11.21.41.61.8
10 20 30 40 50 60 70 80Age
BMD
(g/sq
cm
)
MaleFemale
1

The data analyzed were from a cross-sectional study among high school youths in the Augusta area that was part of the Lifestyle, Adiposity, and Cardiovascular Health of Youths (LACHY) project [R01HL064157]. Our study (N=661) consisted of four subgroups: 169 white males, 170 white females, 163 black males, and 159 black females. All the subjects were between 13 to 19 years of age. PERFAT and BMD (g/cm2) were calculated from body composition measurements using DXA (dual-energy X-ray absorptiometry) with test-retest reliability of 0.99 [2]. EXPLORING THE DATA Using PROC UNIVARIATE, we were able to detect that BMD was not normally distributed (Kolmogorov’s p <0.0104). No common transformation was found to normalize the distribution of BMD. However, we were more interested in the distribution of the residuals of BMD when other significant predictors and perhaps interactions are in the multiple regression equation. Thus, we will examine the validity of assuming normality later. proc univariate noprint; histogram bmd/ normal cfill=ligb; inset mean std="Std Dev" normal(ksd ksdpval)/ pos=ne cfill=ligr; qqplot bmd; inset mean std="Std Dev" skewness kurtosis / cfill=ligr; run; quit;
Figure 1: BMD-PROC UNIVARIATE results.
0
5
10
15
20
25
Percent
0.84 0.9 0.96 1.02 1.08 1.14 1.2 1.26 1.32 1.38 1.44 1.5 1.56 1.62
BMD
2
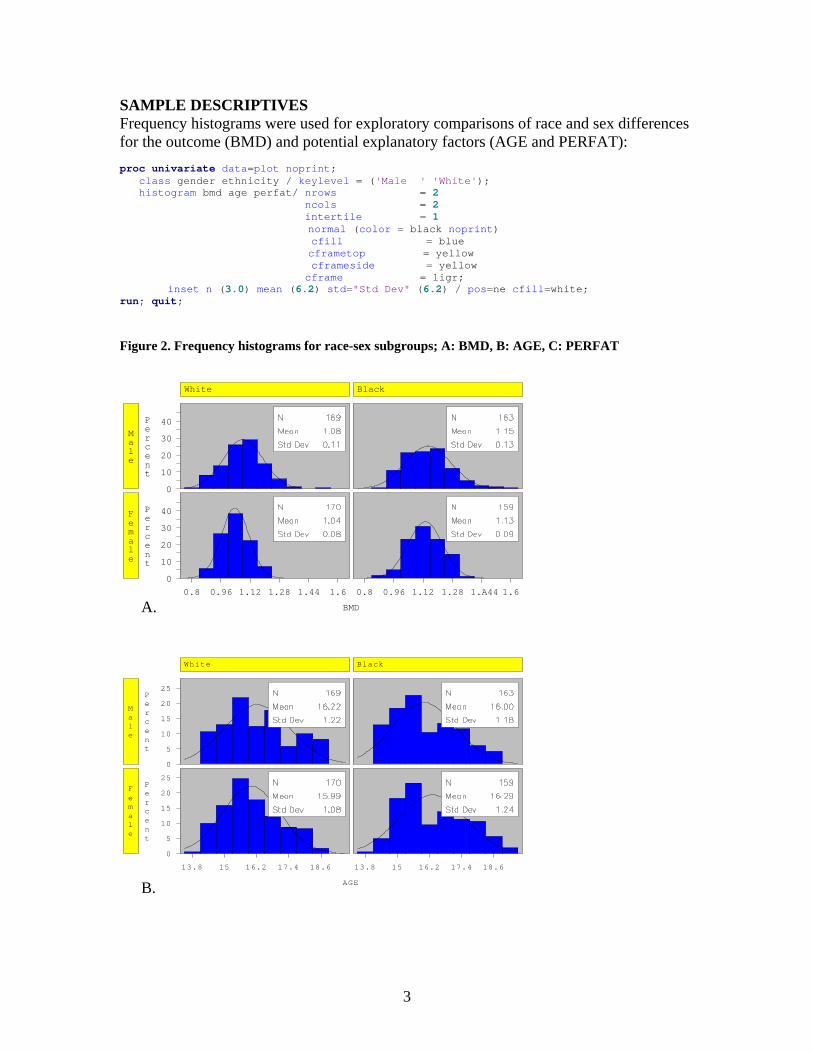
SAMPLE DESCRIPTIVES Frequency histograms were used for exploratory comparisons of race and sex differences for the outcome (BMD) and potential explanatory factors (AGE and PERFAT): proc univariate data=plot noprint; class gender ethnicity / keylevel = ('Male ' White'); ' histogram bmd age perfat/ nrows = 2 ncols = 2 intertile = 1 normal (color = black noprint) cfill = blue cframetop = yellow cframeside = yellow cframe = ligr;
inset n (3.0) mean (6.2) std="Std Dev" (6.2) / pos=ne cfill=white; run; quit;
Figure 2. Frequency histograms for race-sex subgroups; A: BMD, B: AGE, C: PERFAT
White
M a l e
0 10 20 30 40 P
e r c e n t
Black
F e m a l e
0.8 0.96 1.12 1.28 1.44 1.60 10 20 30 40 P
e r c e n t
0.8 0.96 1.12 1.28 1.A44 1.6
BMDA.
White
Male
0
5
10
15
20
25Percent
Black
Female
13.8 15 16.2 17.4 18.6
0
5
10
15
20
25Percent
13.8 15 16.2 17.4 18.6
AGE
B.
3

White
Male
0
10
20
30
40Percent
Black
Female
9 15 21 27 33 39 45 51 57
0
10
20
30
40Percent
9 15 21 27 33 39 45 51 57
PERFAT
C.
Most notable, during these adolescent years, boys had higher BMD than girls and blacks had higher BMD than whites and on average, white females had the lowest BMD. The AGE distribution should be similar for the four subgroups and it can easily be seen that it is. Males had a lower level of PERFAT with black males having the lowest levels and black females the highest. BASE MODELING A base model for BMD was developed using the demographic factors of AGE, RACE, and SEX. Interactions between these variables were also investigated. The results are in Table 1. proc glm; class race sex; model bmd=race sex age age*sex sex*race/solution; run;quit; Table 1. Base model results.
Source DF Type III SS Mean Square F Value Pr > F
RACE 1 1.1131 1.1131 126.4 <.0001
SEX 1 0.2090 0.2090 23.7 <.0001
AGE 1 0.9748 0.9748 110.7 <.0001
AGE*SEX 1 0.2375 0.2375 27.0 <.0001
RACE*SEX 1 0.0074 0.0074 0.84 0.3598
All of the main effects were significant and there was a significant AGE by SEX interaction (all p<0.0001). There was no significant RACE by SEX interaction (p = 0.4278). Therefore, the resulting base model contained AGE, SEX, RACE, and AGE by SEX interaction (F =70.6, df = (4, 656), p < 0.0001, R2 =0.30). This base model was used to assess basic demographic relationships with BMD.
4

INTERPRETING THE AGE BY SEX INTERACTION The parameter estimates from the base model helped us interpret the significant AGE by SEX interaction. Using the estimates from this model that are shown in Table 2, we can compute the estimate of the slope of the relationship between BMD and AGE for each sex. The slope was larger and the relationship was steeper (i.e. more positive) for boys ( =0.0169+0.0321= 0.049) than for girls ( =0.0169 + 0.0 = 0.0169). Therefore, for both boys and girls, there was an increase in BMD with an increase in AGE, but the increase was much larger for boys than for girls.
β̂ β̂
Table 2. Parameter estimates for AGE by SEX relationship. Parameter Estimate Standard Error t Value Pr > |t| AGE 0.0169 0.0044 3.79 0.0002 AGE*SEX 0 (Males) 0.0321 0.0062 5.18 <.0001 AGE*SEX 1 (Females) 0.0000 . . .
These results agree with what would be expected at the age of our sample as depicted in Figure 1 above. We can also show this relationship visually for our data using a plot as illustrated in Figure 3. The inclusion of the individual points helps the understanding the strength of this relationship but they could be left off the plot if desired. *plotting age by sex; symbol1 value = circle h=0.5 color = red i = rl ; symbol2 value = square h=0.5 color = blue i = rl ; legend1 position=(right top inside); proc gplot; goptions ftext=swiss htext=1; plot bmd*age = sex/legend=legend1; run;quit;
Figure 3. AGE by SEX interaction-PROC GPLOT result.
THE PERFAT and BMD RELATIONSHIP The investigators were also interested to determine if there was also a relationship between adiposity and BMD beyond the base model results. We investigated a relationship between PERFAT and BMD and checked to see if that relationship was the same for the race-sex subgroups by testing for homogeneity of slopes. By fitting the PERFAT*RACE*SEX interaction first, we can determine if any of the four slopes is different from zero and the model results are shown in Table 3.
5

proc glm; class sex race; model bmd =age race sex age*sex perfat*race*sex/solution; means race sex ; lsmeans race sex ; run; quit;
Table 3. Model results for testing that all subgroup slopes are equal to zero. Source DF Type III SS Mean Square F Value Pr > F
RACE 1 0.0876 0.0876 10.04 0.0016
SEX 1 0.1527 0.1527 17.48 <.0001
AGE 1 0.9267 0.9267 106.1 <.0001
AGE*SEX 1 0.2391 0.2391 27.37 <.0001
PERFAT*RACE*SEX 4 0.0823 0.0206 2.36 0.0524
It is seen in Table 4 that the interaction of interest might provide some additional information to help explain BMD in adolescents (p=0.052) and examination of the estimates (Table 4) indicates that there might be a difference between males and females.
Table 4. Parameter estimates for PERFAT, RACE, and SEX relationship. Parameter Estimate Standard Error t Value Pr > |t|
PERFAT*RACE*SEX 0 0 (White Males) -.0009 0.0008 -1.14 0.2548
PERFAT*RACE*SEX 0 1 (White Females) 0.0013 0.0008 1.72 0.0864
PERFAT*RACE*SEX 1 0 (Black Males) -.0004 0.0008 -0.53 0.5988
PERFAT*RACE*SEX 1 1 (Black Females) 0.0021 0.0007 2.84 0.0046
To determine if the relationship between adiposity and BMD is different for boys and girls the following model was fit: proc glm; class sex race; model bmd =age race sex age*sex perfat perfat*sex/solution; means race sex ; lsmeans race sex ; run; quit; As seen in Table 5, there is a significant PERFAT*SEX interaction. The AGE*SEX interaction also remains significant.
Table 5. Model results for testing that the sex subgroup slopes are equal. Source DF Type III SS Mean Square F Value Pr > F
RACE 1 1.0595 1.0595 121.5 <.0001
SEX 1 0.1527 0.1527 17.51 <.0001
AGE 1 0.9496 0.9496 108.9 <.0001
AGE*SEX 1 0.2398 0.2398 27.50 <.0001
PERFAT 1 0.0154 0.0154 1.76 0.1845
PERFAT*SEX 1 0.0633 0.0633 7.26 0.0072
Using the estimates from this model that are shown in Table 7, we can compute the estimate of the slope of the relationship between BMD and PERFAT for each sex. The
6

slope was larger and the relationship was steeper (i.e. more positive) for girls ( =0.0018+0=0.0018) than for boys ( =0.0018 – 0.0024 = 0.0006). Therefore, for β̂ β̂female subjects, the BMD increased as their PERFAT increased as shown in Figure 4 using similar code as that for Figure 3. The significant age and sex relationship for BMD has the same interpretation as the base model; older boys have higher BMD than older girls.
Table 6. Parameter estimates for the AGE and PERFAT by SEX relationships. Parameter Estimate Standard Error t Value Pr > |t|
AGE 0.0159 0.0044 3.57 0.0004
AGE*SEX 0 (Males) 0.0325 0.0073 -11.02 <.0001
AGE*SEX 1 (Females) 0.0000 . . .
PERFAT 0.0018 0.0006 2.70 0.0071
PERFAT*SEX 0 (Males) -.0024 0.0009 -2.69 0.0072
PERFAT*SEX 1 (Females) 0.0000 . . .
Figure 4. PERFAT by SEX interaction-PROC GPLOT result.
EXPLORING THREE-WAY INTERACTION Because there was as significant AGE by SEX interaction as well as PERFAT by SEX interaction, we were interested to see if there was a relationship between the three factors such that adiposity might affect the age by sex relationship or, similarly, age might affect the adiposity by sex interaction. We explored if there was a three-way interaction between PERFAT, SEX, and AGE using the following code: proc glm; class race sex; model bmd=race sex age perfat age*sex perfat*sex perfat*age*sex/solution; run;quit;
7

As seen in Table 7, there is a significant relationship between the 3 factors.
Table 7. Model results for testing that all subgroup slopes are equal to zero. Source DF Type III SS Mean Square F Value Pr > F
RACE 1 1.0482 1.0482 121.2 <.0001
SEX 1 0.0574 0.0574 6.64 0.0102
AGE 1 0.1626 0.1626 18.81 <.0001
PERFAT 1 0.0301 0.0301 3.48 0.0625
AGE*SEX 1 0.0716 0.0716 8.28 0.0041
PERFAT*SEX 1 0.0237 0.0237 2.74 0.0985
AGE*PERFAT*SEX 2 0.0667 0.0334 3.86 0.0216
The SOLUTION model option in this case provided estimates of the AGE*PERFAT relationship for each sex subgroup. Interpretation is not as straightforward since AGE and PERFAT are continuous variables. GRAPHICAL REPRESENTATIONS OF THE THREE-WAY INTERACTION One common way to graphically display the 3-way interactions is through obtaining 3-D plots. However as seen from the two plots below (Figure 5), it is difficult to visually assess the relationships between PERFAT and AGE with BMD for males and females. Figure 5. Relationship between PERFAT, AGE, and BMD; SEX=Male SEX=Female
0. 835
1. 091
1. 346
1. 602
BMD
14. 10
15. 67
17. 23
18. 80
AGE
7. 7
22. 5
37. 3
52. 1
PERFAT
0. 871
1. 042
1. 214
1. 385
BMD
13. 9
15. 6
17. 3
19. 0
AGE
14. 30
27. 77
41. 23
54. 70
PERFAT
As an easier approach for interpretation purposes and to capture all three variables in relation with BMD, one of the continuous variables in the interactions can be dichotomized. PERFAT was dichotomized into ‘High’ and ‘Low’, which was defined at the sex-specific medians (29% for girls and 15% for boys). Figure 6 shows BMD regressed over age for low PERFAT males, high PERFAT males, low PERFAT females, and high PERFAT females using pre-defined bf categories in data step. if perfat < 15 and sex=0 then bf=1; *low PERFAT males; if perfat >=15 and sex=0 then bf=2; *high PERFAT males; if perfat < 29 and sex=1 then bf=3; *low PERFAT females; if perfat >=29 and sex=1 then bf=4; *high PERFAT females; *reg essingr over age; proc format; value fbf 1 = 'Low PERFAT Male' 2 = 'High PERFAT Male'
8

3 = 'Low PERFAT Female' 4 = 'High PERFAT Female'; run; **Creating the different symbols; symbol1 value = circle h=0.5 color = red i = rl ; symbol2 value = square h=0.5 color = blue i = rl ; symbol3 value = star h=0.5 color = green i = rl ; symbol4 value = circle h=0.5 color = black i = rl ; legend1 position=(right top inside); proc gplot data = bmd1 ; goptions ftext=swiss htext=1 hsize=6 vsize=4; format bf fbf. ; plot bmd*age = bf/legend=legend1 ; run ;quit;
Figure 6. SEX,AGE,and PERFAT interaction with BMD regressing over AGE; sex specific dichotomization for PERFAT.
Figure 7. SEX ,AGE,and PERFAT interaction with BMD regressing over AGE; PERFAT dichotomized at median.
Figure 7 depicts the 3-way interaction between PERFAT, SEX, and AGE with BMD, when PERFAT was dichotomized at the overall median of 23.5%. Similar trends were
9
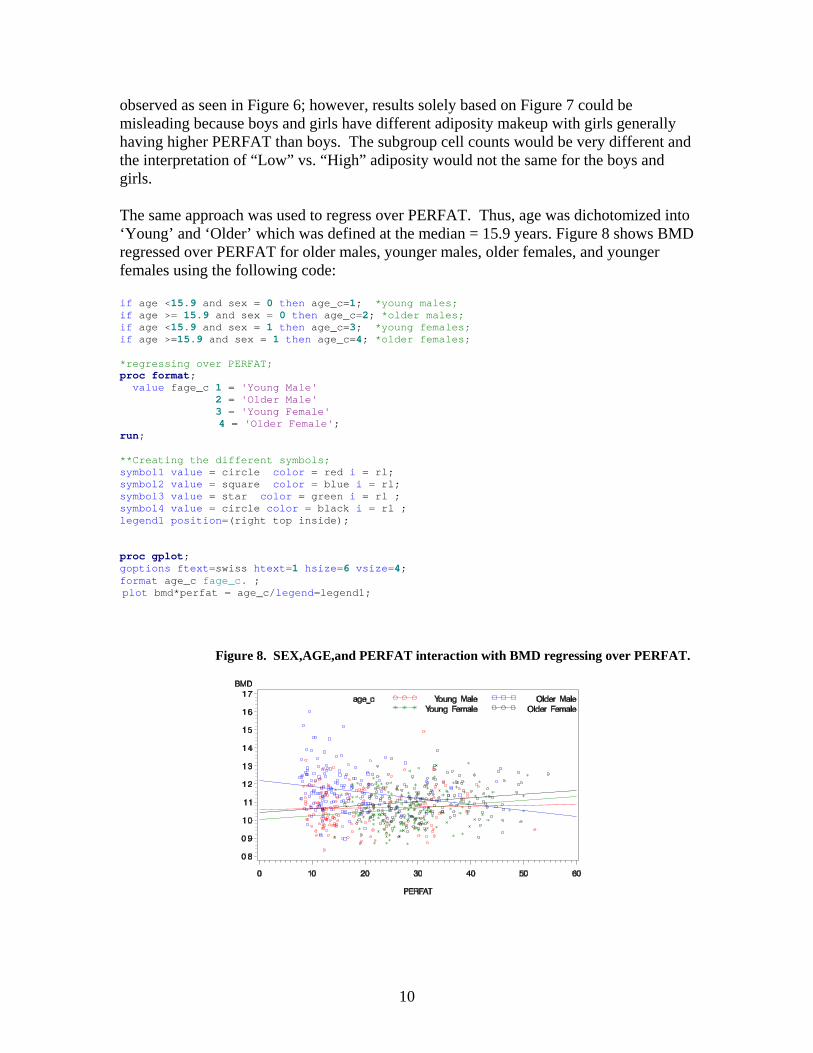
observed as seen in Figure 6; however, results solely based on Figure 7 could be misleading because boys and girls have different adiposity makeup with girls generally having higher PERFAT than boys. The subgroup cell counts would be very different and the interpretation of “Low” vs. “High” adiposity would not the same for the boys and girls. The same approach was used to regress over PERFAT. Thus, age was dichotomized into ‘Young’ and ‘Older’ which was defined at the median = 15.9 years. Figure 8 shows BMD regressed over PERFAT for older males, younger males, older females, and younger females using the following code: if age <15.9 nd sex = 0 hen age_c=1; *young males; a tif age > 15.9 and sex = 0 then age_c=2; *older males; = if age <15.9 and sex = 1 then age_c=3 *young females; ;if age >=15.9 and sex = 1 then age_c=4; *older females; *regressing over PERFAT; proc format; value fage_c 1 = 'Young Male' 2 = 'Older Male' 3 = 'Young Female' 4 = 'Older Female'; run; **Creating the different symbols; symbol1 value = circle color = red i = rl; symbol2 value = square color = blue i = rl; symbol3 value = star color = green i = rl ; symbol4 value = circle color = black i = rl ; legend1 position=(right top inside); proc gplot; goptions ftext=swiss htext=1 hsize=6 vsize=4; format age_c fage_c. ; plot bmd*perfat = age_c/legend=legend1;
Figure 8. SEX,AGE,and PERFAT interaction with BMD regressing over PERFAT.
10

INTERPRETATION Earlier, we noted that males in this age range had a significantly larger increase in BMD as AGE increased than did females. Adiposity did not alter the relationship between AGE and BMD for females as seen in Figure 6. However, adiposity did affect the relationship between AGE and BMD for males. Males with PERFAT below the median showed a larger BMD increase as AGE increased than did those with PERFAT below the median. Similarly, we noted that females had a significant increase in BMD as their adiposity increased without the effect of age in the interaction. Age did not change the effect of PERFAT on BMD for females as shown by Figure 8 because both younger and older groups of girls showed an increase in BMD as PERFAT increased. Age does affect the relationship between BMD and PERFAT for males. Older males showed a decrease in BMD as their adiposity increased whereas younger males had little or no decrease in BMD with an increase in PERFAT. This 3-way interaction is driven by the fact that adiposity and age are dependent on each other when assessing their relationship with BMD for males but not for females.
DIAGNOSTIC: CHECKING THE ASSUMPTION OF NORMALITY Further examination of the residuals revealed that the model assessing PERFAT, AGE, RACE, and SEX relationships with BMD did not violate the normality assumption because the normal probability plot of the residuals showed no apparent deviation from normality and the plot of the residuals v. the predicted BMD values had no systematic tendency to be positive or negative as shown in Figure 9 and Figure 10. Figure 9. Normal probability plot of residuals Figure 10. Plot of residuals vs. predicted
CONCLUSION Three-way interactions are complicated when it comes to interpretations. One option is to visually assess the interactions using 3-D plots; however this can still produce problems with interpretation. By dichotomizing the continuous variables, the task becomes easier because we can obtain slope estimates at different levels and graphically demonstrate the relationships between three variables.
11

REFERENCES 1. Mølgaard C, Lykke B, Thomsen, Michaelsen K. Whole body bone mineral
accretion in healthy children and adolescent. Arch Dis Child. 1999. 81:10–15 2. Litaker MS, Barbeau P, Humphries MC, Gutin B. Comparison of Hologic QDR-
1000/W and 4500W DXA scanners in 13- to 18-year olds. Obes Res. 2003. 11: 1545–1552
CONTACT INFORMATION Anh Le Department of Biostatistics and Epidemiology, AE-1005 Medical College of Georgia Augusta, GA 30912-4900 Email: [email protected] SAS and all other SAS Institute Inc. product or service names are registered trademarks or trademarks of SAS Institute Inc. in the USA and other countries. ® indicates USA registration.
12