intersection planning in safer transportation network planning · intersection planning in safer...
TRANSCRIPT
Intersection planning inSafer Transportation Network Planning
Ton Hummel
D-2001-13

Intersection planning inSafer Transportation Network Planning
Safety principles, planning framework, and library information
D-2001-13Ton HummelLeidschendam, 2001SWOV Institute for Road Safety Research, The Netherlands
Report documentation
Number: D-2001-13Title: Intersection planning in Safer Transportation Network PlanningSubtitle: Safety principles, planning framework, and library informationAuthor(s): Ton HummelResearch theme: Road design and road safetyTheme leader: Atze DijkstraProject number SWOV: 33.310
Keywords: Junction, safety, traffic, road network, classification, planning,design (overall design), textbook, program (computer).
Contents of the project: The design tool - Safer Transportation Network Planning - isintended to guide network planners in designing safe transpor-tation networks. This report is one in a series of reports which willbe used in the development of the tool. The information in thisreport is intended to guide the structure and programming ofSafer Transportation Network Planning with respect to intersec-tion planning.
Number of pages: 35 pp.Price: Dfl. 20,-Published by: SWOV, Leidschendam, 2001
SWOV Institute for Road Safety ResearchP.O. Box 10902260 BB LeidschendamThe NetherlandsTelephone 31703209323Telefax 31703201261
SWOV Publication D-2001-13 3
Summary
This report is one in a series of publications, used in the development of thenetwork planning tool ‘Safer Transportation Network Planning’ (Safer-TNP).The publications were used to guide the development of planning struc-tures, diagnostic tools, planning recommendations, and research infor-mation in the computer tool Safer-TNP. Safer-TNP is a design tool that guides network planners in designing safetransportation networks (or improving safety of existing transportationnetworks). It provides the practitioner with diagnostic tools, and guidinginformation. At the moment of publication of this report, Safer-TNP is stillbeing developed. Besides this ‘Intersection planning report’, the following reports have beenpublished in this series:- Access management in Safer Transportation Network Planning
(Hummel, 2001a);- Route management in Safer Transportation Network Planning (Hummel,
2001b);- Land use planning in Safer Transportation Network Planning (Hummel,
2001c);
The information in this report will be used to guide the structure and theprogramming of different parts of the Safer-TNP tool with respect tointersection planning. Described is, in a step-by-step procedure, whatinformation is needed, and in what way the information should beprocessed. In the last chapter of the report, background information isprovided to give users of the tool guiding information. Because of thespecific purpose of this report, its structure and style deviate somewhatfrom regular research reports.Because the different chapters are used in different stages of the develop-ment of Safer-TNP, there is some repetition of information. Furthermore,the information is written in telegraphic style, to simplify the electronicpackaging of information in Safer-TNP.
Decisions in the design of intersections are often implicitly made in thenetwork planning phase. It is therefore important to consider safetyimplications of these decisions in this early design phase. A choice for thesafer three-legged intersection or the roundabout, should not be madephysically impossible in the network design.In this report the safety characteristics of intersection types, intersectionspacing, and design characteristics are discussed. Recommendations andguiding information is provided.

SWOV Publication D-2001-13 5
Contents
1. Background 71.1. Definition 71.2. Scope 81.3. Potential benefits 8
2. Planning activities 92.1. Activities 92.2. Planning process 11
3. Safety principles 123.1. Collision characteristics 123.2. Planning principles 123.3. Minimize exposure 13
3.3.1. Provide compact urban form 133.3.2. Provide efficient networks 13
3.4. Minimize risk 143.4.1. Provide functionality 143.4.2. Provide homogeneity 153.4.3. Provide predictability 15
3.5. Minimize consequences 153.5.1. Reduce speeds 153.5.2. Protect vulnerable road users 16
4. Planning framework 174.1. Local policies 174.2. Classified road network 174.3. Future plans 184.4. Desire lines/ volumes 184.5. Travel times 184.6. Emergency response 18
5. Library information 195.1. Understanding 195.2. Number of intersections 205.3. Intersection spacing 205.4. Intersection type 225.5. General layout 26
5.5.1. Angle of intersection 265.5.2. Sight distances 275.5.3. Alignment 275.5.4. Approach speed 285.5.5. Provisions for vulnerable road users 295.5.6. Orientation of staggered T-intersections 31
5.6. Intended use 325.6.1. Priority regulations 325.6.2. Signalization 32
5.7. Capacity 32
References 34

SWOV Publication D-2001-13 7
1. Background
1.1. Definition
0 Intersections are important elements in a road network. The planning,distribution and lay-out of intersections determine:- safety of the network- efficiency of the network- travelling speeds on the network- costs of operation- capacity of the network.
0 Safety of the network:0 Intersections are the most critical elements in a road network. Road
users of different types, in different masses, from different directionsand moving at different speeds have to use the same space, resultingin a large number of potential conflicts.
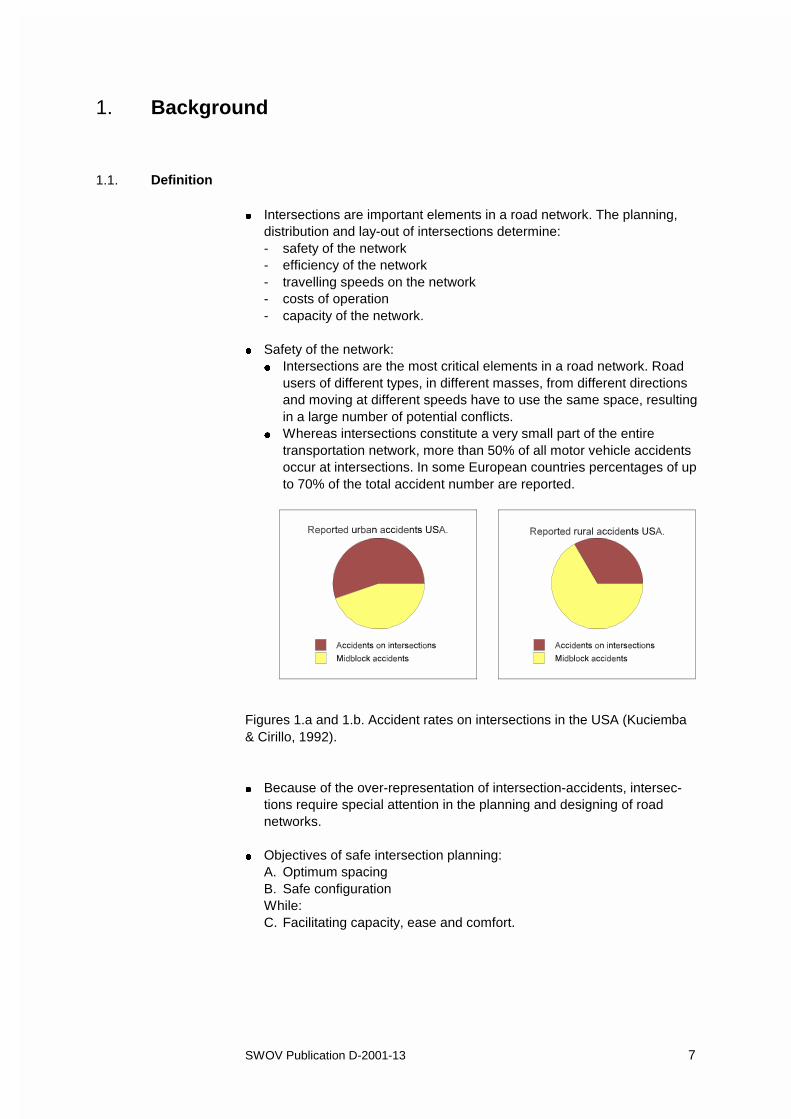
0 Whereas intersections constitute a very small part of the entiretransportation network, more than 50% of all motor vehicle accidentsoccur at intersections. In some European countries percentages of upto 70% of the total accident number are reported.
Figures 1.a and 1.b. Accident rates on intersections in the USA (Kuciemba& Cirillo, 1992).
0 Because of the over-representation of intersection-accidents, intersec-tions require special attention in the planning and designing of roadnetworks.
0 Objectives of safe intersection planning:A. Optimum spacingB. Safe configurationWhile:C. Facilitating capacity, ease and comfort.
8 SWOV Publication D-2001-13
1.2. Scope
0 The most important decisions concerning the design of intersections are(often implicitly) made in the network planning process. Generally, oncea less favourable choice has been made in this planning phase, thenegative consequences cannot easily be reversed in the geometricdesign phase.Safe intersection planning is therefore an important aspect in thenetwork planning phase.
0 Decisions in the network planning phase generally affect one or more ofthe following elements:A: Optimum spacing:
- number of intersections- intersection spacing.
B: Safe configuration:- intersection types (for instance, once the choice for a cross
intersection has been made in the planning phase, this choicecannot easily be converted to the safer T-intersection)
- general lay-out of the intersection- intended use of the intersection (priority regulations, signalization).
1.3. Potential benefits
The potential benefits of incorporation of intersection planning in thenetwork planning phase are:0 Specific attention to intersection planning in the network planning phase
may seriously improve the safety of the entire road network.0 Paying attention to (often implicitly made) choices for intersection design
in the planning phase, may prevent unfavourable choices resulting inlower safety levels and/or high costs of reconstruction or maintenance.

SWOV Publication D-2001-13 9
2. Planning activities
2.1. Activities
I Planning FrameworkAt the start of an intersection planning exercise, it is important todevelop an understanding of the study area. At least the followingelements need to be surveyed to obtain an understanding of the studyarea:- Local policies- Classified road network (existing road network)- Future plans (land use plans and traffic plans)- Desire lines and traffic volumes- Travel times- Emergency response centres/ routes/ targets.
II DiagnosticsIntersections in the existing network should be studied and evaluated.At least the following aspects should be studied:- Accessibility- Conflicting volumes- Number of intersections in study area- Spacing between intersections- Intersection types used (and on which road category)- General layout of intersections.
III Option generation and evaluationA number of possible options for the new situation should be designed.Each option should be evaluated and -if necessary- refined. Based onthe evaluation, one final option can be chosen.Refinements or improvements of intersection safety in the network maybe divided into:a. Deal with causes of poor safety:
- remove, relocate or add intersections- change intersection type or layout
b. Deal with symptoms of poor safety:- change road form/ speed management.
0 Important factors affecting the safety of intersections are:Optimum spacing:
1. number of intersections2. intersection spacing.
Safe configuration:3. intersection type:
- number of legs- basic form
4. general layout:- angle of intersection- sight distances- alignment- approach speed
10 SWOV Publication D-2001-13
- provisions for vulnerable road users- orientation of staggered T-intersections
5. intended use of the intersection:- priority regulations- signalization.
0 Although general layout and choice of intended use are generallyconsidered to be factors of geometric design, the most important impactof these factors is often established in the network planning phase:- The angle of intersection is determined by the network sketch
(orientation of network links).- Sight distances are determined by the location of buildings or other
visual obstructions in the proximity of intersections (limited sightangles).
- The alignment is determined in the network sketch.- The approach speed is mainly determined by the alignment and
length of the approaching links.- Priority regulations are dependent on categorisation of network links
(road categories and functions of intersecting links).
SWOV Publication D-2001-13 11
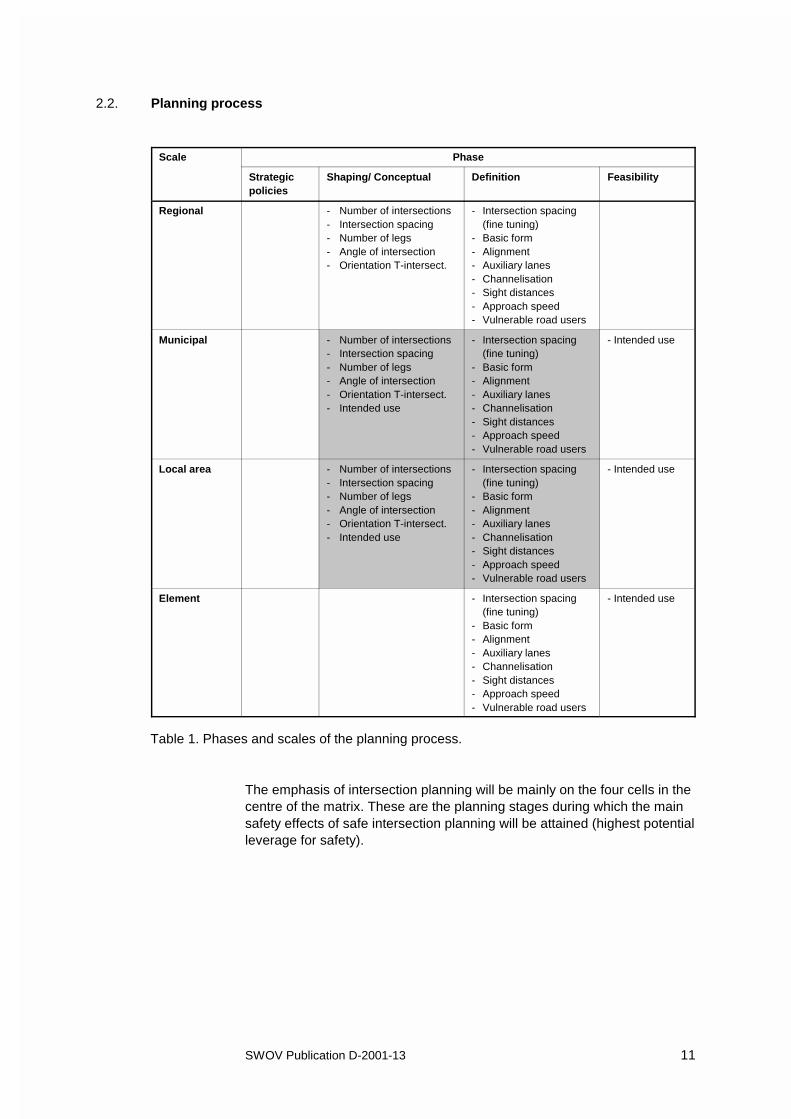
2.2. Planning process
Scale Phase
Strategicpolicies
Shaping/ Conceptual Definition Feasibility
Regional - Number of intersections - Intersection spacing- Number of legs- Angle of intersection- Orientation T-intersect.
- Intersection spacing(fine tuning)
- Basic form - Alignment- Auxiliary lanes- Channelisation- Sight distances- Approach speed- Vulnerable road users
Municipal - Number of intersections- Intersection spacing- Number of legs- Angle of intersection- Orientation T-intersect.- Intended use
- Intersection spacing(fine tuning)
- Basic form- Alignment- Auxiliary lanes- Channelisation- Sight distances- Approach speed- Vulnerable road users
- Intended use
Local area - Number of intersections- Intersection spacing- Number of legs- Angle of intersection- Orientation T-intersect.- Intended use
- Intersection spacing(fine tuning)
- Basic form- Alignment- Auxiliary lanes- Channelisation- Sight distances- Approach speed- Vulnerable road users
- Intended use
Element - Intersection spacing(fine tuning)
- Basic form- Alignment- Auxiliary lanes- Channelisation- Sight distances- Approach speed- Vulnerable road users
- Intended use
Table 1. Phases and scales of the planning process.
The emphasis of intersection planning will be mainly on the four cells in thecentre of the matrix. These are the planning stages during which the mainsafety effects of safe intersection planning will be attained (highest potentialleverage for safety).
12 SWOV Publication D-2001-13
3. Safety principles
3.1. Collision characteristics
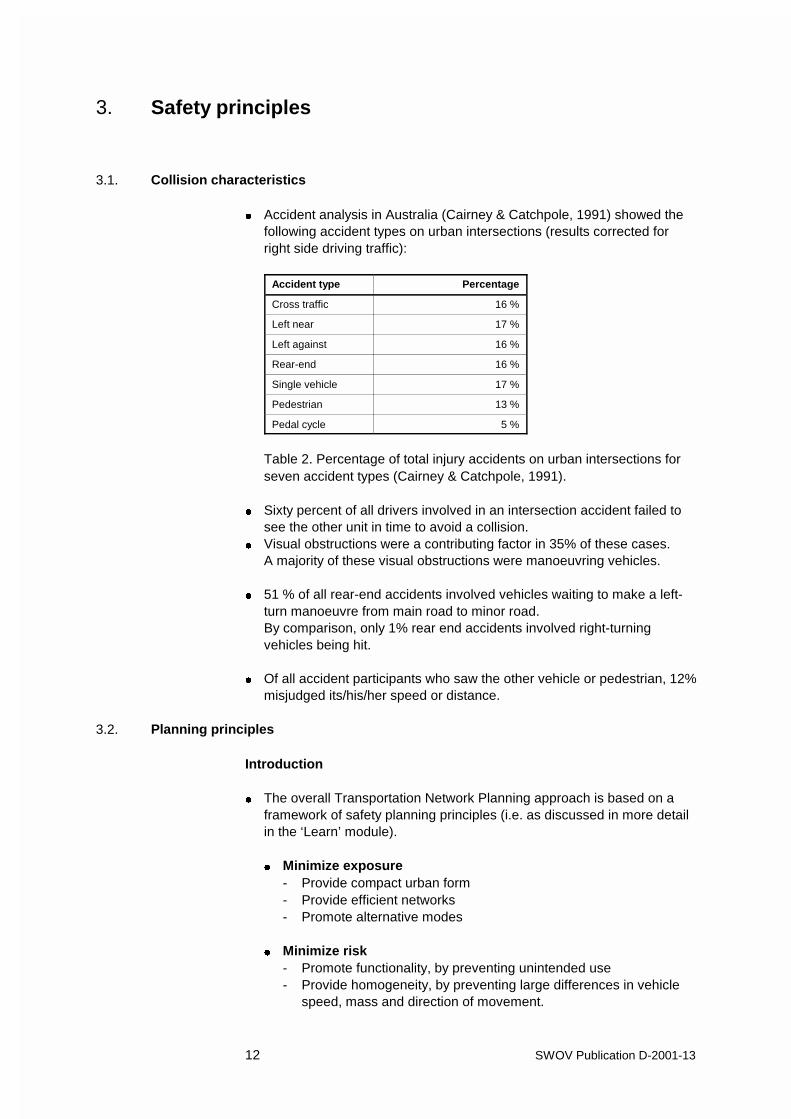
0 Accident analysis in Australia (Cairney & Catchpole, 1991) showed thefollowing accident types on urban intersections (results corrected forright side driving traffic):
Accident type Percentage
Cross traffic 16 %
Left near 17 %
Left against 16 %
Rear-end 16 %
Single vehicle 17 %
Pedestrian 13 %
Pedal cycle 5 %
Table 2. Percentage of total injury accidents on urban intersections forseven accident types (Cairney & Catchpole, 1991).
0 Sixty percent of all drivers involved in an intersection accident failed tosee the other unit in time to avoid a collision.
0 Visual obstructions were a contributing factor in 35% of these cases.A majority of these visual obstructions were manoeuvring vehicles.
0 51 % of all rear-end accidents involved vehicles waiting to make a left-turn manoeuvre from main road to minor road.By comparison, only 1% rear end accidents involved right-turningvehicles being hit.
0 Of all accident participants who saw the other vehicle or pedestrian, 12%misjudged its/his/her speed or distance.
3.2. Planning principles
Introduction
0 The overall Transportation Network Planning approach is based on aframework of safety planning principles (i.e. as discussed in more detailin the ‘Learn’ module).
0 Minimize exposure- Provide compact urban form- Provide efficient networks- Promote alternative modes
0 Minimize risk- Promote functionality, by preventing unintended use- Provide homogeneity, by preventing large differences in vehicle
speed, mass and direction of movement.
SWOV Publication D-2001-13 13
- Provide predictability (of the course of the road), thus preventinguncertainty amongst road users, and enabling the behaviour ofother road users to be anticipated.
0 Minimize consequences- Reduce speeds- Provide a forgiving roadside- Protect vulnerable road users.
0 This chapter discusses the interaction between these principles andintersection planning. The principle printed in italic is not considered tobe relevant to intersection planning and will not be addressed in thischapter.
3.3. Minimize exposure
3.3.1. Provide compact urban form
Discussion
0 The chosen urban form influences the density of the road network.A densely designed network requires a dense network of intersections.Yet:- An intersection is a hazardous element in the network; the number of
intersections should therefore be limited.- A dense intersection network may cause insufficient intersection
spacing to ensure the safety of individual intersections.
Guiding principles
0 A compact urban form improves safety by reducing exposure by:- reducing the travelled distance,- thereby allowing the use of safer travel modes.
0 A compact urban form requires a dense network of intersections, whichcould influence traffic safety negatively. The intersection spacing shouldbe carefully monitored.
0 The number of intersections (especially between non-residential streets)should be limited.
0 Distances between separate intersections should be large enough toallow safe intersection performance.
3.3.2. Provide efficient networks
Discussion
0 Intersections are important determining factors in:- efficiency of a network- travelling speeds- capacity of a network- safety of a network- costs of operation.
14 SWOV Publication D-2001-13
0 Efficiency, capacity and speeds are determined by:- number of intersections- intersection spacing- intersection type- general layout of intersection- priority rules/ signalization.
0 The shortest routes should coincide with the safest routes (for eachtravel mode).
Guiding principles
0 Let the shortest routes for each travel mode coincide with the safestroutes.
0 The ideal network structure for each travel mode should have:- small delays on intersections (limited number of intersections, small
delays on each individual intersection)- safe intersection for all travel modes.
3.4. Minimize risk
3.4.1. Provide functionality
Discussion
0 Each road class should ideally have only one function; unintended use(other functions) should be prevented (e.g. no through-traffic onresidential roads, no residential traffic or private accesses on through-roads).
0 Important activities in intersection planning with respect to thefunctionality of a network are:- the allocation of intersection in the network- intersection spacing (low density of intersections of through-roads
and distributor roads)- intersection types.
Guiding principles
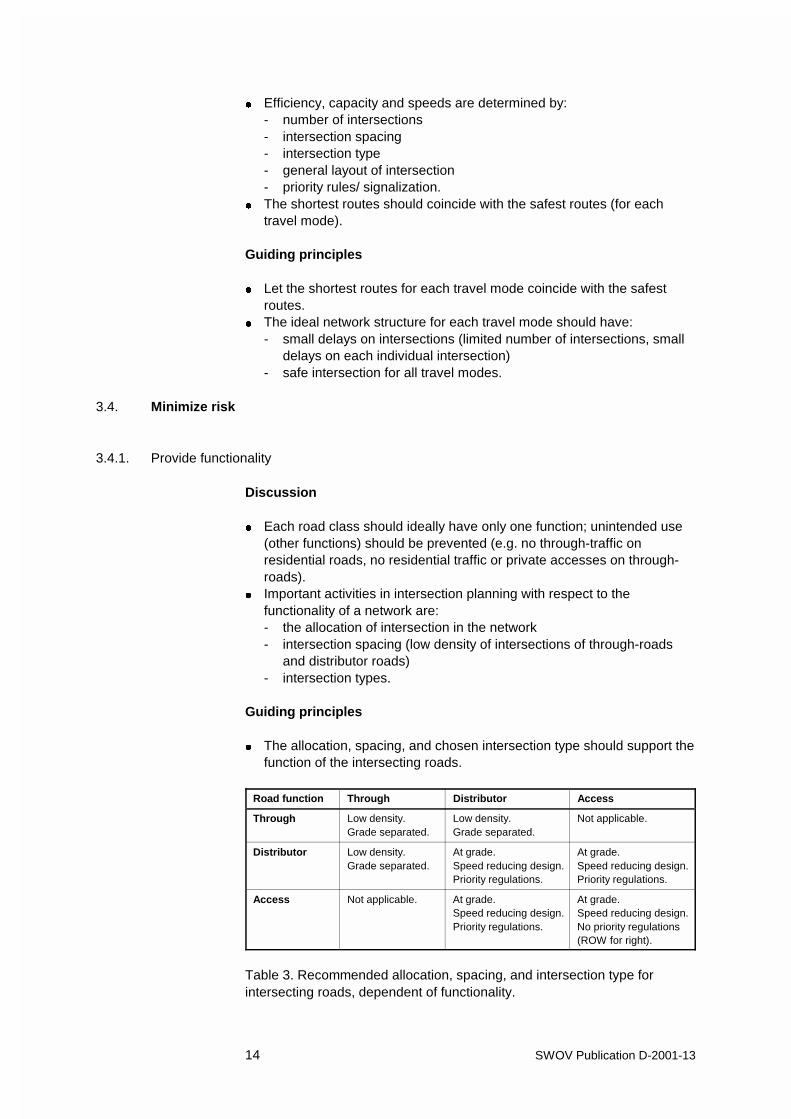
0 The allocation, spacing, and chosen intersection type should support thefunction of the intersecting roads.
Road function Through Distributor Access
Through Low density.Grade separated.
Low density.Grade separated.
Not applicable.
Distributor Low density.Grade separated.
At grade.Speed reducing design.Priority regulations.
At grade.Speed reducing design.Priority regulations.
Access Not applicable. At grade.Speed reducing design.Priority regulations.
At grade.Speed reducing design.No priority regulations(ROW for right).
Table 3. Recommended allocation, spacing, and intersection type forintersecting roads, dependent of functionality.
SWOV Publication D-2001-13 15
3.4.2. Provide homogeneity
Discussion
0 A homogeneous transportation network precludes encounters with largedifferences in speed, mass and/or direction.
Guiding principles
0 Where road functions require high speeds, encounters with differencesin speed and/or directions should be precluded (grade-separatedintersections).
0 Conflicts with different directions should only be allowed at low speedintersections.See also Table 3.
3.4.3. Provide predictability
Discussion
0 A uniform intersection type for each intersection class in a networkcontributes to the predictability. With a uniform and monofunctional useof intersection types, road users can predict the function of theintersecting roads and thereby the traffic characteristics to be expected.
Guiding principles
0 The basic form (type) of each intersection should reflect the function ofthe intersecting roads. For each class of intersection (e.g. access-access, residential-access etc.) a uniform intersection type should beused as much as possible. See also Table 3.
3.5. Minimize consequences
3.5.1. Reduce speeds
Discussion
0 High speeds at intersections can only be allowed at grade-separatedintersections. If potential conflicts between traffic from differentdirections are possible, passing speeds should be low.
Guiding principles
0 If potential conflicts between traffic from different directions are possible,speeds should be lowered. Possible measures to reduce speeds atintersections can include:- Low speed intersection design (e.g. roundabout or T-intersection
instead of cross intersection, four-way stop intersection instead ofpriority intersection)
- Traffic calming measures at, or on the approach to the intersection.
16 SWOV Publication D-2001-13
3.5.2. Protect vulnerable road users
Discussion
0 Potential conflicts between vulnerable road users should be avoidedwhere possible. Where road functions require high speeds, intersectionswith vulnerable road users should be grade separated.
0 At intersections with possible conflicts with vulnerable road users,speeds of motorised traffic should be low (not higher than 30 km/h.).
Guiding principles
0 Potential conflicts with vulnerable road users require low speeds ofmotorised traffic.
0 The possible presence of vulnerable road users at intersections shouldbe made clear to motorised traffic.
0 Attention of motorised traffic should be directed at the approachdirections of vulnerable road users.
0 Priority regulations should be made clear for both motorised traffic andvulnerable road users.
SWOV Publication D-2001-13 17
4. Planning framework
0 In order to obtain a safe and consistent complex of intersections in thenetwork, it is essential to develop an understanding of the study area.Only then, the intersection planning can be properly adjusted to theexisting situation.
0 At least the following items need to be surveyed to get an understandingof the study area:- Local policies- Classified road network- Future plans- Desire lines/ volumes- Travel times- Emergency response centres/ routes/ targets.
4.1. Local policies
0 Are there any local policies that can influence or limit the choice of:- intersection spacing (e.g. access requirements)- intersection type.
0 Is it possible or necessary to develop a policy on intersection planning(for instance the policy to promote the use of safe intersection types andstandardized intersection spacing).
4.2. Classified road network
0 Ideally, each road in a network should serve only one designated trafficfunction (flow, distribution or residential). The design of roads should bein accordance with the function. To improve the predictability, each roadcategory should have a uniform design.The classification in different road categories in the existing networkshould be surveyed, to fit the network of the new development logicallyinto the existing network.
0 Similarly, the allocation, spacing and configuration of intersectionsshould support the function of the intersection and of the intersectingroads. Ideally, each combination of intersecting roads should have onedesignated intersection type and accompanying intersection spacing, toimprove the predictability.
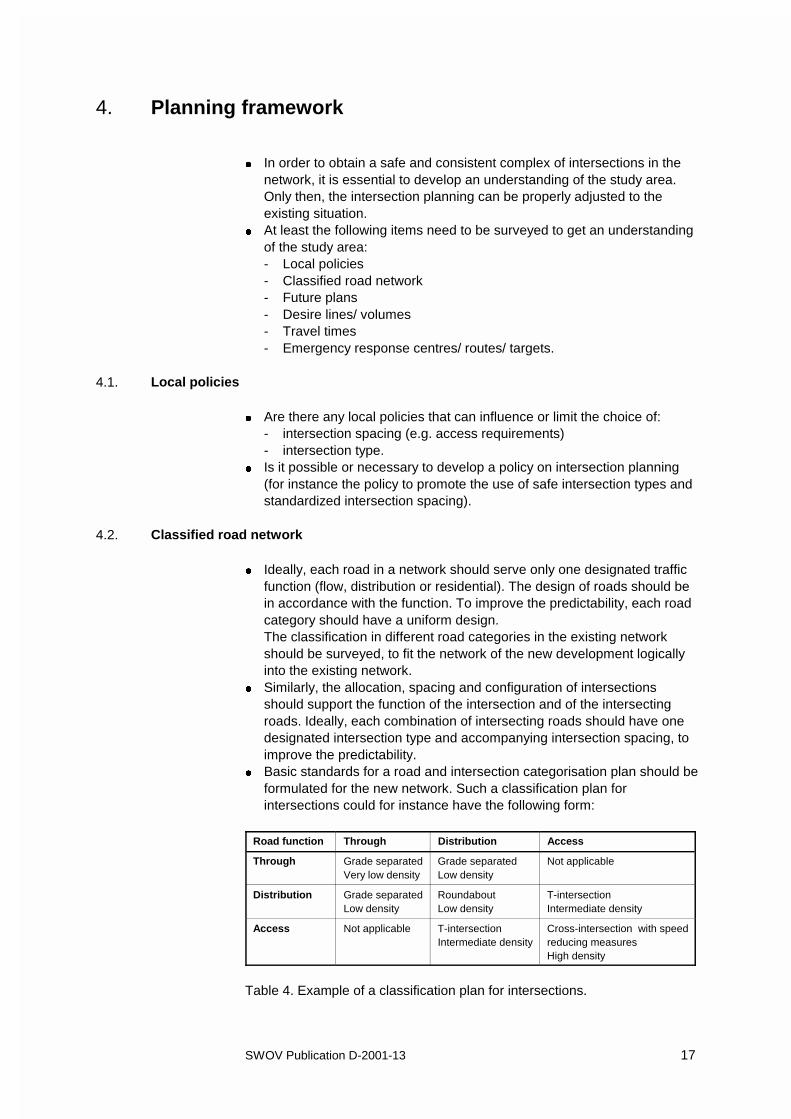
0 Basic standards for a road and intersection categorisation plan should beformulated for the new network. Such a classification plan forintersections could for instance have the following form:
Road function Through Distribution Access
Through Grade separatedVery low density
Grade separatedLow density
Not applicable
Distribution Grade separatedLow density
RoundaboutLow density
T-intersectionIntermediate density
Access Not applicable T-intersectionIntermediate density
Cross-intersection with speedreducing measuresHigh density
Table 4. Example of a classification plan for intersections.
18 SWOV Publication D-2001-13
4.3. Future plans
0 Survey future plans (both land use and road development plans), orpossible developments foreseen in the future.
0 Check if the future plans:- can set limitations or preconditions for the studied network- can be simplified by certain provisions in the studied network (flexible
planning).
4.4. Desire lines/ volumes
0 Draw desire lines, based on origin-destination relations for study area(including origins/ destinations in new development).
0 Desire lines through the new development should form the basis for theroad network plan.
0 Volumes (estimations) on desire lines give indications for trafficfunctions and the road category (classification plan).
0 If desire lines and the planned network do not match, rat runs andimproper use (use in conflict with road functions) are created.
4.5. Travel times
0 Map routes in the existing network with excessive travel times.0 Check if the new development can cause a deterioration or improvement
of these excessive travel times.0 Check if travel times can be improved by the use of other intersection
types with smaller delays, or by the limitation of the number ofintersections on the routes.
0 Excessive travel times can cause rat runs and improper use (i.e. use inconflict with road functions).
4.6. Emergency response
0 Map emergency response centres and main emergency responseroutes.
0 Draw desire lines for emergency response routes in the newdevelopment.
0 Check travel times on emergency response routes and desire lines.0 Check if travel times can be improved by the use of other intersection
types or by the limitation of the number of intersections on theemergency response routes.
SWOV Publication D-2001-13 19
5. Library information
5.1. Understanding
0 In general the design of an intersection has to be:0 Perceptible:
- timely visible- noticeable- recognisable- locatable
0 Surveyable:- intersection- connecting roads- traffic
0 Understandable:- quick- correct- unambiguous
0 Passable:- gradual transition of design elements
0 Balanced:- sum of design elements forms an integrated entity
0 Complete:- traffic should be able to proceed in all occurring directions
0 Safe.
0 To establish/ secure the abovementioned preconditions in the networkplanning phase, the following points of interest require special attention:Optimum spacing:0 Number of intersections0 Intersection spacingSafe configuration:0 Intersection type:
- number of legs- basic form.
0 General layout:- angle of intersection- sight distances- alignment- approach speed- provisions for vulnerable road users.
0 Intended use:- priority regulations- signalization.
Although general layout and choice of intended use are generallyconsidered to be factors of geometric design, the most important influenceof these factors is often established in the network planning phase.Decisions made in network planning often limit the possible solutions in thegeometric design phase and should therefore carefully be considered:
20 SWOV Publication D-2001-13
- The angle of intersection is determined by the network sketch(orientation of network links).
- Sight distances are determined by the location of buildings or othervisual obstructions in proximity of intersections (limited sight angles).
- The alignment is determined in the network sketch.- The approach speed is mainly determined by the alignment and
length of the approaching links.- Priority regulations are dependant on categorisation of network links
(road categories and functions of intersecting links).
5.2. Number of intersections
0 Intersections are the most critical elements of transportation network.Simultaneous use of intersection space by road users with:- different directions- different travel modes- different speeds- different masses.
0 Accident figures in the USA (Kuciemba & Cirillo, 1992):- 55% of reported urban accidents take place at intersections.- 32% of reported rural accidents take place at intersections.- Although intersections form a small part of the transportation network,
over half over the motor vehicle accidents take place at intersections.0 Accident figures USA and Canada (Long, Gam & Morrison, 1993; Li,
1993):- Accident rates increase directly proportional with the average number
of intersections per kilometre.0 The number of intersections and access points should be limited.
- Especially on through-roads and distributor roads the number ofintersections should be limited.
- Where possible access points should be combined to reduce thenumber of intersections.
5.3. Intersection spacing
0 Intersection spacing influences:- the total number of intersections (potential conflicts).- the individual safety performance of intersections. Intersections and
access points should not be located within functional intersectionareas of other intersections.
0 Functional intersection area (TRB, 1996) is determined by:- stopping sight distance- intersection sight distance- length of turn lanes.
Stopping sight distance (AASHTO, 2001)
0 Stopping sight distance is the distance traversed by a vehicle from theinstant an object in its path is detected to a complete standstill in front ofthe object (see Table 6).
0 Stopping sight distance has to be provided at all intersections.
SWOV Publication D-2001-13 21
Intersection sight distance (AASHTO, 2001)
0 This is the distance that stopped or slowed vehicles on the minor roadhave to be able to see in order to detect oncoming, conflicting traffic onthe major road and to cross the intersection area safely.
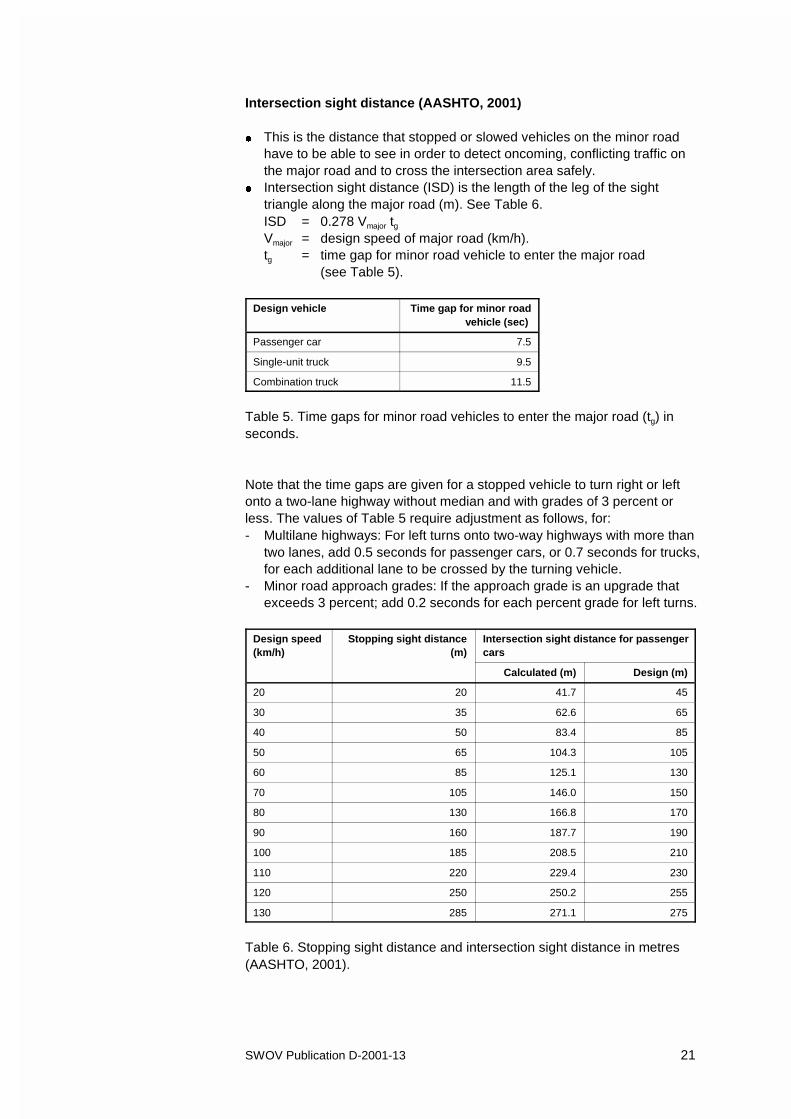
0 Intersection sight distance (ISD) is the length of the leg of the sighttriangle along the major road (m). See Table 6.ISD = 0.278 Vmajor tgVmajor = design speed of major road (km/h).tg = time gap for minor road vehicle to enter the major road
(see Table 5).
Design vehicle Time gap for minor roadvehicle (sec)
Passenger car 7.5
Single-unit truck 9.5
Combination truck 11.5
Table 5. Time gaps for minor road vehicles to enter the major road (tg) inseconds.
Note that the time gaps are given for a stopped vehicle to turn right or leftonto a two-lane highway without median and with grades of 3 percent orless. The values of Table 5 require adjustment as follows, for:- Multilane highways: For left turns onto two-way highways with more than
two lanes, add 0.5 seconds for passenger cars, or 0.7 seconds for trucks,for each additional lane to be crossed by the turning vehicle.
- Minor road approach grades: If the approach grade is an upgrade thatexceeds 3 percent; add 0.2 seconds for each percent grade for left turns.
Design speed(km/h)
Stopping sight distance(m)
Intersection sight distance for passengercars
Calculated (m) Design (m)
20 20 41.7 45
30 35 62.6 65
40 50 83.4 85
50 65 104.3 105
60 85 125.1 130
70 105 146.0 150
80 130 166.8 170
90 160 187.7 190
100 185 208.5 210
110 220 229.4 230
120 250 250.2 255
130 285 271.1 275
Table 6. Stopping sight distance and intersection sight distance in metres(AASHTO, 2001).
22 SWOV Publication D-2001-13
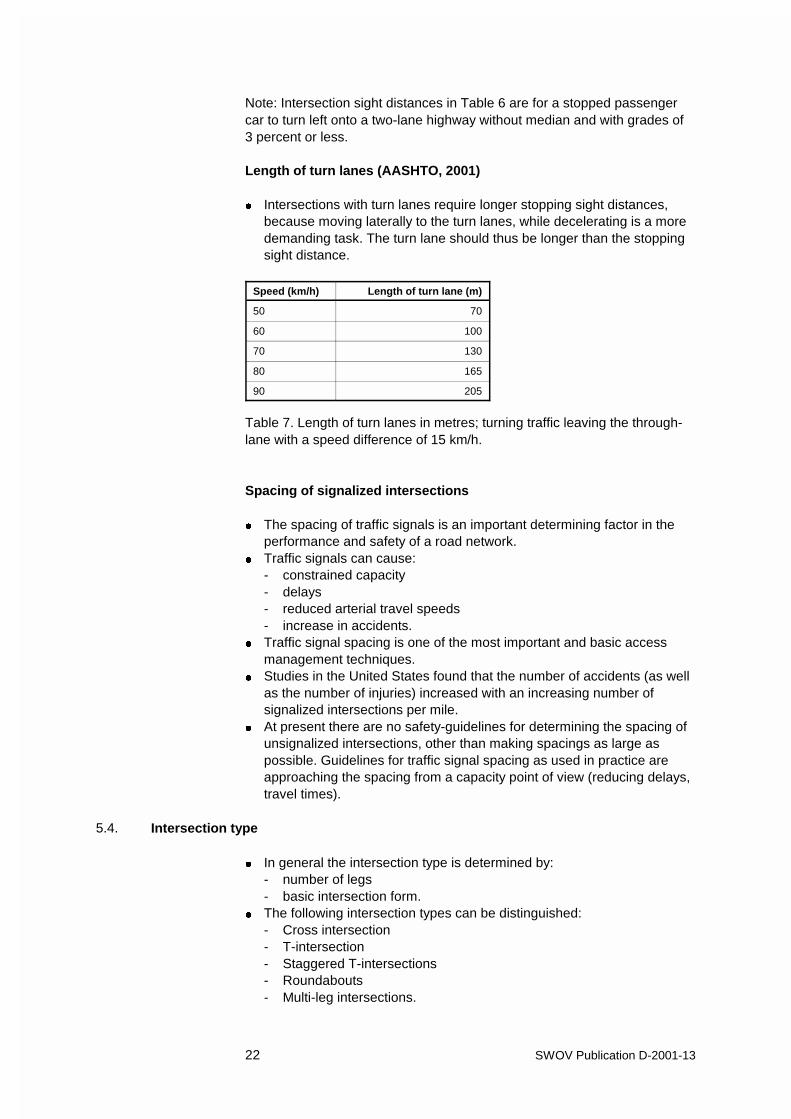
Note: Intersection sight distances in Table 6 are for a stopped passengercar to turn left onto a two-lane highway without median and with grades of3 percent or less.
Length of turn lanes (AASHTO, 2001)
0 Intersections with turn lanes require longer stopping sight distances,because moving laterally to the turn lanes, while decelerating is a moredemanding task. The turn lane should thus be longer than the stoppingsight distance.
Speed (km/h) Length of turn lane (m)
50 70
60 100
70 130
80 165
90 205
Table 7. Length of turn lanes in metres; turning traffic leaving the through-lane with a speed difference of 15 km/h.
Spacing of signalized intersections
0 The spacing of traffic signals is an important determining factor in theperformance and safety of a road network.
0 Traffic signals can cause:- constrained capacity- delays- reduced arterial travel speeds- increase in accidents.
0 Traffic signal spacing is one of the most important and basic accessmanagement techniques.
0 Studies in the United States found that the number of accidents (as wellas the number of injuries) increased with an increasing number ofsignalized intersections per mile.
0 At present there are no safety-guidelines for determining the spacing ofunsignalized intersections, other than making spacings as large aspossible. Guidelines for traffic signal spacing as used in practice areapproaching the spacing from a capacity point of view (reducing delays,travel times).
5.4. Intersection type
0 In general the intersection type is determined by:- number of legs- basic intersection form.
0 The following intersection types can be distinguished:- Cross intersection- T-intersection- Staggered T-intersections- Roundabouts- Multi-leg intersections.
SWOV Publication D-2001-13 23
Figure 2.
Figure 3.
Figure 4.
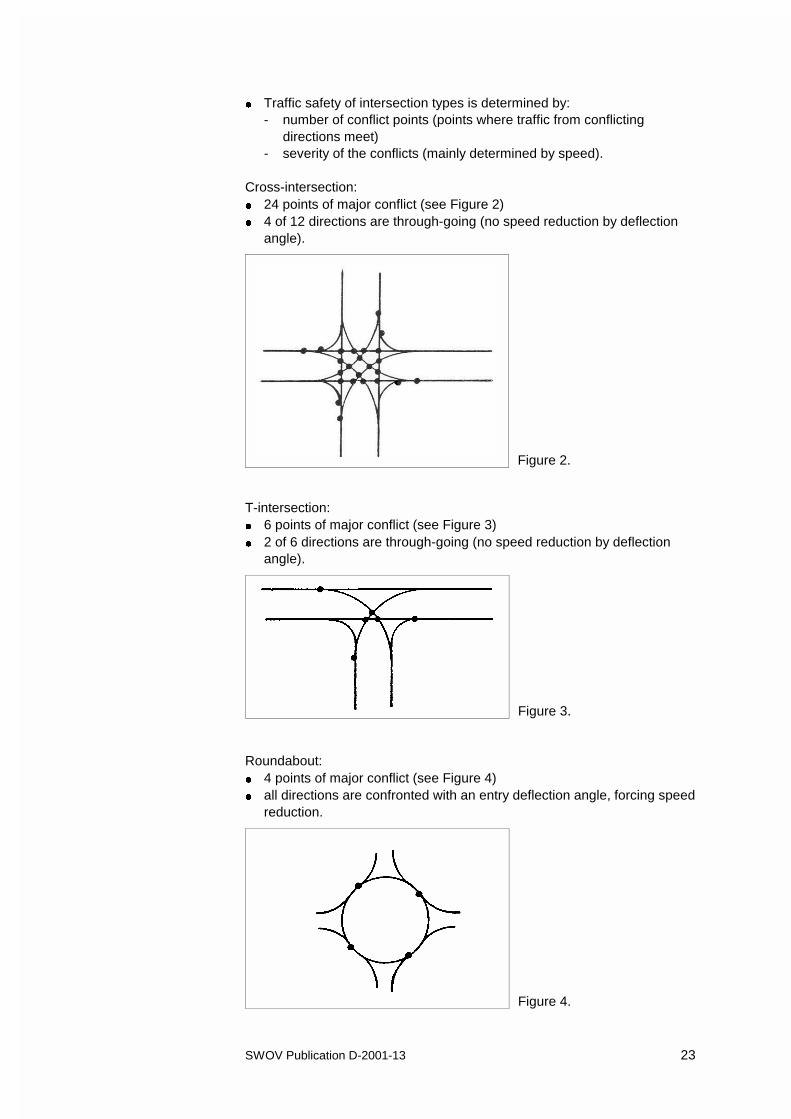
0 Traffic safety of intersection types is determined by:- number of conflict points (points where traffic from conflicting
directions meet)- severity of the conflicts (mainly determined by speed).
Cross-intersection:0 24 points of major conflict (see Figure 2)0 4 of 12 directions are through-going (no speed reduction by deflection
angle).
T-intersection:0 6 points of major conflict (see Figure 3)0 2 of 6 directions are through-going (no speed reduction by deflection
angle).
Roundabout:0 4 points of major conflict (see Figure 4)0 all directions are confronted with an entry deflection angle, forcing speed
reduction.
24 SWOV Publication D-2001-13
Figure 5.
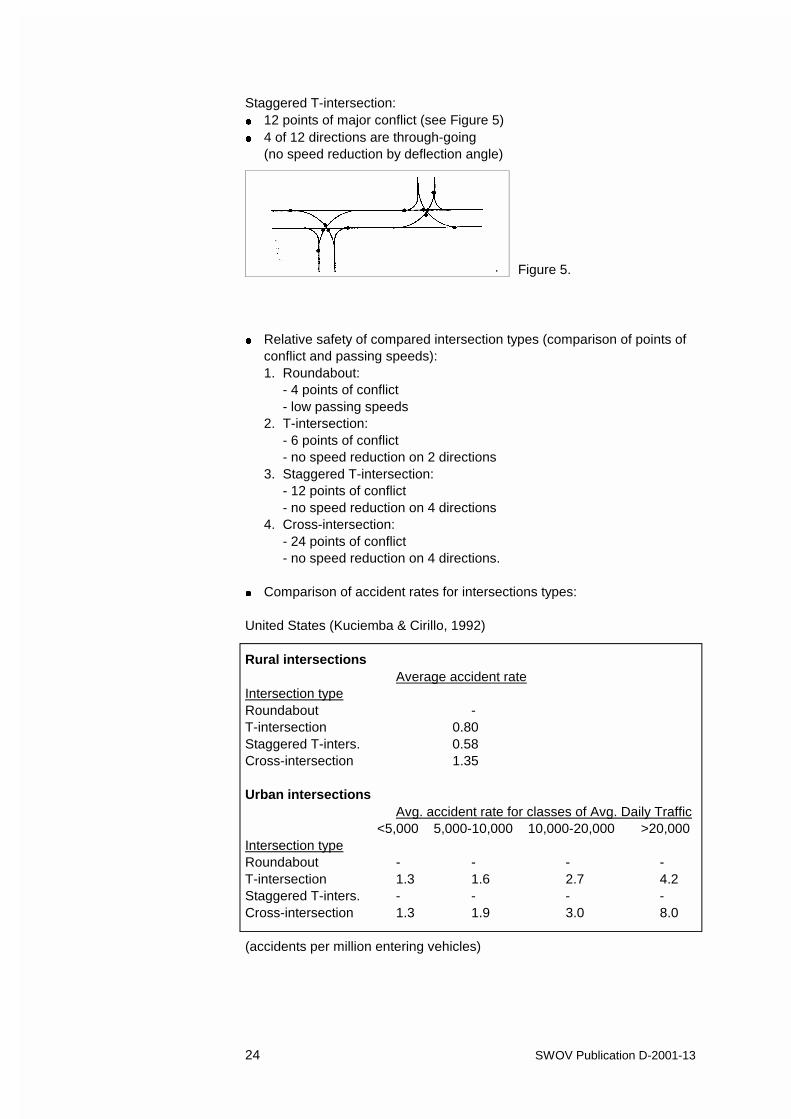
Staggered T-intersection:0 12 points of major conflict (see Figure 5)0 4 of 12 directions are through-going
(no speed reduction by deflection angle)
0 Relative safety of compared intersection types (comparison of points ofconflict and passing speeds):1. Roundabout:
- 4 points of conflict- low passing speeds
2. T-intersection:- 6 points of conflict- no speed reduction on 2 directions
3. Staggered T-intersection:- 12 points of conflict- no speed reduction on 4 directions
4. Cross-intersection:- 24 points of conflict- no speed reduction on 4 directions.
0 Comparison of accident rates for intersections types:
United States (Kuciemba & Cirillo, 1992)
Rural intersectionsAverage accident rate
Intersection typeRoundabout -T-intersection 0.80Staggered T-inters. 0.58Cross-intersection 1.35
Urban intersectionsAvg. accident rate for classes of Avg. Daily Traffic
<5,000 5,000-10,000 10,000-20,000 >20,000Intersection typeRoundabout - - - -T-intersection 1.3 1.6 2.7 4.2Staggered T-inters. - - - -Cross-intersection 1.3 1.9 3.0 8.0
(accidents per million entering vehicles)
SWOV Publication D-2001-13 25
Australia (Barton, 1989, cited by Ogden, 1996)
Average casualty accident rateIntersection typeRoundabout 0.16T-intersection, rural 0.33T-intersection, urban 0.15Staggered T-inters., rural 0.29Cross-intersection, rural 0.52Cross-intersection, urban 0.24
(casualty accidents per million entering vehicles)
Norway (Elvik, Mysen & Vaa, 1997)
% traffic from secondary road Avg. casualty acc. rateIntersection typeRoundabout all 0.05T-intersection, rural 0-14.9 % 0.06
15-29.9 % 0.12>30 % 0.26
T-intersection, urban 0-14.9 % 0.0815-29.9 % 0.11
>30 % 0.11Staggered T-inters. - -Cross intersection, rural 0-14.9 % 0.07
15-29.9 % 0.27>30 % 0.58
Cross-intersection, urban 0-14.9 % 0.0715-29.9 % 0.10
>30 % 0.31
(casualty accidents per million entering vehicles)
United Kingdom (Layfield et al., 1996)
Accidents per 100 million vehiclesIntersection typeCross-intersection 33.0Staggered T-inters. 23.2
(accidents per 100 million entering vehicles)
The Netherlands (Dijkstra, 1990)
Average casualty accident rateIntersection typeT-intersection, unsignalized 0.11Cross-intersection, unsignalized 0.21T-intersection, signalized 0.08Cross-intersection, signalized 0.20
(casualty accidents per million entering vehicles)
26 SWOV Publication D-2001-13
0 Accident rates in the United States as well as various Europeancountries prove that roundabouts and staggered T-intersections are saferintersection types than cross-intersections. The replacement of cross-intersections by roundabouts or staggered T-intersections is consideredto be an effective traffic safety measure both in the United States (e.g.Jacquemart, 1998) and in Europe (e.g. Van Minnen, 1990).
0 Multi-legged intersections should not be used:- Accident rates for multi-legged intersections are twice as high as for
normal cross-intersections. This is caused by:- complex traffic situation- unfavourable sight angles.
0 The speed-reducing effect of roundabouts is caused by:1. Deflection for entering traffic
- no tangential entries permitted- no straight movements through intersection- entering traffic points towards central island.
2. Limited diameter of roundabout- mini-roundabout: outside diameter approx. 15 m- compact roundabout: outside diameter between 30 - 35 m- multilane roundabout: outside diameter up to 150 m.
(Jacquemart, 1998)
5.5. General layout
5.5.1. Angle of intersection
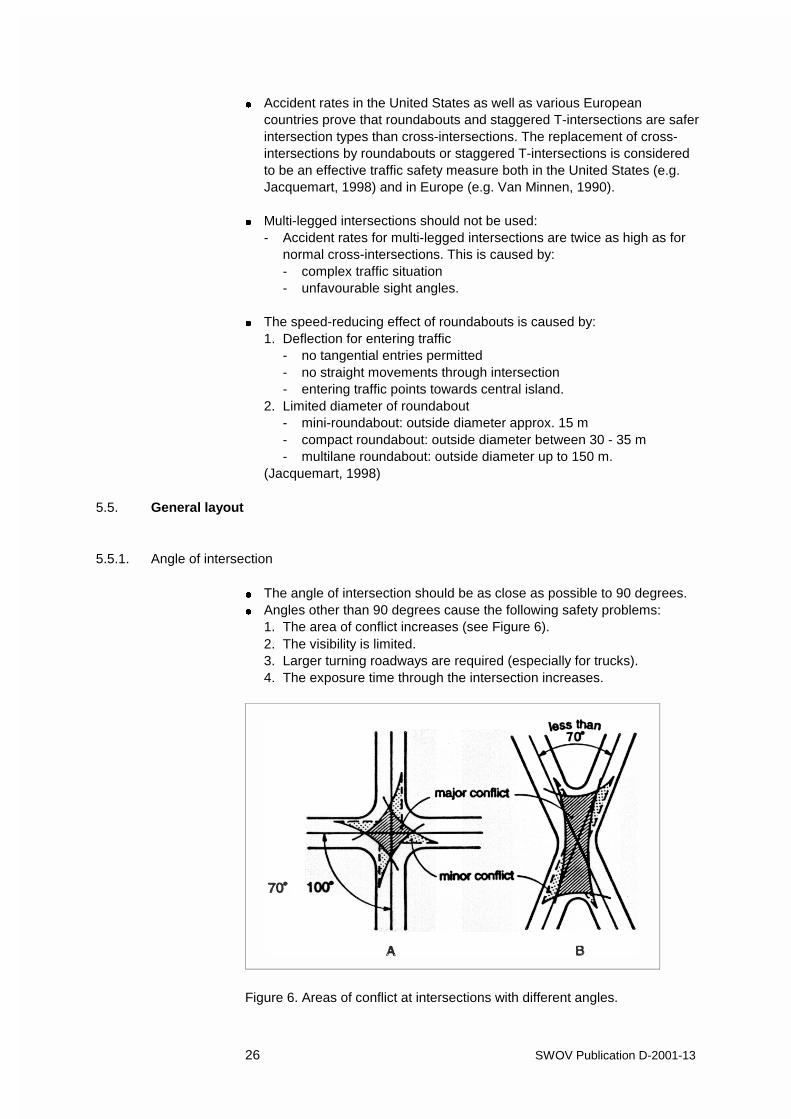
0 The angle of intersection should be as close as possible to 90 degrees.0 Angles other than 90 degrees cause the following safety problems:
1. The area of conflict increases (see Figure 6).2. The visibility is limited.3. Larger turning roadways are required (especially for trucks).4. The exposure time through the intersection increases.
Figure 6. Areas of conflict at intersections with different angles.
SWOV Publication D-2001-13 27
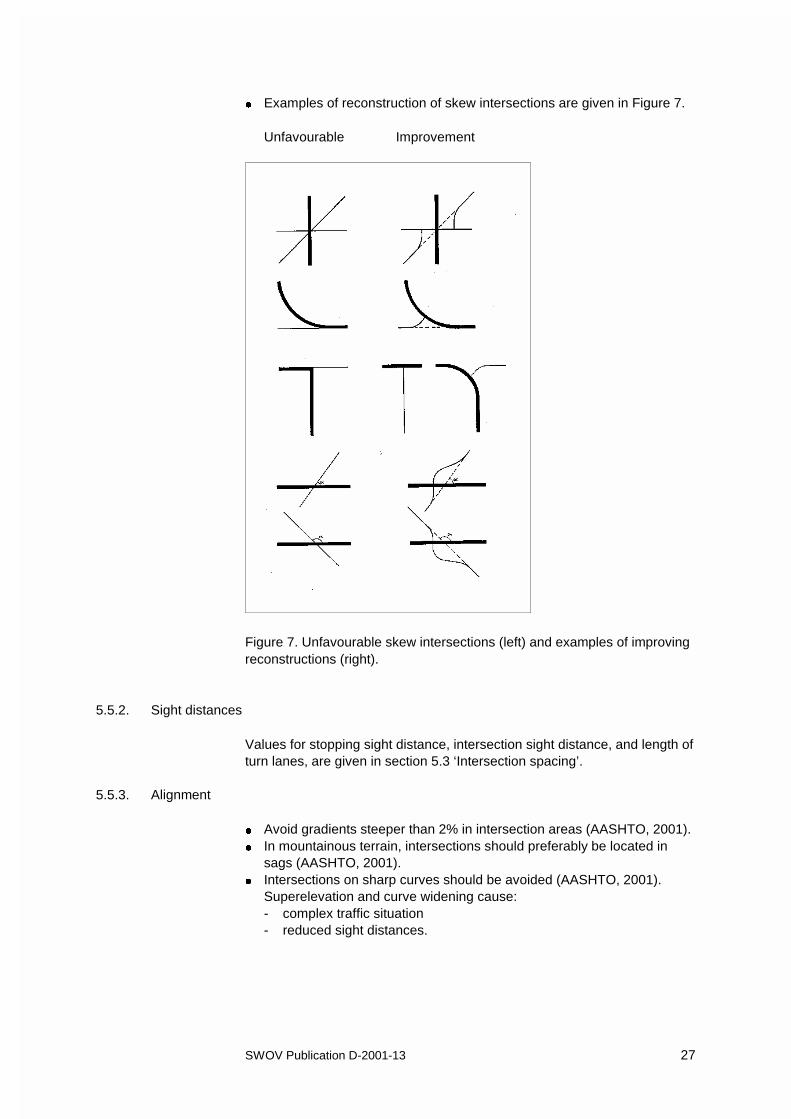
0 Examples of reconstruction of skew intersections are given in Figure 7.
Unfavourable Improvement
Figure 7. Unfavourable skew intersections (left) and examples of improvingreconstructions (right).
5.5.2. Sight distances
Values for stopping sight distance, intersection sight distance, and length ofturn lanes, are given in section 5.3 ‘Intersection spacing’.
5.5.3. Alignment
0 Avoid gradients steeper than 2% in intersection areas (AASHTO, 2001).0 In mountainous terrain, intersections should preferably be located in
sags (AASHTO, 2001).0 Intersections on sharp curves should be avoided (AASHTO, 2001).
Superelevation and curve widening cause:- complex traffic situation- reduced sight distances.
28 SWOV Publication D-2001-13
5.5.4. Approach speed
0 Speed at intersections should be lower than the design speed onmidblock sections.
0 Motorists should lower their speed while approaching an intersection.- Most important requirements: Intersection must be perceptible and
surveyable.
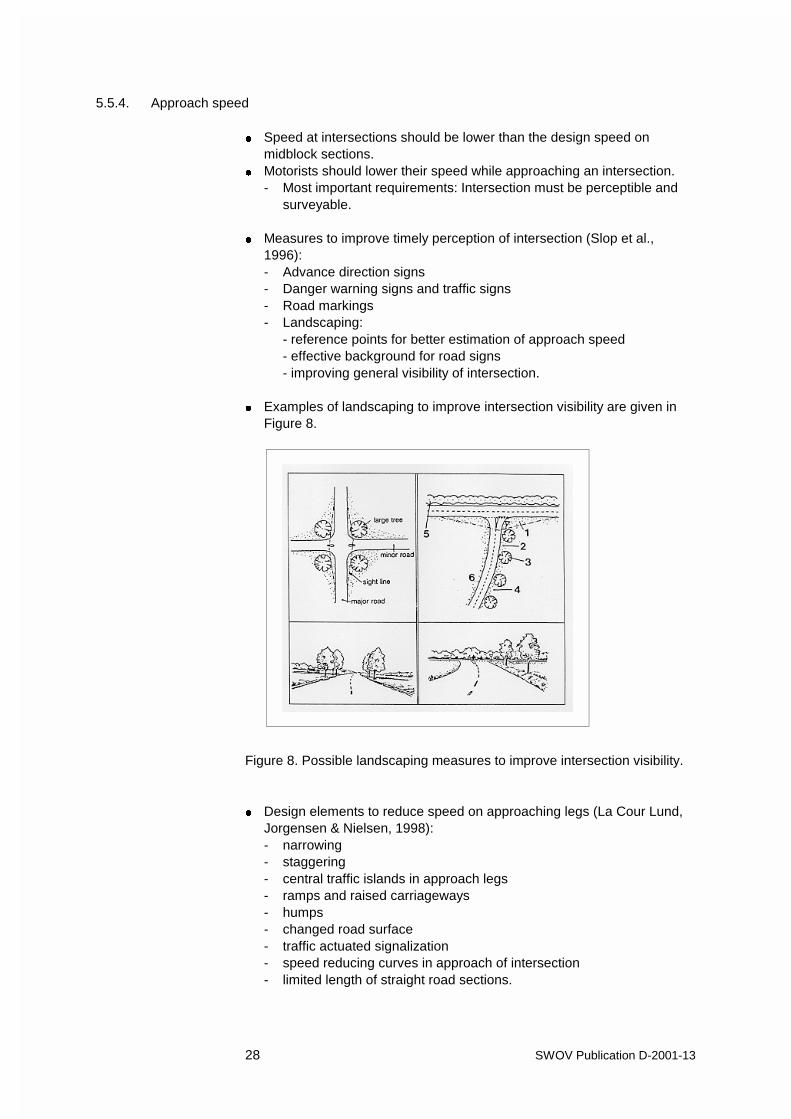
0 Measures to improve timely perception of intersection (Slop et al.,1996):- Advance direction signs- Danger warning signs and traffic signs- Road markings- Landscaping:
- reference points for better estimation of approach speed- effective background for road signs- improving general visibility of intersection.
0 Examples of landscaping to improve intersection visibility are given inFigure 8.
Figure 8. Possible landscaping measures to improve intersection visibility.
0 Design elements to reduce speed on approaching legs (La Cour Lund,Jorgensen & Nielsen, 1998):- narrowing- staggering- central traffic islands in approach legs- ramps and raised carriageways- humps- changed road surface- traffic actuated signalization- speed reducing curves in approach of intersection- limited length of straight road sections.
SWOV Publication D-2001-13 29
Figure 9.
5.5.5. Provisions for vulnerable road users
0 Locate crossing facilities for vulnerable road users at logical locations inroutes:- Detours could lead to shortcuts, which causes crossing manoeuvres
in unexpected locations.
0 Locate crossing facilities for vulnerable road users at intersections:- higher attention and expectancy of crossing manoeuvres- logical allocation in cycle and pedestrian routes (mostly adjacent to
roads).(Slop et al., 1996)
0 Design principles of bicycle and pedestrian crossings:- enhance mutual visibility- minimize conflict lengths- reduce vehicle speed.
0 Types of bicycle crossings at intersections:1. Mixed traffic:
- no cycle tracks or cycle lanes- applied in intersections with low volumes and low speeds.
2. Cycle lanes:- continue cycle lane markings through intersection- markings remind motorists of possible presence of cycles;
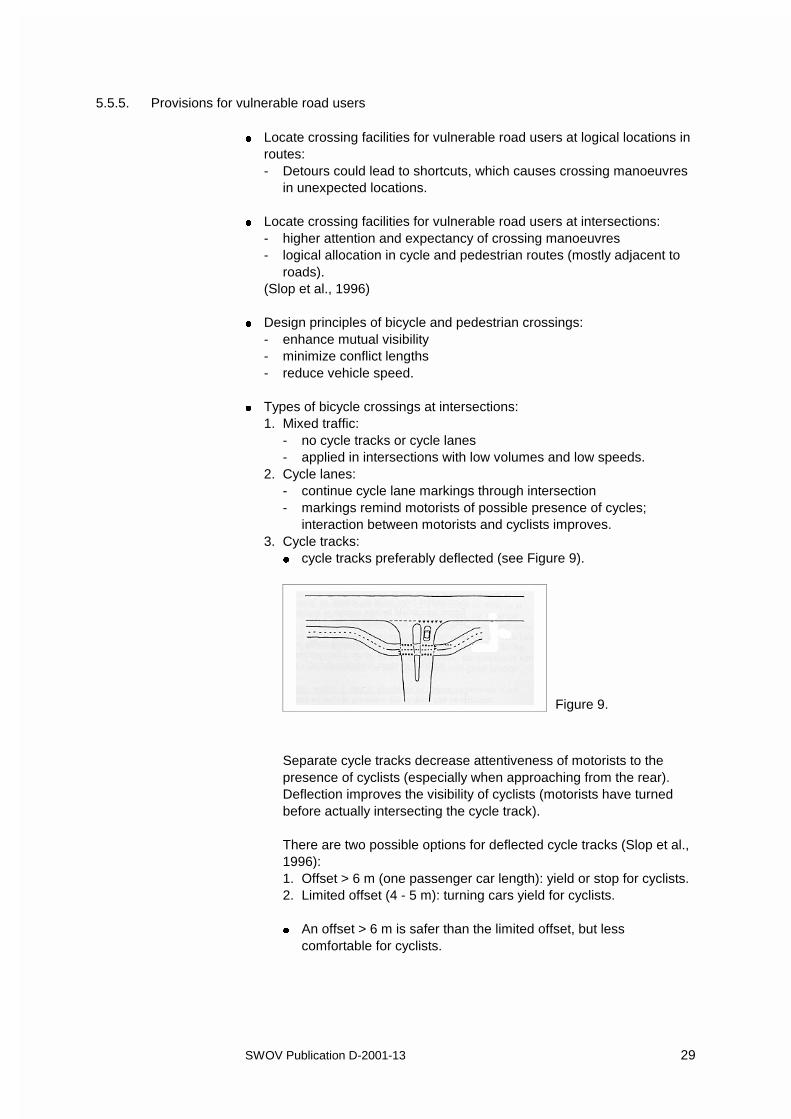
interaction between motorists and cyclists improves.3. Cycle tracks:
0 cycle tracks preferably deflected (see Figure 9).
Separate cycle tracks decrease attentiveness of motorists to thepresence of cyclists (especially when approaching from the rear).Deflection improves the visibility of cyclists (motorists have turnedbefore actually intersecting the cycle track).
There are two possible options for deflected cycle tracks (Slop et al.,1996):1. Offset > 6 m (one passenger car length): yield or stop for cyclists.2. Limited offset (4 - 5 m): turning cars yield for cyclists.
0 An offset > 6 m is safer than the limited offset, but lesscomfortable for cyclists.
30 SWOV Publication D-2001-13
Figure 11.
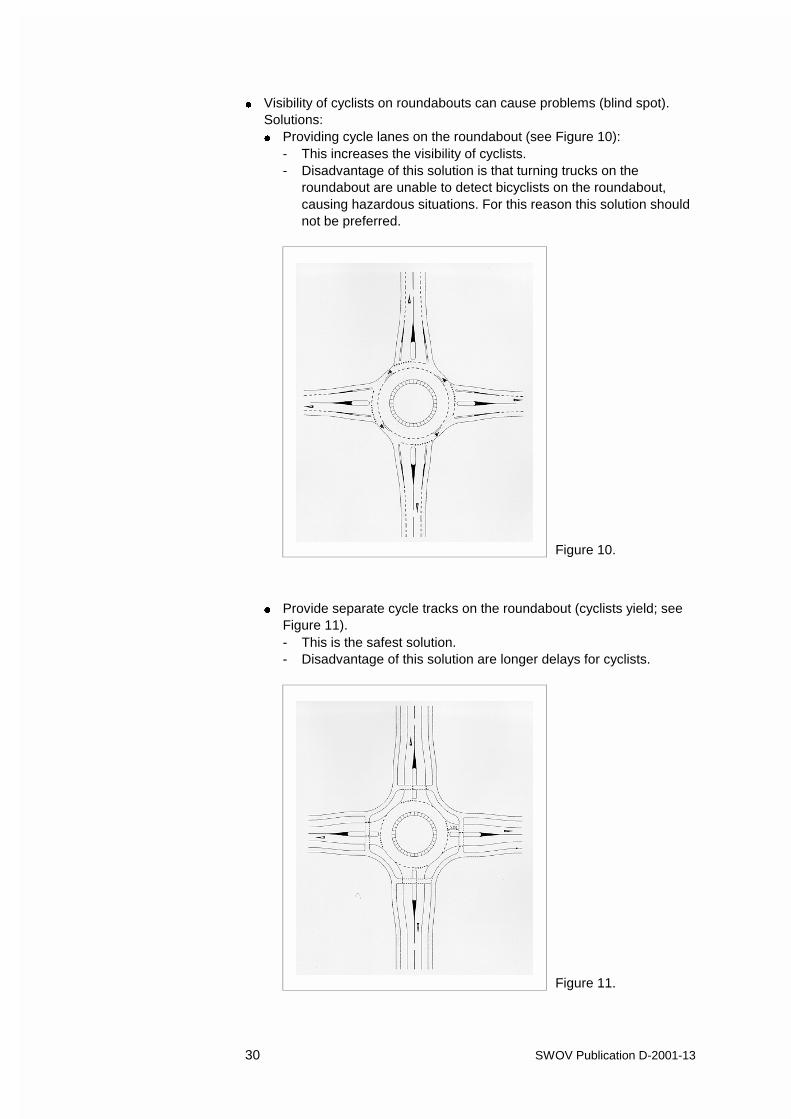
Figure 10.
0 Visibility of cyclists on roundabouts can cause problems (blind spot).Solutions:0 Providing cycle lanes on the roundabout (see Figure 10):
- This increases the visibility of cyclists.- Disadvantage of this solution is that turning trucks on the
roundabout are unable to detect bicyclists on the roundabout,causing hazardous situations. For this reason this solution shouldnot be preferred.
0 Provide separate cycle tracks on the roundabout (cyclists yield; seeFigure 11).- This is the safest solution.- Disadvantage of this solution are longer delays for cyclists.
SWOV Publication D-2001-13 31
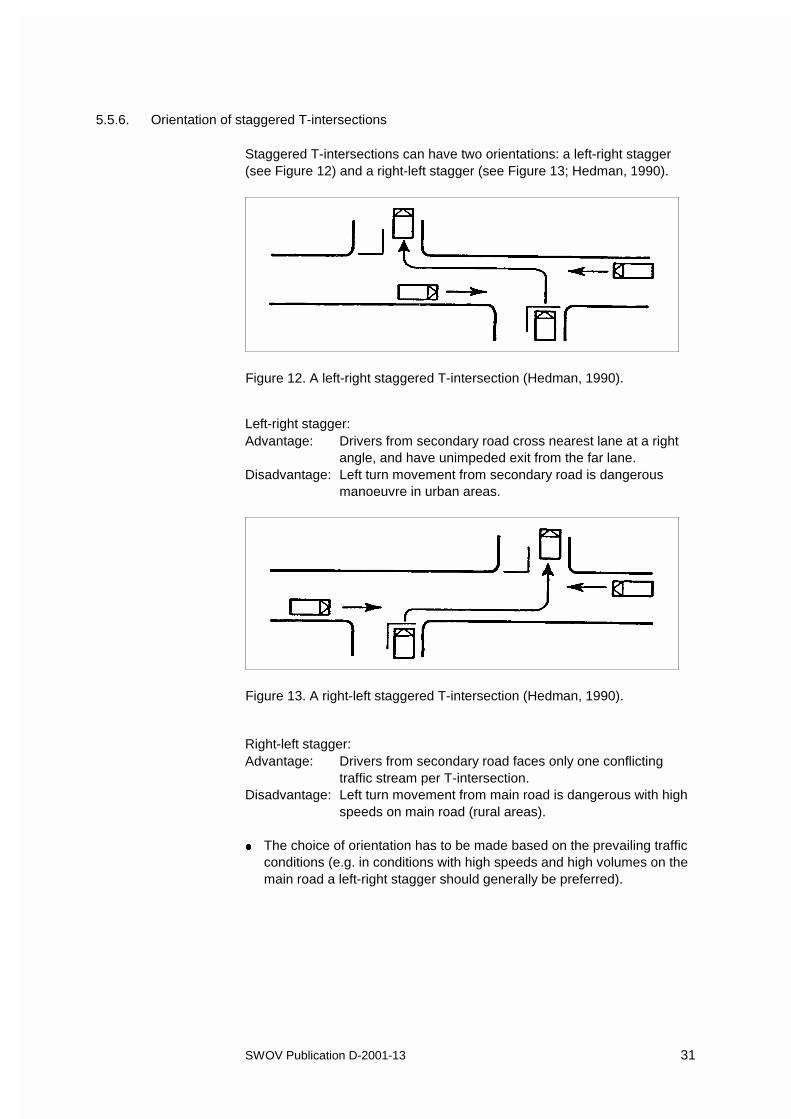
Figure 12. A left-right staggered T-intersection (Hedman, 1990).
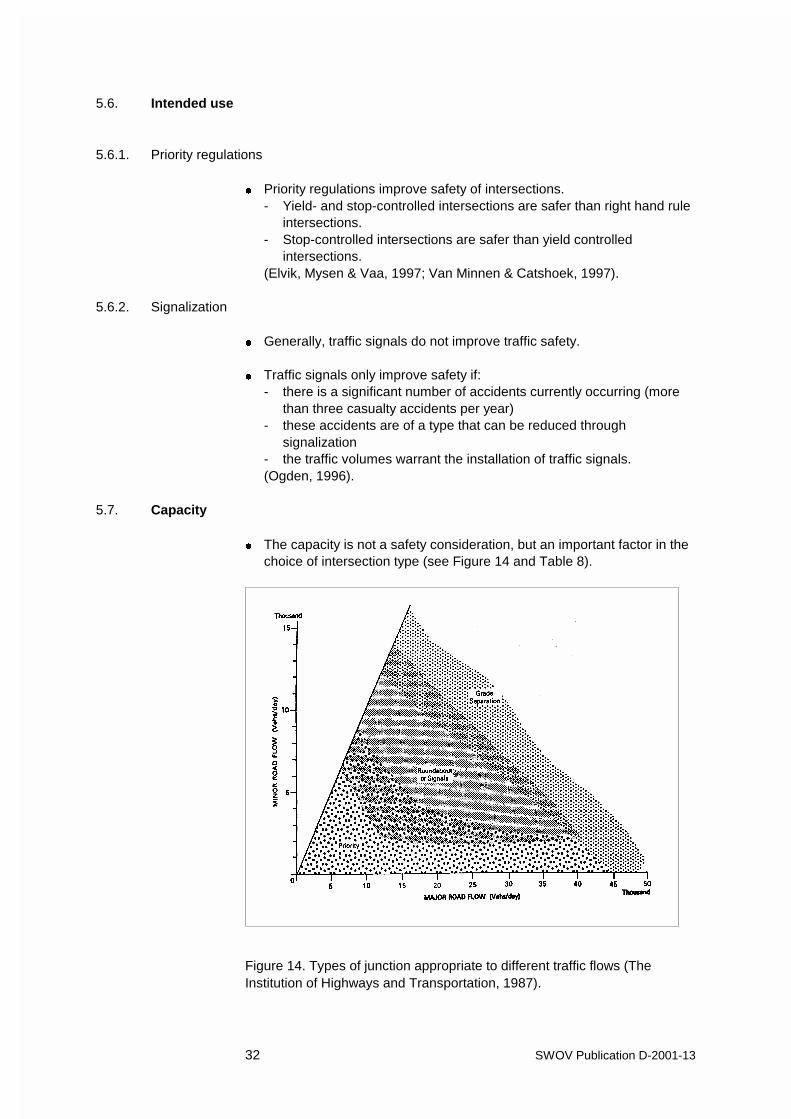
Figure 13. A right-left staggered T-intersection (Hedman, 1990).
5.5.6. Orientation of staggered T-intersections
Staggered T-intersections can have two orientations: a left-right stagger(see Figure 12) and a right-left stagger (see Figure 13; Hedman, 1990).
Left-right stagger:Advantage: Drivers from secondary road cross nearest lane at a right
angle, and have unimpeded exit from the far lane.Disadvantage: Left turn movement from secondary road is dangerous
manoeuvre in urban areas.
Right-left stagger:Advantage: Drivers from secondary road faces only one conflicting
traffic stream per T-intersection.Disadvantage: Left turn movement from main road is dangerous with high
speeds on main road (rural areas).
0 The choice of orientation has to be made based on the prevailing trafficconditions (e.g. in conditions with high speeds and high volumes on themain road a left-right stagger should generally be preferred).
32 SWOV Publication D-2001-13
5.6. Intended use
5.6.1. Priority regulations
0 Priority regulations improve safety of intersections.- Yield- and stop-controlled intersections are safer than right hand rule
intersections.- Stop-controlled intersections are safer than yield controlled
intersections.(Elvik, Mysen & Vaa, 1997; Van Minnen & Catshoek, 1997).
5.6.2. Signalization
0 Generally, traffic signals do not improve traffic safety.
0 Traffic signals only improve safety if:- there is a significant number of accidents currently occurring (more
than three casualty accidents per year)- these accidents are of a type that can be reduced through
signalization- the traffic volumes warrant the installation of traffic signals.(Ogden, 1996).
5.7. Capacity
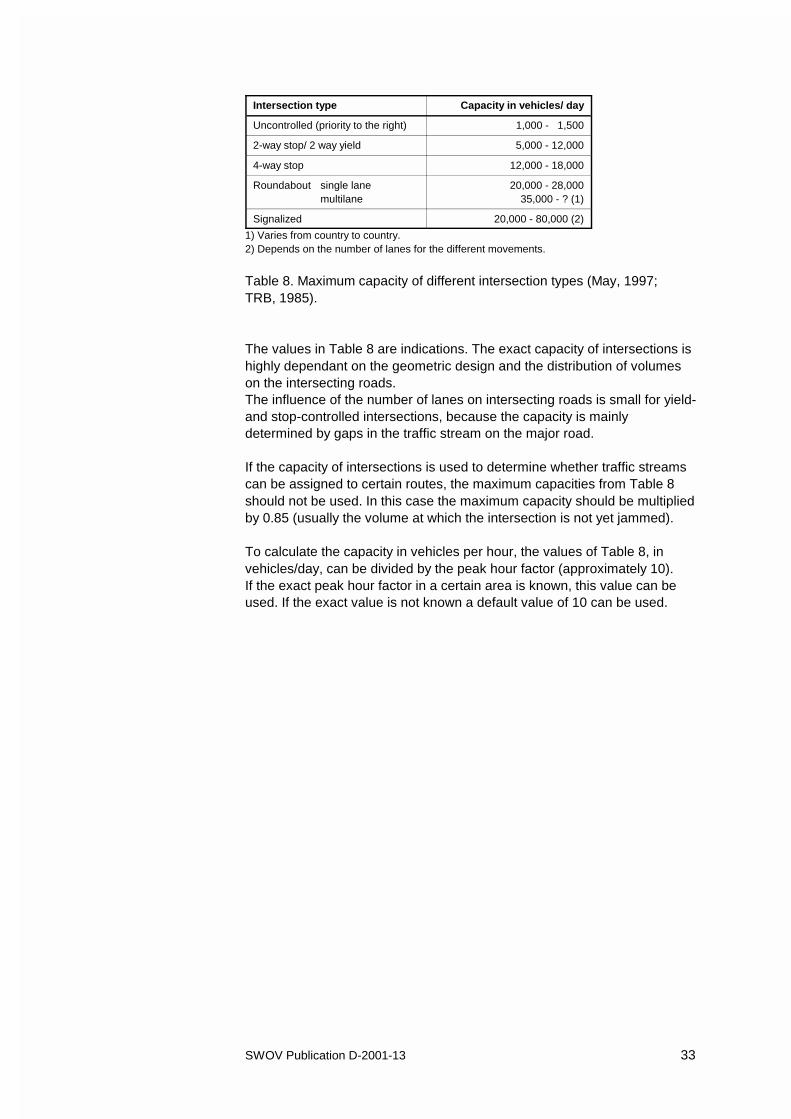
0 The capacity is not a safety consideration, but an important factor in thechoice of intersection type (see Figure 14 and Table 8).
Figure 14. Types of junction appropriate to different traffic flows (TheInstitution of Highways and Transportation, 1987).
SWOV Publication D-2001-13 33
Intersection type Capacity in vehicles/ day
Uncontrolled (priority to the right) 1,000 - 1,500
2-way stop/ 2 way yield 5,000 - 12,000
4-way stop 12,000 - 18,000
Roundabout single lanemultilane
20,000 - 28,00035,000 - ? (1)
Signalized 20,000 - 80,000 (2)
1) Varies from country to country.2) Depends on the number of lanes for the different movements.
Table 8. Maximum capacity of different intersection types (May, 1997;TRB, 1985).
The values in Table 8 are indications. The exact capacity of intersections ishighly dependant on the geometric design and the distribution of volumeson the intersecting roads.The influence of the number of lanes on intersecting roads is small for yield-and stop-controlled intersections, because the capacity is mainlydetermined by gaps in the traffic stream on the major road.
If the capacity of intersections is used to determine whether traffic streamscan be assigned to certain routes, the maximum capacities from Table 8should not be used. In this case the maximum capacity should be multipliedby 0.85 (usually the volume at which the intersection is not yet jammed).
To calculate the capacity in vehicles per hour, the values of Table 8, invehicles/day, can be divided by the peak hour factor (approximately 10).If the exact peak hour factor in a certain area is known, this value can beused. If the exact value is not known a default value of 10 can be used.
34 SWOV Publication D-2001-13
References
AASHTO (2001). A policy on geometric design of highways and streets(Green Book); fourth edition. American Association of State Highway andTransportation Officials. Washington, D.C., USA
Barton, E.V. (1989). Performance and design of intersections. In: Ogden,K.W. & Bennett, D.W. (eds.) Traffic Engineering Practice (4th edition).Monash University, Melbourne, Australia.
Cairney, P.T. & Catchpole, J.E. (1991). Road user behaviours whichcontribute to accidents at urban arterial / local intersections. ResearchReport ARR 197. Australian Road Research Board, Vermont South,Victoria, Australia.
La Cour Lund, B., Jorgensen, E. & Nielsen, E.D. (1998). Design of majorurban junctions; Review of guidelines and research studies wit focus onroad safety. Danish Road Directorate, Copenhagen, Denmark.
Dijkstra, A. (1990). Probleemsituaties op verkeersaders in de bebouwdekom; tweede fase: selectie van probleemsituaties. R-90-13. SWOV Institutefor Road Safety Research. Leidschendam, the Netherlands. [In Dutch].
Elvik, R., Mysen, A.B. & Vaa, T. (1997). Trafiksikkerhetshandbok: oversiktover virkninger, kostnader og offentlige ansvarsforhold for 124trafiksikkerhetstiltak. Institute of Transport Economics, Oslo, Norway. [InNorwegian].
Hedman, K.O. (1990). Road design and safety. In: Proceedings of StrategicHighway Research Program and Traffic Safety on Two Continents inGothenburg, Sweden, 27-29 September 1989. VTI-report 351A. SwedishRoad and Traffic Research Institute, Linkoping, Sweden.
Howie, D.J. & Oulton, G. (1989). Crashes at Traffic Signals. MonashUniversity Accident Research Centre, Melbourne, Australia.
Hummel, T. (2001a). Access management in Safer Transportation NetworkPlanning. D-2001-10. SWOV Institute for Road Safety Research,Leidschendam, the Netherlands.
Hummel, T. (2001b). Route management in Safer Transportation NetworkPlanning. D-2001-11. SWOV Institute for Road Safety Research,Leidschendam, the Netherlands.
Hummel, T. (2001c). Land use planning in Safer Transportation NetworkPlanning. D-2001-12. SWOV Institute for Road Safety Research,Leidschendam, the Netherlands.
The Institution of Highways and Transportation & The Department ofTransport (1987). Roads and traffic in urban areas. Her Majesty’s StationaryOffice HMSO, London, United Kingdom.
SWOV Publication D-2001-13 35
Jacquemart, P.E. (1998). Modern roundabout practice in the United States.National Cooperative Highway Research Program NCHRP, Synthesis ofHighway Practice no. 264. Transportation Research Board, Washington,D.C., USA.
Kuciemba, S.R. & Cirillo J.A. (1992). Safety effectiveness of highwaydesign features, Volume V: Intersections. FHWA-RD-91-048. FederalHighway Administration, Washington, D.C., USA.
Layfield, R.E., Summersgill, I., Hall, R.D. & Chatterjee, K. (1996). Accidentsat urban priority crossroads and staggered junctions. TRL Report 185.Crowthorne, United Kingdom.
Li, Jian (1993). Study of Access and Accident Relationships. Prepared forHighway Safety Branch, The Ministry of Transportation and Highways,Victoria, Australia.
Long, G., Gam, C. & Morrison, B. (1993). Safety impacts of selectedmedian and access design features. Transportation Research Centre,University of Florida, Gainesville, USA.
May, A. (1997). Review of international practices used to evaluateunsignalized intersections. Transportation Research Circular no. 468.Transportation Research Board, Washington, D.C., USA.
Minnen, J. van. (1990). Ongevallen op rotondes; Vergelijkende studie vande onveiligheid op een aantal locaties waar een kruispunt werd vervangendoor een ‘nieuwe’ rotonde. R-90-47. SWOV Institute for Road SafetyResearch, Leidschendam, the Netherlands. [In Dutch].
Minnen, J. van & Catshoek, J.W.D. (1997). Uniformering voorrangsregeling.R-97-24. SWOV Institute for Road Safety Research, Leidschendam, theNetherlands. [In Dutch].
Ogden, K.W. (1996). Safer roads: A guide to road safety engineering.Avebury Technical, Aldershot, Australia.
Slop, M., Jouineau, J.P., Machu, C., Weber, R, Bergh, T., ZaragozaRamirez, A. & Janssen, T. (1996). Technical guide on road safety forinterurban roads: INTERSAFE. European Road Safety Federation,Brussels, Belgium.
TRB (1996). Driveway and street intersection spacing. TransportationResearch Circular no. 456. Committee on Access Management,Transportation Research Board. Washington, D.C., USA.
