interval cancers in breastscreen aotearoa - nsu · web viewinterval cancers in breastscreen...
TRANSCRIPT
Interval Cancers in BreastScreen Aotearoa2008–2009
Released 2018 nsu.govt.nz
Citation: National Screening Unit. 2018. Interval Cancers in BreastScreen Aotearoa
2008–2009. Wellington: Ministry of Health.
Published in February 2018by the Ministry of Health
PO Box 5013, Wellington 6140, New Zealand
ISBN 978-1-98-853949-2 (online)HP 6783
This document is available at nsu.govt.nz
This work is licensed under the Creative Commons Attribution 4.0 International licence. In essence, you are free to: share ie, copy and redistribute the material in any medium or format; adapt ie, remix, transform and build upon the material. You must give appropriate credit, provide a link to the licence and indicate if changes were made.
GlossaryAssessment consists of the further investigation of a mammographic abnormality reported at screening.
Early review, early recall or extended assessment refers to a woman who is assessed and not cleared for routine rescreening, but is referred for further assessment within 12 months of the index screen.
Initial screening includes all women who attend BSA for the first time. Also referred to as first round screening.
Rescreening refers to the next screening examination after the screening episode in the index screening year being evaluated.
A screening episode consists of the screening examination and assessment, if necessary. For the purpose of determining interval cancer rates, early review, early recall or extended assessment within 12 months of initial screen is not considered part of the screening episode.
Subsequent screening includes all women who have previously been screened by BSA.
Symptoms refer to the self-report of a breast lump and/or blood-stained or watery nipple discharge.
Interval Cancers in BreastScreen Aotearoa 2008–2009 iii
Lead Provider abbreviations
BSAL BreastScreen Auckland Limited
BSCM BreastScreen Counties Manukau
BSWN BreastScreen Waitemata Northland
BSM BreastScreen Midland
BSCC BreastScreen Coast to Coast
BSC BreastScreen Central
BSSL BreastScreen South Limited
BSHC BreastScreen Health Care
iv Interval Cancers in BreastScreen Aotearoa 2008–2009
ContentsGlossary
Lead Provider abbreviations
Executive summaryIntroductionMethodsResults
1 Introduction
2 Methods2.1 Screening cohort2.2 Interval cancer definition2.3 Matching between BSA and Cancer Registry data2.4 Interval cancer rates2.5 Programme sensitivity2.6 Confidence interval calculations
3 Results3.1 Programme interval cancers3.2 Programme sensitivity3.3 BSA Lead Provider results3.4 Trends by ethnicity
4 International comparisons
References
Appendix
Interval Cancers in BreastScreen Aotearoa 2008–2009 v
List of TablesTable 1: Case definition for invasive breast cancer
Table 2: Exclusions from interval cancerTable 3: First-year (<12 months) interval breast cancers after an initial or
subsequent screen by age group and screening year, BSA programme, 2008–2009
Table 4: Second-year (12 to <24 months) interval breast cancers after an initial or subsequent screen by age group and screening year, BSA programme, 2008–2009
Table 5: First-year (<12 months) programme sensitivity (%) after an initial or subsequent screen by age group and screening year, 2008–2009
Table 6: Second-year (12 to <24 months) programme sensitivity (%) after an initial or subsequent screen by age group and screening year, 2008–2009
Table 7: First-year (<12 months) interval breast cancers after an initial or subsequent screen by ethnicity and screening year, 2008–2009
Table 8: Second-year (12–24 months) interval breast cancers after an initial or subsequent screen by ethnicity and screening year, 2008–2009
Table 9: First-year (<12 months) programme sensitivity (%) after an initial or subsequent screen by ethnicity and screening year, 2008–2009
Table 10: Second-year (12–24 months) programme sensitivity (%) after an initial or subsequent screen by ethnicity and screening year, 2008–2009
Table 11: BSA 2008–09 interval cancer rates compared with the Australian and UK national screening programmes
Table 12: BSA 2008–09 programme sensitivity compared with the Australian national screening programme
Table 13: First-year (<12 months) interval breast cancers after an initial or subsequent screen by age group and BSA Lead Provider, 2008–2009
Table 14: Second-year (12–24 months) interval breast cancers after an initial or subsequent screen by age group and BSA Lead Provider, 2008–2009
Table 15: First-year (<12 months) programme sensitivity (%) after an initial or subsequent screen by age group and BSA Lead Provider, 2008–2009
Table 16: Second-year (12 to <24 months) programme sensitivity (%) after an initial or subsequent screen by age group and BSA Lead Provider, 2008–2009
vi Interval Cancers in BreastScreen Aotearoa 2008–2009
List of FiguresFigure 1: Interval cancers by five-year age group 45–69 years, initial and
subsequent screens, 2008–2009 aggregated, with 95% confidence intervals
Figure 2: Interval cancers occurring in first year (<12 months) and second year (12–24 months) following initial or subsequent screens occurring in 1999–2009, women aged 45–69 years, with 95% confidence intervals
Figure 3: Programme sensitivity by age 45–69 years, by interval cancers in first and second year following initial or subsequent screen, with 95% confidence intervals, 2008–2009
Figure 4: Programme sensitivity (%) by first and subsequent screens in relation to interval cancers in the first year (<12 months) and second year (12–24 months) following screens occurring in 1999–2009, with 95% confidence intervals
Figure 5: Interval cancer rates by BSA Lead Provider, by first- and second-year interval cancers and by initial and subsequent screens, with 95% confidence intervals, 2008–2009
Figure 6: Programme sensitivity by BSA Lead Provider, by first- and second-year interval cancers and by initial and subsequent screens, with 95% confidence intervals, 2008–2009
Figure 7: Trends in interval cancer rates by BSA Lead Provider, 1999–2009, with 95% confidence intervals
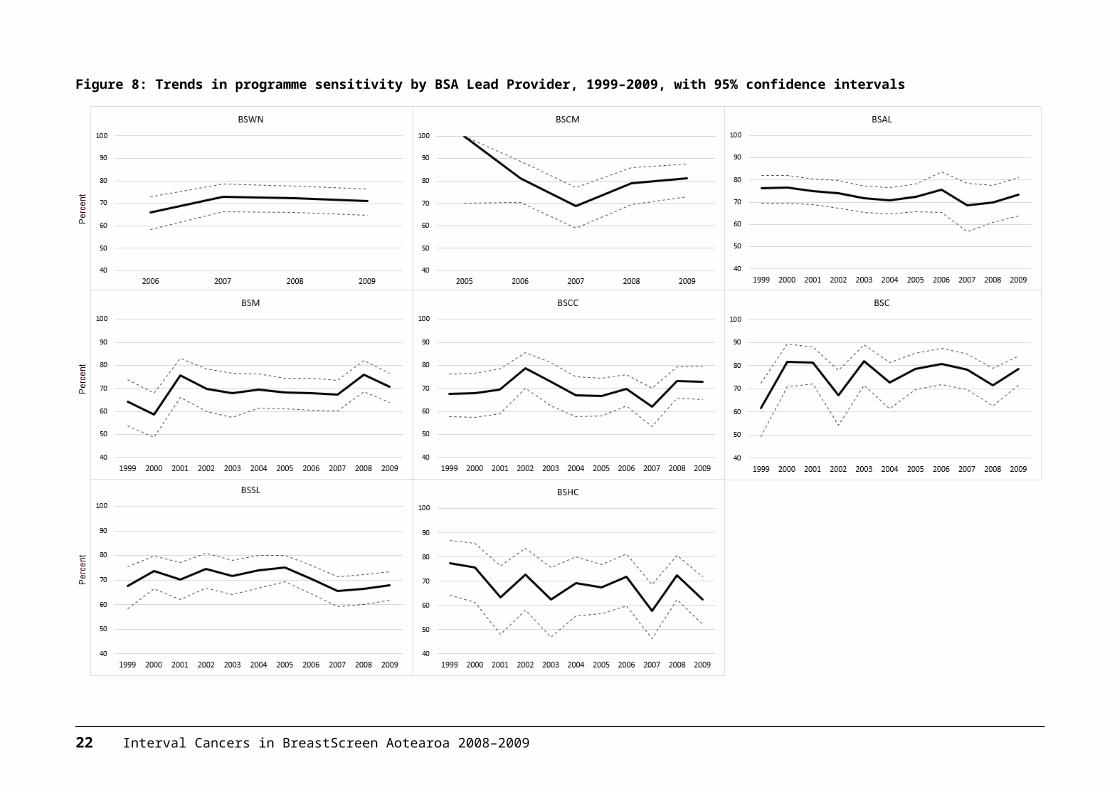
Figure 8: Trends in programme sensitivity by BSA Lead Provider, 1999–2009, with 95% confidence intervals
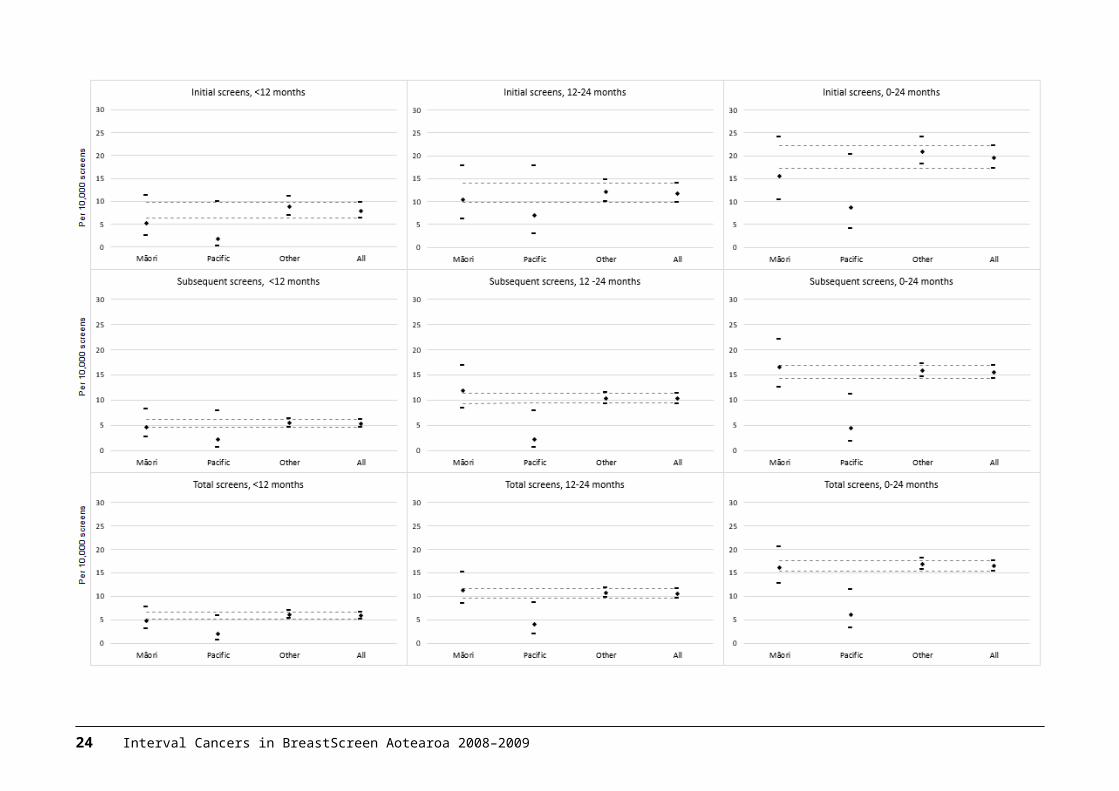
Figure 9: Interval cancer rates by ethnicity, by first- and second-year interval cancers and by initial and subsequent screens, with 95% confidence intervals, 2008–2009
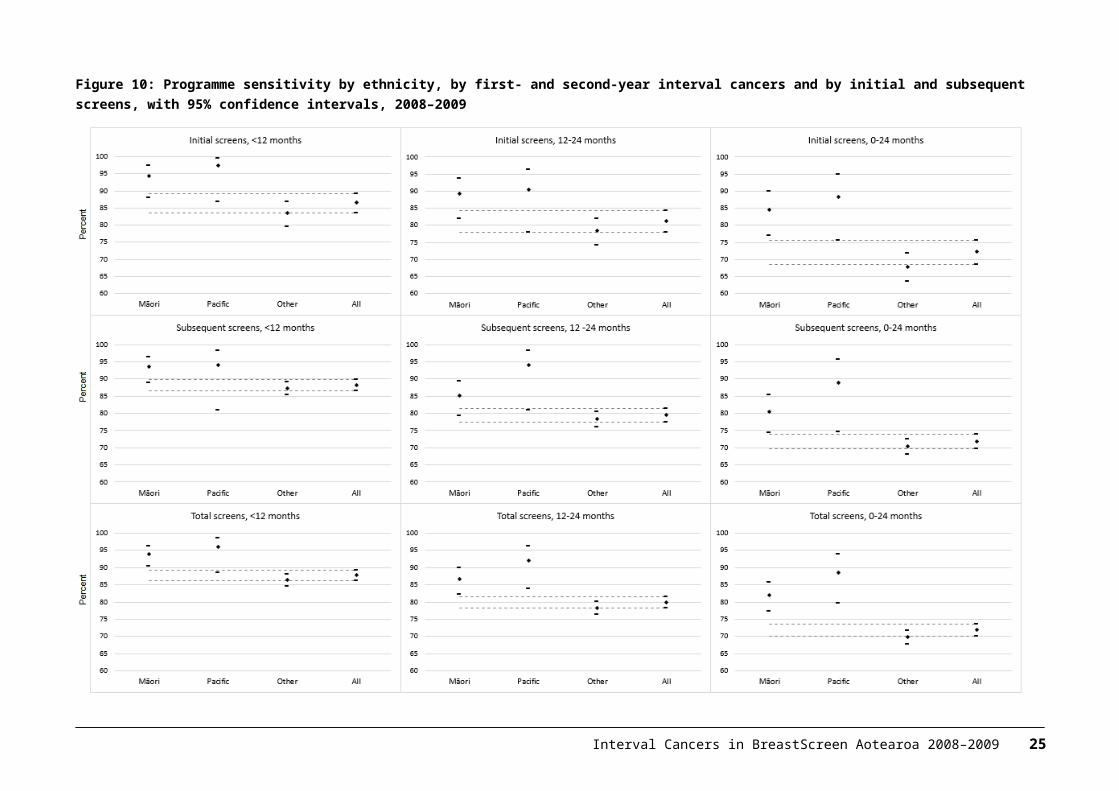
Figure 10: Programme sensitivity by ethnicity, by first- and second-year interval cancers and by initial and subsequent screens, with 95% confidence intervals, 2008–2009
Interval Cancers in BreastScreen Aotearoa 2008–2009 vii


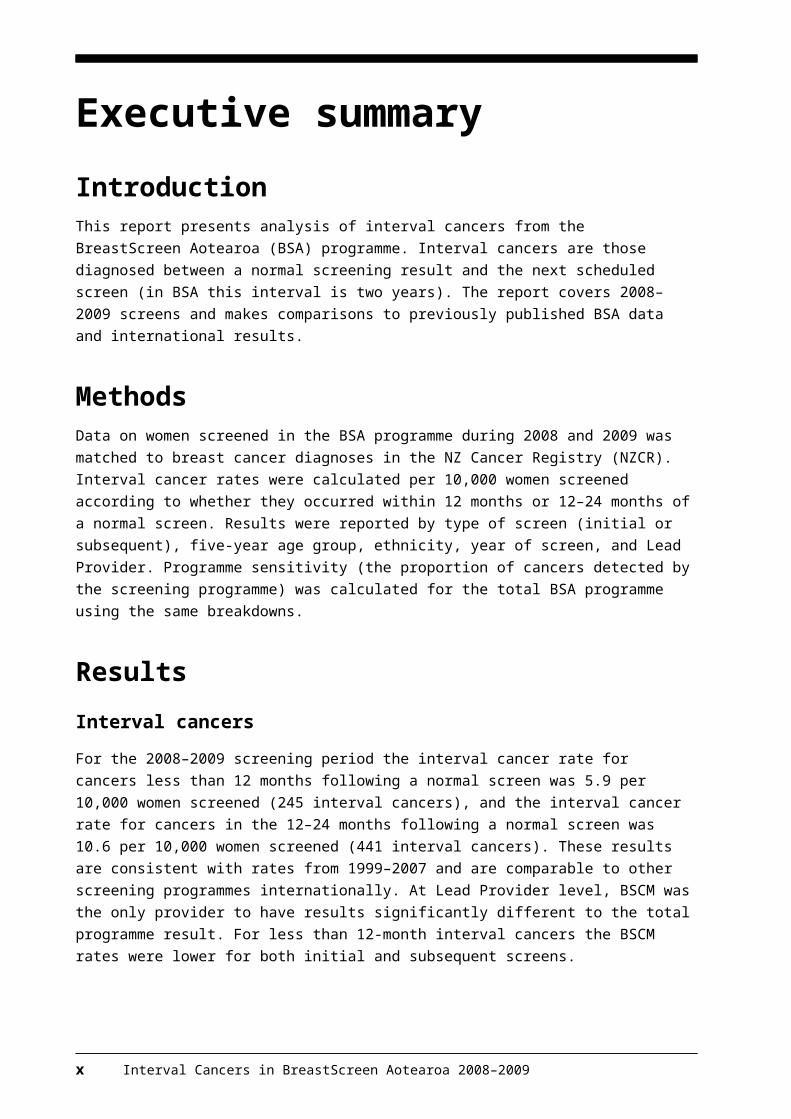
Executive summaryIntroductionThis report presents analysis of interval cancers from the BreastScreen Aotearoa (BSA) programme. Interval cancers are those diagnosed between a normal screening result and the next scheduled screen (in BSA this interval is two years). The report covers 2008–2009 screens and makes comparisons to previously published BSA data and international results.
MethodsData on women screened in the BSA programme during 2008 and 2009 was matched to breast cancer diagnoses in the NZ Cancer Registry (NZCR). Interval cancer rates were calculated per 10,000 women screened according to whether they occurred within 12 months or 12–24 months of a normal screen. Results were reported by type of screen (initial or subsequent), five-year age group, ethnicity, year of screen, and Lead Provider. Programme sensitivity (the proportion of cancers detected by the screening programme) was calculated for the total BSA programme using the same breakdowns.
ResultsInterval cancersFor the 2008–2009 screening period the interval cancer rate for cancers less than 12 months following a normal screen was 5.9 per 10,000 women screened (245 interval cancers), and the interval cancer rate for cancers in the 12–24 months following a normal screen was 10.6 per 10,000 women screened (441 interval cancers). These results are consistent with rates from 1999–2007 and are comparable to other screening programmes internationally. At Lead Provider level, BSCM was the only provider to have results significantly different to the total programme result. For less than 12-month interval cancers the BSCM rates were lower for both initial and subsequent screens.
Programme sensitivityFor 2008–2009 a total of 1,757 breast cancers were detected by screening. Programme sensitivity for <12 months interval cancers was 87.8% and sensitivity for 12–24 month interval cancers was 79.9%. Programme sensitivity increased between 2007 and 2008 but levelled off in 2009 due to a drop in sensitivity for initial screens. At provider level, BSCM had higher sensitivity than the national rate for interval cancers less than 12 months for both initial and subsequent screens. BSHC had lower sensitivity for initial screens for 12–24 months interval cancers than the national rate.
Interval Cancers in BreastScreen Aotearoa 2008–2009 ix
ConclusionBSA interval cancer and programme sensitivity results are comparable to other screening programmes internationally. Some differences were seen at Lead Provider level with BSCM having lower interval cancer rates and higher sensitivity than national results for interval cancers less than 12 months.
x Interval Cancers in BreastScreen Aotearoa 2008–2009
1 IntroductionThe goal of population-based breast screening programmes is to reduce mortality from breast cancer. Screening does not prevent the development of cancer, but rather detects the disease at an earlier stage. Early detection can reduce both illness and death from breast cancer. BreastScreen Aotearoa (BSA) started screening eligible New Zealand women aged 50–64 years in December 1998 after two successful pilots. In 2004, the eligible age range was extended to 45–69 years. BSA services are delivered via a network of eight Lead Providers, their sub-contracted providers, and mobile units. Women are invited to attend screening at two-yearly intervals. All mammograms are independently read by two radiologists who each assess whether to routinely re-screen or recall the woman for assessment. Differing assessments are reviewed by a third radiologist. For all of the years covered by this report, most of the screening was done using film mammography. The first BSA Lead Provider began transitioning to digital in 2007 and the programme became fully digital in 2013.
Analysis of interval cancer rates is an important part of monitoring the effectiveness of a breast cancer screening programme alongside regular programme monitoring reports. An interval cancer is a cancer that is diagnosed between a negative (normal) screen and the time the next screen would have occurred. In BSA, this is a cancer diagnosed within two years of a negative screen. Interval cancers can be separated into those that were not visible on the most recent screening mammogram (‘true intervals’) and those that were visible but not identified by the screening process (‘missed cancers’). In keeping with international practice, BSA Lead Providers undertake regular internal audit to categorise interval cancers and improve the quality of radiologists’ performance.
The purpose of this report is to present information on two-year interval breast cancers from the BSA mammographic screening programme and to compare this with published results from other programmes internationally. This report presents analysis of interval cancers occurring in BSA during 2008 and 2009, repeating the approach used in the 1999–2007 interval cancer analysis completed for the NSU by Taylor, Wall and Morrell (2012).
This report presents interval cancer rates and programme sensitivity. Interval cancers have been calculated per 10,000 women screened. Programme sensitivity has been calculated as the proportion of breast cancers diagnosed in screened women that were detected by the BSA programme for a given screening period. Sensitivity is directly related to the number of interval cancers. The lower the number of interval cancers, the higher the sensitivity of the programme.
Interval cancers were analysed according to whether they occurred after an initial screen or a subsequent screen, by age, ethnicity, year of screen, and whether they occurred within 12 months or 12–24 months of a normal screen. This last distinction is important because interval cancers diagnosed within 12 months following are normal screen are more likely to be cancers missed in the screening process, while those diagnosed between 12 and 24 months are more likely to be ‘true’ interval cancers.
Interval Cancers in BreastScreen Aotearoa 2008–2009 1
2 Interval Cancers in BreastScreen Aotearoa 2008–2009
2 Methods2.1 Screening cohortThis analysis is based on women that underwent screening between 1 January 2008 and 31 December 2009. Data on women screened during the period was extracted from the BSA reporting system by the National Screening Unit (NSU).
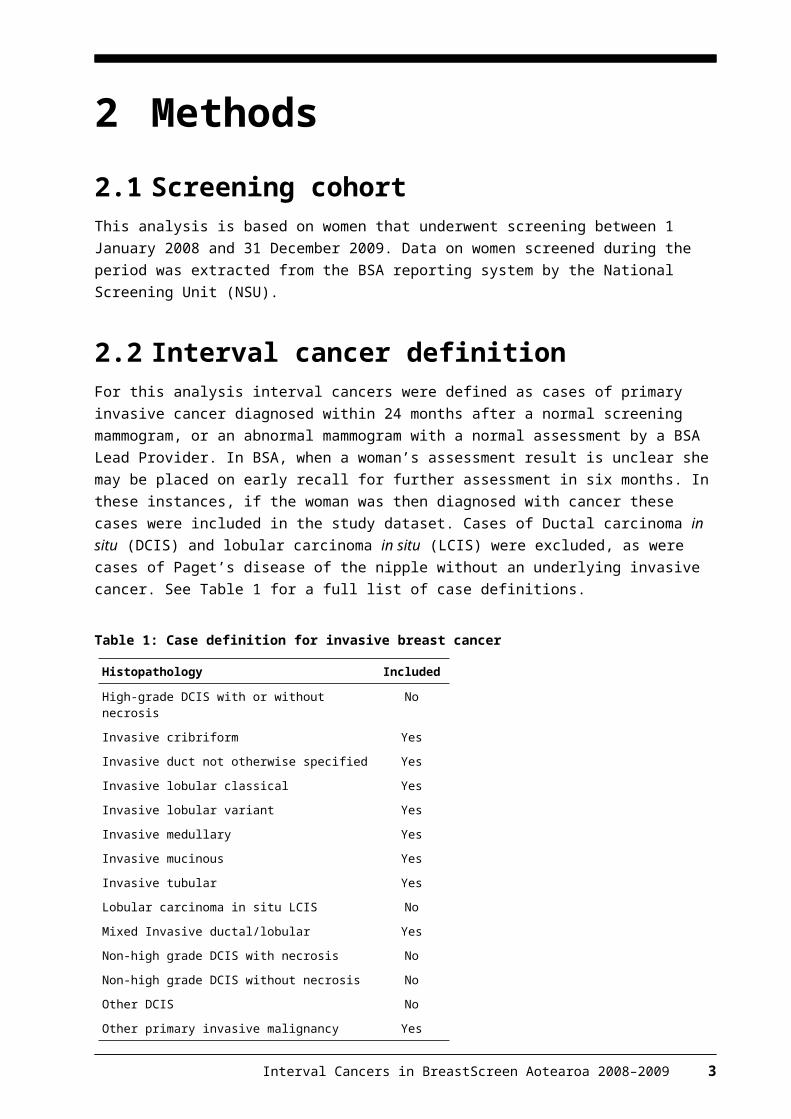
2.2 Interval cancer definitionFor this analysis interval cancers were defined as cases of primary invasive cancer diagnosed within 24 months after a normal screening mammogram, or an abnormal mammogram with a normal assessment by a BSA Lead Provider. In BSA, when a woman’s assessment result is unclear she may be placed on early recall for further assessment in six months. In these instances, if the woman was then diagnosed with cancer these cases were included in the study dataset. Cases of Ductal carcinoma in situ (DCIS) and lobular carcinoma in situ (LCIS) were excluded, as were cases of Paget’s disease of the nipple without an underlying invasive cancer. See Table 1 for a full list of case definitions.
Table 1: Case definition for invasive breast cancer
Histopathology Included
High-grade DCIS with or without necrosis No
Invasive cribriform Yes
Invasive duct not otherwise specified Yes
Invasive lobular classical Yes
Invasive lobular variant Yes
Invasive medullary Yes
Invasive mucinous Yes
Invasive tubular Yes
Lobular carcinoma in situ LCIS No
Mixed Invasive ductal/lobular Yes
Non-high grade DCIS with necrosis No
Non-high grade DCIS without necrosis No
Other DCIS No
Other primary invasive malignancy Yes
Interval Cancers in BreastScreen Aotearoa 2008–2009 3
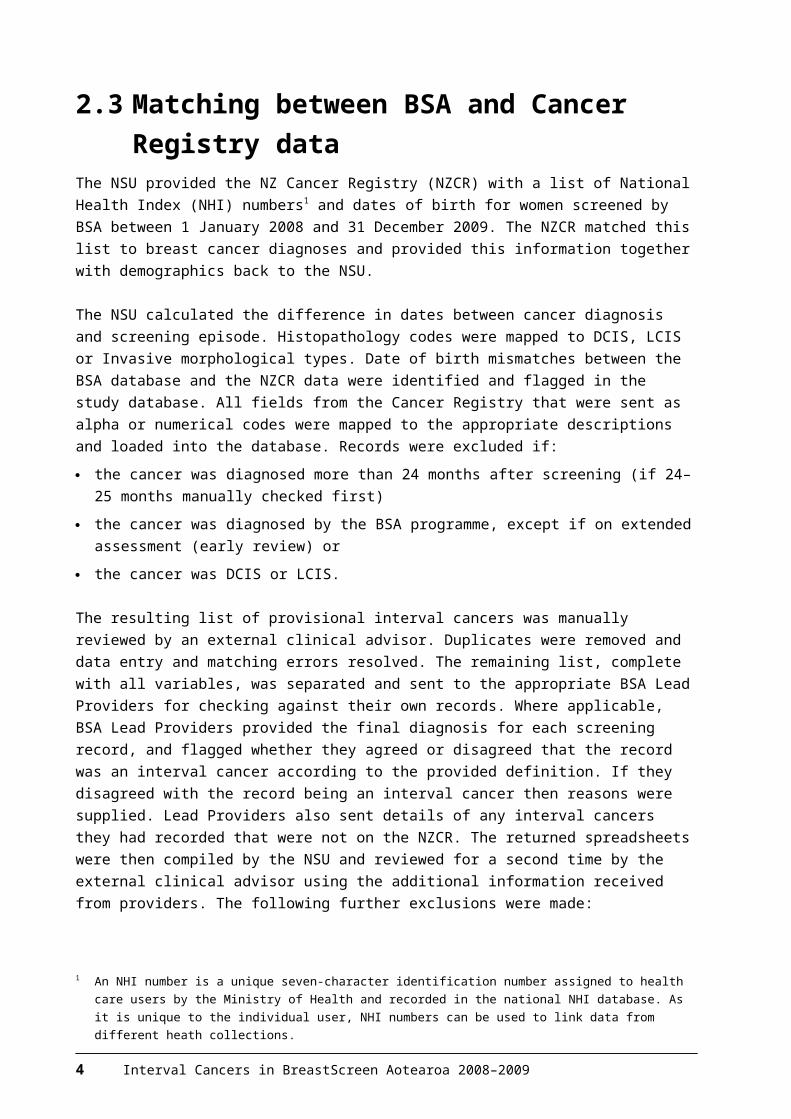
2.3 Matching between BSA and Cancer Registry data
The NSU provided the NZ Cancer Registry (NZCR) with a list of National Health Index (NHI) numbers1 and dates of birth for women screened by BSA between 1 January 2008 and 31 December 2009. The NZCR matched this list to breast cancer diagnoses and provided this information together with demographics back to the NSU.
The NSU calculated the difference in dates between cancer diagnosis and screening episode. Histopathology codes were mapped to DCIS, LCIS or Invasive morphological types. Date of birth mismatches between the BSA database and the NZCR data were identified and flagged in the study database. All fields from the Cancer Registry that were sent as alpha or numerical codes were mapped to the appropriate descriptions and loaded into the database. Records were excluded if: the cancer was diagnosed more than 24 months after screening (if 24–25
months manually checked first) the cancer was diagnosed by the BSA programme, except if on extended
assessment (early review) or the cancer was DCIS or LCIS.
The resulting list of provisional interval cancers was manually reviewed by an external clinical advisor. Duplicates were removed and data entry and matching errors resolved. The remaining list, complete with all variables, was separated and sent to the appropriate BSA Lead Providers for checking against their own records. Where applicable, BSA Lead Providers provided the final diagnosis for each screening record, and flagged whether they agreed or disagreed that the record was an interval cancer according to the provided definition. If they disagreed with the record being an interval cancer then reasons were supplied. Lead Providers also sent details of any interval cancers they had recorded that were not on the NZCR. The returned spreadsheets were then compiled by the NSU and reviewed for a second time by the external clinical advisor using the additional information received from providers. The following further exclusions were made: cancers diagnosed outside the programme after being correctly recalled for
assessment by BSA local recurrence or regional or systemic metastases from a previously treated
cancer symptomatic patient, given symptom letter by BSA contralateral diagnosis after BSA diagnosis no or unknown histology cancer diagnosed > 24 months after screening episode incorrect NHI subsequent metastatic disease after previous interval recalled by BSA and was still in BSA assessment
1 An NHI number is a unique seven-character identification number assigned to health care users by the Ministry of Health and recorded in the national NHI database. As it is unique to the individual user, NHI numbers can be used to link data from different heath collections.
4 Interval Cancers in BreastScreen Aotearoa 2008–2009
had been recalled and diagnosed by BSA.
Because of inconsistent reporting and ascertainment of symptoms, the presence or absence of symptoms was not used as a criterion to determine whether a cancer diagnosed either within or outside the BSA programme was an interval cancer.
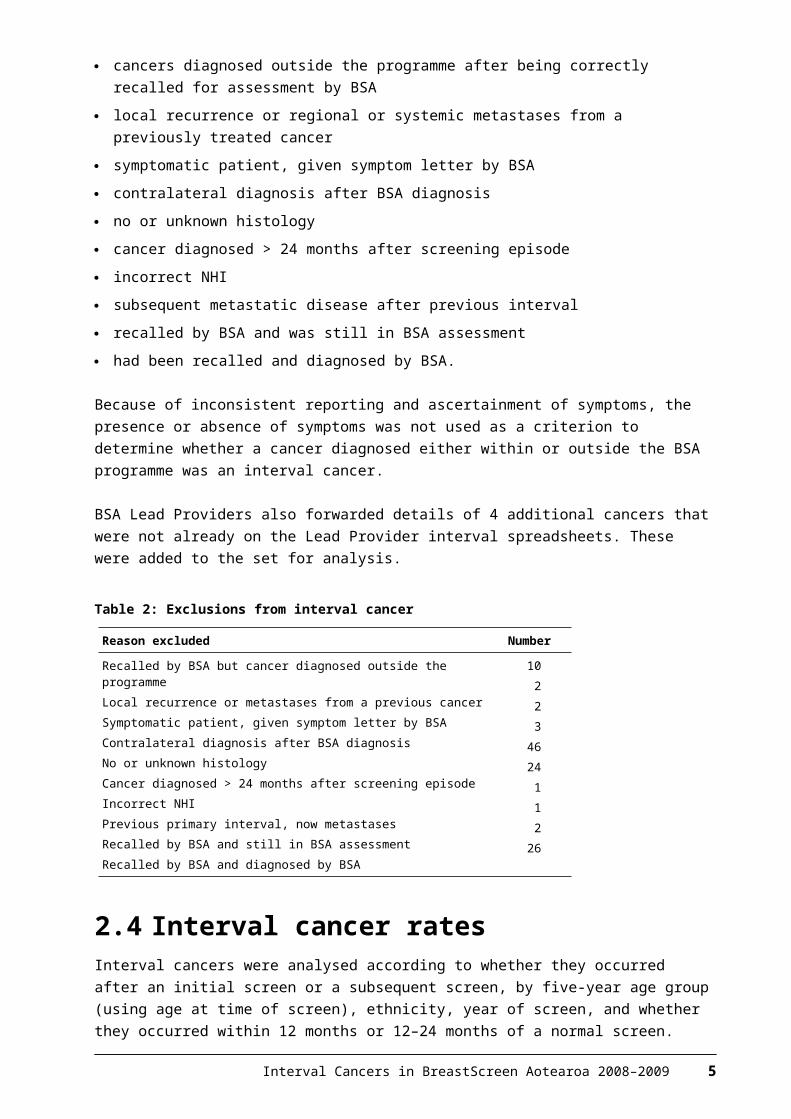
BSA Lead Providers also forwarded details of 4 additional cancers that were not already on the Lead Provider interval spreadsheets. These were added to the set for analysis.
Table 2: Exclusions from interval cancer
Reason excluded Number
Recalled by BSA but cancer diagnosed outside the programmeLocal recurrence or metastases from a previous cancerSymptomatic patient, given symptom letter by BSAContralateral diagnosis after BSA diagnosisNo or unknown histologyCancer diagnosed > 24 months after screening episodeIncorrect NHIPrevious primary interval, now metastasesRecalled by BSA and still in BSA assessmentRecalled by BSA and diagnosed by BSA
10223
4624
112
26
2.4 Interval cancer ratesInterval cancers were analysed according to whether they occurred after an initial screen or a subsequent screen, by five-year age group (using age at time of screen), ethnicity, year of screen, and whether they occurred within 12 months or 12–24 months of a normal screen. Consistent with the previous report for 1999–2007, the denominator used for rate calculations was the number of screens minus the number of cancers detected through screening in a given screening year, age group, ethnicity group or by a Lead Provider. This means that the counts of women screened given in the tables actually show the number of women that had a normal screen. For comparisons by age group and ethnicity, interval cancer rates have been aggregated for 2008–2009 due to low numbers.
2.5 Programme sensitivityProgramme sensitivity is defined as the proportion of cancers detected by the screening programme. It was calculated by dividing the number of screen detected cancers by the total number of cancers diagnosed in screened women (screen detected and interval cancers). Sensitivity was calculated for the total BSA programme, by five-year age group, ethnicity and BSA Lead Provider. Time trends have been included for initial, subsequent and total screens at programme level, and for total screens at Lead Provider level (due to low numbers).
2.6 Confidence interval calculationsInterval cancer rates and programme sensitivity percentages presented in this report are accompanied by 95% confidence intervals (CIs). These were calculated
Interval Cancers in BreastScreen Aotearoa 2008–2009 5
using Wilson’s method for a binomial distribution formula. The 95% CI indicates that there is a 5% chance that the ‘true’ value lies outside the range of values contained by the CI. Therefore, the wider the CI, the less precise the estimate is to the true result. CIs can indicate whether there is a statistically significant difference in reported rates across groups. Where CIs do not overlap this means that it is unlikely that the difference occurred by chance.
6 Interval Cancers in BreastScreen Aotearoa 2008–2009
3 Results3.1 Programme interval cancersFor 2008–2009, 245 interval cancers occurred in the first 12 months following a normal screen giving an interval cancer rate of 5.9 per 10,000 women screened (see Table 3). There were 441 interval cancers in the 12–24 months following a normal screen giving an interval cancer rate of 10.6 per 10,000 women screened (see Table 4). The total number of interval cancers detected for the 2008–2009 screening period was 686. Both the first year and second year interval cancer rates were below the targets set out in the BSA National Policy and Quality Standards (first year target ≤ 7.1 per 10,000 and second year target ≤ 15 per 10,000).
There was no consistent trend in interval cancers by age for 2008–2009 aggregated data (see Figure 1). Interval cancers occurring in the first 12 months after a normal screen decreased with increasing age from 8.6 per 10,000 screens for women 45–49 years to 3.9 per 10,000 screens for women 55–59 years, before increasing again for women 60–64 years (5.0 per 10,000) and again for women 65 years and over (5.4 per 10,000). Interval cancer rates by age for 12–24 months following a normal screen followed the same pattern, with the highest rate for women 45–49 years (11.7 per 10,000) decreasing to 8.9 per 10,000 for women 55–59 years, and then increasing for the older two age groups.
Figure 2 shows the trend in interval cancer rates over time, combining data for 2008–2009 with previously reported data for the 1999–2007. Interval cancer rates for the first 12 months following a normal screen decreased from 6.5 per 10,000 for 2007 to 5.4 per 10,000 for the 2009 year as a result of a decrease in interval cancers from subsequent screens. For 12–24 months interval cancers the results for 2008–2009 continue the overall downward trend since 1999, but 2009 showed a slight increase in interval cancer rates for subsequent screens. Total interval cancers (0–24 months) for 2008–2009 were consistent with the previous trend which saw rates plateau at around 19 per 10,000 screens. The total interval cancer rate for 2009 was 18 per 10,000 screens.
3.2 Programme sensitivityFor 2008–2009 a total of 1,757 breast cancers were detected by screening. Programme sensitivity for <12 months interval cancers was 87.8% (see Table 5) and sensitivity for 12–24 month interval cancers was 79.9% (see Table 6). In general, programme sensitivity increased with age for <12 month, 12–24 month and total 0–24 months interval cancers (although increases were less marked between older age groups) (see Figure 3). Programme sensitivity increased between 2007 and 2008 but levelled off in 2009 due to a drop in sensitivity for initial screens (see Figure 4).
Interval Cancers in BreastScreen Aotearoa 2008–2009 7
3.3 BSA Lead Provider resultsFor <12-month interval cancers, BSCM was the only BSA Lead Provider with an interval cancer rate that was significantly different from the total BSA programme result. BSCM rates for each of initial, subsequent and total screens were lower than the respective national rates. For 12–24 month interval cancers the BSWN rate for subsequent screens is higher but with slightly overlapping CIs. For 0–24-month interval cancers the BSCM rate was lower but, once again, with a small overlap in CIs (see Figure 5).
For programme sensitivity, BSCM had a higher sensitivity than the total BSA result for <12-month interval cancers, and also for 0–24-month interval cancers. For 12–24 and 0–24 months BSHC had a lower sensitivity for initial screens than the national result (see Figure 6).
Comparison of trends for total interval cancer rates by provider by year show that BSCC and BSCM had consistently decreasing rates over the most recent 3–4 years. BSWN and BSSL rates were relatively consistently, while trends for other providers were unclear (see Figure 7). Figure 8 compares time trends for programme sensitivity by provider. Results for most providers have fluctuated over time above and below 70%.
See Tables 13 to 16 in the appendix for more detail on individual BSA Lead Provider results for 2008–2009.
3.4 Trends by ethnicityData by ethnicity was only available for 2008–2009. As Figures 9 and 10 show, while some variance is evident in results by ethnicity, the very small numbers involved for some groups (particularly Pacific) means there is a large amount of uncertainty, leading to overlapping CIs. However, interval cancer rates appear to be lower for Pacific women for 12–24-month interval cancers for subsequent and total screens. These lower interval cancer rates correspond with higher sensitivity for 12–24-month interval cancers than the overall national result. Sensitivity also appears higher for Māori women compared to national when looking at total screens.
8 Interval Cancers in BreastScreen Aotearoa 2008–2009
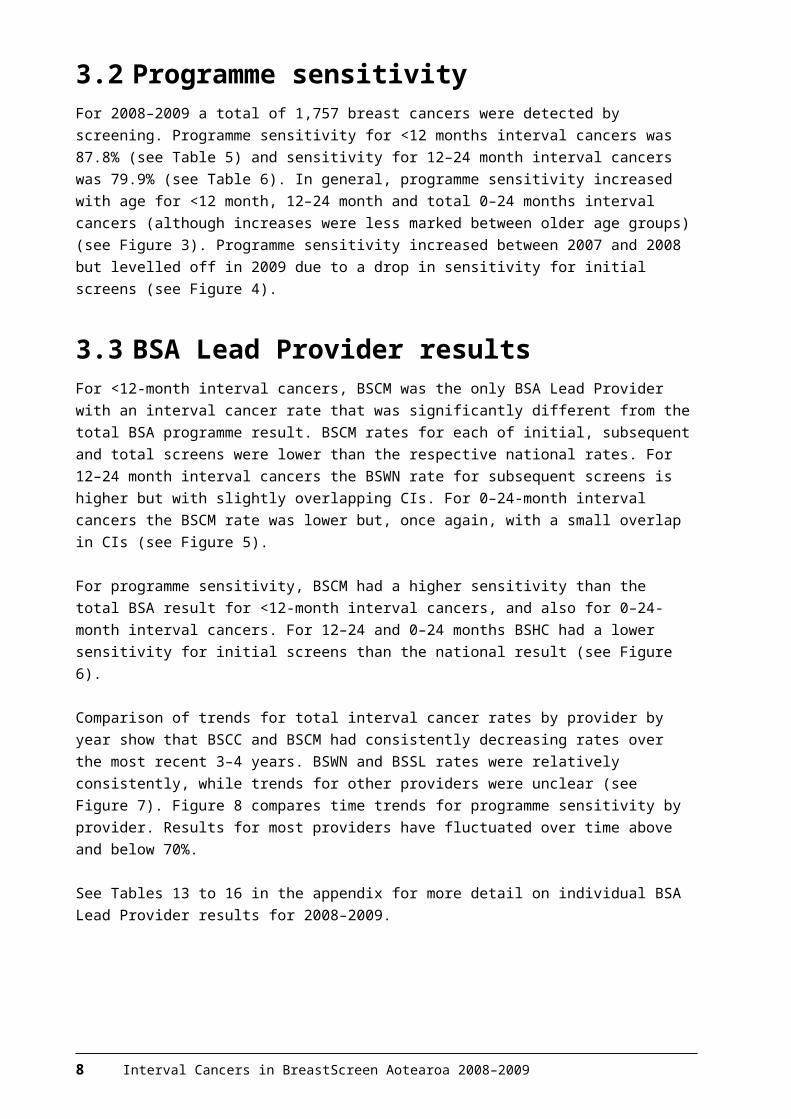
Table 3: First-year (<12 months) interval breast cancers after an initial or subsequent screen by age group and screening year, BSA programme, 2008–2009
Table 4: Second-year (12 to <24 months) interval breast cancers after an initial or subsequent screen by age group and screening year, BSA programme, 2008–2009
Interval Cancers in BreastScreen Aotearoa 2008–2009 9
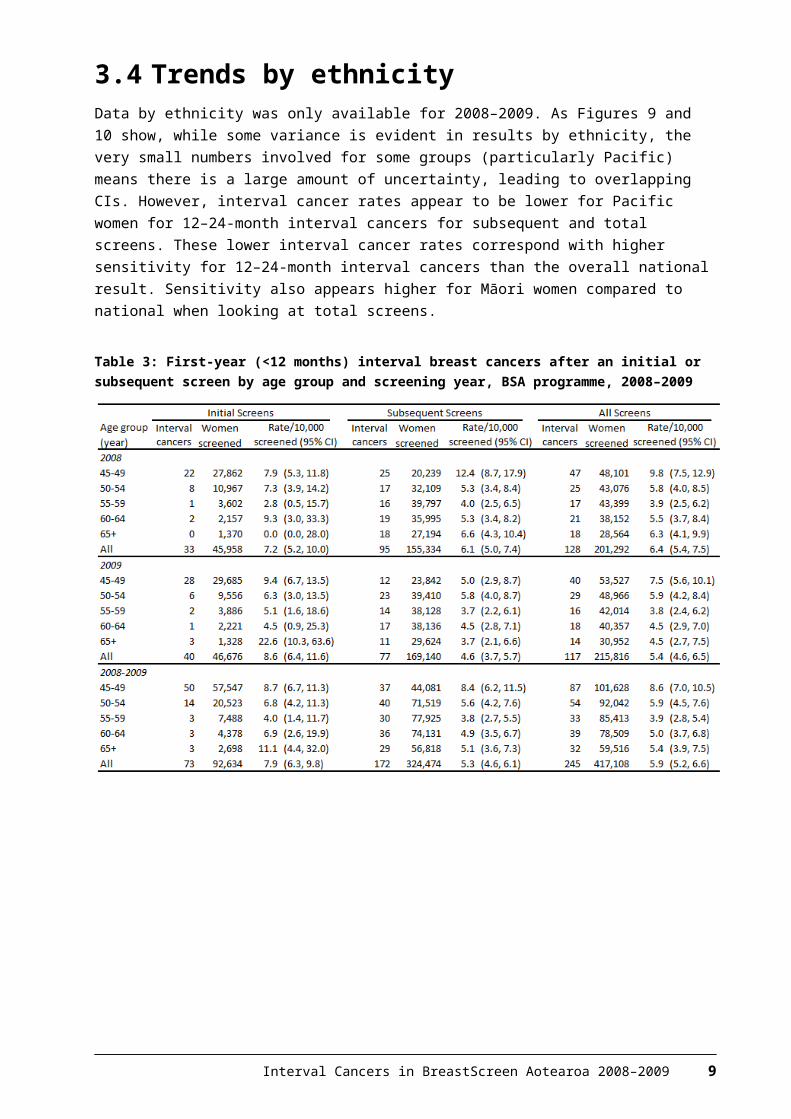
Figure 1: Interval cancers by five-year age group 45–69 years, initial and subsequent screens, 2008–2009 aggregated, with 95% confidence intervals
10 Interval Cancers in BreastScreen Aotearoa 2008–2009
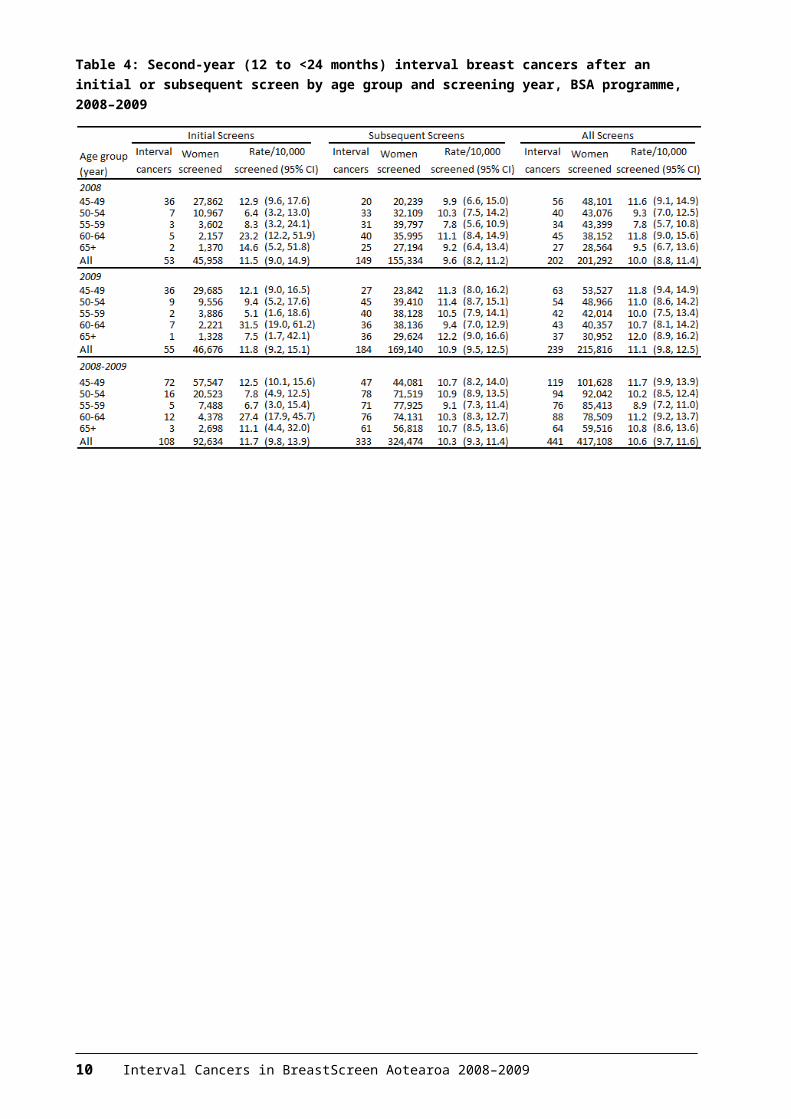
Figure 2: Interval cancers occurring in first year (<12 months) and second year (12–24 months) following initial or subsequent screens occurring in 1999–2009, women aged 45–69 years, with 95% confidence intervals
Interval Cancers in BreastScreen Aotearoa 2008–2009 11
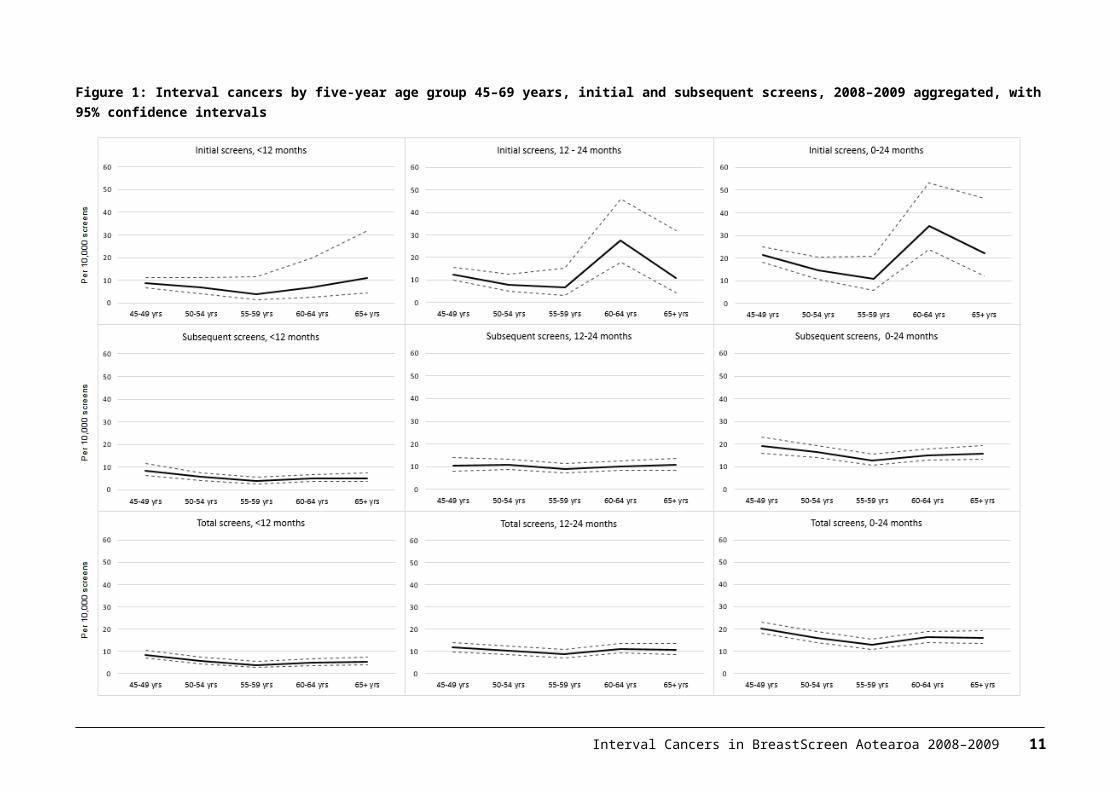
Table 5: First-year (<12 months) programme sensitivity (%) after an initial or subsequent screen by age group and screening year, 2008–2009
Table 6: Second-year (12 to <24 months) programme sensitivity (%) after an initial or subsequent screen by age group and screening year, 2008–2009
12 Interval Cancers in BreastScreen Aotearoa 2008–2009
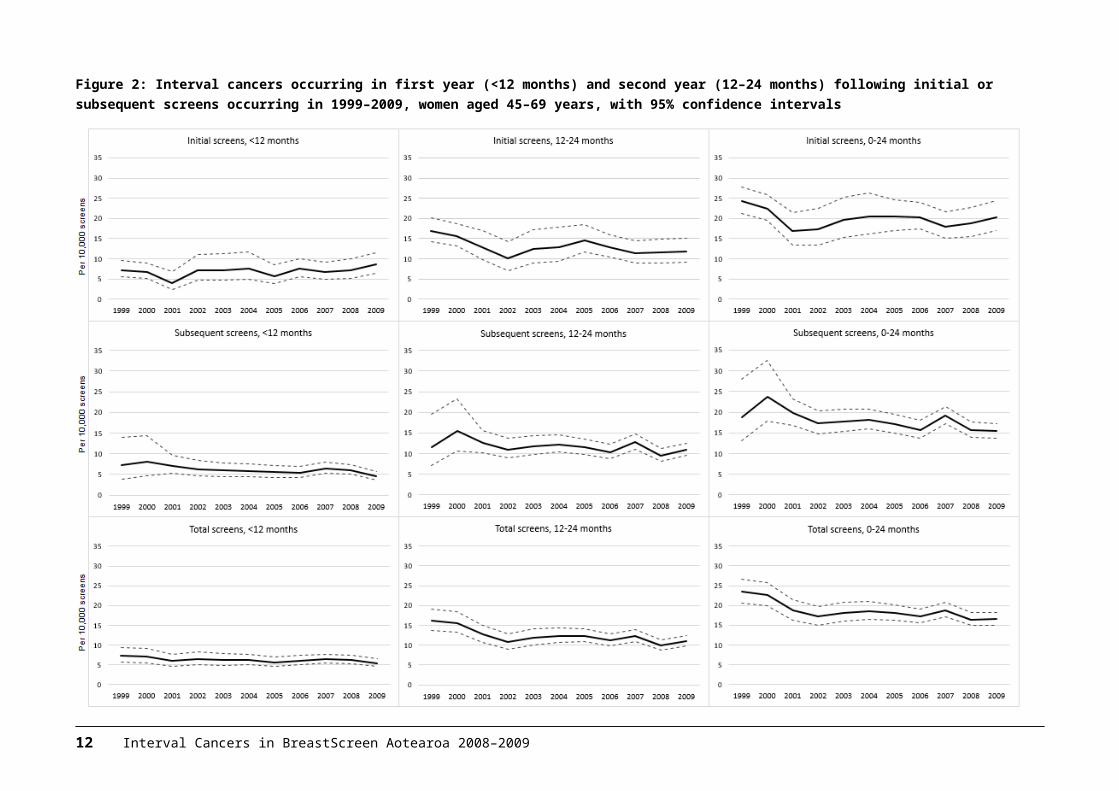
Figure 3: Programme sensitivity by age 45–69 years, by interval cancers in first and second year following initial or subsequent screen, with 95% confidence intervals, 2008–2009
Interval Cancers in BreastScreen Aotearoa 2008–2009 13
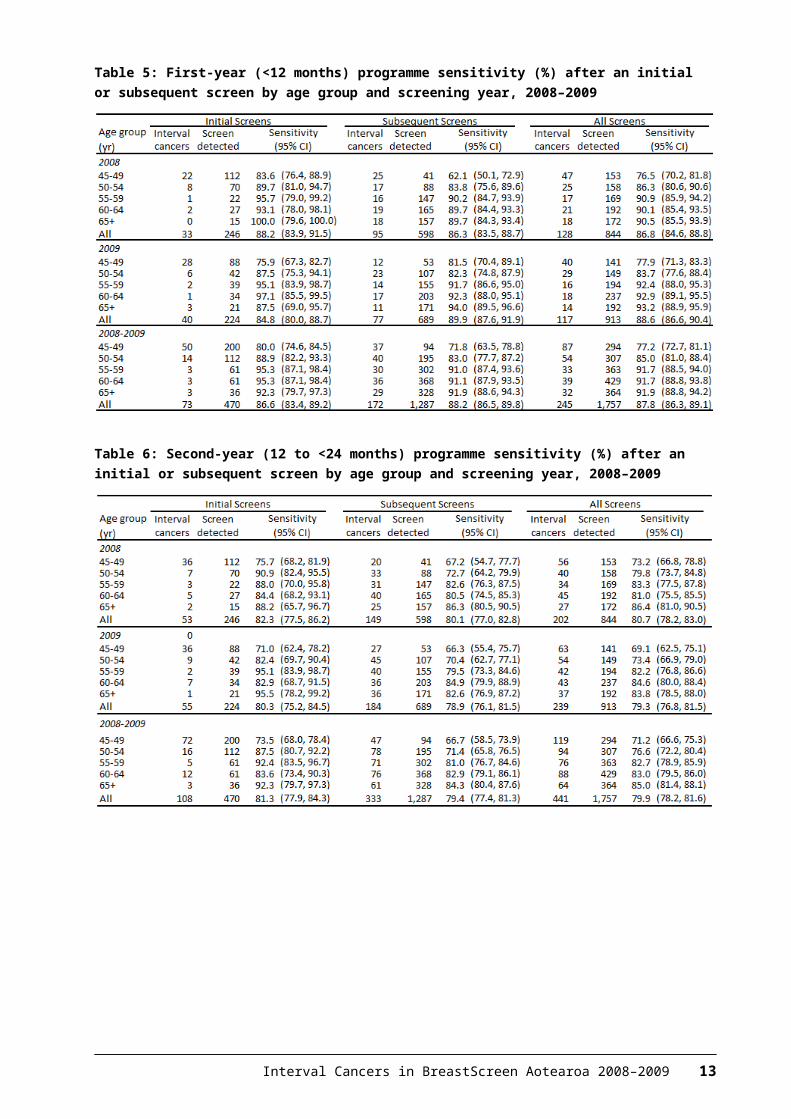
Figure 4: Programme sensitivity (%) by first and subsequent screens in relation to interval cancers in the first year (<12 months) and second year (12–24 months) following screens occurring in 1999–2009, with 95% confidence intervals
14 Interval Cancers in BreastScreen Aotearoa 2008–2009
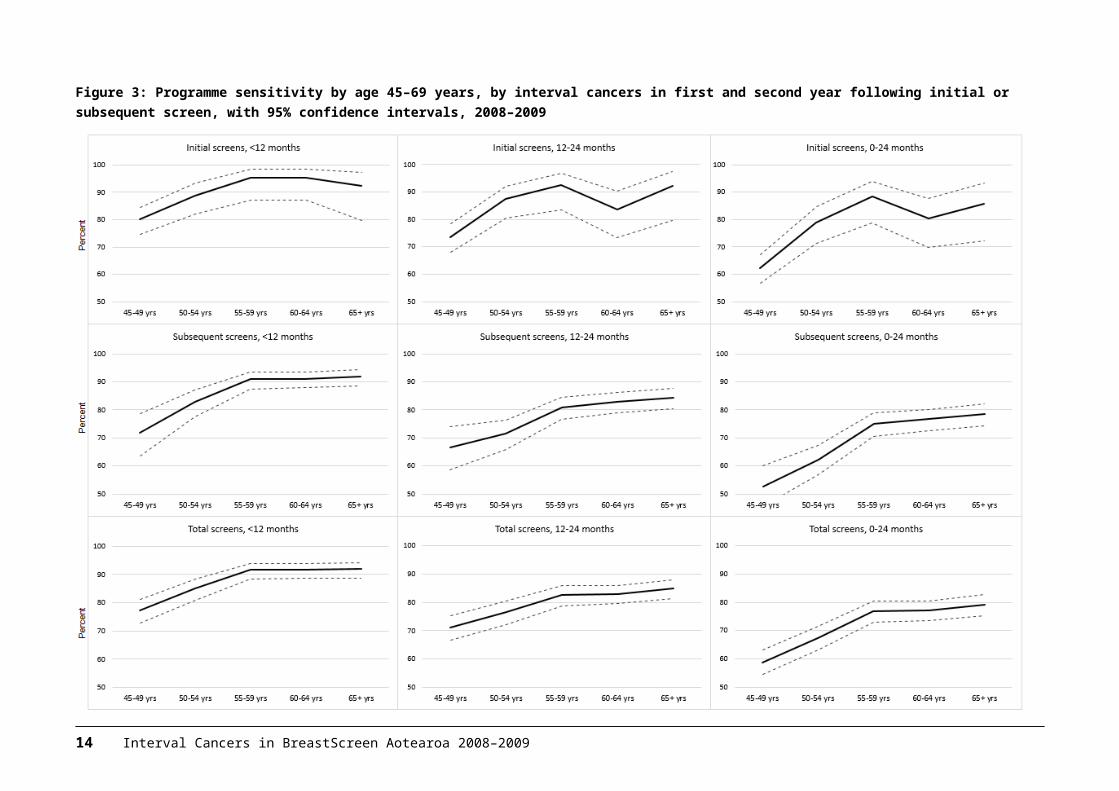
Figure 5: Interval cancer rates by BSA Lead Provider, by first- and second-year interval cancers and by initial and subsequent screens, with 95% confidence intervals, 2008–2009
Interval Cancers in BreastScreen Aotearoa 2008–2009 15
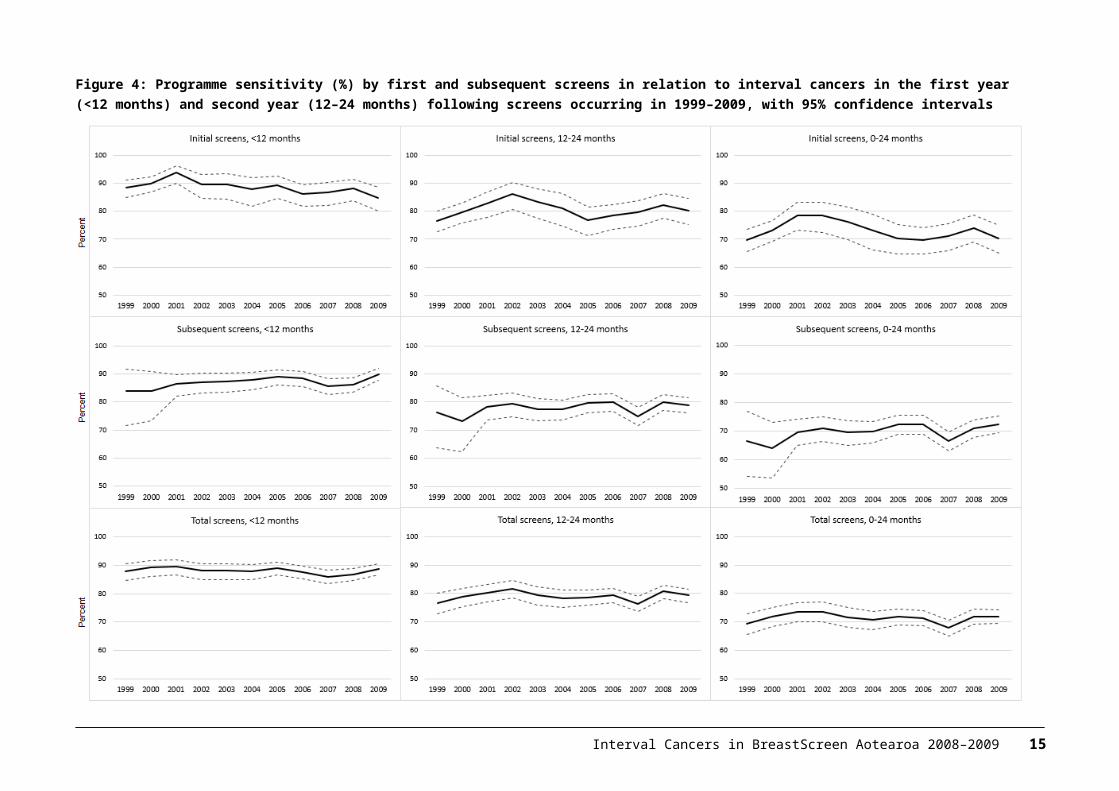
Figure 6: Programme sensitivity by BSA Lead Provider, by first- and second-year interval cancers and by initial and subsequent screens, with 95% confidence intervals, 2008–2009
16 Interval Cancers in BreastScreen Aotearoa 2008–2009
Table 7: First-year (<12 months) interval breast cancers after an initial or subsequent screen by ethnicity and screening year, 2008–2009
Table 8: Second-year (12–24 months) interval breast cancers after an initial or subsequent screen by ethnicity and screening year, 2008–2009
Interval Cancers in BreastScreen Aotearoa 2008–2009 17
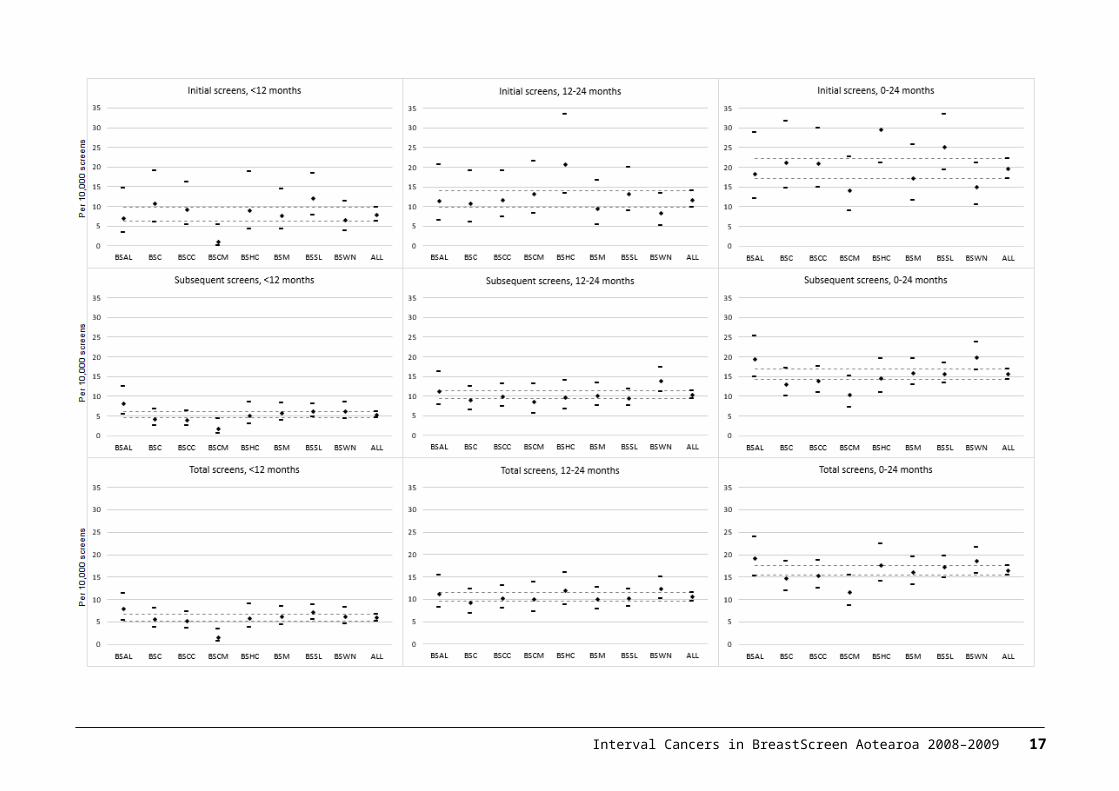
Table 9: First-year (<12 months) programme sensitivity (%) after an initial or subsequent screen by ethnicity and screening year, 2008–2009
Table 10: Second-year (12–24 months) programme sensitivity (%) after an initial or subsequent screen by ethnicity and screening year, 2008–2009
18 Interval Cancers in BreastScreen Aotearoa 2008–2009
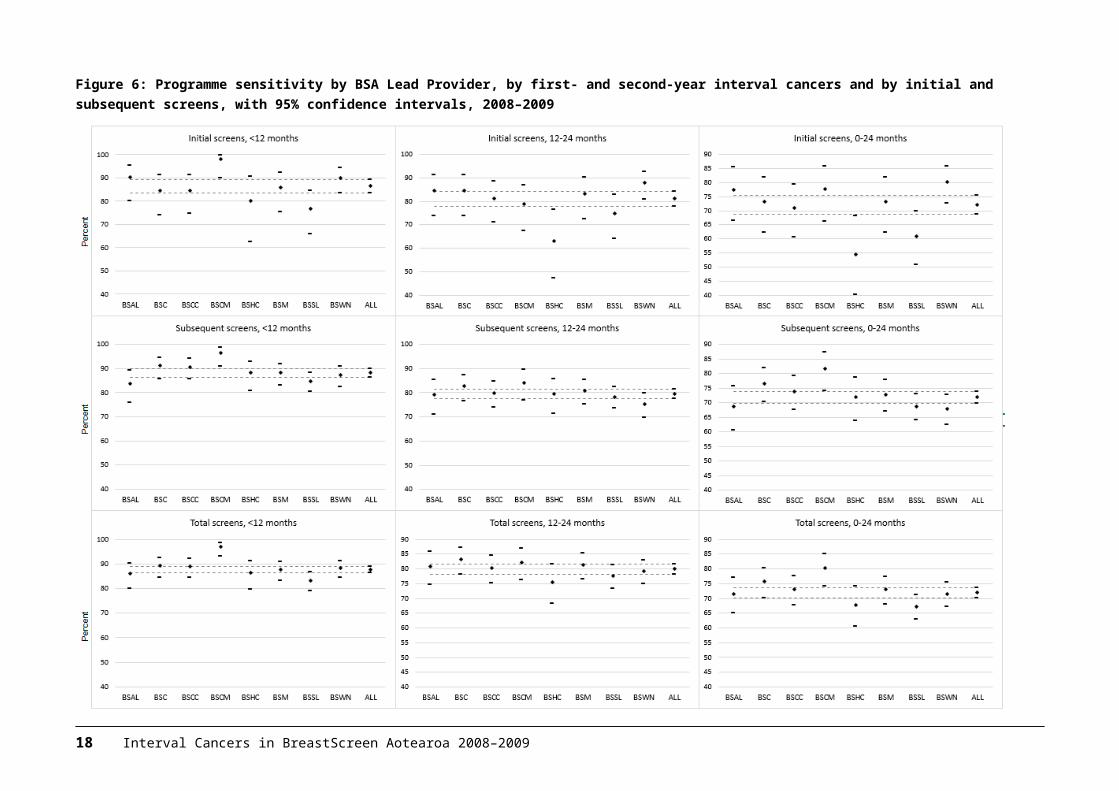
Figure 7: Trends in interval cancer rates by BSA Lead Provider, 1999–2009, with 95% confidence intervals
Interval Cancers in BreastScreen Aotearoa 2008–2009 19
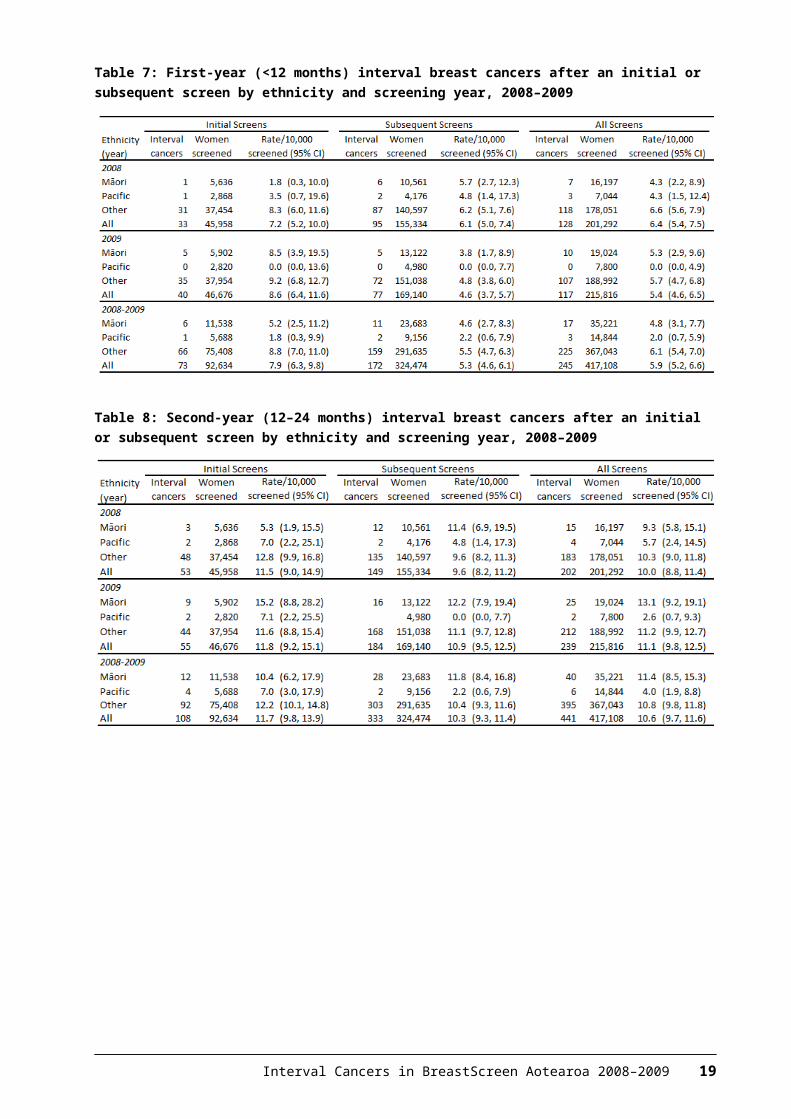
Figure 8: Trends in programme sensitivity by BSA Lead Provider, 1999–2009, with 95% confidence intervals
20 Interval Cancers in BreastScreen Aotearoa 2008–2009
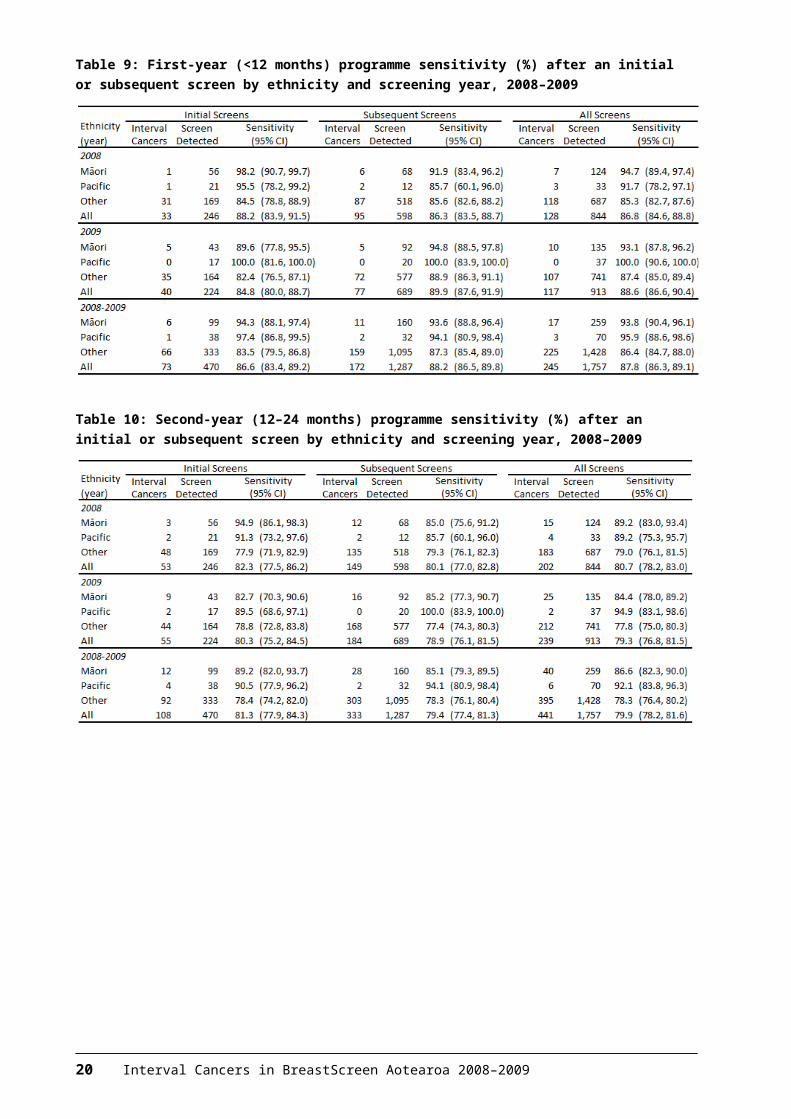
Figure 9: Interval cancer rates by ethnicity, by first- and second-year interval cancers and by initial and subsequent screens, with 95% confidence intervals, 2008–2009
Interval Cancers in BreastScreen Aotearoa 2008–2009 21
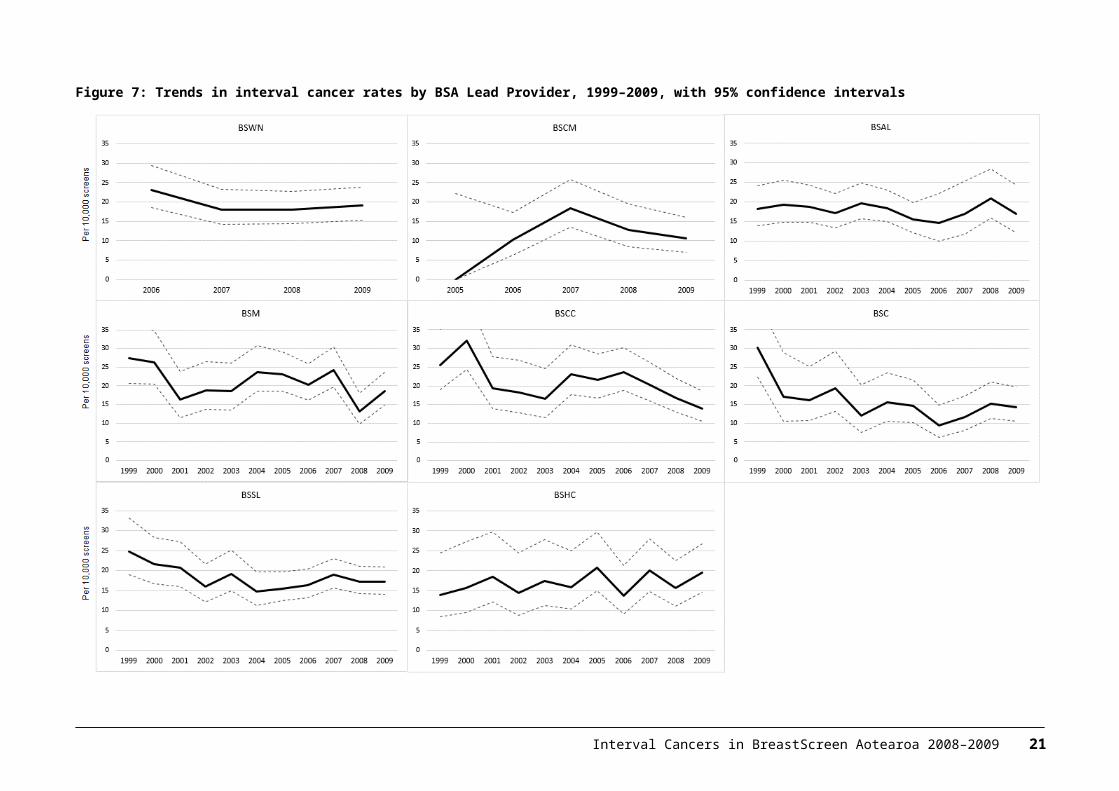
Figure 10: Programme sensitivity by ethnicity, by first- and second-year interval cancers and by initial and subsequent screens, with 95% confidence intervals, 2008–2009
22 Interval Cancers in BreastScreen Aotearoa 2008–2009
4 International comparisons
Tables 11 and 12 show a comparison of BSA interval cancer rates and programme sensitivity against recently published results for BreastScreen Australia (Australian Institute of Health and Welfare 2014) and interval cancer rates from the UK (Offman & Duffy 2012). Results have also been calculated for women 50–69 years for BSA to match the starting age of other programmes.
BSA interval cancer rates are not significantly different from comparable programmes. While noting the overlap in confidence intervals, there appears to be a bigger difference in interval cancer rates for initial versus subsequent screens in BSA for interval cancers less than 12 months when compared with Australia. However this difference reduces when BSA rates are calculated for women 50–69 years.
Results for programme sensitivity are not significantly different to BreastScreen Australia. No new published results for programme sensitivity for other countries were available at the time of writing this report. As for interval cancer rates, BSA sensitivity results improve when calculated for women 50–69 years.
Table 11: BSA 2008–09 interval cancer rates compared with the Australian and UK national screening programmes
Interval Cancers in BreastScreen Aotearoa 2008–2009 23
Table 12: BSA 2008–09 programme sensitivity compared with the Australian national screening programme
24 Interval Cancers in BreastScreen Aotearoa 2008–2009
ReferencesAustralian Institute of Health and Welfare. 2014. BreastScreen Australia monitoring report2011–2012. Cancer Series no.86. Cat. No. CAN83. Canberra: Australian Institute of Health and Welfare.
Offman J, Duffy SW. 2012. National Collation of Breast Interval Cancer Data: screening years 1 April 2003–31 March 2005. NHS Cancer Screening Programmes: Sheffield UK.
Taylor R, Wall M, Morrell S. 2012. Interval Cancers in BreastScreen Aotearoa, 1999–2007. University of New South Wales, Australia.
Interval Cancers in BreastScreen Aotearoa 2008–2009 25
AppendixTable 13: First-year (<12 months) interval breast cancers after an initial or subsequent screen by age group and BSA Lead Provider, 2008–2009
26 Interval Cancers in BreastScreen Aotearoa 2008–2009
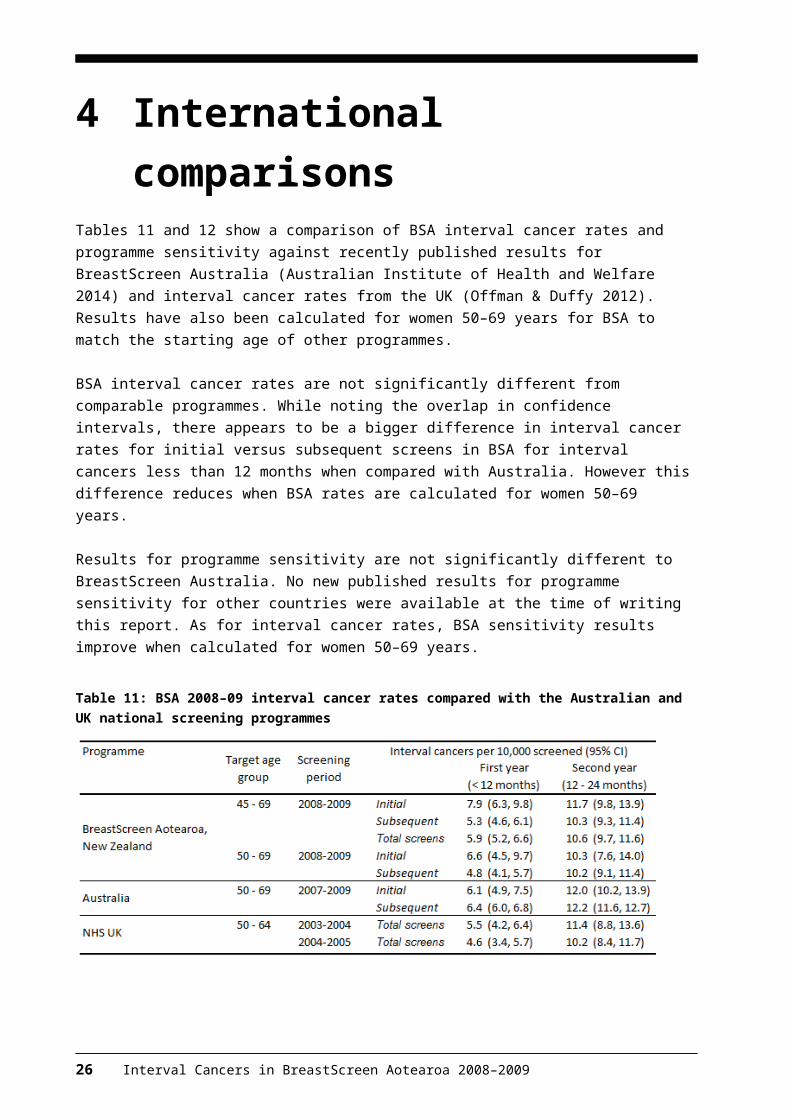
Table 14: Second-year (12–24 months) interval breast cancers after an initial or subsequent screen by age group and BSA Lead Provider, 2008–2009
Interval Cancers in BreastScreen Aotearoa 2008–2009 27
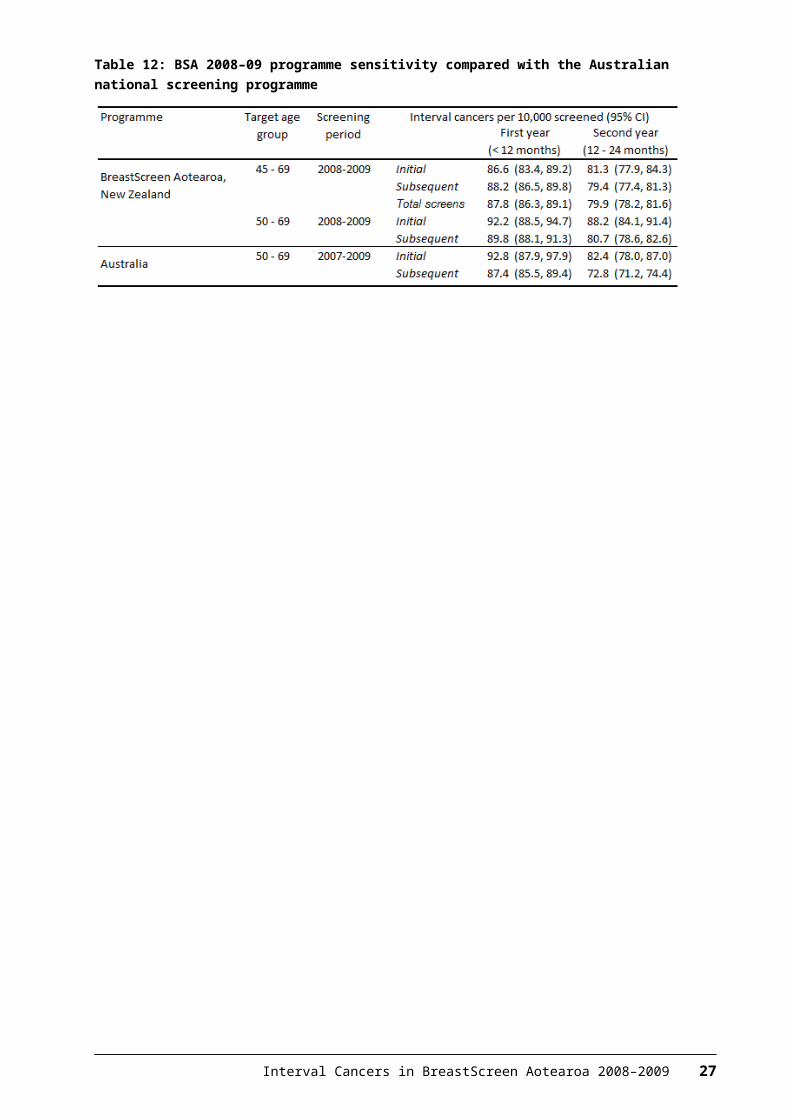
Table 15: First-year (<12 months) programme sensitivity (%) after an initial or subsequent screen by age group and BSA Lead Provider, 2008–2009
* The BSHC values for the 55–59 and 60–64 year age groups were the same and are correctly shown.
28 Interval Cancers in BreastScreen Aotearoa 2008–2009
Table 16: Second-year (12 to <24 months) programme sensitivity (%) after an initial or subsequent screen by age group and BSA Lead Provider, 2008–2009
Interval Cancers in BreastScreen Aotearoa 2008–2009 29