interval ‘meter’ data in miso market settlements presented to: 2005 aeic load research annual...
TRANSCRIPT

Interval ‘Meter’ Data in MISO Market
Settlements Presented to: 2005 AEIC Load Research
Annual Meeting
By: Michael J. Amiss
Sr. Market Settlements Analyst
Interval ‘Meter’ Data in MISO
Market Settlements• Midwest ISO
• MISO Competitive Energy Markets
• ‘Meter’ Data
• Market Settlement Activities

Acronyms Ahead!
• AO – Asset Owner• API – Application Programmatic Interface• BA – Balancing Authority• BPM – Business Practices Manual• CA – Control Area• CPNode – Commercial Pricing Node• DA – Day-Ahead• DART – Day-Ahead Real-Time• DRR – Demand Response Resource• EMT – Energy Market Tariff• EPNode – Elemental Pricing Node• FTR – Financial Transmission Right• GFA – Grandfather Agreement• ICCP – Inter Control Center Protocol• IMM – Independent Market Monitor• ISO – Independent System Operator• JOU – Jointly Owned Unit
• LDC- Local Distribution Company• LMP – Locational Marginal Price• LSA – Local Security Administrator• MCC – Marginal Congestion Component• MDMA – Meter Data Management Agent• MEC – Marginal Energy Component• MLC – Marginal Loss Component• MMI – Midwest Market Initiative• MP – Market Participant• NAI – Net Actual Interchange• NSI – Net Scheduled Interchange• PSS – Physical Scheduling System• RT – Real-Time• RTO – Regional Transmission Organization• SAS(70) – Statement on Auditing Standards #70• SCED – Security Constrained Economic Dispatch• SE – State Estimator• TO – Transmission Owner• UFE – Unaccounted for Energy (residual load)• XML – Extensible Markup Language

ISO/RTO Map

The Midwest ISO is an independent, non-profit entity that monitors the transmission grid of high voltage electricity across much of the Midwest.
Who We Are
Operational Since December 15, 2001
23 Transmission Owners
36 Control Areas
119,000 MW of peak load
131,000 MW generating capacity
97,000 miles of transmission lines
947,000 square miles
15.1 million customers
1,504 generating units in the reliability footprint
Carmel and St. Paul Control Centers

Control Areas within the MISO Reliability Monitoring Area
Alliant Energy – East MidAmerican Energy Company
Alliant Energy – West Michigan Electric Coordinated System
Ameren Transmission Madison Gas and Electric Company
Aquila Networks – Missouri Public Service Manitoba Hydro, Transmission Services
Aquila Networks – West Plains Kansas Minnesota Power, Inc.
Central Illinois Light Co Muscatine Power and Water
Cinergy Corporation Northern Indiana Public Service Company
Columbia Water & Light Nebraska Public Power District
City Water Light & Power Northern States Power Company
Duke Energy – Vermillion Omaha Public Power District
Dairyland Power Cooperative Otter Tail Power Company
First Energy Corp Southern Indiana Gas & Electric Co
Great River Energy Southern Illinois Power Cooperative
Hoosier Energy Southern Minnesota Municipal Power Agency
Illinois Power Co Upper Peninsula Power Co
Indianapolis Power & Light Western Area Power Administration UGPR
Lincoln Electric System Wisconsin Energy Corporation
LG&E Energy Transmission Services Wisconsin Public Service Corporation
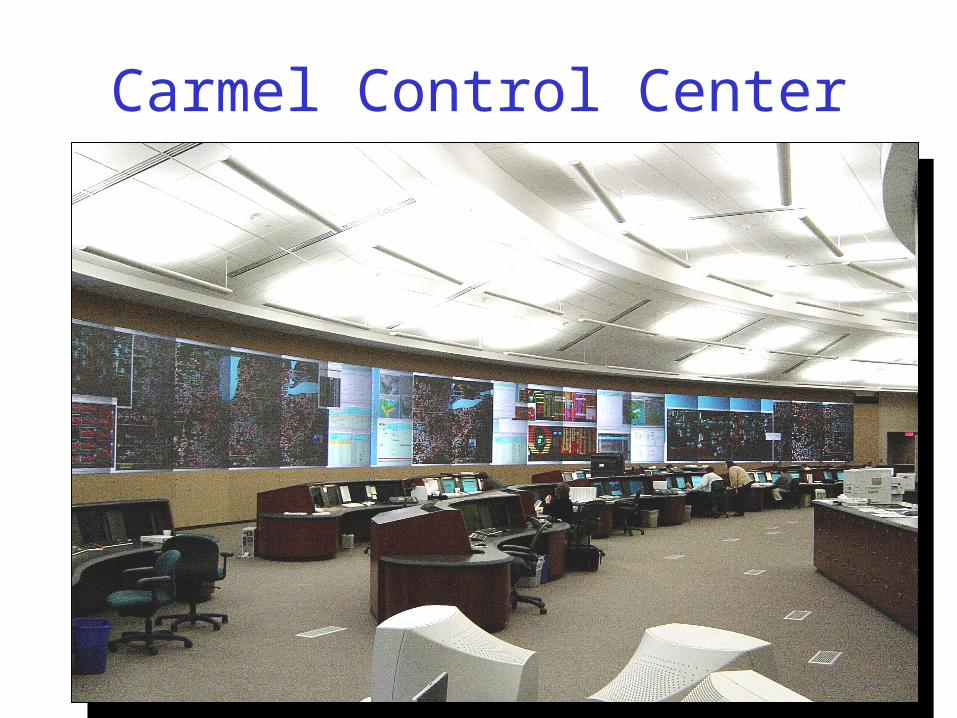
Carmel Control Center
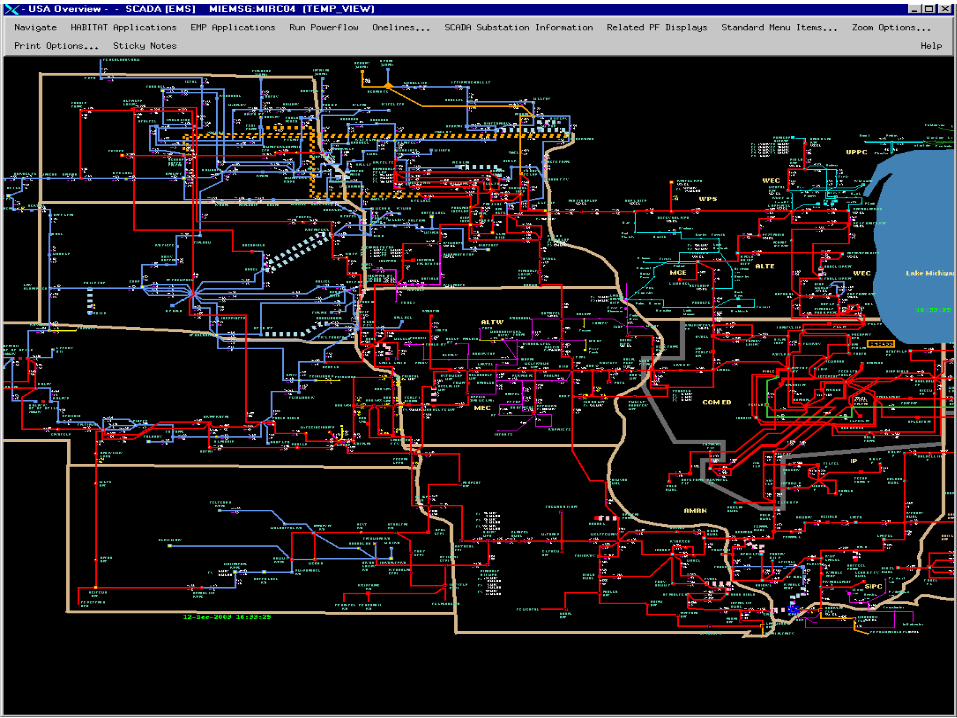
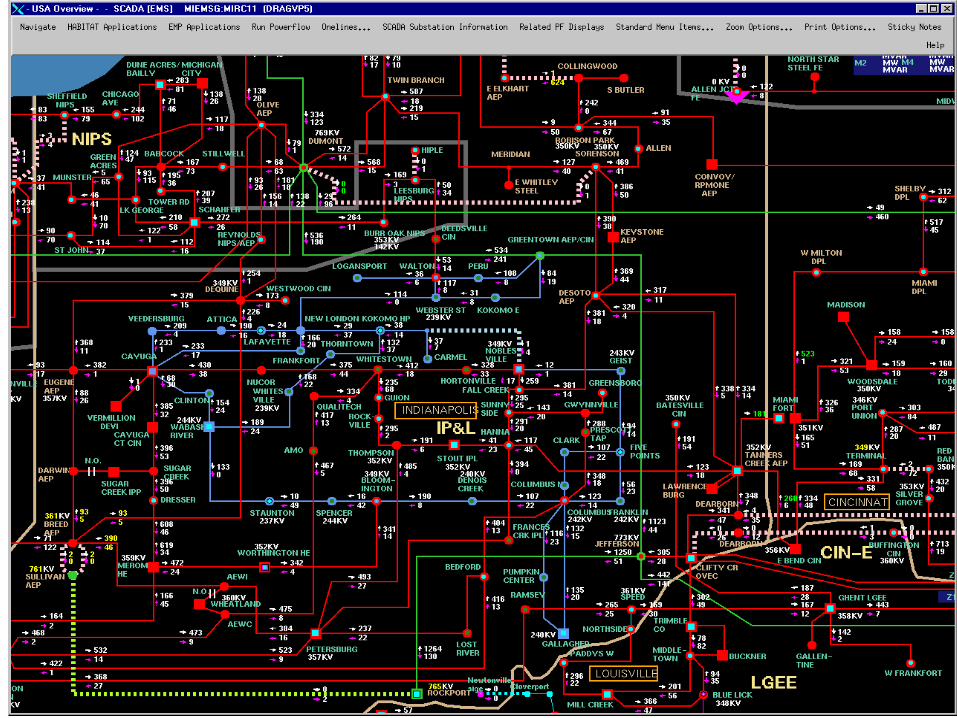
The Role of RTOs
Monitor flow of power over the grid
Schedule transmission service
Perform transmission security analysis for the Reliability Area footprint
Manage power congestion through LMPs
Approve transmission & coordinate generation maintenance outages
Perform long term planning & analysis for region
Operate Real-Time & Day-Ahead Markets

Midwest Market Initiative
Midwest Market Launch
April 1, 2005
00:00:01 EST
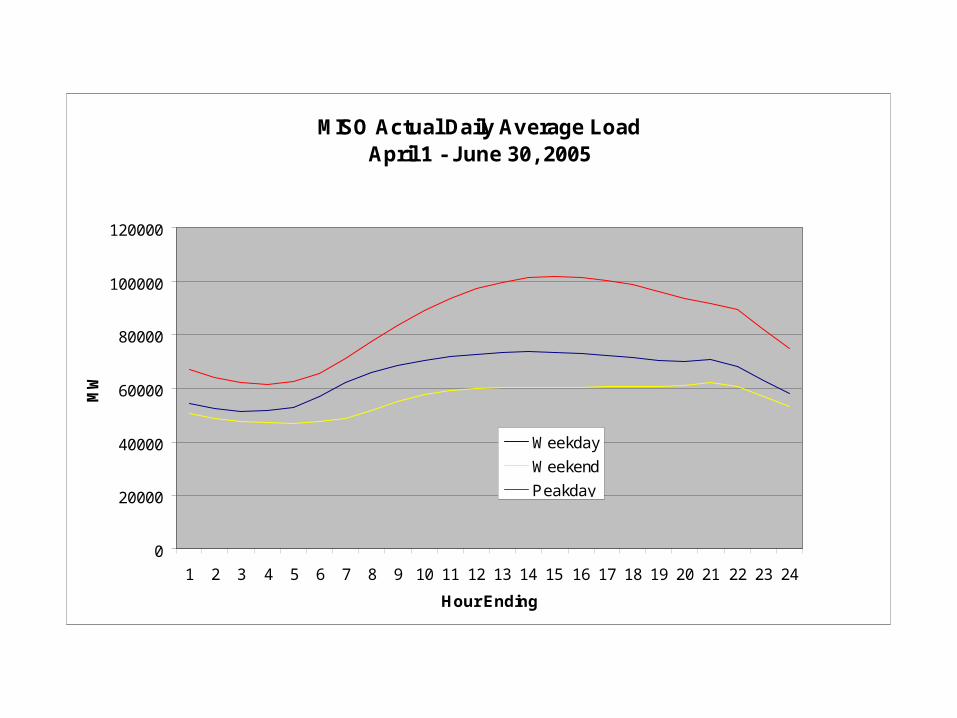
MISO Actual Daily Average LoadApril 1 - June 30, 2005
0
20000
40000
60000
80000
100000
120000
1 2 3 4 5 6 7 8 9 10 11 12 13 14 15 16 17 18 19 20 21 22 23 24
Hour Ending
MW
Weekday
Weekend
Peakday

Why a Midwest administered Market?
Create a framework for robust, transparent and competitive electric markets. Markets work better when there are many buyers and sellers Competition yields lower prices Sellers will build if there’s an opportunity to earn a return
commensurate with the risks. Competitive markets are efficient!
Maximizing consumer welfare ‘Correct’ allocation of scarce resources Production at lowest cost
Enhance system reliability
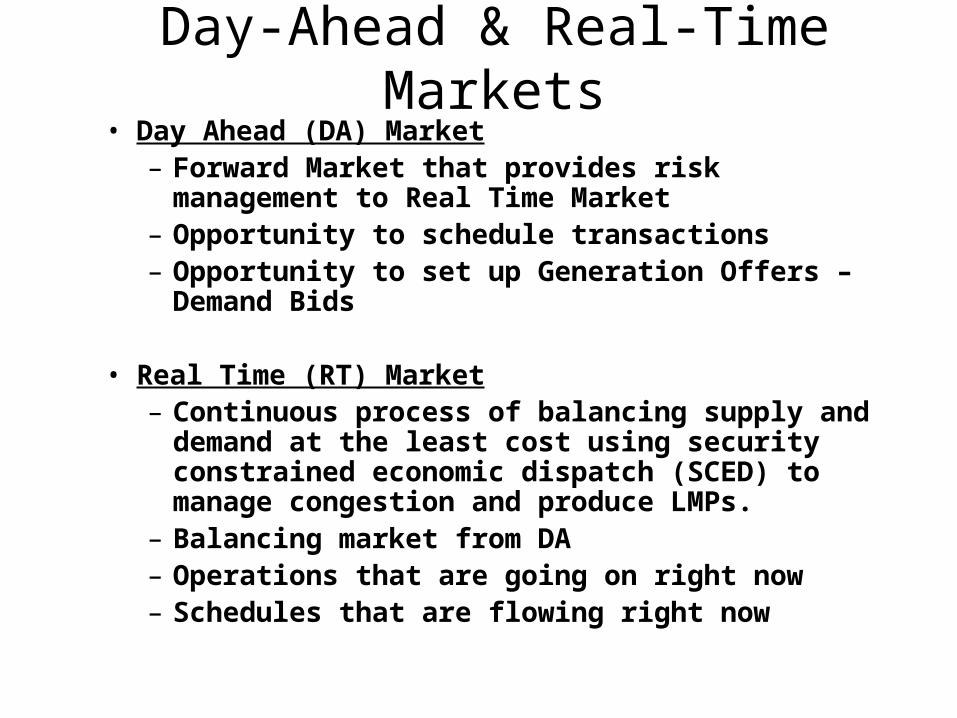
Day-Ahead & Real-Time Markets• Day Ahead (DA) Market
– Forward Market that provides risk management to Real Time Market
– Opportunity to schedule transactions– Opportunity to set up Generation Offers – Demand
Bids
• Real Time (RT) Market– Continuous process of balancing supply and demand
at the least cost using security constrained economic dispatch (SCED) to manage congestion and produce LMPs.
– Balancing market from DA– Operations that are going on right now– Schedules that are flowing right now

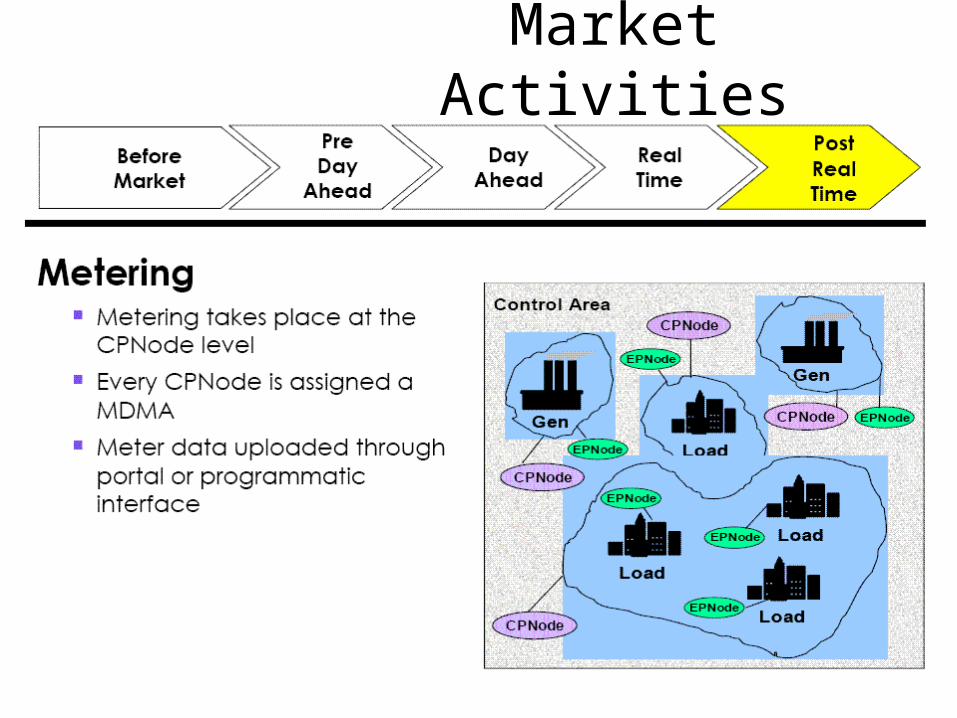
Market Activities

Key Market Participants
GenerationOwner
TransmissionOwner
Load ServingEntity
Marketer
May or may not have assets

Generation Supplier bids (sets price they are willing to take for) generation into the market
Load Serving entity bids (sets price they are willing to pay to supply) load into the market
Supply
Demand
Market
MISO assesses the appropriateness of the bids and offers and contacts as needed
Market Participants
Supply
Offers
Demand
Bids
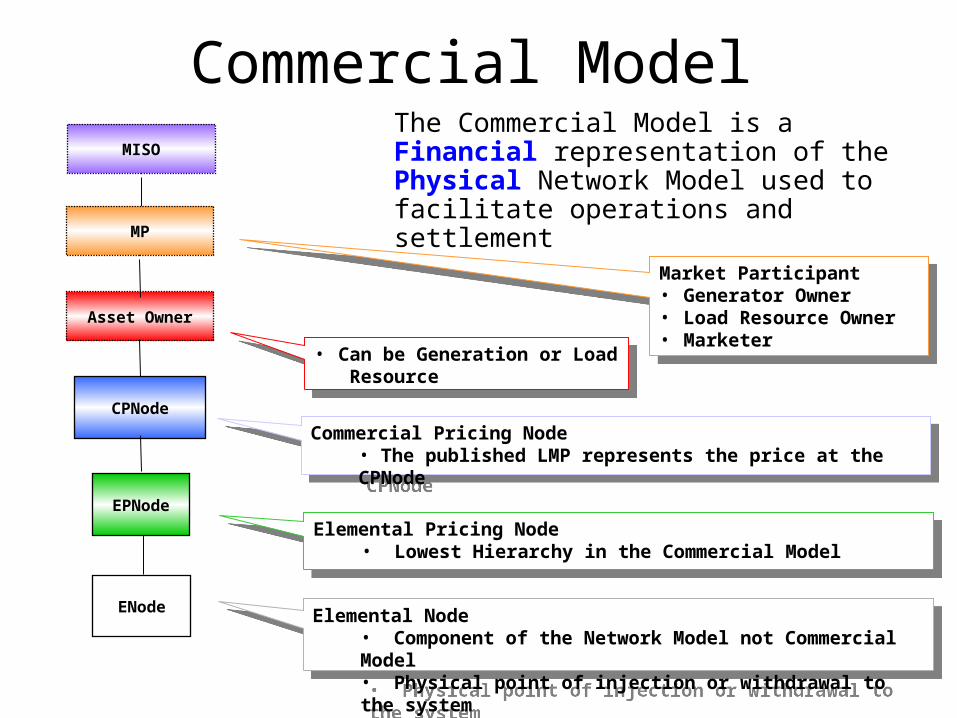
Commercial Model
Asset Owner
CPNode
EPNode
ENode
MISO
MP
The Commercial Model is a Financial representation of the Physical Network Model used to facilitate operations and settlement
Market Participant • Generator Owner• Load Resource Owner• Marketer
Market Participant • Generator Owner• Load Resource Owner• Marketer
• Can be Generation or Load Resource
• Can be Generation or Load Resource
Commercial Pricing Node• The published LMP represents the price at the CPNode
Commercial Pricing Node• The published LMP represents the price at the CPNode
Elemental Pricing Node• Lowest Hierarchy in the Commercial Model
Elemental Pricing Node• Lowest Hierarchy in the Commercial Model
Elemental Node• Component of the Network Model not Commercial Model • Physical point of injection or withdrawal to the system
Elemental Node• Component of the Network Model not Commercial Model • Physical point of injection or withdrawal to the system
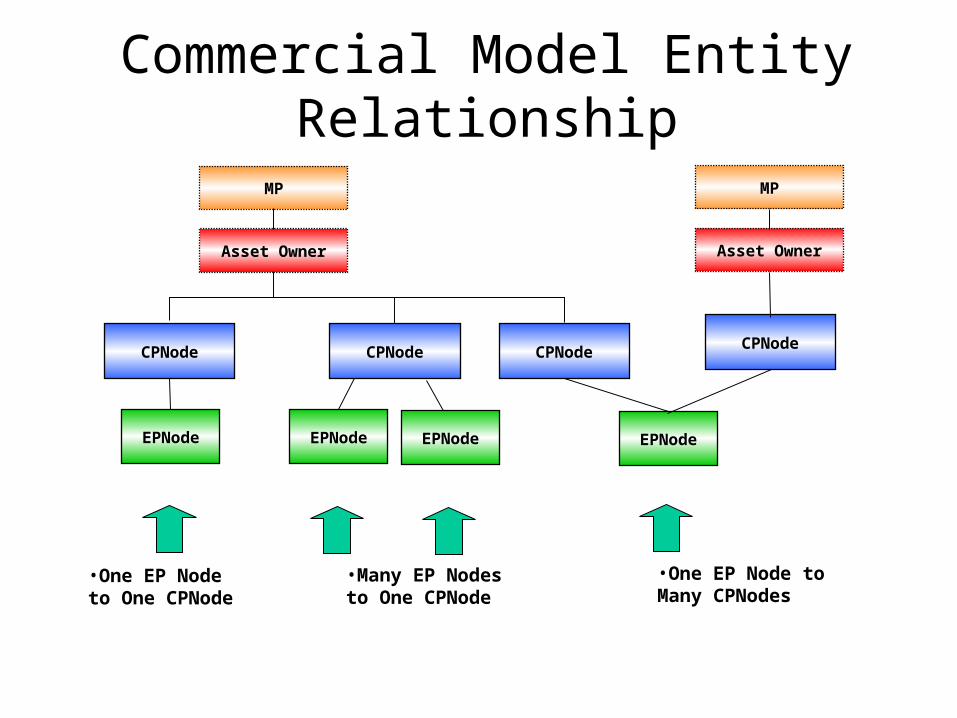
Commercial Model Entity Relationship
•One EP Node to One CPNode
Asset Owner
EPNode
CPNode
EPNode EPNode
CPNode
EPNode
CPNode
Asset Owner
MP MP
•Many EP Nodes to One CPNode
•One EP Node to Many CPNodes
CPNode

Market Activities
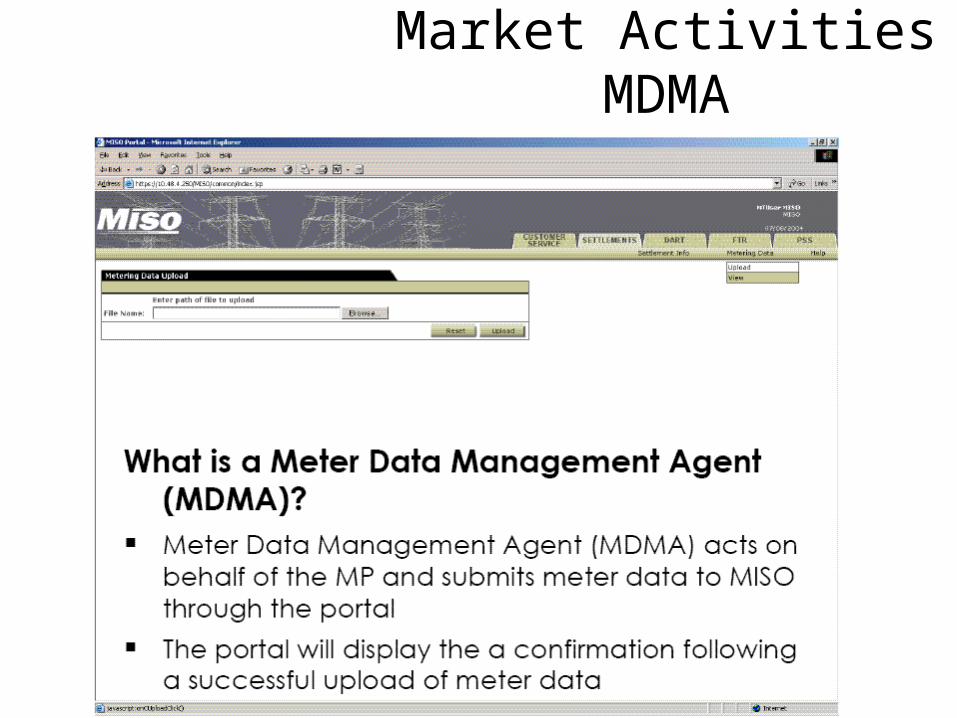
Meter Data Management Agents (MDMA’s)
All Market Participants that own assets within MISO report, through their designated MDMA, hourly real- time meter injection and withdrawal volumes for each of their asset Commercial Nodes (e.g. ‘Meter Data’)
‘Meter Data’ may be:•Actual Meter Data •Estimated Meter Data (Day-Ahead Forecasts or Schedules, SCADA aggregated data, or profiled)•Initially Estimated Meter Data that has been submitted to MISO that has been subsequently updated using Actual Meter Data when available.

Market Participant – Meter Data Management Agent (MDMA)
Relationship
Market Activities
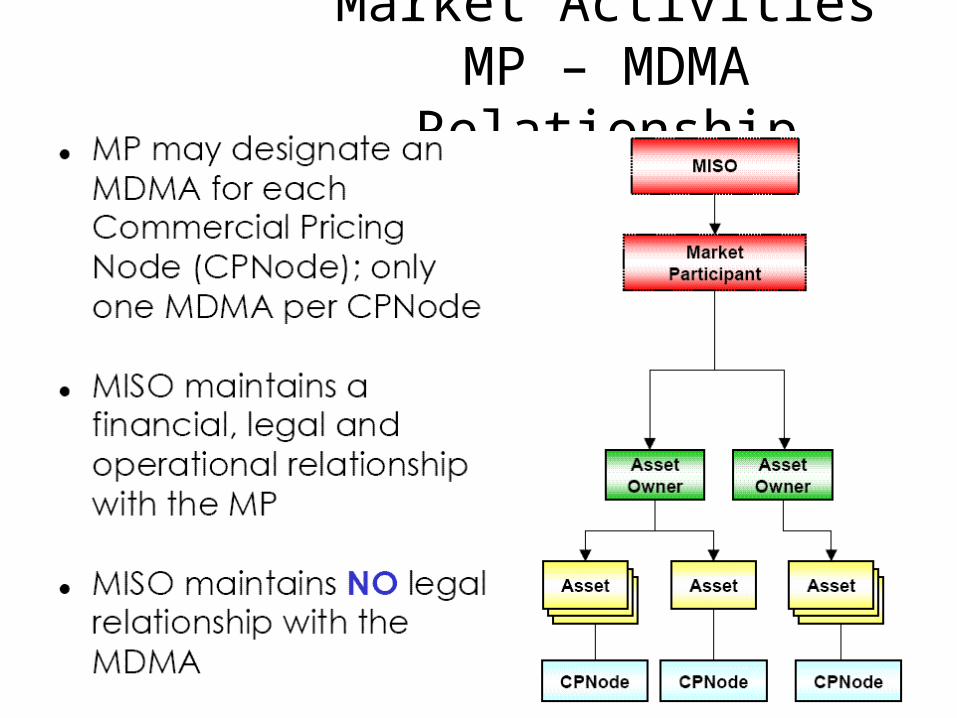
Market ActivitiesMP – MDMA Relationship

Meter Data Management Agents(MDMA’s) in June ’05 Commercial Model:
# MDMA CC DRR GENRES LOAD Total # MDMA CC DRR GENRES LOAD Total1 AETS 4 31 IP 32 2 342 ALTM 2 92 4 98 32 IPLM 23 1 243 AMPO 1 1 33 LGEE 46 3 494 AMSE 4 112 36 152 34 MAEM 1 2 35 APGT 1 1 35 MDUM 6 3 96 APM 3 3 36 MGEP 1 10 1 127 CALP 2 3 5 37 MPC 2 2 48 CCG 1 1 12 14 38 MPM 26 7 339 CECD 8 8 39 MPPA 2 2
10 CETR 1 74 9 84 40 MPUG 7 1 811 CIN 3 87 12 102 41 MRES 9 912 CMS 1 6 2 9 42 MSCP 1 2 313 CMWL 1 3 4 43 NIP 1 19 4 2414 CPMT 3 3 44 NMKT 1 115 CPP 1 1 45 NMMI 1 116 CWLP 8 2 10 46 NSP 1 109 25 13517 DECO 2 5 7 47 OTPW 15 4 1918 DEMO 23 74 8 105 48 QEHI 5 519 DPC 2 2 49 RES 19 1920 DTE 3 3 50 SIGW 11 2 1321 DTET 1 1 51 SIPC 4 3 722 EIPM 2 2 52 SMPM 6 3 923 EKPM 1 1 53 UGPM 2 224 FE 4 4 54 UPLS 4 425 FESR 59 10 69 55 WEPM 1 72 3 7626 GRE 19 7 26 56 WPPI 1 8 4 1327 HEPM 14 7 21 57 WPSC 3 328 HOLL 1 1 58 WPSE 1 129 HUC 1 8 1 10 59 WPSM 28 3 3130 IMEA 3 3 Grand Total 24 23 1024 236 1307

The MDMA is responsible for submitting‘Settlement Quality Meter Data’ to MISO
• Accurate and complete measurement or estimation of actual hourly MWh injection and withdrawals volumes for each designated Market Participant’s asset Commercial Nodes.
• Aggregated (from Elemental Nodes) to the Asset Resource level (CP Node) consistent with the MISO Commercial Model including sub-transmission distribution losses and station auxiliary load where applicable.
• Where Validation, Estimation, and Editing (VEE) has been performed by the MDMA to ensure accuracy and completeness prior to submittal to MISO.
• Passes Market Settlement’s automatic validation controls – Initial (Portal) and Internal (preliminary data acquisition) validation process controls.
• Meets the above listed requirements with timely electronic submittal to Market Settlements in advance of S7, S14, S55 and S105 allowing for settlement of the market.

MISO Meter Data Process
OOOOOO
MWh
MDMAMarket SettlementsInterval Database
Meter
MV-90 MeterInterrogation /
TranslationSystem
MISO Portal / API
Market ParticipantStatements / Invoices
Settlement SystemVEEValidation &
AnalyticalProcessInterval Data
Market ActivitiesMDMA
Market Settlements

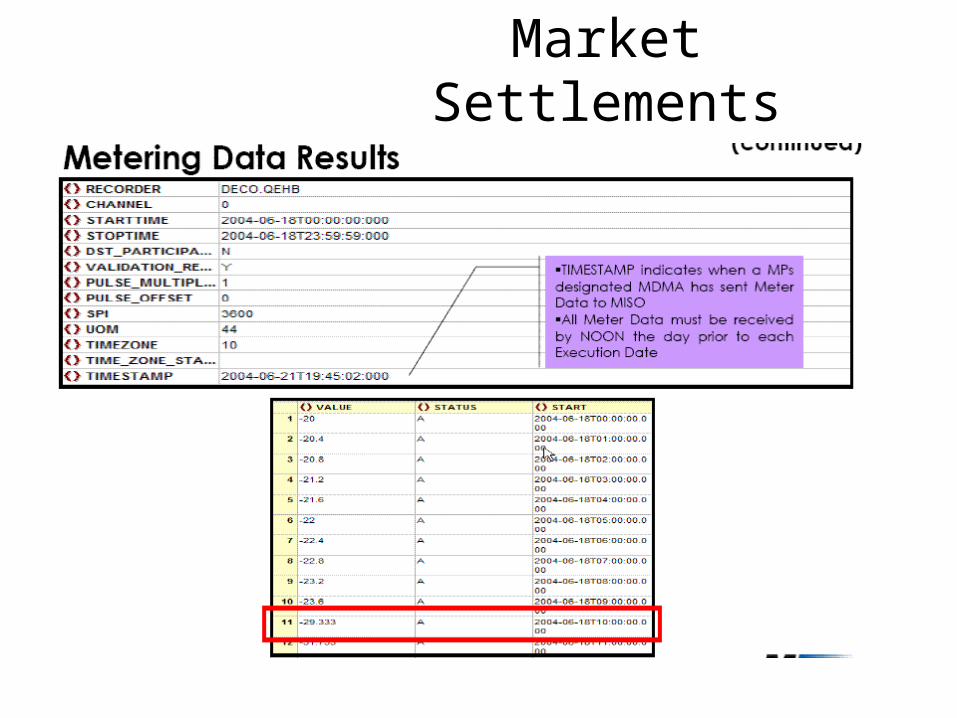
Meter Data File Format Standards• XML format only• MWh is the standard unit of measure• Truncated past 3 decimal (kWh) places• 24 intervals for each consecutive operating day• Eastern Standard Time (EST)• Submitted values represent ‘net’ injection or withdrawal
– Negative (-) values represent injection– Positive (+) values represent withdrawal
• Meter Data may represent:– Actual Meter Data– Estimated Meter Data– Profiled Meter Data
• Should be submitted by noon before scheduled settlement execution

Market ActivitiesMDMA Meter Data Submission
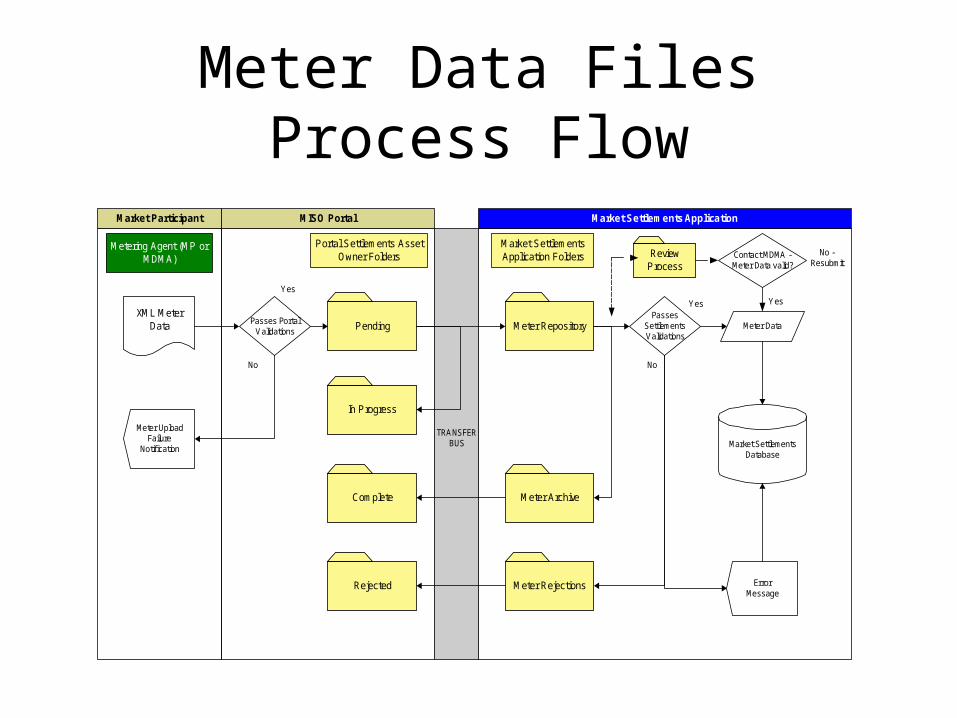
Meter Data FilesProcess Flow
Metering Agent (MP orMDMA)
XML MeterData
TRANSFERBUS
MISO Portal
Portal Settlements AssetOwner Folders
Market Participant Market Settlements Application
Market SettlementsApplication Folders
Passes PortalValidations
Yes
No
Pending
In Progress
Complete
Rejected
Meter Repository
Meter UploadFailure
Notif ication
Meter Archive
Meter Rejections
PassesSettlementsValidations
Yes
No
Market SettlementsDatabase
Meter Data
ErrorMessage
ReviewProcess
Contact MDMA -Meter Data valid?
Yes
No -Resubmit

Meter File Initial ValidationInternal Validation
"within cut'External Validation
"between cuts'
MP / MDMA PortalSettlement
System Analyst System
Valid XML Schema Trade Date > Current
Date? MDMA Relation Valid Asset Registration
Valid Valid MDMA-Asset
Relationship Operating Day > 105?
(warning only)
Interval Count = 24 SPI Tag = 3,600 Unit of Measure = 44 Invalid Interval (Channel
0 with status code of 9) MW Limits (high-low
tolerance limits) Test Asset Sign (+, -)
Consistency Test Interval Count =
Stop+1-Start/SPI
Graphic Visualization Cut Period Match-Up Time Series Trend Analysis Statistical Analysis Model Validation
Automatic Controls to ensureSettlement Quality Meter Data
‘Meter Data’ Validation Measures
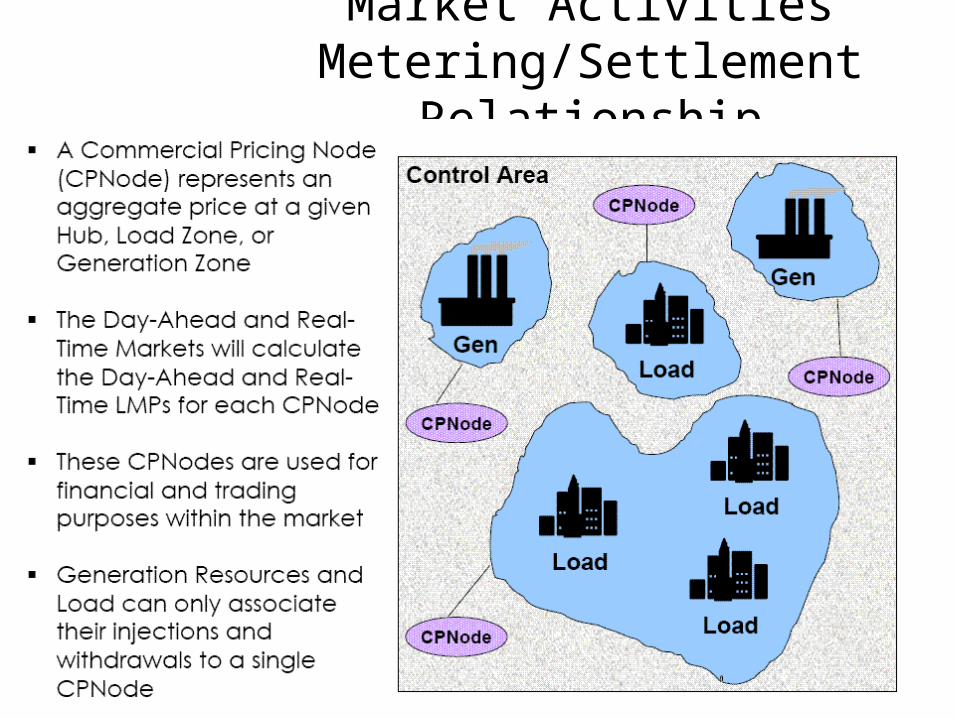
Market ActivitiesMetering/Settlement Relationship

Market Settlements
Market Settlement

Settlement System Interfaces

Market Activities

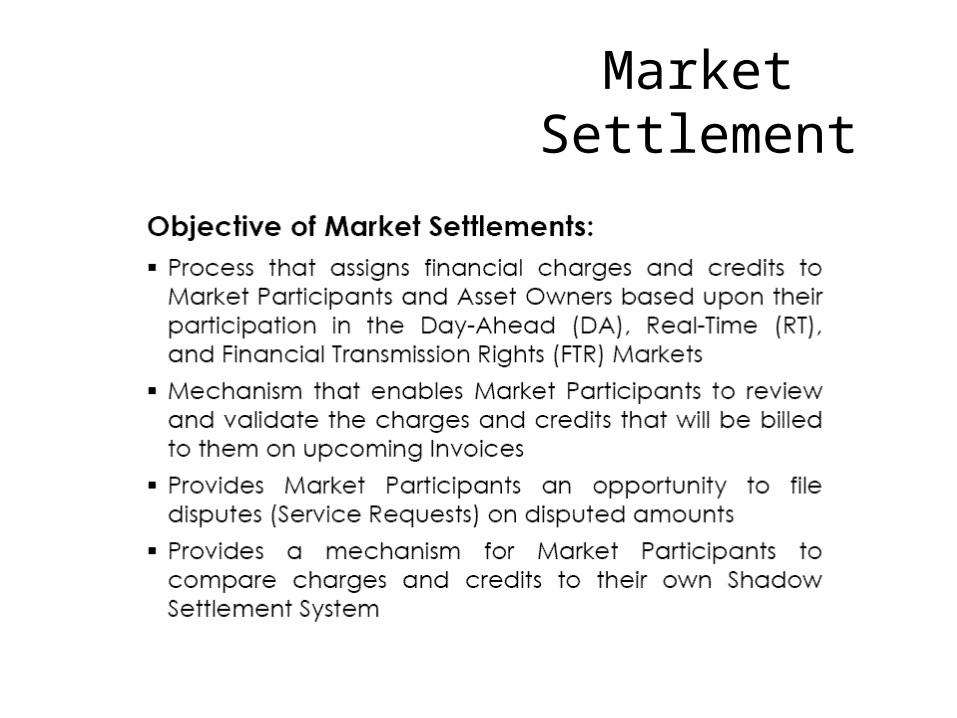
Market Activities Charge Types
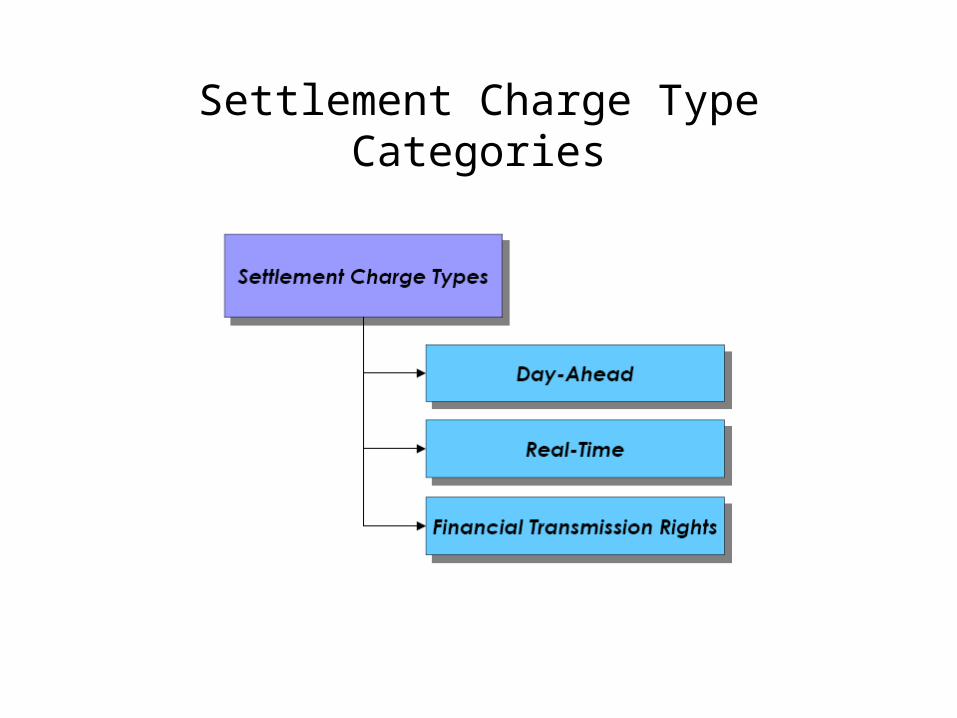
Settlement Charge Type Categories
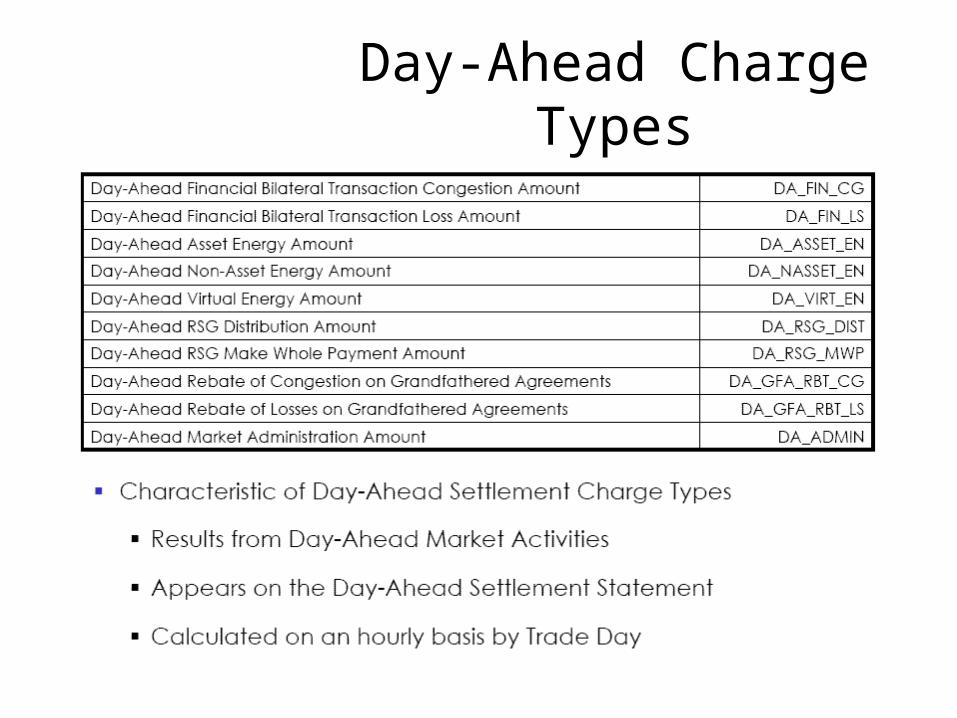
Day-Ahead Charge Types

Real-Time Charge Types
Characteristic of Real-Time Charge Types: Results from real time market activities Appear on real time settlement statement Calculated on a hourly and daily basis by trade date
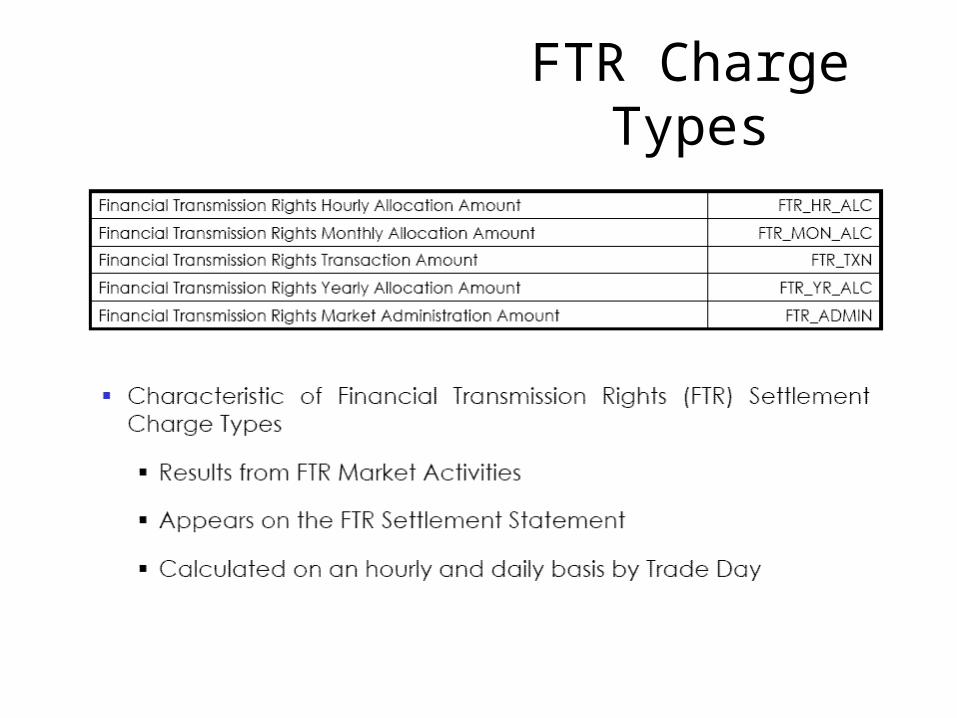
FTR Charge Types

Market ActivitiesSettlement Statements
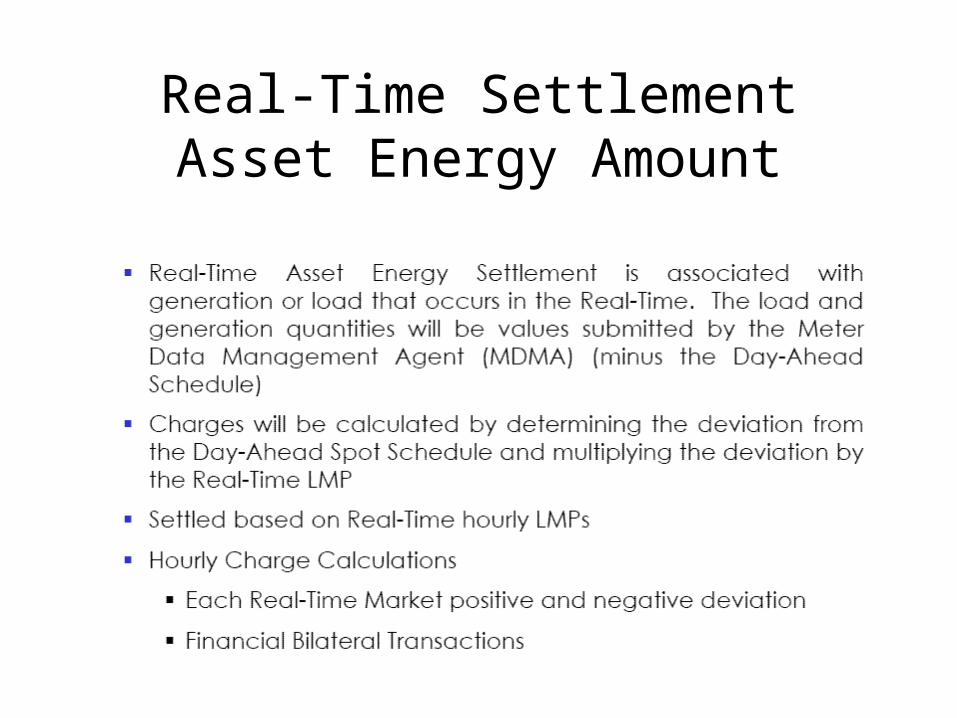
Real-Time SettlementAsset Energy Amount
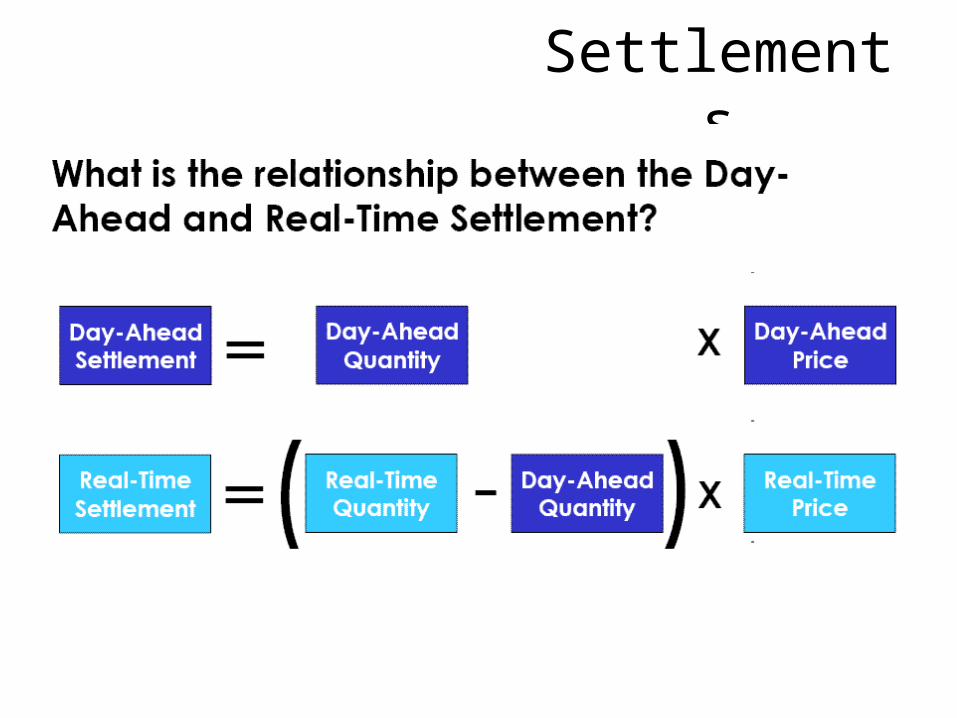
Settlements

Settlement Example

Real-Time Market Settlement Activitywith Financial Bilateral Transactions

Real-Time Asset Energy Amount

MISO ‘Meter Data’ Analyst vs.
Load Research Analyst- Comparison -
Similarities:• Time-Series Data• Systems Intensive• Energy Data Analytics• Applications • Not a ‘High Profile’
Function
Differences:• Data Not Sample Based• ‘Asset’ or Population
Data vs. Sample Point• Collection Methodology• Data Highly Aggregated• MWh vs. kWh• 60 vs. 15 Minute basis

For more information on the settlement of the MISO Day-Ahead, Real-Time, and FTR Competitive Markets refer to
the Business Practices Manual for Market Settlements located at:
www.midwestmarket.org/documents/ Market Procedures Documents and Technical Manuals /
Business Practices Manuals / Manual 005 BPM for Market Settlements