intervention strategy to increase growth and development
TRANSCRIPT

European Journal of Molecular & Clinical Medicine
ISSN 2515-8260 Volume 07, Issue 10, 2020
280
Intervention Strategy to Increase Growth and
Development for Stunted Children Under Two
Years with Developmental Delay
Hadi Ashar1, Ina Kusrini
2, danLeny latifah
3
1,2,3National Health Research And Development, Unit in Magelang
E-mail: [email protected], [email protected]
Abstract: Background: The government has made efforts to improve children's growth and
development through programs in primary health care, but the reduction in stunting and
child development delay has not been as expected. Implementation of these programs needs
support from all stakeholders, including health cadres and also the family as the main
caregiver of a child. Objective: analyzed the effect of family assistance on the growth and
development of the under two years old children. Method: this was a quasi-experimental
study with a pre-post control group design. Subjects were 63 stunted under two years old
children with developmental delay. The intervention group of 32 children was assisted by
trained health cadres, namely the Kader PendampingKeluargaKawalBaduta[KP-KKB] for
4 months, while 31 control group children were not accompanied. Results: The
implementation of the KP-KKB strategy model shows: mean different changes in subjects
and control of nutritional status HAZ-score of 0.09 [Wilcoxon]; WHZ-Score of 0.2; and
WAZ-Score of 0.21 [Paired t-test] in the intervention group. Changes in the mean status of
motor development are 3.6; and social personal 0.88 [paired t-test] in the intervention
group. The results of the paired statistical test of changes in nutritional status and the
initial and final development of each group showed significant changes with a value of p
<0.05. Conclusion: the KP-KKB intervention strategy model showed changes in nutritional
status and improved development compared to the control group.
Keywords: development, nutrititonal status, stunting, stimulation
1. INTRODUCTION
The children’s optimal growth and development are related to qualified human
sources. The effort to maintain the baby's and child’s health must be proposed to prepare the
qualified, intelligent, and healthy generation in the future and also to increase the child’s and
baby’s mortality [1]. However, in the developing country, there are more than 200 billion
under five-year-old children who fail to reach their development potential due to poverty,
lack of nutrition and health, and lack of parenting[2]. In Indonesia, it is still at the serious
levelwhich is 40-59% of children who are at risk to suffer from development problems[3].
A study about intervention combination that joined the nutrition intervention and
development shows that both of them consistently show more beneficial synergistic effect

European Journal of Molecular & Clinical Medicine
ISSN 2515-8260 Volume 07, Issue 10, 2020
281
towards toddler’s growth and development[4-6]. ResearchinBangladesh showed that there
was a significant increase in maternal knowledge, the quality of the parental environment,
health practice, and children’s language development[7].
Various programs have been planned by the Ministry of health to increase the child’s
growth and development. The effort to detect the problems has been done by a program
called SDIDTK that consists of stimulation, early detection in children's growth and
development. The aim program to monitor the children's development and to early
intervenein the barriers of child development at the basic service level [8] and referral
service[9]. The health service standard for toddlers is to do the monitoring of growth and
development, the stimulation using SDIDTK instrument, the guidance of integrated service
post and early childhood education programs, the family consultation in the mother’s toddler
class by using mother and child health’s book, care for children under five with breastfeeding
for up to 2 years, balanced nutrition food and Vitamin A[10]. One of the principles in
handling the child's growth and health is the earlier it is found and handled then the better the
prognosis is.
The profile data of toddler’s health service in 2018 showed that the weighing
coverage is in 68.37%[11]. However, more specific data showed a different trend. The data
from Basic Health Research in 2018 showed that there were 54.6% of toddlers weighed in the
integrated service post more than 7 times in 12 months recently[12]. Low data were also
found in the SDIDTK program coverage. In Jawa Tengah Province, there are only
35.66%[13]. The research result in Magelang Regency stated that the scope data SDIDTK is
in 50%[14], the cause of low scope of SDIDTK in Magelang is due to the various and
unstandardized process of collecting data, the families that are targeted also has not realized
the existence of the program yet, and the low of family participation [14]. Another research in
PolewaliMandar, West Sulawesi, found that the public participation in detecting and
stimulating the children was still low [15].
Under two years old is a golden period where the growth and development
areIrreversible[16-17]. The effort that is done to overcome the problem in a toddler’s
development is not only in the form of curative efforts but also a promoted-preventive effort
that needs deeper information to explain why the development problem occurs. Stunting is
also one of the factors affecting the development[18], it cannot be finished by only one side.
The deal of toddler stunting repair in 100 regencies/city has proved that this problem should
be finished, by involving cross sectors and cross-ministry [10].
Today, it is needed Scale-Up and application of integrated interventions, the synergy
of health, nutrition, and development in the program broadly and immediately, based on the
proofs in the previous researches, mainly parenting / family-based interventions[19]. This
integrated intervention can be integrated without a big amount of money by the existence
health service program and even better if it is integrated into other programs [5]. This is along
with the family-based program initiated by the Health Ministry. Like the effort in increasing
the scope and access to the health service, the government assigns the family approach or
called Program Indonesia SehatdenganPendekatanKeluarga(PIS-PK) [10].
In accordance with the child's growth and development, a family factor is one of the

European Journal of Molecular & Clinical Medicine
ISSN 2515-8260 Volume 07, Issue 10, 2020
282
affecting factors towards the health status and child nutrition status [20,21]. Through giving a
good parenting style [22,23], family assistance is one of the efforts to increase the ability of a
family to level up the optimal health status. Based on the background above, this study is
aimed to analyze the influence of family assistance done by trained health cadres towards the
increase of a child’s growth and development.
2. MATERIAL AND METHOD
Design and Subject
The quasi-experimental design usesa Pre-post research design with the Control Group.
This research is done to the under-two-year-old children stunting with developmental barriers,
who are inclusively and exclusively qualified, which are children who are in 6 to 20 months,
donot have a chronic disease, live in the research area, and no plan of moving outside the area.
The subjects are 63 children under two years old with developmental barriers, the
intervention group is 32 children who got assistance from health care, called Kader
PendampingKeluargaKawalBaduta(KP-KKB) for 4 months, while 31 children who are in the
control group did not get assistance. The criteria of cadre are minimally able to read, write,
and deliver the information and stimulation that is given in the training.
In the early study, both the intervention and control group get training about the
child’s growth and development. Both groups are hoped to access the existing program in the
community health centers related to the child’s development every time. The evaluation is
done 4 months later and only 55 children left with some details are 4 children from the
intervention groups dropped out and the control group as well. They dropped out because
there are 5 children who moved out and 3 children who did not come in the last evaluation.
Collecting and Measuring Data
The research was done in early 2019 in Wonosobo Regency. There were 455 screened
children under two years old in the chosen district and got 63 children stunting with
developmental barriers. The screening was done by the nutritionist, doctor, and psychologist.
The child’s body length was measured by a nutritionist using a validated Length Board; the
bodyweight measurement used AND brand digital scales with 0.01kg accuracy. Meanwhile,
the measurement of development used Developmental Milestones Checklist (DMC)-II did by
a psychologist. DMC-II is a measurement of a child’s development aged 0-24 months,
involving the observation and structural interview towards 66 development checklist items.
DMC-II covers three domains: motor, language, and personal-social development. Each item
is scored 0, 1, 2, or N. The score 0 is gained if a child has never been observed in doing the
referred activity, or in the observed practice, a child fails/cannot do the preferred activity.
Score 1 is gained if a child has been able to do the referred activity before but not
continuously for 4 weeks or recently can do in less than 4 weeks. Score 2 is obtained if a
child has been able to do a certain activity in the last month or continuously in the last 4
weeks. N is when the parents/baby sitter does not know/remember/observe and gauges do not
have many chances to observe/the child refuses. The total score gained in each domain also
the total score is compared with normally based on the age group to see whether the

European Journal of Molecular & Clinical Medicine
ISSN 2515-8260 Volume 07, Issue 10, 2020
283
development category is under, normal, or above the average[24].
KP-KKB is 17 chosen health cadres who have joined some training which is feeding
baby and children (PMBA), early detecting and stimulating child’s growth and development,
the health of children under two years old, and introducing some programs related to the
child’s growth and development. During the mentoring, the cadres are provided with
companion cadre module KKB, pocketbook KP-KKB, activity checklist that must be done,
and cadre activity logbook. A companion cadre does a Home Visitevery week in 4 months
[17] times Home Visit. The role of a cadre during Home Visit is: to identify the problem of
child’s development using KPSP (pre-development screening questionnaire), do and guide
the mothers to stimulate the child’s development according to developmental problems
experienced, train the mothers to provide good PMBA, give health education,
introduce/approach the programs related to the child’s growth and development, guide the
mothers also their family to continuously detect and stimulate the development.
Data Analysis
The analyzing data uses SPSS.15 computer program. It is descriptively seen from the
initiate changing to the last from each variable, delta change in mean before and after the
intervention, and statistic test uses Chi-square test to see the proportion differences,
Wilcoxon, paired t-test to see before and after intervention in the groups and independent t-
test to see the mean differences between the groups.
3. RESULT
Table 1 shows the characteristic of the research subject, the child’s age, gender
variable, and parent’s education/occupation, both groups are in homogeny condition (no
difference). The result of the homogeneity test of each variable shows the value p>0.05.
Table 2 shows the subject status in the early study. The results of statistical tests on the
diversity of intervention subjects and control subjects show Homogeneity Variant Score, the
development and nutrition status show that both groups are in homogenycondition with value
p>0.05. Intable 2, it gives a picture that there is a developmental barrier shown in the
nutrition status based on HAZ, WHZ, and WAZ while the development status is shown in the
motor, language, and personal-social development.
The effort of the companion cadre that played role in guiding the toddler’s guardian family
for 4 months can be seen in table 3. The change of research subject happened in all growing
variables, generally, in both groups, the change happened in a better way. The change
dominantly occurred in the HAZ-score category.The development status in each variable of
the intervention and control group evenly shows improvement, the change dominantly occurs
in the motor development variable.
The mean changes in each variable of nutrition status and development status mostly
show the change in both intervention and control group with value p<0.05, except in the WAZ
group with value p>0.05, in both groups. The mean change in the intervention group shows a
bigger number than in the control group. This higher increase occurs in the aspect of motor

European Journal of Molecular & Clinical Medicine
ISSN 2515-8260 Volume 07, Issue 10, 2020
284
and personal-social development.
4. DISCUSSION
Under two years old children are a golden period to increase their growth and
development that will determine the future quality of life[8]. However, this age is where they
have a risk to suffer a growth and development barrier if the parents/family do not pay
attention to the given parenting[19]. The parents/family are hoped to have the ability in
controlling the child’s health so they can grow and develop optimally [25]. The parent’s
knowledge mainly in the village area where the literacy and access towards the limited health
programs are caused by the knowledge, facilities, and infrastructure. To overcome the
problem, the involvement of health care to help monitoring the child’s growth and
development is crucially needed. They are hoped to be able to deliver information about the
health programs, encourage mothers to access the existing health service, and stimulate
growth and development in Integrated Healthcare Center [26].
Stimulation done at an early age is a successful key to increase the child’s growth and
development. This research collected data ona child’s growth and development at the age of
6-18 months. The data collection is done by finding children under 2 years old suffering
stunting with a developmental barrier. Table 1 shows the characteristic of the research
subject, age variable, gender, and parent’s education/job, both groups are in homogeny
condition. The result of the homogeneity test shows a value p>0.05. The age of the children is
evenly 12.5 months, the gender is also balanced by female and male group, and the parent’s
family characteristic, the education average is Secondary School and Junior High School,
with parent’s occupation, is mostly farmer.
Table 2 showed the subject status in early research. The results of statistical tests of
the diversity of intervention subjects and control subjects showed Homogeneity of Variance
Development Score and WHZ, HAZ, WAZ scores showed that the two groups were in no
difference (homogeneous) with a p value> 0.05, the results of the mean difference between
the two groups showed no difference(homogeneous) with value p>0.05. in table 2, it gives
the picture that there is a developmental barrier showedin the WHZ, HAZ, and WAZ Score.
Meanwhile, the development status is shown in motor, language, and personal-social
development. The development barrier in personal social is dominantly 89.3% in the
intervention group and 81.5% in the control group. It is not so different from the result of the
cohort study held in Bogor to the 951 children, there were 35%-65% of children suffer
fromthe developmental barrier. While in the research result of Lu, et. Al stated that 43.0% are
a risk to suffer from the developmental barrier, and 40.0-49.0% of Indonesian children suffer
from the developmental problem [3].
Personal social development is one of the variables in the development status
examination. It covers the children’s ability to understand them, connect to their
surroundings, and follow the social rules and attitude towards other people. Personal social
development is often related to the child’s emotional development.
The effort of the companion cadre who has a role in assisting the family to guide the children
for 4 months is seen in table 3 and table 4. The change of research subject in each growth

European Journal of Molecular & Clinical Medicine
ISSN 2515-8260 Volume 07, Issue 10, 2020
285
variable, generally in both groups is in a better chance. It dominantly happened in the HAZ-
Score category when there are 17 subjects (70.8%), in the early research, the status is -3SD
s/d <-2 SD (short) into -2 s/d 2 SD(normal)at the end of the research. In the WHZ category,
there are 23 subjects or 92.0% no changing, but there is 1 subject 4.0% getting better and 1
subject 4.0% getting down. Similar research has been done and the result stated that the
trained cadre can increase the maternal knowledge and ability in caring for their baby and
toddler [27],[26].
Table 4 shows that 10 out of 12 subjects get better motor development status. There are 9
subjects (75.0%) that become normal and 1 subject (8.3%)has a development that more than
their age [above average]. Meanwhile, from the language ability side, there are 3 out of 4
subjects get better (75.0%). In the personal social development aspect, there is 13 form 23
subjects get better (56%). These results are similar to the previous research in 2011 held by
Purwandariet al showing that the increase of family role and social support can give a
positive effect onthe motor, language, and personal-social development of the children [25].
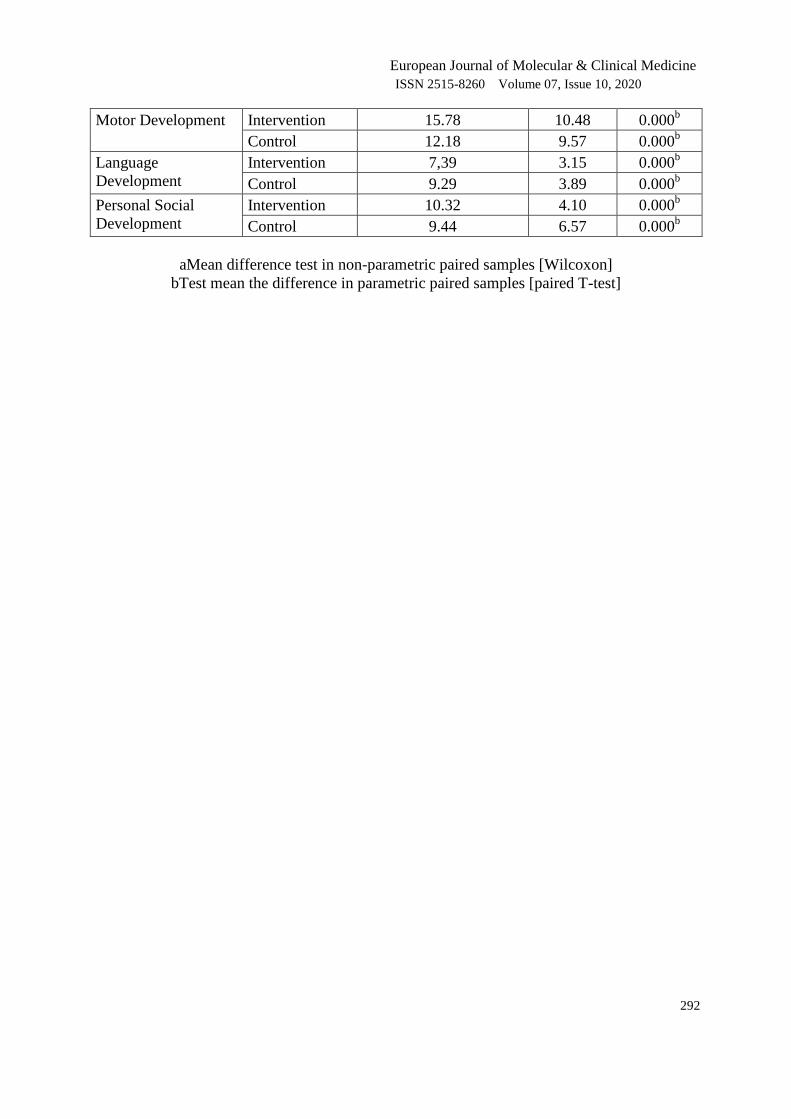
Table 5 shows the change in each development and nutrition status variable. In the
intervention group and control group with p<0.05, except in the WAZ score p>0.05. The mean
change in the intervention group shows a bigger number than in the control group. The higher
increase happened to the aspect of motor and personal-social development. From the result of
the statistic test, there are 5 out of 6 aspects in the intervention and control group that have
significant change with p<0.05. One variable BB/U (WHZ Score)does not show meaningful
changing with a value of p>0.05. Similar research was done by Paramashanti et al, on
children with low nutrition status. The intervention was education of development and
nutrition, development stimulation, and it was successful in increasing the body weight and
development significantly [28].
5. CONCLUSIONS
Intervention strategy of Kader PendampingKeluargaKawalKaduta(KP-KKB)as the
supporting motor of Children Guidance Family is successful to show the better change of
nutrition and development status than in the control group.The increase of a child’s nutrition
status is one of the main factors besides health factors in the child’s optimal development.
Parenting and stimulation become a very important thing to increase a child’s growth and
development.
Acknowledgment
The author thank to National Health Research and Development Unit in Magelang, The
research team who support this study.
Conflict of Interest
I hereby state that there is no necessary conflict in the process of writing this article and
publication.
6. REFERENCE
European Journal of Molecular & Clinical Medicine
ISSN 2515-8260 Volume 07, Issue 10, 2020
286
[1] Menteri Hukum dan Hak Asasi manusia Republik Indonesia. Undang-Undang Republik
Indonesia Nomor 36 Tahun 2009 Tentang Kesehatan. Vol. 2. Jakarta; 2009. p. 255.
[2] Engle P, Grantham-Mcgregor S, Black M, Walker S, Wachs T. How to avoid the loss of
potential in over 200 million young children in the developing world with a core team
[International Child Development Steering Committee] of. Child Heal Educ.
2007;1[2]:68–87.
[3] Lu, Black, Richter. Risk of poor development in young children in low-income and
middle-income countries: an estimation and analysis at the global, regional, and country
leve. lancet diabetes Endocrinol. 2015;3[18]:925–7.
[4] Hamadani JD, Tofail F, Cole T, Grantham-McGregor S. The relation between age of
attainment of motor milestones and future cognitive and motor development in
Bangladeshi children. Matern Child Nutr. 2013;9[SUPPL. 1]:89–104.
[5] Richter, L. M., Daelmans, B., Lombardi, J., Heymann, J., Boo, F. L., Behrman, J. R., …
Darmstadt GL. Investing in the foundation of sustainable development: pathways to
scale up for early childhood development. Lancet [Internet]. 2016;6736[16]. Available
from: https://www.sciencedirect.com/science/article/pii/S0140673616316981
[6] Ahun MN, Aboud FE, Aryeetey R, Colecraft E, Marquis GS. Child development in rural
Ghana: Associations between cognitive/language milestones and indicators of nutrition
and stimulation of children under two years of age. Can J Public Heal. 2017;108[5–
6]:e578–85.
[7] E.Aboud F, R.Singla D, Nahil MI, Ivelina Borisova. Effectiveness of a parenting
program in Bangladesh to address early childhood health, growth and development. Soc
Sci Med [Internet]. 2013;97. Available from:
https://www.sciencedirect.com/science/article/abs/pii/S0277953613003511
[8] Kementerian Kesehatan Republik Indonesia. Pedoman Pelaksanaan Stimulasi, Deteksi
dan Intervensi Dini Tumbuh Kembang Anak. Summ Policymakers [Internet]. 2016;1–
30. Available from:
https://www.cambridge.org/core/product/identifier/CBO9781107415324A009/type/book
_part
[9] Kemenkes RI. Pedoman penanganan Kasus Rujukan Kelainan Tumbuh Kembang balita.
kementerian kesehatan. Jakarta; 2012.
[10] Kemenkes RI. Buku Monitoring dan Evaluasi PIS-PK. Vol. 1, Kemenkes RI. 2017.
[11] Ministry of Health of Republic Indonesia. Indonesia Health Profile 2018. Profil
Kesehatan Provinsi Bali. 2019.
[12] Balitbangkes. Laporan Nasional Riskesdas 2018. Kementerian Kesehatan Republik
Indonesia. 2018.
[13] Dewi FK. Efektifitas Sdidtk Terhadap Peningkatan Angka Penemuan Dini Gangguan
Tumbuh Kembang Pada Anak Usia Balita Di Posyandu Teluk Wilayah Puskesmas
Purwokerto Selatan. Stikes Harapan Bangsa. 2012;
[14] Latifah L. Pertumbuhan dan Perkembangan Bayi di daerah Replete dan Non Replete
GAKI Kabupaten Magelang. 2016.

European Journal of Molecular & Clinical Medicine
ISSN 2515-8260 Volume 07, Issue 10, 2020
287
[15] Fuada N, Patmawati, Huda MN. Banyak Anak Banyak Rejeki di Bumi Mandar. Penerbit
Pt Kanisius. 2017.
[16] Badan Litbangkes RI. Riset Kesehatan Dasar 2007. Riskesdas 2007. 2008;1–384.
[17] BalitbangKes. Riset Kesehatan Dasar 2013. Jakarta; 2013.
[18] Miller AC, Murray MB, Thomson DR, Arbour MC. How consistent are associations
between stunting and child development? Evidence from a meta-analysis of associations
between stunting and multidimensional child development in fifteen low- and middle-
income countries. Public Health Nutr. 2016;19[8]:1339–47.
[19] Richter L. Policies and programs to support early child development a ’ wise investment
’ as 250 million children at risk of not reaching their full potential. 2016 p. 3–5.
[20] L P, Engle, Menon P, Haddad L. FCND Discussion Paper No . 18 Care and Nutrition:
Concepts and Measurement Food Consumption and Nutrition Division International
Food Policy Research Institute. Context. 1996;[18].
[21] Engle P. Patrice Engle. Asian Develoment Rev. 1999;17[1]:132–67.
[22] Baharudin R, Luster T. Factors related to the quality of the home environment and
children’s achievement. J Fam Issues. 1998;19[4]:375–403.
[23] De Oliveira EA, Barros FC, Da Silva Anselmi LD, Piccinini CA. The quality of home
environment in Brazil: An ecological model. J Child Fam Stud. 2006;15[5]:631–42.
[24] Abubakar A, Holding P, Vijver F Van De, Bomu G, Baar A Van. Developmental
Monitoring Using Caregiver Reports in a Resource Limited Setting: The Case of Kilifi,
Kenya. J Paediatr. 2010;2[99]:291–7.
[25] Suryanto, Purwandari, Mulyono. Dukungan Keluarga Dan Sosial dalam Pertumbuhan
dan Perkembangan Personal Sosial, Bahasa dan Motorik pada Balita di Kabupaten
Banyumas. KESMAS - J Kesehat Masy. 2014;10[1]:103–9.
[26] Adistie F, Lumbantobing VBM, Maryam NNA. Pemberdayaan Kader Kesehatan Dalam
Deteksi Dini Stunting dan Stimulasi Tumbuh Kembang pada Balita. Media Karya
Kesehat. 2018;1[2]:173–84.
[27] Herliani Y, Rohmatin E, Diana H. Pemberdayaan Ibu Balita Dalam Kegiatan Kelas Ibu
Balita Untuk Meningkatkan Kemampuan Pemantauan Tumbuh Kembang Anak. In:
Prosiding Seminar nasional Dan Diseminasi Hasil Pengabdian Kepada Masyarakat
Berbasis Riset. 2018. p. 38–41.
[28] Paramashanti B, Sulistyawati S. Pengaruh integrasi intervensi gizi dan stimulasi tumbuh
kembang terhadap peningkatan berat badan dan perkembangan balita kurus. J Gizi Klin
Indones. 2018;15[1]:16.
SEPARATED TABLE

European Journal of Molecular & Clinical Medicine
ISSN 2515-8260 Volume 07, Issue 10, 2020
288
Table 1. Characteristic of research subject
Variable
Category
Intervention
group
n [%]
Control
group
n [%]
ρ
valu
e
Age in
months - Adequate
- Minimum
- Maximum
12.3
5
19
12.6
7
20
0.83a
- 0-6 months
- 7-12 months
- 13-18 months
- 19-24 months
3 [10.7]
11 [39.3]
12 [42.9]
2 [7.1]
0 [0.0]
13 [48.1]
13 [48.1]
1 [3.7]
Gender - Male
- Female
16 [57.1]
12 [42.9]
18 [66.7]
9 [33.3]
0.38b
Father’s
Education
- Not
Graduate/Unfinished
elementary school
- Elementary school
graduate
- Junior high school
graduate
- Senior high school
graduate
2 [7.1]
10 [35.7]
12 [42.9]
4 [14.3]
1 [3.7]
12 [44.4]
8 [29.6]
6 [22.2]
0.99b
Mother’s
education
- Not Graduate
/Unfinished elementary
school
- Elementary school
graduate
- Junior high school
graduate
- Senior high school
graduate
- University
graduate
1 [3.6]
10 [35.7]
10 [35.7]
6 [21.4]
1 [3.6]
1 [3.7]
8 [29.6]
10 [37.0]
8 [29.6]
0 [0.0]
0.56b
Father’s
job
- Private employee
- Entrepreneur
- Farmer
- Labor/driver/hom
e assistant
- Others
3 [10.7]
9 [32.1]
10 [35.7]
5 [17.9]
1 [3.6]
4 [14.8]
6 [22.2]
7 [25.9]
9 [33.3]
1 [3.7]
0.55b
Mother’s
job
- Unemployed
- Entrepreneur
- Farmer
- Labor/driver/hom
e assistant
- Others
14 [50.0]
0 [0.0]
2 [7.1]
1 [3.6]
2 [7.1]
9 [32.1]
15 [55.5]
1 [3.7]
1 [3.7]
0 [0.0]
1 [3.7]
9 [33.3]
0.61b
N=28[100] N=27[100]

European Journal of Molecular & Clinical Medicine
ISSN 2515-8260 Volume 07, Issue 10, 2020
289
‘a: Test meansthe difference between control and intervention groups with Independent t-test
‘b: Test for different proportions between the control and intervention groups with chi-square
Table 2. Nutrition status and the development status of research subject in intervention and
control group in the early study
Category
Intervention
Group Control Group
Total ρ value
n [%] n [%] N [%]
Nutrition Status PB/U [HAZ] 0.95b
Very Short [Z_Score <-3
SD]
5 [17.9] 3 [11.1] 8 [14.5]
Short [Z_Score -3 SD s/d <-
2SD]
23 [82.1] 24 [88.9] 47 [85.5]
Nutrition Status BB/TB [WHZ] 0.72b
Slim [Z_Score -3 SD s/d <-
2SD]
1 [3.6] 1 [3.7] 2 [3.6]
Normal [Z_Score -2 s/d 2
SD]
26 [92.8] 24 [88.9] 50 [90.9]
Overweight [Z_Score >2
SD]
1 [3.6] 2 [7.4] 3 [5.5]
Nutrition Status BB/U [WAZ] 0.93b
Bad [Z_Score <-3 SD] 1 [3.6] 0 [0.0] 1 [1.8]
Deficient [Z_Score <-3 SD] 7 [25.0] 5 [18.5] 12 [21.8]
Good [Z_Score -2 s/d 2 SD] 20 [71.4] 22 [81.5] 42 [76.4]
Motor Development 0.46
Under average 8 [28.6] 12 [44.4] 20 [36.4]
Normal 16 [57.1] 11 [40.7] 27 [49.1]
Above average 4 [14.3] 4 [14.8] 8 [14.5]
Language Development 0.48
Under average 9 [32.1] 4 [14.8] 13 [23.6]
Normal 14 [50.0] 18 [66.7] 32 [58.2]
Above average 5 [17.9] 5 [18.5] 10 [37.0]
Personal Social Development 0.47
Under average 25 [89.3] 22 [81.5] 47 [85.5]
Normal 3 [10.7] 5 [18.5] 8 [14.5]
n=28[100] n=27[100] N=55[100]
b: Test for different proportions between the control and intervention groups with chi-square

European Journal of Molecular & Clinical Medicine
ISSN 2515-8260 Volume 07, Issue 10, 2020
290
Table 3. The change of nutrition status before and after getting intervention in the
intervention and control group
Intervention Group Ending
Early <-3 SD
n [%]
-3 SD s/d <-
2SD
n [%]
-2 s/d 2
SD
n [%]
>2 SD
n [%] N [%]
TB/U
[HAZ] <-3 SD
2 [50.0] 1 [25.0] 1 [25.0] 0 [0.0] 4 [100]
-3 SD s/d <-
2SD
1 [4.2] 6 [25.0] 17 [70.8] 0 [0.0] 24 [100]
BB/TB
[WHZ] <-3 SD
0 [0.0] 0 [0.0] 0 [0.0] 0 [0.0] 0 [0.0]
-3 SD s/d <-
2SD
0 [0.0] 1 [100] 0 [0.0] 0 [0.0] 1 [100]
-2 s/d 2 SD 0 [0.0] 1 [4.0] 23 [92.0] 1 [4.0] 25 [100]
>2 SD 0 [0.0] 0 [0.0] 1 [50.0] 1 [50.0] 2 [100]
BB/U
[WAZ] <-3 SD
0 [0.0] 0 [0.0] 1 [100] 0 [0.0] 0 [0.0]
-3 SD s/d <-
2SD
2 [33.3] 2 [33.3] 2 [33.3] 0 [0.0] 6 [100]
-2 s/d 2 SD 0 [0.0] 1 [4.5] 21 [95.5] 0 [0.0] 22 [100]
Control Group
TB/U
[HAZ] <-3 SD
0 [0,0] 2 [50.0] 2 [50] 0 [0.0] 4 [100]
-3 SD s/d <-
2SD
1 [4.3] 10 [43.5] 12 [52.2] 0 [0.0] 23 [100]
BB/TB
[WHZ] <-3 SD
0 [0.0] 0 [0.0] 0 [0.0] 0 [0.0] 0 [0.0]
-3 SD s/d <-
2SD
0 [0.0] 1 [100] 0 [0.0] 0 [0.0] 1 [100]
-2 s/d 2 SD 0 [0.0] 2 [8.0] 23 [92.0] 0 [0.0] 25 [100]
>2 SD 0 [0.0] 0 [0.0] 1 [100] 0 [0.0] 1 [100]
BB/U
[WAZ] <-3 SD
1 [100] 0 [0.0] 0 [0.0] 0 [0.0] 1 [100]
-3 SD s/d <-
2SD
0 [0.0] 4 [66.7] 2 [33.3] 0 [0.0] 6 [100]
-2 s/d 2 SD 1 [5.0] 3 [15.0] 16 [80.0] 0 [0.0] 20 [100]

European Journal of Molecular & Clinical Medicine
ISSN 2515-8260 Volume 07, Issue 10, 2020
291
Table 4. The change of development status before and after getting an intervention in the
intervention and control group
Intervention Group Ending
Early Below average
n [%]
Normal
n [%]
Above average
n [%]
N [%]
Motor development - Below average
- Normal
- Above average
2 [16.7]
1 [8.3]
0 [0.0]
9 [75.0]
11 [91.7]
3 [75.0]
1 [8.3]
0 [0.0]
1 [25.0]
12 [100]
12 [100] 4 [100]
Language development - Below average
- Normal
- Above average
1 [25.0]
1 [5.3]
0 [0.0]
3 [75.0]
13 [68.4]
1 [20.0]
0 [0.0]
5 [26.3]
4 [90.0]
4 [100] 19[100]
4 [100]
Personal social - Below average
- Normal
10 [43.5]
2 [40]
13 [56.5]
3 [60.0]
0 [0.0]
0 [0.0]
23 [100]
5 [100]
Control Group
Motor development - Below average
- Normal
- Above average
1 [12.5]
0 [0.0]
1 [25.0]
4 [50.0]
14 [93.3]
3 [75.0]
3 [37.5]
1 [6.7]
0 [0.0]
8 [100]
15 [100] 4 [100]
Language development - Below average
- Normal
- Above average
0 [0.0]
0 [0.0]
0 [0.0]
6 [66.7]
9 [68.2]
1 [20.0]
3 [33.3]
4 [30.8]
4 [80.0]
9 [100]
13 [100] 4[100]
Personal social development - Below average
- Normal
- Above average
13 [54.2]
0 [0.0]
0 [0.0]
11 [45.8]
3 [100.0]
0 [0.0]
0 [0.0]
0 [0.0]
0 [0.0]
24 [100]
3 [100.0]
0 [0.0]
Table 5. The results of different tests on changes in nutritional status and development status
between the intervention group and the control group
Category
Group
Change
Mean change Sd Ρ value
TB/U [HAZ] Intervention 0.65 1.21 0.001a
Control 0.56 1.04 0.000a
BB/TB [WHZ] Intervention -0.51 0.85 0.004b
Control -0.75 0.93 0.000b
BB/U [WAZ] Intervention 0.03 0.82 0.865b
Control -0.18 0.60 0.125b
European Journal of Molecular & Clinical Medicine
ISSN 2515-8260 Volume 07, Issue 10, 2020
292
Motor Development Intervention 15.78 10.48 0.000b
Control 12.18 9.57 0.000b
Language
Development
Intervention 7,39 3.15 0.000b
Control 9.29 3.89 0.000b
Personal Social
Development
Intervention 10.32 4.10 0.000b
Control 9.44 6.57 0.000b
aMean difference test in non-parametric paired samples [Wilcoxon]
bTest mean the difference in parametric paired samples [paired T-test]