intervention summary title: climate public private ... · pdf fileintervention summary title:...
TRANSCRIPT

Intervention Summary
Title: Climate Public Private Partnership (CP3) Platform
What support will the UK provide? The UK’s International Climate Fund (ICF) will fund:
(1) Equity investment in the Climate Public Private Partnership Asia Fund – CP3 Asia in the amount of £60,000,000 to catalyse low carbon investments in Asia.
(2) Equity investment in the IFC Catalyst Fund (CF) in the amount of £50,000,000 to strengthen the financial infrastructure for low carbon investments globally.
(3) Grant financing for the Technical Assistance and Project Development Facility (£20,000,000) to assist with project pipeline and fund development.
(4) Programme development costs: £384,401.94 contracted; up to £100,000 additional work projected (total project development costs: not exceeding £500,000).
Why is UK support required? The challenge Developing countries face the dual challenge of climate change and limited access to energy /other resource scarcity (e.g. water). Both have significant negative impacts on the poor populations of those countries. Neither challenge can be addressed with public finance alone. In addition to other interventions, private finance must be leveraged through a strategic use of public resources if we are to achieve the necessary climate mitigation and adaptation investments, as well as facilitate increased access to clean energy for business and households and therefore help countries join the low carbon, climate resilient development path. Private finance is also key to delivering substantial developmental benefits, including a stronger financial environment, competitiveness and job creation.
The goal
This project aims to use a public-private partnership structure to increase the role of private sector finance in driving low carbon, climate resilient growth in developing countries. Specifically it aims to increase the amount of funding in Private Equity (PE) in the climate friendly space by directly funding PE Funds (who in turn fund sub funds and projects which would therefore be able to conclude their investments). More importantly it will have a “demonstration effect”, showing that PE climate investment (and climate projects in general) projects have good financial risk and return, thereby making the climate friendly market grow faster. Simultaneously it will stimulate low carbon sustainable growth in developing countries. There have been numerous smaller projects involving public-private collaboration that aimed to have some demonstration effect at a project or individual fund level. Their aim is to show that climate investments in developing countries are viable but none of these projects have had the scale effect to really drive and accelerate the whole climate sector into developing countries. Therefore this project needs to be at sufficient scale and designed in a way that promises the returns. Investment by the UK Government as an anchor investor at appropriate scale, would provide have a “signalling effect”, bringing on board other donors and then other investors in the CP3 Platform such as

potentially sovereign wealth funds or pension fund investors. Such additional investors will look to the size of the initial investment. Structuring the funds in a commercial manner is also key. The funds must be run on a commercial basis (with no public sector interference in decision-making) and avoid being perceived as being too developmental in nature because of the risk of otherwise deterring private sector investors who are looking for good financial returns.
Strategic fit with the International Climate Fund (ICF)
In the international conference in Cancun in December 2010 Developed Country Governments collectively endorsed a statement to mobilise an additional $100 billion per annum by 2020 for climate change mitigation and adaptation projects in developing countries. The source of the $100bn can be both public and private. Thus the UK Government has committed £2.9 bn for the period 2011/12 – 2014/15 as part of the International Climate Fund (ICF). All of this will be spent as Official Development Aid (ODA). This Public Private Partnership project is being funded through the ICF. This project fits with the strategy of the ICF which has emphasises private finance and public-private partnerships. More detail on ICF strategy is included in paragraphs 84 and 85 below in the Strategic Case section of this Business Case.
Structure
The CP3 Platform will comprise three vehicles:
The CP3 (Asia) Fund: this will be a large-scale fund which will invest directly into large-scale projects, although some of its financing will also be accessible to investee funds (which, in turn, will invest in low carbon, climate resilient infrastructure and/or companies active in those sectors). The CP3 Asia Fund will focus on Asia and will be managed by a private sector fund manager.
The IFC Catalyst Fund (CF): this will be a smaller-scale private equity fund of funds with a global focus. CF will focus on putting in place the PE financial infrastructure needed to help ensure that low carbon climate resilient investments can be generated in countries and sectors where such financial infrastructure might be currently underdeveloped. In particular, CF, which will be managed by the IFC Asset Management Company, a wholly owned subsidiary of the International Finance Corporation (IFC), will focus on experienced and emerging fund managers (including approximately 50% first-time PE fund managers) who, in many cases, would have difficulty raising capital without the expertise, discipline and seed capital that CF (drawing on IFC resources) is expected to provide. The scope of CF is broad and the fund is expected to support PE funds investing in a range of companies and infrastructure projects in the climate space, including renewable energy/energy efficiency (RE/EE) and technology commercialization opportunities with the potential to improve the competitiveness of RE/EE solutions in the medium term.
Technical Assistance and Project Development Facility (TAPDF): this will be the only concessional element of the Platform. The TAPDF will be opened as a new window in the Private Infrastructure Development Group (PIDG1) and will help with fund and project development for the CP3 Platform. Its focus will be on lower income countries or first-time projects in a country where there is a market failure or first-mover disadvantage justifying the subsidy (see paragraphs 65 to 68 below for more information).
1 Since this Business Case was written the PIDG has indicated that it does not wish to carry out this task and so most likely the Technical Assistance will be given directly to AsDB and IFC’s Technical assistance teams.

The UK Role
There is a fundamental role for UK financing in the CP3 Platform:
The UK Government’s participation as an equity investor, even on commercial and pari passu terms (see paragraphs 50 and 51 below for more explanation on this), will help accelerate movement of money into the developing country climate investment area and reduce perceived and actual investor risks. First, if the UK takes a significant enough stake in the CP3 Platform this will send a signal about the overall potential scale and scope of the platform to other donors but most importantly to private sector investors. Second private investor feedback has suggested that the UK’s role as an “honest broker”, its relationships with local governments and potential ability to enter into dialogue with them, as well as its expertise in working with multilateral investment banks, helps mobilise additional capital.
By demonstrating a workable public-private partnership, the CP3 Platform will set a replicable precedent for cooperation between private and public sectors in climate finance. Given that the size of global pension assets is estimated to have stood at $29.5 trillion at the end of 2009i, there is potential for unlocking a key source of financing for low carbon development via the Platform. The CP3 platform is expected to help break the chicken and egg problem whereby PE funds in the climate space do not have enough investment track record so as to attract institutional investors, and cannot develop the requisite investment track record without capital from investors to get started (see paragraphs 33 to 39 below).
By participating in the Platform, the UK Government will be able to some degree to influence the general investment strategies of both Funds. The UK, will ensure stringent monitoring and evaluation criteria are included and that the best practice environmental and social standards are mainstreamed into developing country PE industry.
The UK will be showing international leadership in leveraging private finance. Other potential public financiers have expressed strong interest in investing in the CP3 Platform to date, but are looking to the UK to provide the lead and have not formally committed.
What are the expected results?
Based on our the assumptions explained in this BC, the two projects together would realise the following:-
At least £ 6 bn of additional public and private and MDB equity finance mobilised (at Fund of Funds level and individual project level), including driving at least £5.9bn of additional private sector finance to what otherwise it is estimated would have entered the sector without this intervention (the “business as usual scenario - BAU”).
At least 265m tonnes of CO2e avoided over the lifetime of the projects in which the fund has invested (130m tonnes additional to what otherwise would have been saved in BAU);

At least 6.9m GW of low carbon energy infrastructure deployed (3.4m GW additional to BAU);
Up to 237, 684 GWh of energy saved through renewable energy and energy efficiency investments (117,179 GWh additional to BAU);
Estimated 40,000 new jobs created in climate change relevant industries (some of these may displace other jobs and might have been created in BAU);
At least 15 PE funds (including 8 first-time) private equity funds focused on climate business;
All CP3 project funds compliant with state of the art Environmental Social and Governance Standards (ESG).
Mainstreaming ESG into climate friendly investments;
Additional environmental (including CO2 savings) and social benefits from forestry and adaptation projects (not modelled due to the complexity);
Environmental and energy savings from financing innovation and deployment of new climate technology (not modelled due to the complexity).
All the above figures are estimates based on the Economic Case financial model (for more detail see Section C Appraisal Table A below). This model assumes a hypothetical portfolio of investments and thus the results may be higher or lower in practice due to the inherent uncertainty in the investment choice and the lack of clarity on technology efficiencies and costs.
The figures assume in particular that both of the two funds reach second close and achieve their respective target sizesCF. Several sensitivity analyses have been run, including smaller fund sizes (comprising almost entirely public money) –see separate excel/financial economics case sheet. In this situation, the analysis shows that the project still results in a positive benefit to cost ratio and the welfare benefits would be the following:-
102m tonnes of CO2e avoided over the lifetime of the projects in which the fund has invested (over 55,500 tonnes additional to what otherwise would have been saved in BAU);
586 MW of low carbon energy infrastructure deployed;
Up to 98,633 GWh of energy saved through renewable energy and energy efficiency investments (53,481 GWh additional to BAU);
The full effects of the sensitivity analysis on the figures can be seen in Table C below in the Economic Case section.
To note that the above figures do not include additional investments from financial reflows from the funds.

Assumptions - sufficient private and public sector partners will invest in CP3 and CF to get to
financial close - minimum fund sizes in the model (using the basic and not the small fund model)
- investments will be broadly similar to the financial /economic case of hypothetical investments and the %age of investments which do not deliver economic benefits are 10%
- investments will deliver adequate financial returns to meet private sector demands - market will follow track records and returns with additional investments - sufficient free capital flows in pensions to follow returns and more attractive destinations
for investments do not evolve - developing countries comply in providing appropriate investments and improving the
regime for investments Above is the Theory of Change for CP3 Project (i.e. the aims of the Project)
Speed up private sector investment in climate in developing countries via large financial influx, accelerating projects, deals and new PE funds. Signal and demonstration effect for private sector. TA – removes risks of first mover disadvantage and other market failures especially in LICs
£6.7bn extra estimated private flows into climate finance in Dev countries
Additional private sector finance into developing countries climate projects
Developing countries pursue a climate resilient low carbon development path resulting in growth, poverty reduction and climate change mitigation
Grant Technical Assistance 20mn
UK Gov Equity Investment £110mn + UK expertise in working with MDBs
Inputs Process Outputs Outcome (Purpose)
Impact (Goal)
Fund manager/ expertise in raising capital, sourcing deals or new funds
Dev country climate projects routinely invested in by pensions, foundations etc
Funds perform well in indices
>15 climate funds, with 50% first time fund managers
New technology investments
265m Co2 savings
180 new upstream and downstream climate projects ESG standards
mainstreamed
6.96 GW Installed new clean energy
MDB local country country and ESG knowledge
All funds with ESG standards
INFLUENCE 45%
PEOPLE -10%
40,000 new jobs
237,684 Energy saved
ENVIRONMENT 45%
Energy Access for the Poor

Strategic Case I. Background and rationale for intervention:
1. According to the renowned study of Climate Change, The Stern Review, “the scientific evidence is overwhelming: climate change is a serious global threat, and it demands a global response”ii. Action against climate change requires a two-pronged approach: on the one hand, mitigation through investment into low-carbon development, including sustainable energy sources; on the other hand, adaptation to the inevitable effects of climate change. The discussion below details the potential challenges and opportunities faced by the developing countries in the context of climate change.
Climate mitigation
2. Asian countries are among the fastest-growing emitters of greenhouse gases (GHG) in the world. Non-OECD Asia shows the most robust energy consumption growth in all non-OECD regions, with energy consumption projected to more than double from 2006 and 2030. China and India together accounted for about 10% of the world’s total energy consumption in 1990; by 2030 they are projected to account for just under 30% of world energy consumption. As a result of population growth, urbanization, increased energy consumption and transportation as well as deforestation and land use change, Asia’s share of GHG emissions worldwide increased from less than 9% in 1973 to 24% in 2003, and is projected to increase to 29% by 2030. China, India and Indonesia stand out as the most populous and resource consuming nations in Asia with both the greatest environmental impact and rates of economic growth. China, which surpassed the US as the world’s largest producer of GHG in 2007, will be responsible for 39% of the worldwide increase in GHG emissions between 2004 and 2030iii. A recent World Bank report expects developing Asia to require USD 80bn per annum of incremental investment in clean energy in the next two decades if the mitigation challenge is to be metiv.
3. At the same time, the potential for low carbon development in Asia is significant. The World Bank estimates that low carbon technologies could meet half of East Asia’s power demand by 2030, with examples of key opportunities including hydropower, wind and biomass in China; solar in India; hydro, biomass and geo-thermal in Indonesia; and geothermal and hydro in the Philippinesv. Moreover, energy efficiency has been identified as a major opportunity in India and China, with India naming “enhanced energy efficiency” as one of the principal means of mitigating the impacts of climate change in its National Action Plan on Climate Changevi. Energy efficiency will also improve Asia’s competitiveness. Sustainable transportation, built environment, forestry and land use change stand out as other key areas of potential focusvii. Thus, CP3 will help Asia find the energy supply to power growth in the medium term.
4. While being the fastest-growing emitter of greenhouse gases, Asia is not alone among the developing countries in facing the mitigation challenge. For example, the African continent as a whole accounts for less than 4% of the world’s total GHG emissions and the highest level of energy povertyviii. However, the region is entering a period of rapid growth in both economic output and population. Both of these will create significant demand for new energy infrastructure. The region enjoys an abundance of renewable energy sources, and therefore there is a considerable opportunity to place Africa on a low carbon, climate resilient development and growth path which would help it avoid carbon lock-in, increase access to clean, sustainable energy, combat deforestation (notably, six of the ten largest forest losses are in sub-Saharan Africaix) and improve agricultural practices. According to Grantham Institute, incremental financing required for abatement opportunities in Africa around 2015 could be in the order of $9–12 billion per year, including $5–6 billion per year for forestry, $2–4 billion per year for agriculture, and $2 billion per year for the energy sectorx.The key opportunities in Africa include hydro and solar renewable power, substituting non-sustainable fuel wood with sustainable sources, as well as implementing energy efficiency programmes. Similarly, while currently accounting for only approximately 12% of the global emissions, Latin America’s energy demand is projected to double by 2030xi, and the IEA

forecasts that its per capita energy-related emissions will grow by 33% during 2005-2030xii, with almost 50% of this coming from land use change, including deforestation. Again, however, the challenge is coupled with significant investment opportunities helping to avoid carbon lock-in, including in the forestry sector, energy efficiency, transportation, biofuels and wastexiii but still permit growth
5. Further, analysis of the Marginal Abatement Cost Curve (MACC) (which demonstrates cost/benefit of different types of low carbon technologies/investments) for several developing regions of the world indicates that there are potentially financially viable opportunities for GHG mitigation which are not being exploited, particularly in the case of some types of Renewable Energy (RE) and Energy Efficiency (EE) technologies. This suggests that new business models and approaches are required. PE funds should be well-suited to creating new approaches so as to exploit such opportunities.
Climate adaptation
6. According to the Asian Development Bank (AsDB)xiv, climate change impacts threaten to stall economic development in Asia and the Pacific, and endanger the health and safety of its population. Nowhere in the world are as many people affected by climate change as in Asia and the Pacific. Climate change poses serious risks to the economic growth of all of the developing Asia. However, predicted impacts are more severe for certain regions and countries. Drylands of the Himalayas, Central and West Asia, and southern India are likely to experience changes in rainfall, raising concerns about agricultural production and food security; World Bank (WB) research predicts that poverty in India will be 3-4 percentage points higher than it would otherwise be in 2040 on account of the impact of climate change on agriculture and food processxv. For the last decade, Bangladesh, India, the Philippines and Vietnam have topped the list of countries facing serious climate risks, and cumulative losses as a result of natural disasters have averaged nearly $20 billion over the same period. The cumulative impacts of climate change over the next two or three decades have the potential to reverse much of the progress made towards attainment of the Millennium Development Goalsxvi.The AsDB warnsxvii that the total economic cost of climate change threats could be equivalent to an annual loss of between 6% and 7% of these countries’ GDPs by the end of the century.
7 At the same time, climate adaptation presents potential investment opportunities, including in
climate-resilient crops, sustainable buildings and water infrastructurexviii. For example, the Asia Pacific region has the lowest per capita availability of fresh water in the world, with approximately half of the Asia Pacific region’s population living with severe water stress. China, which is projected to represent 40% of the world’s demand growth, currently has more than 300 million people without access to clean water – a problem that is likely to be severely compounded by climate change. Investment into water infrastructure (including desalination plants), therefore, represents a significant business opportunityxix.
8. Again, climate adaptation is by no means restricted to developing Asia. Africa is highly vulnerable
to climate change with the areas of particular concern being water resources, agriculture, health, ecosystems and biodiversity, forestry and coastal zones. According to the Intergovernmental Panel for Climate Change (IPCC), the cost of adaptation in Africa could be as high as 5 to 10% of the continent’s GDPxx. For example, a decline in rain-patterns could result in a decline in agricultural production of up to 50% by 2020 in some parts of the region, leading to exacerbated malnutrition. Climate models also show that between 75 and 250m people are projected to be exposed to an increase of water stress due to climate change by 2020xxi. Health affects will include a rise in cholera and malaria – factors superimposed upon existing weak health systemsxxii. Again, as in the case of developing Asia, adaptation also offers investment opportunities. For example, Grantham Institute identifies water investments as one of the key priorities for the African continent, improving lives of

the poor while at the same time tackling adaptationxxiii. In the case of Latin America, climate vulnerability stems from melting of the glaciers, increased incidence of catastrophic weather events and impacted livelihoods through loss of ecosystem services. This is expected to result in a negative effect to the region’s GDP of up to 18.2% by 2050, with could increase poverty by up to 3.2% (and as high as 40% in parts of Brazil)xxiv. This again points to an increased investment potential in climate resilient infrastructure; one study, for example, identifies water markets and insurance markets as being among the key growth opportunities in Latin Americaxxv.
9. In addition to climate mitigation and adaptation, a growing development concern in both developing
Asia and Africa is posed by energy access and energy security. The Asia-Pacific region is particularly vulnerable to fluctuations in energy prices, as the majority of its countries have high energy intensity and are net importers of fossil fuels; as is the case with climate change, this situation often hurts the poor the most, as energy price spikes have far-reaching effects on livelihoodsxxvi. Moreover, more than 44% of households in India do not have access to modern electricityxxvii, which exposes the poor to the dual challenge of climate change and lack of access. Similarly, more than 550 million Africans lack access to electricity, with electricity access in sub-Saharan Africa standing at less than 25%xxviii. A lack of a steady electricity supply and power outages have substantial effects on businesses and are a deterrent to foreign investors. Better energy supplies will encourage business growth and related jobs and tax revenue. A focus on investing in renewable and sustainable electricity, therefore, has the potential to contribute not only towards combating climate change, but can also increase and improve energy access for the poor. It should be emphasized however that the focus of the CP3 Platform is not energy access or energy security and there are other ICF programmes working on this area (see paragraph 85 ff) but as part of the Evaluation and Monitoring programme (see Evaluation case near end of document) we will look at the degree to which the CP3 Platform/Project has contributed in these two areas.
10. In summary, therefore, there is a strong case for working with the developing countries to secure sustainable energy for their growth and mitigate climate change, building climate-resilient infrastructure, and enhancing energy security and access via improvements in the availability and affordability of low-carbon and environmentally friendly technologies and infrastructure. Such concerted action can achieve not only reduced GHG emissions, but also help protect the most vulnerable from the adverse effects of climate change, provide poor households with access to electricity and improve availability of safe drinking water.
Climate investment needs and opportunities: the role of the private sector 11. While the case for focusing on low carbon, climate resilient development is strong, the level of
investment required to meet the climate challenge and make the most of its investment opportunities is substantial. The International Energy Agency (IEA) estimates, for example, that by 2020 US$197 billion of additional capital investments will be required in developing and emerging economies per annum if we are to meet a 2°C above pre-industrial levels climate change goalxxix.
12. The private sector will be key to meeting this challenge. It already accounts for approximately 86% of all low carbon investmentsxxx, contributing approximately 78% and 77% of total investments in renewable energy and energy efficiency in the developing countries respectivelyxxxi. In addition to playing a pivotal role in climate financing, private investment generates important developmental benefits, including ones that are not dependent on the source of financing (namely, jobs, reduced emissions, enhanced access to energy) and ones that are ascribable exclusively to the private sector (such as consolidation of the financial sector, business know-how transfer etc).xxxii Moreover, the scale of private finance that could potentially be unlocked for climate-related investments is substantial: for example, size of global pension assets is estimated to have stood at $29.5 trillion at the end of 2009xxxiii; while only a small fraction is likely to be made available for low carbon or adaptation investments, this nevertheless represents a sizeable opportunity.
13. The EU (in its Ecofin document dated 20 October 2011), the UNDP Catalysing Climate Finance,

UNEP and most recently the more than 40 countries participating in the Green Fund Transition Committee paper (endorsed at the Durban COP 17) recognised the critical role of private finance for developing countries and that the public sector may play a strategic catalytic role.
Why Private Equity and why not other finance instruments such as debt? 14. This project does not aim at being “ all encompassing “ or addressing all the issues in climate change
finance affecting the private sector. There are other UK Government and donor projects focussing on other areas of private finance. including providing targeted public project finance (Public Infrastructure Development Group and Climate Investment Funds), debt (US Government Overseas Private Investment Corporation - OPIC and Multi-lateral Development Banks - MDBs) or which provide guarantees (OPIC, World Bank) or which support carbon credits or aim to improve the investment climate (via feed-in tariffs or other investment incentives) . Although there is some scope for debt financing by the CP3 fund, this project focusses primarily on private equity funds. Why is that?
15. In practice equity is one piece of a jigsaw to get a project to financial close. There are big players such as OPIC (the US Government Development financial institution) and the MDBs as well as large scale international banks who are very active in the debt market and in some instances they legally cannot participate in equity which is generally riskier.
16. In 2010 DFID held meetings with the P8 pension fund investors. They and OPIC that showed that there was more need to stimulate and participate in equity. Various commentators on this Business Case raised concerns about the lack of debt finance in climate. This is certainly an issue in Europe but both is seemingly less of an issue outside of Europe (AsDB emphasized that Asian banks are not overleveraged and were ready to provide debt but lacked expertise to put deals together). AsDB and IFC both explained they already had or were planning climate investment debt facilties. Most of ADB’s investments to date have been debt. Its clean energy investment target is $2 billion by 2013. In 2010 the amount disbursed comprised grants of US$ 162 m, debt: US$ 1535 m and equity: US$ 70 m (which AsDB note was below average). AsDB has also reported that debt is readily available via Chinese banks for China investments and that primarily they lack skill in deal structuring and technology. The total amount of debt provided by IFC to climate projects (i.e. meeting the IFC’s climate definition) in FY2011 amounted to $2.55 billion (about 25% of IFC’s total debt investments), the climate change component of these loans amounts to $1.3 billion.
17. Equity capital is the cornerstone form of capital for any private business. Without equity capital, other forms of capital (such as debt, asset finance, insurance, trade finance and guarantees) cannot be accessed. For smaller companies and projects at an earlier stage of development and in developing countries sources accessing listed equities is not feasible.
18. For example, according to IFC, Global Green Power, a bio-energy company in the Philippines, needed $60 million to establish biomass power plants. Banks were willing to lend $44 million. However, banks would only lend if the company could raise $16 million in equity to absorb the business plan losses to get the product to a feasibility stage. Until Global Green Power attracts this outside equity investment, its innovative, carbon-mitigating plan cannot be implemented. This risk-bearing cushion of equity is particularly important in developing countries. For example, in developed markets, banks are often willing to finance wind farms with a debt-equity ratio of 90:10 (nine parts debt finance to one part equity). In developing countries the comparable figure is often far lower. For example, in Vietnam banks typically will only finance on a debt-equity ratio of 50:50 (one part debt finance to one part equity), and in some other countries a debt-equity ratio of 70:30 is the norm.
19. Private equity (PE) is one form of equity. In turn, venture capital is one part of PE. PE plays a particular role in relation to market development. It is normally raised and accessed through a fund structure: PE funds raise money from investments (pension funds, foundations, sovereign wealth funds, insurance companies etc) in order to generate investment returns via ownership stakes in companies and projectsxxxiv. From the investee businesses’ perspective, therefore, PE the starting
point in the financing chain.
20. PE plays a unique role in high risk areas because debt financiers are much more cautious. Debt providers usually require much more certain returns within a set timeframe and collateral, usually in a tangible form. This works for some infrastructure projects but not so easily for cleantech or other investments or projects with high upfront research or regulatory/permitting costs which is the case with new clean power projects. PE often cannot work without debt and relies on the leveraging of debt to increase its returns but PE plays a key role in market development. Debt may have long grace periods before the interest rate is paid back but rarely as long as the 4 or even 5 years that it takes for energy, cleantech or forestry investments. Of course for these reasons, that PE is riskier, PE financing is often more expensive and therefore it is used sometimes where there is no alternative.
21. Many innovative renewable projects are developed by independent project developers—individuals and small firms who specialize in spotting new project opportunities. As Figure 1 illustrates, these independent developers are able to finance the early stage of projects, but struggle to finance mid-stage to late-stage project development.
22. Lenders (both mezzanine and senior debt providers) are generally willing to finance much of the construction costs, once all permits and contracts have been finalized. However, it can cost millions of dollars to get through the late stage development process of getting all the approvals to use the site and the renewable resources, and negotiating a long term contract to sell the power. Some PE funds—such as InfraCo Asia which is supported by the PIDG—are willing to take on this risk, and thus get the renewable projects across the line and into the stage where more conventional capital will flow to finance the project.xxxv
24. VC funds have contributed to the development of solar lantern companies such as Dlight which received financing from the Acumen Fund, Gray Matters Capital, Nexus Venture Partners, Draper Fisher Jurveston, and Garage. This financing enabled d.light to sell more than 250,000 lamps by 2010 and the company hopes to provide lighting to 50 million people by 2015.xxxvi
25. PE/VC funds are supporting a company with the name “better place” that is pioneering the roll out of battery service stations where electric vehicles can swap drained batteries for a recharged battery in much the same way that a car fills up with gasoline. This infrastructure allows electric vehicles to achieve the same range and convenience as conventional fossil fuel powered vehiclesxxxvii.
26. PE/VC funds expend a lot of resources finding companies that are in need of their capital and assistance. Fund managers then work with promising companies to refine their strategies, business plans, and management teams to turn rough projects into viable ones. PE/VC is almost unique in this regard. Banks and stock exchanges tend to be more passive, waiting for firms in need of capital to come to them, and expecting the companies to develop sound plans on their own before they will invest. For this reason by the UK Government investing in PE it will drive new projects more rapidly than just providing debt. PE funds create whole new networks of players and in turn stimulate entrepreneurs to go into and stay in a particular area such as climate, creating a virtuous circle.

Figure 1 PE/VC Funds Financing of Projects by Independent Developers
Source: SDCL and UNEP. - Sustainable Development Capital (http://www.sdcapital.co.uk/) and Duncan Ritchie and Eric Usher,
2011 "Mind the Gap, Addressing the lack of early stage financing for low-carbon infrastructure in developing countries" UNEP
The State of the Climate PE market in Developing countries 27. The PE market has grown rapidly from a few deals in climate in 2000 to $20billion today but most of
this growth has been in developed countries – with 50% in UK and US alone. See the heat map below. Of the developing countries, 83% of investments are in India and China.
Number of Climate Friendly Deals Closed by PE/VC funds between 2000 and 2010 by Geography
Source: the Payne Firm – from IFC October 2011 Climate Friendly investment Market – assessing the opportunity for Private Equity and
Venture Capital Investors
No deals

Figure 3 Deal History in the Climate Friendly Investment Market, by Primary Industry
Source: Climate Friendly investment Market – assessing the opportunity for Private Equity and Venture Capital Investors – IFC Oct 2011
28. As can be seen most of the investments are in the energy area but IFC has noted that based on the trends from US and elsewhere there are potential opportunities in the technology arena which could have a beneficial, often dramatically beneficial effect on the poor.
29. With regard to energy, clean power plants are often considerably smaller than conventional fossil fuel plants. For instance, biomass plants tend to be less than 35MW. While geothermal plants’ sizes can vary greatly, some geothermal resources are best exploited by relatively small plants of 50MW or less.
30. Additionally, many of the clean power technologies are new, for instance wind and biomass generation use rapidly developing technology. Innovative geothermal plants are being developed as well. Given the scale and the relative novelty of the technologies, smaller developers can be expected to play an important role. These small developers will need to be backed with capital and expertise if they are to get through their start up phases and into full production.32. According to IFC

there is already considerable investment in clean energy by private equity funds. For instance, Berkeley Capital has raised $74.12 million for its Renewable Energy Asia Fund (REAF). The fund will focus on investing in small hydro, wind, solar power, and biomass in India and other developing countries in Asiaxxxviii.
31. Still, the investment need is greater than the current private equity activity and less than the climate change sector needs. Project developers report to IFC that an absence of third party financing is holding back investment. An example is asiaBIOGAS, a developer with experience developing a range of biogas technologies in South East Asia. Despite its experience and technical credentials, it has found that an absence of third party equity financing has constrained its ability to develop projects. asiaBIOGAS does not have enough retained earnings to provide the development equity itself. Without this equity, banks will not provide debt. As a result asiaBIOGAS needs third party equity, something the firm is struggling to access. There is also considerable scope for viable VC intervention in energy efficiency, forestry, and transport.
Both fund managers (IFC and AsDB/Credit Suisse) have confirmed that they have adequate dealflow and have pointed to a pipeline of potential projects.
Climate Investment – the role of public investment
32. The Climate Finance market is growing and will continue to grow, even in developing countries. The issue is that growth is not fast enough in developing countries to enable them to develop sustainable energy systems/supply to address the 2 degree problem in time and provide the finance necessary to avoid locking developing countries into a high carbon path. By the time the finance came to the developing countries they would already have often built infrastructure which is not climate friendly. The rationale for public intervention is to accelerate the growth in the climate PE market in developing countries. Market Failures
33. In order for the climate finance market in developing countries to grow faster the market failure issues need to be addressed or overcome. These have been identified by IFC and UK Government as being information asymmetries, agency problems, newness, and coordination problems.
34 Information asymmetries and agency problems plague capital markets generally. Investors are looking for returns at least commensurate with the risks involved. The firms seeking investment generally have better information about their likely future performance and risk than the investors. But firms also have incentives to overstate likely performance, and understate risks. The investor is left in the unfortunate position of knowing that the firm has the best information (an information asymmetry), but also not feeling fully able to trust what the firm says (an agency problem).
35. In climate the issues are compounded by widespread publicity around investment failures and regulatory problems even in developed countries such as removal of solar feed-in tariffs in Spain, failures of key companies in the US like Solyndra. There is more publicity give to failure than success and this further deters investors (information asymmetry).
36. The problems are worse in the PE market for those investors (known as Limited Partners or LPs)
placing funds with a fund manager. The LP, but in particular cautious pension fund mangers, want a fund manager with the expertise to make higher returns. Many would-be fund managers will say they are experts and can generate high returns. The LP finds it difficult to validate the would-be manager’s claims of expertise (an information asymmetry), but is not able to simply take the claims at face value (because of the agency problem).

37. To offset information asymmetries and agency problems, investors use information on track records of fund managers and average performance in a sector. Performance indices and rankings are produced by independent companies. By definition, in a new area, track records and history are lacking. Reputations and networks are being newly made. As a result, in a new area like climate friendly investing in emerging markets, where managers lack track records, LPs can find it almost impossible to tell who to invest with. Rather than risk placing money with someone who “talks the talk but cannot walk the walk”, LPs may not invest in such a sector at all. This is particularly the case with pension funds – they would rather wait until a sector matures and becomes safer. The situation can be compounded in a downturn/nervous market such as that experienced in Autumn 2008 to early 2009 and July 2011-Autumn 2011. In such markets investors’ concerns are exacerbated, often excessively and there is a herding instinct to safer investments.
38. The problem of agency and information asymmetry and resulting slow growth is not unique to climate but applies to other developing sectors such as nanotechnology or biotech investments. Many investors and as a result the brighter fund managers eschew these areas too in favour of areas where there are longer track records and often pursue faster and higher returns like technology and internet funds – tech funds.
39. Coordination problems, too, put grit in the cogs market development. To get deals done, many actors need to come together. Project developers need to bring in outside equity. Debt finance needs to be forthcoming. The equity investors, the lenders, the project developer, and entrepreneurs all need to know how to find each other, and work together. In well developed markets, each niche in the investment eco-system is filled. Information and social networks allow the players to find each other. Precedents and competition provide a guide as to how value can be divided between the parties, reducing time-wasted in zero-sum negotiations. New investment areas have none of these advantages. For example the first PE fund investing in larger-scale biomass generation in Bangladesh will not find lenders accustomed to financing biomass plants there. Similarly the legal precedents governing the respective rights of senior and junior lenders in Energy Service Companies in the Philippines do not yet exist. The aim of this platform is to drive and support the first instances of such projects, making follow-on projects much easier.
Figure 4: Development dynamics of the PE/VC market
Source: IFC Barriers to development in Climate Friendly Investing November 2011
40. The above market failures:
Slow the rate at which competent people coalesce into fund management teams Slow the rate at which fund managers can raise capital for the fund Diminish the ability of the fund to deploy capital profitably.xxxix Deter fund managers from entering the climate market or a developing country as it is too
difficult and the upfront costs of travel and research/presentation are significant for fund managers to front while they raise capital. These fund managers choose instead to work with an easier market or country.
41. IFC’s reportxl notes that paradoxically, while the need for new fund managers is greatest in new areas, new areas may also be the hardest for managers to establish themselves in. Fund raising cycles in developing countries in climate are longer than in other parts of the PE/VC market. IFC notes that MAP Capital has been fund-raising for more than four years, despite having an experienced team, and a commitment from OPICxli. Many new teams may be capital constrained. Therefore it will be difficult for them to sustain the expenses, and the long periods without income, that raising a fund entails.
42. These market failures interact. If deployment was easier, LPs would be quicker to commit capital to funds. If fund-raising was quicker, more teams would set out to become fund managers. For now, these factors together combine to limit development of the market to below its potential.
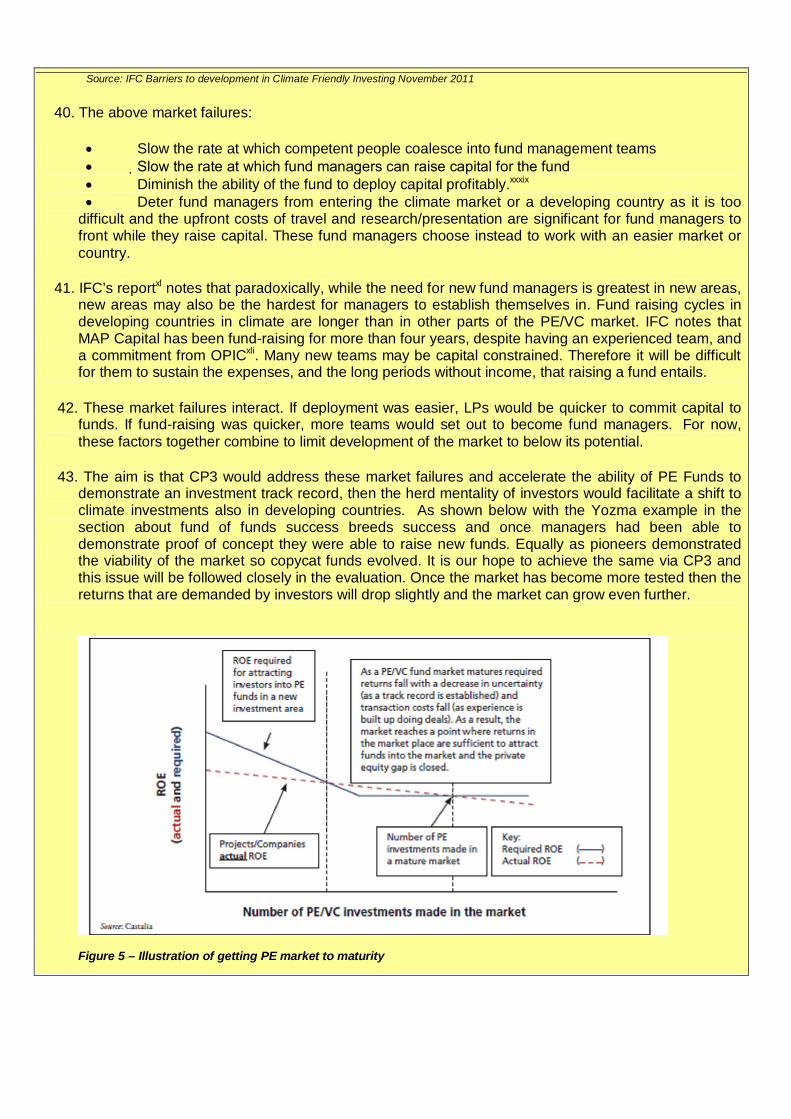
43. The aim is that CP3 would address these market failures and accelerate the ability of PE Funds to demonstrate an investment track record, then the herd mentality of investors would facilitate a shift to climate investments also in developing countries. As shown below with the Yozma example in the section about fund of funds success breeds success and once managers had been able to demonstrate proof of concept they were able to raise new funds. Equally as pioneers demonstrated the viability of the market so copycat funds evolved. It is our hope to achieve the same via CP3 and this issue will be followed closely in the evaluation. Once the market has become more tested then the returns that are demanded by investors will drop slightly and the market can grow even further.
Figure 5 – Illustration of getting PE market to maturity
IFC report : Barriers to Development in Climate Friendly investing – November 2011 (with permission)
What is the background or track record of the public sector supporting PE/Funds?
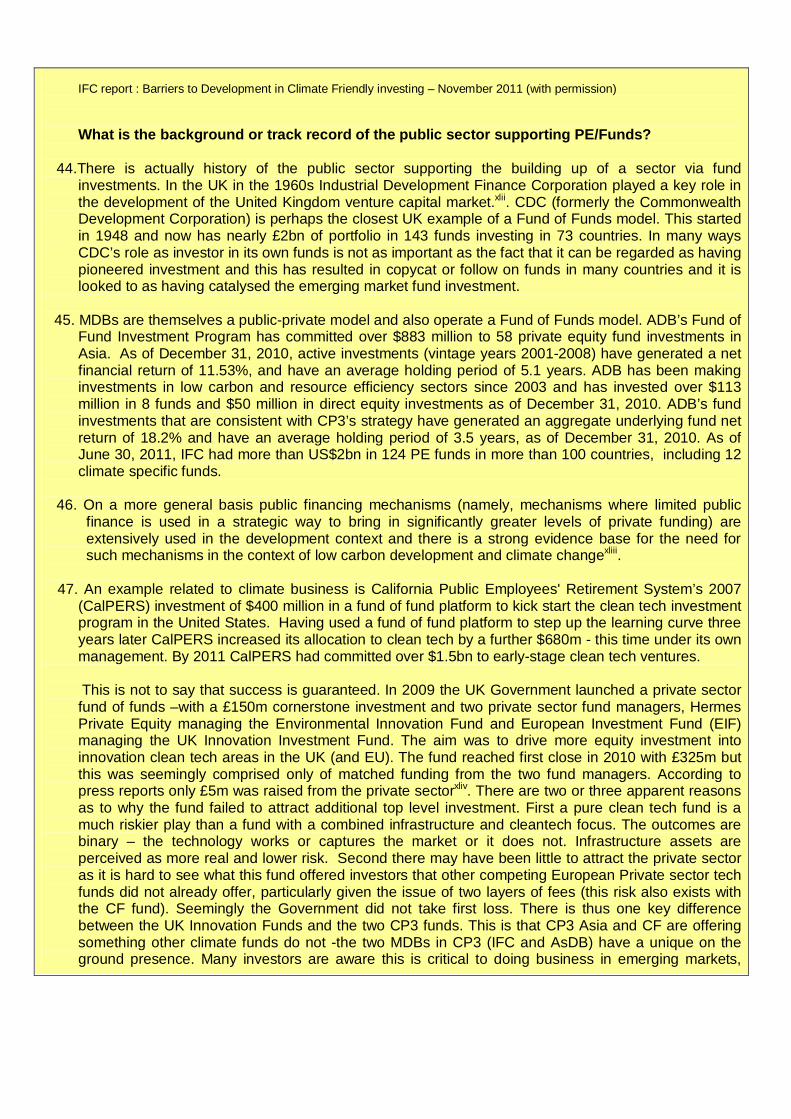
44.There is actually history of the public sector supporting the building up of a sector via fund
investments. In the UK in the 1960s Industrial Development Finance Corporation played a key role in the development of the United Kingdom venture capital market.xlii. CDC (formerly the Commonwealth Development Corporation) is perhaps the closest UK example of a Fund of Funds model. This started in 1948 and now has nearly £2bn of portfolio in 143 funds investing in 73 countries. In many ways CDC’s role as investor in its own funds is not as important as the fact that it can be regarded as having pioneered investment and this has resulted in copycat or follow on funds in many countries and it is looked to as having catalysed the emerging market fund investment.
45. MDBs are themselves a public-private model and also operate a Fund of Funds model. ADB’s Fund of
Fund Investment Program has committed over $883 million to 58 private equity fund investments in Asia. As of December 31, 2010, active investments (vintage years 2001-2008) have generated a net financial return of 11.53%, and have an average holding period of 5.1 years. ADB has been making investments in low carbon and resource efficiency sectors since 2003 and has invested over $113 million in 8 funds and $50 million in direct equity investments as of December 31, 2010. ADB’s fund investments that are consistent with CP3’s strategy have generated an aggregate underlying fund net return of 18.2% and have an average holding period of 3.5 years, as of December 31, 2010. As of June 30, 2011, IFC had more than US$2bn in 124 PE funds in more than 100 countries, including 12 climate specific funds.
46. On a more general basis public financing mechanisms (namely, mechanisms where limited public
finance is used in a strategic way to bring in significantly greater levels of private funding) are extensively used in the development context and there is a strong evidence base for the need for such mechanisms in the context of low carbon development and climate changexliii.
47. An example related to climate business is California Public Employees' Retirement System’s 2007
(CalPERS) investment of $400 million in a fund of fund platform to kick start the clean tech investment program in the United States. Having used a fund of fund platform to step up the learning curve three years later CalPERS increased its allocation to clean tech by a further $680m - this time under its own management. By 2011 CalPERS had committed over $1.5bn to early-stage clean tech ventures.
This is not to say that success is guaranteed. In 2009 the UK Government launched a private sector
fund of funds –with a £150m cornerstone investment and two private sector fund managers, Hermes Private Equity managing the Environmental Innovation Fund and European Investment Fund (EIF) managing the UK Innovation Investment Fund. The aim was to drive more equity investment into innovation clean tech areas in the UK (and EU). The fund reached first close in 2010 with £325m but this was seemingly comprised only of matched funding from the two fund managers. According to press reports only £5m was raised from the private sectorxliv. There are two or three apparent reasons as to why the fund failed to attract additional top level investment. First a pure clean tech fund is a much riskier play than a fund with a combined infrastructure and cleantech focus. The outcomes are binary – the technology works or captures the market or it does not. Infrastructure assets are perceived as more real and lower risk. Second there may have been little to attract the private sector as it is hard to see what this fund offered investors that other competing European Private sector tech funds did not already offer, particularly given the issue of two layers of fees (this risk also exists with the CF fund). Seemingly the Government did not take first loss. There is thus one key difference between the UK Innovation Funds and the two CP3 funds. This is that CP3 Asia and CF are offering something other climate funds do not -the two MDBs in CP3 (IFC and AsDB) have a unique on the ground presence. Many investors are aware this is critical to doing business in emerging markets,

particularly in the case of infrastructure. There is also less competition from other funds in the climate sector in emerging markets whereas with the Business Innovation Fund it would be competing with many private sector European tech funds.
Protections for public finance 48 According to the literature (see footnotexlv.above) the following key principles are central to the design
of the public financing mechanisms :
They must be aimed at overcoming specific market failures and resulting investment barriers;
Public subsidy must be limited to the minimum needed to unlock private finance;
They must crowd in – rather than crowd out or deter– the private sector; and
They must avoid market distortion through favouring specific market players.xlvi
Subsidy
49. In some interventions it might be appropriate for the public finance capital to be put fully at risk or even to be in grant form. This is the case where there are inadequate returns, perhaps because of the poverty of the consumers or significant investment barriers in very complex technology e.g. CCS, developing wind farms etc Public finance may be in a waterfall mechanism – protecting against downside risk, loss of carbon credits or reduction in the carbon price or the purchase price of a Power Purchase Agreement. It can even work to leverage upside risk.
50. After the extensive discussions with the private sector investors (see paragraph 52 below), the view
was taken that there was no need for any subordination of the UK equity investments in the funds, thus the UK Government is investing on equal terms (equal share of profits and losses and same fees) as other investors and the UK will suffer losses at the same times as the other investors at the top level in the two funds. This is referred to in the industry as a “pari passu” investment. This is possible because it is believed there are adequate commercial returns for the investors and indeed taking a first loss position might send the wrong signals to the private sector and risk oversubsidy. Indeed if the UK Government were to take first loss it might send the wrong signal to investors that this is a riskier investment than it actually is which would undermine the public policy purpose. The sole financial subsidy element in the Platform is the Technical Assistance Facility (see paragraph 68 below).
Consultation with private sector and running the fund on a commercial basis
51. The CP3 Platform was designed after extensive consultation with the public sector:-
(i) Round table discussion on how to “scale up” private investment in clean energy and low-carbon infrastructure in developing countries which was held in Hong Kong on 18 March 2010. ADB and DFID invited a number of private equity and fund-of-funds managers to discuss the suitability of the CP3 structure, assess the market’s depth, and understand lessons learned from previous comparable structures;
(ii) Extensive consultation process with leading LPs including the P8 Group, which was undertaken in April-May 2010. IFC, ADB and DFID met pension and sovereign wealth funds in Asia, US, and Europe to discuss market trends and possible CP3 structures;
(iii) The P80 Asia Summit for Climate & Investment, which was held on 16-18 June 2010 in Seoul, and which gathered a wider group of Asian institutional investors invited by ADB, DFID, and the P8 Group to discuss possible solutions for climate financing;
(iv) The P8 Summit held in Brussels, Belgium in February 2011 during which the P8 and other interested parties extensively discussed, and gave feedback on, the latest iterative ideas regarding a CP3 concept design.

52. One of the things that must be done in order not to crowd out or deter private finance is to run the
fund on a fully commercial basis. Private investors will only come in if it meets their risk and return criteria, their money will not be spent on bureaucracy or wasted with delays and there are managers with experience in the sector and with private funds. For this reason a private sector fund manager has been engaged with CP3 Asia and IFC AMC also works on a commercial basis. Both have some track records in climate finance in developing countries (even if their specific climate funds have not been ranked in known indices).The UK Government needs to be “hands off” in relation to the investment choice and management, decisions will be on a purely commercial basis. This approach is therefore different to that taken by GEREEF for example which is a fund of funds also investing in PE funds in emerging markets and which has failed to attract private finance at the top level. In GEREF, the investment committee includes members of the public sector which will not be the case with CP3 funds.
53. It is hoped that both CP3 Asia and CF will be able to raise other public finance and private finance at
the top fund level. Potential partners include other public donors – see table summary below, OPIC (the US investment fund), sovereign wealth funds and pension funds. The sovereign wealth fund sector is one which is increasingly investing in Private Equity. According to the funds research group Prequin 55% of such funds invested in PE in 2010 and 59% agreed to in 2011, and 47% invested in infrastructure in 2010 but 61% intended to do so in 2011.
54. Having said this, one of the risks (see Section E under the heading “Risks”) is that it is not possible to
raise private finance at the top fund of funds level in CP3 Asia or CF. Indeed if such private finance were easy to raise then it would suggest that the UK Government should not be entering the market as there would be no need to do so as it would already be fully functioning. The Sensitivity Analysis (Table C) in the Economic Section C also includes in Scenario 4 the results on the basis of a smaller fund comprising primarily public sector finance. The results are dramatically reduced and clearly the aim of this Platform would not have been realised if this is the case but the NPV and the Cost Benefit Analysis is still positive.
Size of Top Funds
55. The two fund sizes have been chosen by the fund managers after mapping the market, including
upcoming infrastructure investments in Asia the case of CP3 Asia and potential PE sub- funds that might get to closure in the case of CF. The fund sizes have taken into account the difficult financial markets as at November 2011 and thus the CP3 Asia fund has been reduced slightly. There is a cap of $5bn on the CP3 Asia fund because even if funds of more than this amount can be raised it is good practice for a fund manager to limit a fund size to what it believes is capable of ready and good investment- no fund manager wants amounts unspent (but subject to management fees) as this would damage the manager’s reputation with the investors.
Why the size of the UK equity investments?
56. The UK Government investment is sized in line with the investment that IFC and others typically take
in a fund. Other investors will be aware of the proportions and thus the UK investment sends a signal about the fund size. If the UK were to invest less then the fund size might be smaller and of course ADB and IFC would invest less (as they are matching the UK contributions). A smaller fund might be seen to be developmental and not a fully commercial fund.
Protecting the public sector concerns
57. At the same time as ensuring the fund is structured on a commercial basis and invests commercially, the risks to the public sector need to be taken into account (see also the Risks section E) . These include the UK Government’s reputational and environmental concerns. For this reason and others the Multilateral Development Banks are part of the structure as they are familiar dealing with these issues on the ground in developing countries. They have financed thousands of projects. As part of their project financing and when investing in funds they impose their Environmental Social and Governance requirements (ESG) on funds and projects and they subject the projects to extensive Environmental impact assessments (EIAs). http://www.ifc.org/ifcext/sustainability.nsf/Content/EnvSocStandards - IFC standards and http://beta.adb.org/documents/adb-environmental-assessment-guidelines - AsDB standards.
58. These EIAs are detailed reviews by independent expert third party consultants who are accredited by
the relevant MDB and they review things such as the impact of the project on the community, biodiversity and the environment. As a result of this MDB practice, project developers and fund managers are used to the MDB ESG standards and to reporting to the MDBs on ESG compliance. All fund managers financed by IFC must attend ESG training and will be monitored regularly on their compliance with ESG and compliance with anti-corruption standards as part of the CF fund. ADB will be verifying that the ESG standards are met with the CP3 Asia fund. Via its shareholding in the multilaterals, the UK Government (via DFID) has an ongoing influential role over the ESG standards of the two multilaterals.
59. Ideally any specific areas of concern for UK Government which are not addressed in the ESGs of the
MDBs should be set out upfront before the investment documents (Limited Partnership Agreement or LPA, etc) are subscribed to by the investors so that all the investors know any caveats or restrictions. The Climate and Environment Team in DFID noted a few redlines such as fossil fuel production (which the MDBs have confirmed will not be included) and it has noted its concern around forestry. A draft document on the definitions/scope of the two funds has been circulated and discussed with both IFC and AsDB and there are no material differences between the UK Government view and that of the two MDBs. As forestry investments have been identified as potentially having greater risk the UK Government has satisfied itself that the measures put in place by IFC (in accordance with its Performance Standards) are adequate to mitigate those risks. We will seek to ensure that forestry experts in the UK Government have an opportunity to review and suggest additional safeguards with regard to forestry fund investments that may form part of the CFCP3 Asia Project.
60. In the case of AsDB because the number of investments will be fewer and larger, we have agreed that it is possible for the UK Government to exclude itself from an investment into a specific fund or an entire direct investment where it has a concern.
61. With CF we have excluded the UK from India and China investments as these are already covered
by CP3 Asia and we wanted to focus money into other areas (given that 83% of all PE investments in developing countries currently in climate are India and China)xlvii. Investments in Russia will also be excluded as Russia does not quality for Official Development Assistance and it is UK Government policy not to provide Aid to Russia.
62. While it may be possible for UK Government to impose some additional standards to these via its
Limited Partner Agreement it is important that such standards and exclusions are kept to a minimum as they will need to be disclosed to other investors in the LPA and too many restrictions will be perceived negatively.
63. One of the main developmental benefits of the CP3 Platform will be rolling out the MDBs’ ESG”

standards to the new sub-funds and to new projects. In this way the standards become mainstream in the climate investment market and indeed more generally. This will be verified by way of monitoring and evaluation.
64. It should be noted that the UKAid Transparency Guarantee commitment requires the UK’s aid to be
fully transparent to citizens in both the UK and recipient countries. It is therefore expected that the UK will report when requested on its investments. This is however subject to commercial confidentiality requirements of the projects and sub-fund managers and SEC restrictions. In practice we do not anticipate any substantial problems for transparency here, although it should be borne in mind that reporting takes time. .
Technical Assistance – addressing specific market failures 65. The Technical Assistance seeks to address additional market failure issues with low carbon projects.
In particular there is the so called “first mover disadvantage” or the fact that other people “free ride” on the benefits of the first project’s investment, research and work on regulatory reform. Investors are aware of this and may hang back from investing, slowing the development of the market.
66. In many (non-climate related) markets there are substantial first mover advantages as the company
can capture consumer or business market share and lock in or rely on lethargy of consumers or keep out competitors due to transition/learning costs in areas such as IT or minimum network sizes in areas such as social networking. There is also the ability to patent some developments as the first mover in some markets. In some instances, however (and this is the situation in parts of the climate investment area), the returns for “first movers” are not much higher than those for firms that follow. For instance, in some developing country energy markets prices are often fixed (for instance through Power Purchase Agreements) or the first mover’s cost of production is no lower than those that follow. As a result, the market’s development can be delayed as companies in the industry are not willing to invest initially. They prefer to wait for another company to demonstrate that investing is indeed profitable. Once a company invests and demonstrates the technologies’ profitability or obtains the regulatory approvals (which may be slow as it is a new procedure for the host country), they are willing to follow on invest as the risk of investing has fallen. As a result there is potential for a market failure as businesses wait for someone else to invest so that they can free ride on the information generated by the first mover’s investment. The result is that investment takes longer to occur than it should.
67. Bio-gas production from agri-processing plants is a recent example of an industry where good
commercial returns are possible, but this potential could not be unlocked until an early mover demonstrated the technologies’ commercial viability. In Thailand in the late 1990s, it became clear that the use of the effluent from cassava processing plants for biogas production had the potential to generate substantial returns and reduce carbon emissions. However, the owners of cassava processing plants, and other plants with similar effluent, were wary of investing given that the technology had not been proven to be profitable in Thailand. This barrier was overcome when, an impact investor, invested in Korat Waste To Energy (KWTE in order to enable it to create a plant to produce methane from Sanguan Wong Industries (SWI), a cassava-processing factory. The plant was successful and profitable. A number of owners of similar plants in the area saw this success and also invested in the technology. Within five years, KWTE was sold. The annualized investment return was healthy, based in part on the sale of carbon credits. The complex regulatory issues with carbon projects and if carbon finance is to be used as the main form of financing the work involved to get CDM approval through the carbon credits system (something which CP3 investments are not proposed to be used for) for a new concept/technology are further examples of deterrents to some investors. In addition in relation to upstream investments many climate technologies are new and researching their viability to the degree required by venture

capital/PE investors can be very expensive. 68. The Technical Assistance facility is aimed at addressing these market failures. It will be focussed on:-
i. first time projects in a country or with a technology ii. researching new and complex technologies iii. supporting projects in countries with difficult regulatory or legal regimes
including providing regulatory approval support iv. support to find partners for debt financing in lower income countries (with
difficult business climates) v. support to local country investors/fund managers and pioneering fund
managers.
A technical panel will determine the destination of the technical assistance and review Fund Managers’ applications. The panel will not necessarily be experts in every geography or field but can bring in third party consultants via procurement frameworks and lists to ensure that proposals are verified. There are more details of the panel and procurement methods in the Procurement section below.
To what extent is the CP3 Platform success dependent on carbon price/ tax? 69. A concern has been raised that the project may fail if no carbon price is imposed globally or in key
countries. In fact this is not the case. The investment scoping and viability has assumed no material carbon price changes and has looked at opportunities that exist in the absence of one.
70. Given the flexibility in the CP3 platform model, we expect the funds to invest in those environments with the most attractive risk and return enabling environment for energy prices, innovation, renewables, power purchase agreements, trading of energy or which promote other investments. If the carbon is priced effectively then that environment will be more attractive than a venue with for example fossil fuel subsidies but that is only one motivator of an investment decision and it may be outweighed by others. A report was commissioned for the UK Government from a specialist advisory firm which investigated the potential for commercial returns for renewable energy in the relevant geographies. We expect that as now over time there will continue to be competition between jurisdictions for Green FDI. As more research is done and published and fund managers and investors gain experience the differences between regulatory regimes the investment climate will become clearer in the less well known countries and this will result in a virtuous circle as countries compete for limited private sector infrastructure investment, sometimes as part of delivering on their political commitments to the UN or others. Thus a global carbon price is not a pre-requisite for successful CP3 programme implementation.
More information about how funds work Fund raising and closures and investment withdrawal
71. A fund (whether a fund of funds or a sub-fund) works by raising money from investors. No single investor is likely to put in more than 25% because investors need to diversify their investments for risk reasons. In practice the investors do not put in the money immediately but make a commitment to put in the money when called upon. The fund will have a target of the amount it wishes to raise. This is the amount it wishes to and believes it can feasibly spend within a reasonable period on the envisaged pipeline of projects or in the case of a fund of funds, sub-funds. Sizing the fund is important because no fund manager will want to have too much unspent commitments because this will irritate the investors who want to ensure their money is at work earning returns.
72. Money is raised on the basis of the strategy of the fund as set out in a “teaser” or marketing

document which will show the investor sectors, geographies, likely investment stages (e.g. early stage investment) etc. This teaser is then later developed into a marketing presentation and the Private Placement Memorandum. The latter is a much more detailed document.
73. Once a fund reaches its target size in terms of commitments, then it gets to “close” and it ceases to fundraise. A fund may decide to do a series of closes or rounds of fund-raising. A fund may do a first close with early-bird investors and then do some investments to demonstrate viability to second round/second close investors. Funds may also do a rolling close, which means that new investors can join later after investments have begun.
74. It is not uncommon that funds fail to raise money or fail to get to close. Fund-raising may take several years. If this is the case then there is no obligation on the investors who have indicated commitments to pay any money. The legal obligation to make a commitment only arises if this first close is achieved and there is usually a time period for this. Thus the UK Government has no risk of loss of its money (other than the opportunity cost and loss of research/administrative staff time) if for some reason either CP3 Asia or CF does not get to first close. It is also possible that like the UK Business Innovation Fund, one or both of the funds does reach first close with some public sector investments but does not achieve much of a second close i.e. does not raise much private sector finance. This “small fund” scenario has been modelled in Scenario 4 of the Sensitivity Analysis in Table C of the Economic Case. In this instance the UK would be committed to continue with its investment but the results achieved are less. See the Economic Case for more detail.
75. Funds can be “closed end” funds or “quoted/listed funds”. With a closed, unquoted fund there is no ability to withdraw from the investment after the commitment has been signed. With a quoted/listed fund such as the funds sold for private investors, then investors can cash in their investments and others can join at any time.
76. The funds being discussed here are all closed, private funds which are generally not open to consumer or private investors. The protection for the UK Government is therefore upfront via its due diligence and choice of fund manager and the legal documentation rather than through an ability to change its mind later.
Draw down of financing
77. After closure each Fund will draw down commitments from the partners (such as the UK Government) throughout the life of the Fund to make investments, to meet obligations of the Fund (including obligations in respect of investee funds), and to fund (pay for) the management fee and Fund expenses. Each time a partner makes a draw down, such partner's obligations to meet further draw-downs are reduced by the amount of such draw down. The Fund may not draw down more than such partner's unfunded Commitments. So for example the UK may not be asked for more than £50m in relation to CF or £60m for CP3 Asia.
Reinvestment/recycling of finances
78. Under certain circumstances, the Fund may increase a partner's undrawn Commitment (and therefore increase such partner's funding obligation in excess of such partner's original Commitments). The following amounts may be added back to unfunded Commitments and may be drawn down again by the Fund: (i) amounts invested in a direct investment that are returned to a partner within 18 months of such investment and (ii) distributions made to the Partners to the extent of funded Commitments used to pay Fund expenses or the management fee. For the avoidance of doubt, a partner’s unfunded Commitment shall not exceed such Partner’s Commitment.
Giveback of finances
79. In addition to the reinvestment provisions described above, the Fund may also require partners to

return certain distributions to satisfy obligations or liabilities of the Fund. The timing and amount of such return will be subject to the provisions of the partnership agreement of the Fund.
Fees for Fund Managers 80. Fund managers are remunerated typically via two sets of fees:-
Management fee of between 0.5% and 2% per year. This is levied on the investment. The period over which it is levied is usually just the investment period which can be up to 5 years.
Carry fee of between minimum 5% (fund of funds) to 20% (direct investments) of the returns (profit after return of capital). This is effectively the fund managers’ share of the profits and remuneration for success. It is paid only after the “hurdle” is passed which is the full return of capital to the investor plus 8% return. Thus reflows are first applied to returning capital due to be returned, then 8% of the returns goes to the investors, then only if this is reached, is the carry percentage is applied to the remainder of the returns.
81. Both fees are generally lower in the instance of a fund of funds and in more developed markets and sectors where fund-raising is easier and set-up costs are lower e.g. UK and European fees have reduced in recent years. Emerging market funds tend to have higher fees due to the higher set-up costs and risks and travel costs and often the longer fund-raising period. Many EM funds may fund-raise for up to 2 years prior to close so will have incurred considerable costs and risks out of their own pocket before they are paid any fee.
82. A lower management and a lower carry fee is usual in the case of a fund of funds because choosing and doing due diligence on fund managers is less resource-intensive than doing a due diligence (legal, ESG and financial) on a direct investment transaction. A higher fee is payable usually for direct investments for this reason. Direct investments usually incur a higher fee than co-investments because with a direct investment the fund manager has to do the full work of sourcing the transaction and upfront research. Many transactions may be abandoned early on and therefore the fees reflect this kind of wasted costs. With a co-investment usually another fund manager has sourced the deal and already done work on its viability. The co-investor still needs to do its own due diligence but there is usually less risk of the costs being wasted because the transaction is abandoned.
Conclusion of Strategic Case 83. It must be stressed that on its own the CP3 Platform will not be able to address all aspects of
private financing for climate change, as it is narrowly focused on addressing the private equity financing gap. Other interventions will be needed, and ongoing initiatives by the MDBs, and other multilateral and bilateral organisations on the debt, risk mitigation and grant side will complement and support the CP3 Platform. Ongoing dialogue with countries on business-enabling environment, as part of the Green Climate Fund design process and in other fora will also be needed. However, CP3 Platform will address the first and key gap in the investment chain, and in doing so is likely to make a substantive contribution towards unlocking private finance flows. The technical assistance facility (described below), moreover, will contribute significantly towards building up the project pipeline and strengthening the financial infrastructure in developing countries , especially in the lower income developing countries, Finally, because the funds under the CP3 Platform will operate in an opportunistic way, they will act as a catalyst to emerging opportunities and create a momentum for reform which will help reduce regulatory risks, stimulating further investment.

CP3 Platform Summary 84. Below we outline the proposed structure of the CP3 Platform, summarising the investments into the
two different funds of funds.
CP3 Asia CF Nature 70% direct or co-
investments 30% funds
80% funds 20% direct or co-investments
Scope Renewable Energy, Energy Efficiency, clean tech, forestry, low carbon agriculture and fishing, water
Renewable Energy, Energy Efficiency. Clean tech, forestry, low carbon agriculture and fishing, water
Geography Asia Approximately 33% India, 33% China and 34% rest of Asia, including countries identified as ICF priority low carbon development countries such as Vietnam, Bangladesh, Indonesia, Thailand etc.
Global (incl LatAm, other Asia, Africa, Eastern Europe etc) UK Gov investment – excludes India and China and Russia (as non ODA eligible)
UK Investment £60m £50m Total fund size estimate commercially sensitive
information so removed from published business case document
commercially sensitive information so removed from published business case document
Other participants ADB - $100m Credit Suisse - up to $50m
IFC $75m
Commercially sensitive information so removed from published business case
Commercially sensitive information
Timing of first close Spring 2013 Autumn 2012 Duration of fund 10 years plus 2 year
wind down 12 years + 1 or 2 year extensions

CF Fund geography, sub-sector and stage of investment (indicative)
Figure 6 – Estimated investments for CF Fund
Although it is not possible to be exact, it is estimated that up to 15 to 30% of the funds will be adaptation and forestry.

85. The Technical Assistance and Project Development Facility (TAPDF) grant facility will provide technical assistance to both funds for the purposes of strengthening the investable project pipeline and fund incubation, especially with Low income countries. It will do so by providing financing to help fund incubation, produce due diligence and feasibility studies, help bring projects up to the bankable stage, carry out market or regional analyses etc. It is expected that, in the absence of other donor contributions, the proposed size of the TAPDF is up to £20m but the exact amount will depend on the quality of the proposals and the ability to spend this in early years.
The UK Strategic Priorities 86. To understand how the CP3 Platform fits within the UK’s broader strategic priorities, it is important to consider, ICF and, the two contributing departments’ Business Plans
87. The DFID Business Plan 2011- 15, published in November 2010 lays out the priorities of the Coalition Government, including undertaking to:-
Honour international commitments and support actions to achieve the Millennium Development Goals;
Boost wealth creation and economic growth;
Combat climate change supporting adaptation and low carbon growth; and
Influence the global development system. 88. The DECC Business Plan 2011-15, published in May 2011, sets out the structural reform priorities
including delivering ambitious action on climate change at home and abroad. This will be delivered, in part, through helping developing countries to take action by providing financial and technological support, including by making sure that Fast Start funding flows.
89 The UK has committed £1.5 billion (including £300 million for reduced deforestation) of Fast Start finance from 2010 to 2012 through the UN international climate negotiations. The DECC Business Plan also states that the Department will no longer fund technologies unless we are confident that they are the most critical to meeting long term decarbonisation and energy security objectivesxlviii.
90. Moreover, the SR 2010 Settlement for 2011-2015 has established a £ 2.9 billion International Climate Fund (ICF) (which includes some of the above Fast Start Finance), to be spent jointly by DECC, DFID and DEFRA on climate change mitigation (including forests) and adaptation measures). The ICF has identified “leveraging additional finance from other donors and the private sector for climate change” as one of its key objectives along with forming public private partnerships. Similarly, DFID’s new private sector strategy states that DFID will be “doing more with and for private enterprise, extending this work in new areas and doing it better”xlix.
91. The proposed intervention will help fulfil the above commitments in the following way:
Honour international commitments: The Copenhagen Accord commits developed countries to securing $100 billion a year for climate mitigation and adaptation in developing countries by 2020 from public and private sources. The AGF declared this to be a challenging but achievable objective that will require new ways of working between public and private sectors. The commitment was subsequently enshrined in the UN Principles in Cancun in December 2010. By demonstrating a new and innovative approach to working with the private sector to deliver climate finance, the CP3 Platform will not only help deliver on these commitments, but will strengthen the UK’s position as an innovator and leader in climate finance. Moreover, as the investments supported through the CP3 Platform will lead to significant health benefits and increased energy security, the Platform will help support the delivery of Millennium Development Goals (MDGs) (see the Appraisal case below).

Boost wealth creation: Private equity funds specialise in financing new and growing companies. Such investments can lead to the development of new technologies and business models and facilitating their global roll-out. Private equity is also needed as a cornerstone investment into infrastructure projects (including energy, water, public transport infrastructure etc). In both instances, private equity acts as a cornerstone of the capital structure enabling firms and projects to access other forms of capital. It therefore fuels economic growth and strengthens financial markets, which, in turn, contribute towards wealth creation. By enabling the financing and growth of low carbon businesses and projects in developing countries in this way, the proposed CP3 Platform will help catalyse the growth of a new sector in developing countries, in turn helping to stimulate employment opportunities and reduce poverty.
Combat climate change: The CP3 Platform investments will include the following sectors (both companies and projects):
o Alternative energy generation: wind, solar, biomass, fuel cells and hydrogen, geothermal, hydropower, biofuels and waste to energy;
o Resource efficiency and management: recycling, energy storage, green buildings, energy efficiency, smart grids, clean transport and manufacturing optimisation;
o Revaluation of resources and environmental services: waste and water management, urban planning, sustainable agriculture and forestry.
One of the core objectives of the Platform is to contribute towards low carbon, climate resilient development through an innovative public-private partnership, and its design is structured so as to obtain maximum climate benefits from a UK investment (as set out in the “Impact and outcome” section below). The CP3 Platform will also help propel developing countries towards a sustainable low carbon development path and increase the resilience of vulnerable populations in these countries to the negative impacts of climate change.
Influence the global development system: We have designed the CP3 Platform in partnership with the Asian Development Bank (AsDB) and the International Finance Corporation (IFC). Throughout the design process, we have encouraged both MDBs to focus on ensuring the public-private partnership is structured in a way which will help attract private investors. We have also influenced them to focus on achieving a high leverage of private finance by using a small amount of public resources, using an innovative fund-based structure. Our involvement has also been important in ensuring that robust environmental, social and governance guidelines and monitoring frameworks are put into place. By our continued involvement in the governance structures of both funds proposed as part of the structure, we will continue to influence the investment thesis of the two Funds, the nature of involvement of the MDBs and thus help the international development architecture in delivering on international development commitments.
Working with the private sector: as set out above, both the ICF objectives and DFID’s private sector strategy place the private sector at the core of our strategic priorities. The CP3 Platform will leverage significant private financing and will be partly managed by the private sector. It is the first initiative aimed at unlocking institutional investor financing for climate change, and the first initiative to see public and private finance being invested on pari-passu (equal) basis. As such, it will demonstrate innovative approaches to public-private cooperation that deliver value for money for the UK tax-payer, and the developing countries. DFID’s relatively new Private Sector Department is supportive of the CP3 Platform initiative and has contributed to its design.
Aid transparency: the CP3 Platform will comply with the Aid Transparency Guarantee, both as far as the UK’s own contribution is concerned, and as regards its partners’ (AsDB and IFC’s) commitments to transparency and accountability.

HMG Intervention and partnership with other development organisations 92. The key policy objective of the CP3 Platform is to catalyse innovation in climate markets and
institute a new approach to public private partnerships in the delivery of climate finance. By achieving this objective, the CP3 Platform will help developing countries move to a low carbon growth path, improve resilience to negative impacts of climate change, strengthen developing countries’ financial infrastructure and provide developmental benefits for the poor, including through jobs and access to energy. Specifically, the CP3 Platform will (following the headings in the ICF Results Framework):
Influence
Strengthen the role of the private sector in delivery of climate finance, while achieving a high leverage of private finance;
Influence MDBs’ delivery of climate finance and their engagement with the private sector;
Strengthen financial markets (particularly the private equity markets) in the developing countries to build enduring financial and technical capacity;
Embed the ESG standards in PE funds and developing country projects
Environment
Help combat climate change, by achieving significant GHG emissions reduction, and increased energy efficiency;
Reduce negative impacts of climate change by addressing water and air pollution and increasing energy access and security.
People
Through strengthened financial markets infrastructure, contribute towards wealth creation and therefore enhanced opportunities for the poor, including creating new jobs.
93. Partnership with stakeholders: The CP3 Platform was developed in partnership with the IFC and the AsDB since early 2010. AsDB and IFC will play a major role in implementing the Platform as they are uniquely positioned to do so due to their extensive networks and field presence in developing countries. Both institutions have significant experience in sourcing and financing infrastructure projects and companies, and both are experienced in investing into private equity funds. Moreover, both have extensive experience of climate-related investmentsl. Specifically, AsDB and IFC will contribute in the following ways towards implementing the CP3 platform:
Fund management: Both banks, or their subsidiaries, will be involved in fund management in relation to funds established by the Platform (see the Management Case below). This , on the one hand,will reduce the risk for private investors unaccustomed to operating in the developing markets and, on the other, will help ensure that stringent environmental social and governance (ESG) provisions are mainstreamed through the Platform;
Pipeline and deal origination: The Platform will benefit from the MDBs’ project pipeline while also generating new projects;
Anchor investment: IFC and AsDB will also act as additional anchor investors in the two
Funds established as part of the Platform alongside the UK. This will help mobilise investments from institutional investors unlikely to invest on their own and align their interests as part fund managers with those of other investors;
Project financing: Both IFC and AsDB would be able to complement the equity finance
injected by the Platform, by providing debt at the underlying project level if needed, in the ordinary course of their business.
94. In designing the Platform, we have cooperated with members of the P8li, a group of 12 largest
pension funds, convened by the Prince of Wales and managed by the Cambridge Programme for Sustainability Leadership. The P8 has taken a strong interest since inception of the CP3 Platform, and we expect some of them to be investors. Other stakeholders in the discussions have been other UK Government Departments, private sector representatives and other donor organisations.
95. The UK intervention will consist of:
£60,000,000 equity investment in the CP3 Asia Fund;
£50,000,000 equity investment in CF; and
Up to £20,000,000 contribution to the TAPDF.
96. Although the majority of UK finance will be provided without financial subsidy, there is a fundamental role for UK financing in the proposed Platform:
The UK government’s participation as an equity investor, even on commercial terms, will help reduce investor risks or the perception of their risks Investor feedbacklii has confirmed that the UK’s role as an “honest broker”, its relationships with local governments and ability to enter into dialogue with them, as well its expertise in working with multilateral investment banks, will help mobilise their investment. The lessons learned from CP3 (which is expected to have high international visibility) will help inform HMG’s policy dialogue with stakeholders, which may in turn facilitate further regulatory reform.
By demonstrating a workable public-private partnership, the CP3 Platform will set a replicable precedent for cooperation between private and public sectors in climate financing.
By participating in the Platform, the UK will be able to influence very generally the investment strategies of both funds, mostly by integrating stringent monitoring and evaluation criteria against our performance-based indicators.
The UK will be showing international leadership in leveraging private finance. Other donors and MDBs have expressed strong interest in investing in the CP3 Platform to date, but have preferred to do so following the UK’s lead.
97. The size of the UK’s proposed contribution is determined by the following factors:
Equity funds are reliant on anchor investors to provide the cornerstone financing which would enable the first series of investments to be made. Once success has been demonstrated, other investors join the fund at “second close”. The UK’s contribution as an anchor investor must be sufficiently large to send a signal to the other investors. The UK Government contribution is in line with the IFC’s usual contribution to a fund. This also fits with the modelling of the proposed fund size.
By contributing £60m (c$100m) to the CP3 Asia Fund, we will secure the same size of contribution from the AsDB which has committed invest $100m. This combined sum of approximately $200m will be sufficient to attract others and should thus make first close possible.

A rolling second close will then take place - probably towards the end of 2013. The UK’s overall contribution to the CP3 Asia fund will be greater than its actual monetary contribution because of its enabling role in attracting additional investment. Conversely, a small cornerstone fund would fail to attract large institutional investors, as small investments are difficult to reconcile with their large allocation strategies. As a result, even a small percentage reduction in the UK’s contribution is likely to result in a larger decrease in the overall Fund size. This, in turn, will deliver lower than expected emissions reduction and developmental outcomes.
Although the UK contribution to the CF is slightly smaller, as a percentage of the initial public and private equity it represents a much larger tranche than for the CP3 Asia Fund. Investing significantly less than the proposed amount of £50m would increase the challenge faced by the CF Fund to attract additional public and private equity investment, and to achieve impact at the scale envisaged.
The proposed contribution of up to £20m for the TAPDF facility will be large enough to have a material impact on the project pipeline and the environment, without it being regarded as a potential public subsidy for commercial investments. It will not be so large as to undermine the fundamental premise of the CP3 Platform, which is that public-private partnerships in the low carbon infrastructure space can work with all parties investing on pari-passu basis.

CP3 Sectors Note – investing will be opportunistic and the diagrams below are indicative only. Figure 7 - estimates by AsDB of investment sectors and geographies
CF Sectors

B. Impact and Outcome
98. The overarching impact of the CP3 Platform will be the acceleration/unlocking of private finance flows which will help developing countries to pursue a resilient low carbon development path and improve the amount of clean energy and ensure energy savings.
99. More specifically, the initiative will stimulate the low carbon private equity markets in developing countries, which in turn will mobilise other types of private finance and deliver developmental benefits. The Platform will consolidate the project pipeline and should via the projects facilitate government –private sector dialogue and regulatory reform in-country pursuant to private sector demand. Thus it is anticipated that Governments will via national plans and legislation also endorse and incentivise low carbon policy and adaptation. There will be other ICF and donor projects specifically focussing on the regulatory reform.
100. The ICF programme divides impacts, outcomes and outputs into three main categories set out below. The indicators in the schedule at the end of this document reflect those categories and they are weighted.
Influence (effect on Governments, investors and other participants such as MDBs) – 45%
Environment (effect on carbon, energy savings and efficiency, pollution, natural resources) -45%-
People (e.g. effect on poverty (jobs), energy access for the poor, health, innovations that reduce costs/improve lifestyle etc) -10%
The Platform is intended to have a significant “Influence” effect by demonstrating the feasibility of public-private cooperation on a commercial basis to achieve low carbon development objectives, leading to wider roll-out of similar initiatives.
Outcomes
Thus the CP3 Platform should increase private sector investment in climate in developing countries in a responsible manner, putting countries on a low-carbon growth path. Specifically it should:-
(i) Mobilise the flow of at least £15bn funds into the developing country climate sector of which £11bn should be private sector funds. £5bn is private sector funds above and beyond what would have flowed anyway into this sector from the private sector.
(ii) increase the percentage of private sector investors in the climate finance area by a measurable amount (to be measured by surveys)

(iii) mainstream environmental, social and governance safeguards into climate fiendly investment.
Outputs Influence - Financial
1) Raise at least £600m of private sector Fund of Funds equity
2) Mobilise at least £11bn of private sector money in total of which £5.9bn is estimated is additional to what would have gone into the sector anyway.
3) Mobilise at least £7.5bn of debt, of which £3.3bn is estimated is additional to what would have gone into the sector anyway.
4) Anchor at least 15 climate funds in developing countries, with at least 8 first time climate change funds (either by sector or geography).
5) Result in at least 35% of climate funds in CF/CP3 Asia performing in the top quartile of the relevant Emerging Markets indices.
Influence – deliverables
6) Result in an estimated 182 downstream energy projects and 122 energy efficiency projects
7) At least 50 upstream clean tech projects
Environment 8) At least 265m tonnes of carbon are avoided, an estimated £130m more than would have been avoided
without the intervention i.e. in a business as usual case.
9) At least 237,684 MWh of energy savings (117,179 MWh additional to what might otherwise have occurred)
10) At least 6.9MW of clean energy capacity (estimated 3.4MW additional)
11) 100% of investee funds complying with IFC Performance Standards (IFC Environmental and Social safeguards) or equivalent.
Notes
All figures are estimates based on the Economic Case and financial model (for more detail see Section C Appraisal Table A below). This model assumes a hypothetical portfolio of investments and thus the results may be higher or lower in practice due to the inherent uncertainty in the investment choice and the lack fo clarity on technology efficiencies and costs.
The figures assume in particular that both of the two funds reach second close and achieve the total fund sizes set out in the model and provided separately (commercially sensitive information) and the target fund sizes in the larger fund economic model CF. Several sensitivity analyses have been run, including smaller fund size (comprising almost entirely public money). The effect of the Sensitivity Analysis on the figures can be seen in Table C below.
The figures do not include additional investments from financial reflows from the funds.

IFC Climate Catalyst Fund Structure
1
up to £50m
Climate FundsClimate Funds
IFC AMC, LLC (the Manager)
IFC Climate Catalyst Fund, L.P. (CCF)
IFC Climate Catalyst GP, LLC (General Partner)
100%
100%IFC
20% up to US$75m
Co-InvestmentsCo-Investments
DfID (Limited Partner)
Other Limited Partners
LP Investment Vehicle for IFC
100%

CP3 Asia Fund
Note – the UK investment will be via a Scottish Limited Partnership and not a Cayman Islands Co. Appraisal Case
A. Determining Critical Success Criteria (CSC)
Each CSC is weighted 1 to 5, where 1 is least important and 5 is most important based on the relative importance of each criterion to the success of the intervention.
CSC Description Weighting (1-5) 1 Leverages donor funds to deliver climate relevant
investment at scale 5
2 Builds institutional private equity fund capacity for both mitigation and adaptation type investments
5
3 Maximises GHG reductions in large carbon intensive economies
4
4. Supports low carbon growth pathways for a wider range of developing countries (including some lower income countries)
4

C. Appraisal of options Economic appraisal – modelling based on potential investments
Each of the above options has been appraised in economic terms, based on the value of the likely emissions reductions and changes in energy consumption, according to emerging DFID, DECC and HM Treasury guidance. For the purposes of this analysis, given the global nature of the programme, and its focus on large economies and sectors able to absorb the scale of investment enabled, it is assumed that the impact of these options is marginal, thereby allowing a classic Cost Benefit Analysis (CBA) to be undertaken. The analysis is however by definition imperfect because it does rely on a significant amount of assumptions – first the investments are hypothetical (see below) but there are also considerable number of other assumptions referred to in Table A below.
The analysis is done by assuming the funds reach a certain size and then based on this size that they achieve a hypothetical group of investments. The economic benefits (welfare benefits) GHG savings and energy savings and increased supply benefits from these assumed investments are then modelled . For more details on these see the Benefits section below.
Based on MDB projections, it is expected that up to 30% will be in adaptation and forestry and approximately 70% of investment will go into low carbon investments (renewables, energy efficiency and clean tech). Of this 70%, 60% is envisaged for downstream projects delivering direct GHG abatement opportunities, with the 40% remainder invested in upstream manufacturers and supply chain companies.
Only the downstream renewable energy and energy efficiency projects have their benefits monetised in the economic model, due to the difficulty of making any calculations on the benefits of forestry, adaptation and upstream projects.
With regard to the downstream investments a further assumption is then made about the downstream investment types e.g. proportion invested in solar versus wind renewable projects and the geographical split. This split between technologies and geographies is based upon market analysis and discussions with the MDBs. Figure 8 below provides an overview of the hypothetical portfolio for CP3 Asia and CF combined.
Figure 8 : Split of downstream investment
% TotalMENA
China India Other Brazil Mexico Other RSA Other MENA Turkey Other% of total downstream investment 27% 27% 21% 4% 3% 4% 1% 3% 4% 2% 2% 100%
Renewable Energy 71% 72% 72% 65% 57% 68% 69% 91% 65% 76% 72% 71%Biomass (incl Green Chem & Muni Waste) 7% 7% 17% 46% 37% 9% 33% 19% 22% 14% 10% 13%
Geothermal 0% 2% 5% 0% 0% 27% 0% 27% 0% 14% 7% 4%Hydro 35% 30% 29% 23% 18% 27% 0% 22% 6% 39% 29% 29%
Marine -> Cleantech 0% 0% 0% 0% 0% 0% 0% 0% 0% 0% 0% 0%Solar 11% 47% 24% 4% 5% 8% 29% 12% 29% 8% 18% 24%Wind 47% 14% 25% 26% 41% 28% 38% 20% 43% 25% 35% 29%Total 100% 100% 100% 100% 100% 100% 100% 100% 100% 100% 100% 100%
Energy Efficiency (incl. fuel switch) 16% 15% 16% 15% 23% 20% 24% 3% 22% 13% 21% 16%Energy Eff iciency 100% 100% 100% 100% 100% 100% 100% 100% 100% 100% 100%
Other Cleantech 0% 0% 0% 0% 0% 0% 0% 0% 0% 0% 0% 0%Cleantech (all upstream) 100% 100% 100% 100% 100% 100% 100% 100% 100% 100% 100%
Adaptation (incl water/ wastewater) 13% 13% 12% 20% 20% 12% 7% 5% 13% 11% 6% 13%Adaptation 100% 100% 100% 100% 100% 100% 100% 100% 100% 100% 100%Forestry 0% 0% 0% 0% 0% 0% 0% 0% 0% 0% 0% 0%Forestry 100% 100% 100% 100% 100% 100% 100% 100% 100% 100% 100%
100% 100% 100% 100% 100% 100% 100% 100% 100% 100% 100%
Asia LAC SSA ECA
Table A below lists other assumptions in the economic appraisal such as fund size, benefit

calculation, timings etc Leverage/Private Sector mobilisation
By investing through a Fund of Funds (FoF) model, there is considerable leverage/mobilisation of
both public and private sector investment. Not only should the UK government investment result in the mobilisation additional public and private investment at the FoF level (potentially 6:1 in the preferred Option C), the sub-funds into which the FoF invests also are assumed to mobilise additional investor equity on a 3:1 basis (this is a conservative estimate as IFC has a 20% risk cap on any investment, and AsDB has a 25% risk cap). The projects or companies in which the sub-funds then invest also are assumed to attract additional equity on a 2:1 basis (again a conservative estimate as most funds have an investment risk cap of 20 to 25% in sub funds). These projects or companies are then assumed to attract debt finance on a 1:1 basis. Again this is a conservative basis as in practice in many Asian countries according to AsDB data on their projects and Project finance international surveys and an academic study from the University of Illinois, the average debt ratio in Asialiii at least is much higherliv. This cascading leverage effect could allow the UK investment to achieve combined total mobilisation ratios of 1:74 . This is illustrated in the Economic model. The more funds that are attracted at the Fund of Funds level, the greater the overall leverage. Sensitivity Scenario 4 on the size of funds in Table C shows this.
Attribution issues
Given the scale of the leverage effect, the actual projects and companies that deliver GHG abatement obviously benefit from a range of sources of finance and development support, and their benefits are not solely attributable to the UK intervention. There are other MDBs, debt providers and guarantee providers at the sub-fund and project level too as well as other private sector investors and creditors.
The Organisation for Economic Cooperation and Developmnent OECD’s arm known as DAC (Development Aid Commission) are developing standards on reporting and attributing private sector finance leveragedlv. The core guidance from them as at 10 November 2011lvi was that there should not be double-counting with MDBs and other donors, so the UK Government cannot attribute to itself all the CP3 project benefits/results/spend in terms of CO2 or clean energy. If this were to occur then we risk saying we have saved more carbon globally than is true. The safest approach which OECD seemed to approve was to take the overall project size and then apportion to the UK Government the portion that relates to it in the largest UK pound to third party leverage/mobilisation ratio.
This however then ignores that the debt leveraged has a different lifetime and therefore a different attribution to the equity as the debt will be paid off sooner and therefore most MDBs only attribute the carbon savings for the tenor of the debt. It is therefore necessary to modify the attribution to take this into account.
This attribution issue is shown in the excel financial model and the results in Table B and C below In that Table he Benefit Cost Ratio (BCR) is reported according to all 3 attribution models – assuming full attribution for all funds raised at all levels, assuming that the percentage of the UK contribution at the Fund of Funds level is an appropriate percentage and then finally assuming the stricter form of attribution i.e. taking overall size of all funds raised and dividing that by the UK funds contributed but using a 2:1 equity to debt weighting.
Influence
Despite the strict attribution issues, the UK Government may be seen to play an enabling role in scaling up these investments by catalysing the initial equity capital and this needs to be recognised via the leverage ratios. The OECD (Environment and Development Network Coordination Directorate) has acknowledged this and that such leverage or mobilisation ratios should be tracked and reported. The UK (and AsDB and IFC) by taking the first step and the equity at the top level

does take some initial risk, as well as the research costs and time in putting the project together.
The OECD is continuing to work on methodology for leverage ratios and the ICF work-stream in conjunction with this will refine its own methodology for evaluating leverage ratios achieved (including the type of finance that can or cannot count as part of the leveraged flows; the cut off point for finance leveraged etc) as well as recommending an approach to private finance scoring which is inevitably contextual (dependant on country, political and sector risk/return).
As a result of the OECD and ICF work we will among other things, be able to test and further refine the leverage and attribution assumptions and methodologies in the economic case, which to date has been difficult as the data/research on leverage and private sector mobilisation ratios and attribution methodology has been limited and not always climate-specific. It must also be noted that the Risks section below contains a discussion of risks associated with the estimated lprivate sector mobilisation/leverage in the wider sense or leverage (in the narrower debt sense) not being achieved.
Recycling / Compounding effects
The UK Government is expected to earn a commercial return on its investments in the fund of funds structure. The reinvestment of these returns during the lifetime of the fund might be expected to generate significant additional benefits over and above the first round effects For the purposes of this analysis, we consider only first round effects (without compounding or recycling).
Benefits
Benefits are derived from 3 elements.
1) Carbon benefits
The carbon benefits are calculated on the basis of displaced grid power from renewable energy supply projects and reduced energy consumption from energy efficiency projects. The potential number of projects are derived from an average of international capital and operating cost estimates in DECC’s levelised cost of energy calculator (based on International Energy Authority - IEA data). We assume that 50% of new power supply displaces existing dirty capacity, (calculated using marginal grid factors). Carbon values are taken from the updated October 2011 DECC carbon price series (central), with sensitivity analysis undertaken on a low carbon price scenario.
2) Energy saving benefits
Based on a sample of the MDBs’ energy efficiency investments (in Asia and Eastern Europe), we create a profile for a typical EE investment project (based on its capital costs and its energy saving and carbon abatement potential). The financial benefit flowing to firms from reduced energy consumption is valued over 10 years at the long run variable cost of supply. This is estimated to be 80% of the retail price, and is based on DECCs global Enerdata 2050 price series from DECC’s GLOCAF (Global Carbon Finance) model and Enerdata’s POLES (Prospective Outlook on Long Term Energy Systems) modellvii. We assume that 25% of theoretical savings are not captured by projects (through technical constraints or the rebound effect such as increased productionlviii) We do not value the potential benefits flowing from the rebound effect in CP3 appraisal due to the lack of empirical evidence on producer rebound effects.
3) Welfare benefits from increased supply:
We assume that 50% of new power supply is additional (i.e. it does not displace existing capacity and goes beyond sector plans). This power provides a welfare benefit for consumers, both from more reliable power provision, and through extension of energy access to new consumers. This power is valued at consumer’s willingness to pay (based on the DECC Enerdata retail price series). We assume a 10% transmission and distribution loss between generation and
consumption before welfare benefits are calculated. Furthermore, we weight the welfare benefit to 60% of total value to reflect the potential for additional power to flow to higher income groups, and the potential for displacement of traditional energy use among poorer groups (e.g. biomass).
Low Carbon Energy Supply and Efficiency
The monetised value of the emissions reductions is calculated using Treasury Green book guidance and DECC carbon valuation methodology and October 2011 carbon price series, and assumes a 3.5% declining discount rate. For renewable energy supply, carbon benefits are only recognised where the supply is displacing existing grid. Grid factors are calculated on the basis of marginal emission factors reflecting the geographical profile of investments, and are assumed to decline on a linear 1% per annum basis to reflect prevailing global grid decarbonisation policy. Adaptation and Forestry
MDBs estimate that 15% to 30% of total investment enabled will go into funding into adaptation and Forestry. Of this, more than 75% is envisaged in downstream projects (water treatment and management, sustainable agriculture, resilient infrastructure, plantations) with the remainder being invested in upstream companies developing products and services.
The potential abatement and sequestration benefits of forestry investments have not been included in the central scenario, due to the high level of specificity regarding management and land use issues, and the potential for leakage. However, some forestry investments have the potential to be significantly positive in terms of GHG abatement (particularly those relating to reforestation and improved soil management of degraded land). This will be studied more closely during project implementation.
Given the highly specific nature of adaptation investments from a cost benefit perspective, and their relatively small share of total investment enabled, they have not been appraised. As a baseline, it could be expected that the benefits of well sourced adaptation projects would have a benefit-cost ratio (BCR) of at least 1:1, and probably significantly higher.
Qualitative/Non Monetised benefits
In addition any other benefits (productivity/growth, employment, improvements in investment climate and ability to attract other foreign investment in the developing country, increased developing country taxation revenues, air quality and health benefits from renewables) are not quantified.
Therefore it is important not just to focus on the monetised BCRs below but to remember that non monetised benefits also exist.
Central Scenario and Sensitivity Analysis
The central scenario is based upon the most likely allocation of finance across geographies and technologies, and leverage assumptions based on MDB fund of funds exposure constraints and experience. Table A sets out the key assumptions in the central scenario, together with potential opportunities for sensitivity analysis.

Table A: Central Scenario Assumptions and potential areas of sensitivity analysis Variable Element Central Scenario Potential Sensitivity Analysis
Debt/equity leverage ratios As per MDB data:
FoF exposure to sub-fund equity 25% (3:1) Sub fund exposure to project equity 33% (2:1). This is probably on the high (conservative) side Project debt: project equity ratio 1:1 (50%). Again this is conservative
Conservative - FoF equity to subfund equity 2.5 : 1Project Debt: 0.75:1 Project Equity See Sensitivity Scenaio 1 – lower leverage in Table C below.
Discount rate All costs and benefits discounted at 10%, except CO2 – 3.5% declining after 30 years
15% - All costs and benefits incl. CO2. See Sensitivity Scenario 2. in Table C below
Carbon price DECC UK traded price (central) DECC traded price Low, High. See Sensitivity Scenario 3. Table C.
Second round effects (compounding)
Not included Effects of recycling of funds within the Fund of Funds of CP3 Asia and CF are not taken into account e.g. early returns might be redeployed
Theoretically these could be included but practically difficult to do.
Geographic/technology split Indicative, based on research with other developing funds.
Low carbon intensive economies, high cost abatemetechnologies. In practice modelling on a different geographic and technological split would be very timeconsuming and involve a lot of hypothesising. It would probably not be worth the gain.
Value of additional electricity supply (Energy Supply investment)
Valued at Long Run Variable Cost of Electricity Based on 8-% of DECC Enerdata series
It would be possible to use another pricing scheme but there is hard to see what value this complexity would add.
Value of energy saved (Energy Efficiency)
Valued at Retail Price of Electricity. Based on DECC enerdata series.
As above.
Timescale for benefits Benefits of energy efficiency projects are not counted beyond 10 year lifetime Benefits of renewable electricity supply projects not counted beyond 25 years
Further limit timescale of benefits. For example some MDBs count benefits only during the period of financing .e.g. 5 to 7 years (as beyond that benefits accredited to refinancing) They generally do this for debt financing however which makes more sense. We have therefore in our attribution arrangements weighted equity twice as high as debt because equity is longer duration and therefore can be assumed to take a larger chunk of the total pie.
New supply additional to or displacing existing grid investment plans
Assume 50% is additional Low (20%), High (90%)
%age of energy supply increase which is attributed as a welfare benefit
Assume 60% of total value is of welfare benefits as some of the energy supply does not benefit lower income groups
Transmission loss 10% loss between generation and consumption Based on IEA /AsDB data
Rebound effect Assume 25% rebound effect from all energy efficiency improvements. . Welfare benefits flowing to industrial beneficiaries not valued
Low (0%), High (50%)
Time to investment 3 year (based on Fund manager estimates)
There might be some delays in investments being made due to financial market fund-raising or other factors. This will mean a greater portion of investments is taken out in the management fees bsocial/environmental impact of the investments is affected. Modelling this is quite complicated.
Timeline for building Average 3 years used – based on IEA data of

infrastructure projects (after commitment made)
time to build Renewable Energy infrastructure
Dollar rate used 1:65 - no currency gains/losses assumed for UK Government or for Fund managers
If the dollar increases in value before UK Governments investments then the impact/ of the UK Government investment is reduced
Size of funds Assumed that CF and CP3 reaches target size in larger Fund model (details removed from Business case as commercially sensitive) In practice the issue of size of fund is highly dependent on the financial markets and their appetite for the project/risk and competing funds/other investment choices.
see Sensitivity Analysis Scenario 4 which uses 60% of target fund size for CF 25% of larger fund size for CP3 Asia
Fees charged by Fund Managers Assumes a 3% deduction at FoF level to take account of 1% annual management fee over a presumed investment period of 3 years
In practice the 1% fee might be charged over a longer period. The impact of this is however not enormous on the BCR or the results
Grid Factors Taken from World Resources Institute (WRI) database and UN Carbon Development Mechanism (CDM) database
Project Failure rate (10%) from an economic perspective i.e. number of sub-projects which do not reach operational stage (this is not the same as projects not having a financial return)
Based on IFC’s funds data using the proxy of returns of less than 50% of capital i.e. insolvency.
A higher failure rate of say 15% might be used
Carbon benefits and energy access etc in some areas
Carbon benefits for adaptation and forestry and carbon benefits and energy access results from investments in upstream supply technology are not calculated
With more data on potential hypothetical investments and discussion on calculation methods it might be possible to include them but due to the sheer complexity and hypothetical assumptions this has not be done.
Investment types/mix – 45% downstream energy and energy efficiency
Based on discussions with MDBs it is assumed that up to 30% of investments will be in adaptation and forestry and approximately 70% of investments in low carbon investments (renewables, energy efficiency and clean tech). Of this 70%, 60% is envisaged for downstream projects with the 40% remainder invested in upstream manufacturers and supply chain companies. This means 42-45% of investments are financially quantified in the model.
It would be possible to model a higher percentage of downstream renewable energy and energy efficiency.A lower percentage (to 45% of all investments) is probably neither logical nor worthwhile.
Investment mix – proportion in each technology
The proportions in each technology e.g. solar, wind, geothermal is based on discussions with the MDBs.
It would also be possible to model using a different technology mix. This would affect the GHG emissions savings and the MW produced but it is questionable as to whether there would be sufficient value gained from the exercise and the investment mixes used would be speculative rather than based on any empirical data.
Investment mix - geography The proportion of investment in each country is also based on discussions with the MDBs.
The same rationale applies as with the technological investment mix above.
Table B - Cost Benefit Analysis – Central Scenario
The following results are estimated for each of the optionslix. Again the assumptions in Table A still apply and upstream and forestry and adaptation investments are not valued.
Note – “Additional” means beyond Business as Usual i.e. additional to the counterfactual in the model.

Option Cost New installed Capacity
(GW)
Energy Saved (GWh)
Emissions reductions (M tCO2e)
Abatement cost
£/tCO2e
IRR -Rate of Return (CO2 savings, Energy Saved and Energy versus UK spend)
BCR (UKContribution
i.e. taking full attribution for
all funds raised)
Total
and Additional
BCR (Fund of funds)
Total and Addition
al
BCR
Strict UK Gov only contribution
with equity debt weighing 2:1
Financed Leveraged for UK £ at FOF
Level
Total and Additional
1. CP3 Asia only
£60m
4.7
1.75 additional
134,81
2
51,528 additio
nal
163m
62.4- additional
£15
18%
65- Total
25 - Additional
7 - Total
3 - Additional
0.4 Total
0.3 Additio
nal
51
(Additional 3)
2. CF only
£50m
(plus £20m TA)
2.54
1.638 - additional
102,87
2
66,752 additio
nal
99.2m
64.4 - additional
£18
21`%
39 Total
26- Additional
2 Total
1- Additional
0.4 Total
0.6 - Additio
nal
52
(Additional 12)
3. Combined
£130m
(including £20m
TA)
6.96
3.4- additional
237,68
4
117,179 -
additional
265.3m
130 - additional
£16 18%
49 Total
24 Additional
2 Total
1- Additional
0.4 Total
0.4 Additio
nal
51
(Additional 6)
4. Do Nothing
£0
3.8
44,074
144,689
0 0 0 0
Note – the IRR calculated here is nothing to do with the commercial IRR or rate of return on investments this is purely a measure of developmental “return” for Government purposes of i..e developmental benefits versus UK spend.
Option 1 – Asia only, direct investment: At a cost of £60m, option 1 should deliver new low carbon supply capacity of 4.7GW (or 1.75GW additional to what would otherwise be delivered), energy savings of circa 134,812 GWh (or 51,528 GWh additional) and would result in emission reductions of 134mtCO2e (or 62 MmtCO2 additional) . This would be at an average abatement cost of £15/tCO2e. The option has an IRR of 18% and a Benefit Cost Ratio (BCR) at Fund of Funds Level of 7:1 (UK Government’s contribution 65:1). If the UK Government is very strict in its attribution (following the DAC rule of not double-counting where there are other public sector players but recognising the debt is weighted more highly) then the BCR is 0.3.

Option 2 – Global FoF, bias towards subfunds investment : At a cost of £70m (£50m equity plus £20m technical assistance), Option 2 would deliver new low carbon supply capacity of 2.54 GW (1.638GW additional), energy savings of 102,872 GWh (66,752 additional), resulting in emission reductions of 99.2MtCo2 (64.4MtCo2 additional) at an average cost of £15/tco2e. The benefits are lower due to a broader focus on lower income countries with lower carbon intensity rather than just India and China, although due to the fact that this is likely to have a greater catalytic effect the impact above BAU is not so different to that of the CP3 Asia fund. The option has an IRR of 21% and a Benefit Cost Ratio at Fund of Funds Level of 2:1 (UK Government contribution 39:1) or on strict attribution basis with equity weighted more than debt and only benefits additional to business as usual counted, then the BCR is 0.6.
Option 3 - Combined: At a cost of £130m, option 3 would deliver new low carbon supply capacity of 6.96GW (3.4GW additional), energy savings of 237,684 GWh (117,179 additional), resulting in emission reductions of 257m tco2e (130m additional) at an average cost of £16/tco2e The option has an IRR of 18% resulting and a Benefit Cost Ratio at Fund of Funds Level of 4:1 (49:1 for UK Government’s contribution). If the UK Government is very strict in its attribution (following the DAC rule of not double-counting where there are other public sector players but recognising the debt is weighted more highly), then the BCR is 0.4.
Option 4 – Do Nothing/Business as Usual (BAU). Some of the investments might occur anyway in renewable technologies and energy savings without the UK Government intervention but not at the same scale. It is difficult to model this scenario i.e. to determine the likely growth of the climate relevant PE market and infrastructure market over the next 10 years due to current economic turbulence and lack of transparency over a national and global climate policy as well as a lack of data of the size of the PE market. To develop a baseline, the approach was taken to discuss with the two MDBs the likelihood of those investee funds and direct investments in which the CP3 platform might take a stake closing within a reasonable timeframe (i.e. 5 years). The aim was to identify what proportion of total CP3 investment might be considered additional, and to assess what percentage of investments would happen in any case, albeit perhaps on a slower timeframe. Our discussions indicated that 80% of direct investments were likely to be financed without a CP3 contribution. Of investments in sub-funds, 60% of CP3 Asia sub-funds would be able to close (reflecting the relatively attractive nature of equity markets in Asia), and 40% of CF funds..
For those funds or direct investments that would have closed without CP3 funds support, there was agreement that the CP3 platform would likely bring forward the point of close, thereby delivering an element of market acceleration, particularly against a backdrop of financial market uncertainty. For the BAU scenario, we have therefore assumed a 2 year additional delay in investments and funds closure. Unfortunately, the rate of increase of the DECC carbon price used for modelling is greater than the discount rate applied, meaning that the benefits of early action on climate mitigation are not well captured in the modelling (i.e. delay is considered economically beneficial).
Conclusion of Cost Benefit Analysis
Even taking into account the fact that only the 45% of investment enabled going into downstream projects is considered quantifiable in terms of benefits, all three Options presented offer significant benefits in excess of programme costs against the Business as Usual. The CBA has quantified only the emissions reduction and clean energy capacity benefits; it cannot take account of many developmental benefits due to data constraints. These will be evaluated on a post hoc basis as part of the Evaluation Plan. On the basis of that narrow CBA, option 1 appears to offer cheapest abatement. However, once developmental benefits) and transformational benefits (set out in the Strategic Case) are taken into account, including the potential for CF to grow the wider PE market outside of just Asia, we judge that option 3 offers better value for money.
Table C Sensitivity Analysis on the Preferred Option:
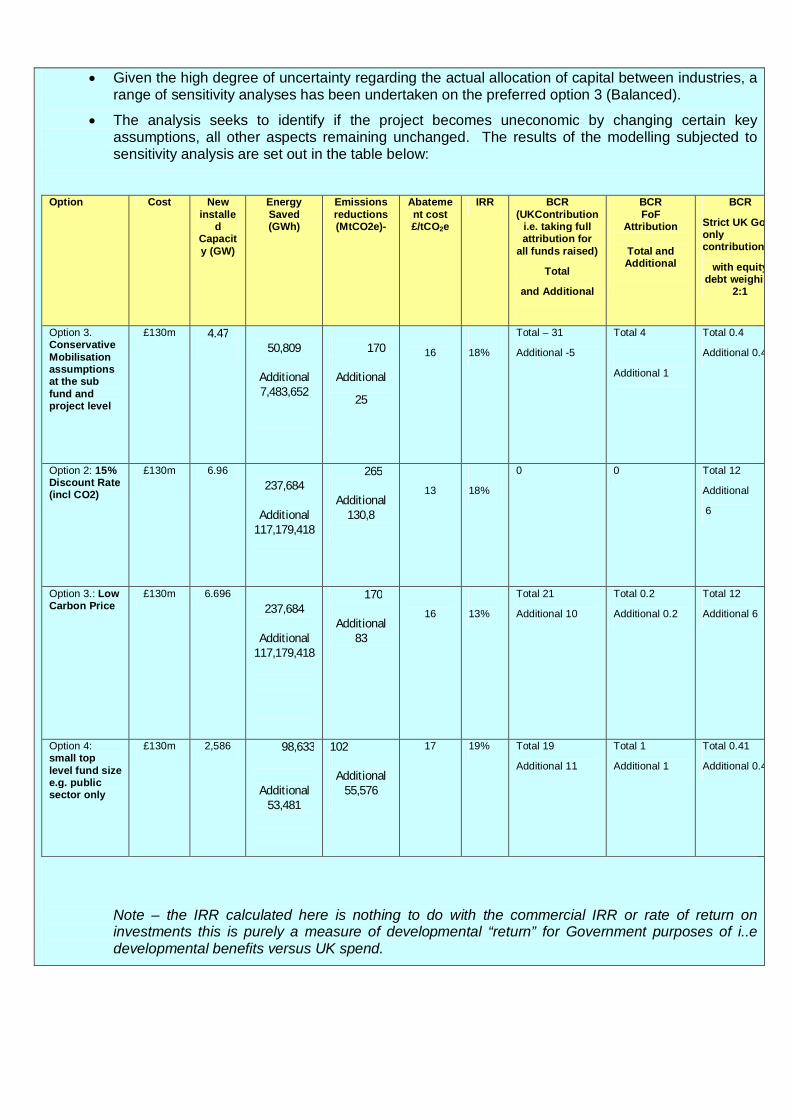
Given the high degree of uncertainty regarding the actual allocation of capital between industries, a range of sensitivity analyses has been undertaken on the preferred option 3 (Balanced).
The analysis seeks to identify if the project becomes uneconomic by changing certain key assumptions, all other aspects remaining unchanged. The results of the modelling subjected to sensitivity analysis are set out in the table below:
Option Cost New
installed
Capacity (GW)
Energy Saved (GWh)
Emissions reductions (MtCO2e)-
Abatement cost £/tCO2e
IRR BCR (UKContribution
i.e. taking full attribution for
all funds raised)
Total
and Additional
BCR FoF
Attribution
Total and Additional
BCR
Strict UK Gov only contribution
with equity debt weighing
2:1
Option 3. Conservative Mobilisation assumptions at the sub fund and project level
£130m 4.47
50,809
Additional 7,483,652
170
Additional
25
16
18%
Total – 31
Additional -5
Total 4
Additional 1
Total 0.4
Additional 0.4
Option 2: 15% Discount Rate (incl CO2)
£130m 6.96 237,684
Additional
117,179,418
265
Additional 130,8
13
18%
0 0 Total 12
Additional
6
Option 3.: Low Carbon Price
£130m 6.696 237,684
Additional
117,179,418
170
Additional 83
16
13%
Total 21
Additional 10
Total 0.2
Additional 0.2
Total 12
Additional 6
Option 4: small top level fund size e.g. public sector only
£130m 2,586 98,633
Additional 53,481
102
Additional 55,576
17 19% Total 19
Additional 11
Total 1
Additional 1
Total 0.41
Additional 0.41
Note – the IRR calculated here is nothing to do with the commercial IRR or rate of return on investments this is purely a measure of developmental “return” for Government purposes of i..e developmental benefits versus UK spend.

Sensitivity Scenario 1 Leverage Assumptions: By reducing the expected equity and debt leverage ratios at FoF, sub-fund and project level, this leads to a decrease in the expected scale of investment mobilised – see chart above. The BCR remains positive. In practice, the sub-fund and project leverage assumptions were already below the industry standards, the main risk is the fundraising at the FoF level – which is taken into account in sensivity option 4.
Sensitivity Scenario 2 Discount Rate: By increasing the discount rate to 15% (for both GHG and non GHG costs and benefits), the value of the long run benefits (and in particular GHG abatement benefits) is reduced while the shorter term costs of project implementation are less affected. See chart above.
Sensitivity Sceniaro 3 Carbon Price: By assuming a lower carbon price over time, this reduces the value of the CO2 benefits accruing. Based on the low carbon price scenario within the Green Book guidance, the FoF BCR remains at 1:1). For this, we have taken the low scenario from the DECC guidance.
Sensitivity Scenario 4 Small Top Level Fund size: In this scenario we reduce the size of the two funds to 60% (CF) and 25% (CP3 Asia) of larger fund target, reflectingCFthe amount of funds that could be expected to be leveraged from the UK Government, the MDBs and a few other public sector members who have expressed interest or would be likely to invest. The result is that amount of capital mobilised in the sub-funds and projects decreases and there are less carbon savings, energy savings and less Renewable Energy deployed. The BCR remains positive so long as the leverage/mobilisation effects are taken into account. If only the amount strictly attributed to the UK Gov is taken into account then the BCR falls below 1 (which is also the case with Sensivity Scenarios 2 and 3). This scenario shows us that a solely public fund is still appropriate value for money but comparing it with the larger fund sizes shows the importance of the top level funds in terms of general mobilisation.
Developmental benefits
In addition, there are a number of developmental benefits that could not be quantified as part of
the CBA. These include the potential for regulatory change in the investment climate, new jobs, health benefits, energy security, and access to energy. These are currently impossible to model in an economic CBA, but one aim of the CP3 Platform will be to build the knowledge via the evaluation procedures which would enable us to carry out such modelling in the future.
Signalling and Regulatory change In addition to the strict financial and cost-benefit analysis, there are significant likely signalling and demonstration benefits from the two CP3 funds as a whole and also from the closure of individual first time funds and projects. The establishment of the CP3 platform is being watched closely by other donors and also if it can be shown that low carbon projects and adaptation projects are financially viable in one or more countries then more projects will follow. The individual projects should also drive changes in legislation in each country.
Technology Innovation: The leverage effects of CP3 will support the process of innovation and technological learning, which is expected to result in significant reductions in the cost of renewable technologies over time. However, given the geographical and sectoral diversification of the funds, and the expectation that they will be non-marginal due to the majority being invested into larger markets able to absorb the scale of funds, we anticipate that they will support the expected change in costs, rather than accelerate it significantly.lx As such, technological learning benefits will be in line with those improvements expected in global MAC curves and other studies. Within less developed markets, CP3 (and in particular the CF component) does have the potential to support the creation of efficient supply chains and to reduce the market barriers, potentially reducing costs significantly at a localised level. The extent of market congestion raising prices will clearly depend on the balance of supply and demand in each market segment. We have taken the view that the market will rebalance in the medium term, however, in practice there may be periods of scarcity

and surplus that cause a divergence between prices and underlying costs. CP3 will address this by investing a substantial proportion of its funds into upstream manufacturing and supply chain companies.
Jobs: While job creation in the private equity industry itself would be relatively small in terms of total numbers, the potential for job creation in the wider low carbon industries is significant. Data received from the monitoring and evaluation teams at the MDBs indicate that low carbon and private equity investments generate jobs on the basis of a ratio of 1 job per £25,000 invested. The MDBs looked at the jobs created in their previous climate portfolios and gave us the figures which we have used. In the central scenario, we have not sought to quantify the economic value of the employment effects, due to high degree of uncertainty relating to their potential to displace employment in traditional industries, and the difficulty in calculating net job growth, particularly in the long run. Further work may be undertaken during CP3 project implementation to strengthen the evidence base for the employment effects of green investment, particularly in relation to expected Gross Value Added for low carbon jobs against other areas of employment potentially displaced.
Health Benefits: The shift towards low carbon development has significant health developmental benefits in relation to reduced air pollution. While these might be measurable at household level, it is more difficult to estimate for large scale energy infrastructure investments, and they have therefore not been included.
Energy Availability: It is likely that the programme’s investment in low carbon generation will result in greater energy availability (in particular electricity). Within the central scenario, we assume that 50% of new capacity is additional to that envisaged in existing plans. These welfare benefits (assuming willingness and ability to pay) are valued in the central scenario on the basis of the long run variable cost of electricity. See the Table above for more detail on the extent to which these benefits are reduced to take account of potential losses or the users of the energy.
Energy Security: Greater levels of low carbon generation and improved energy efficiency have the potential to reduce reliance on volatile fossil fuel prices and increase domestic energy security. This has the potential to deliver significant economic benefits to both industry and national economies. Given the global nature of the programme, it is not proposed to value these benefits within the core CBA analysis.
Social appraisal Climate change affects the poor most
This project does not specifically aim at assisting the poor in the way that some other ICF projects do – for example off-grid energy access projects. Instead it aims at large-scale mitigation and having demonstration effect, thereby in the much longer term bringing more climate finance into even lower income countries. This is not to say that the poor are not indirectly assisted because it is undisputed that the poor will be those most affected the most by the impacts of climate change.
For example, the Brooks World Poverty Institute identifies that around 40 percent of the population of Bangladesh are poor people for whom a variable and unpredictable climate will critically restrict livelihood optionslxi. Similarly, research suggests that “India is home to a third of the world’s poor, and climate change will hit this section of society the hardest. Set to be the most populous nation in the world by 2045, the economic, social and ecological price of climate change will be massive.lxii” Climate change affects the basic requirements for maintaining good health: clean air and water, sufficient food and adequate shelter. Each year about 1.2 million people die from causes attributable to urban air pollution and 2.2 million from diarrhoea largely resulting from lack of access to clean water and from poor hygiene. Excluding more frequent and extreme storms, climate change is estimated to have been responsible for 3% of diarrhoea, 3% of malaria and 3.8% of dengue fever deaths worldwide in 2004. About 0.2% of total world deaths (including natural deaths)

were attributable to climate change, of which 85% were child deathslxiii.
Moreover, the impacts of climate change and restricted access to energy affect women and girls the most. The IPCClxiv, for example, confirms that “experience shows that vulnerability is differentiated by gender”, and the Food and Agriculture Organisation notes that “diverse impacts associated to natural disasters and environmental degradation affect with particular emphasis vulnerable populations, including women, children and the elderly, with the least access to essential and vital resources for recovery”lxv.
Impact of the CP3 Platform
Notwithstanding the fact that the project is not directly aimed at increasing energy access for the poor or otherwise directly benefitting the poor it is possible that there may be some specific positive developmental and social developmental benefits. These could include increase access to energy, jobs, as well as increased growth via additional Foreign Direct Investment, establishment of financial infrastructure, transfer of skills and know-how, wealth creation and health benefits. We will try to establish a baseline and then via the monitoring and evaluation process to monitor the impacts of the programme on the poor, particularly in relation to those at the bottom of the pyramid, as currently the evidence base for the linkages between general low carbon investment and poverty reduction is not conclusivelxvi. Adaptation and forestry-type investments are, by contrast, likely to have a larger social benefit component for the poor.
In energy access terms, typically many of the benefits from increased deployment of low carbon supply are likely to flow to the middle poor, industry and SMEs, rather than to bottom of the pyramid households (<2$/day), unless there are specific off-grid or grid-extension components. Prosperity benefits are therefore primarily realised through more reliable supply, reduced outages, and lower back-up costs for both residential and commercial use. Additional capacity tends to lead to the servicing of suppressed demand, rather than extension of access per se. Explicit access components may be included within CP3 where private sector investment in grid infrastructure is possible (i.e. through public-private partnerships), or where off-grid energy projects can be aggregated in such a way as to offer a viable investment opportunity but there is no guarantee of this. As part of our monitoring and evaluation framework, we will monitor energy access from a bottom of the pyramid perspective to develop the evidence base further.
As set out in the economic appraisal, the CP3 Platform will create jobs. Research by the United Nations Environment Programme’s (UNEP) Green Economy Initiative suggests that, globally, projected investments of USD $630 billion in the renewable energy sector by 2030 might translate into at least 20 million additional jobs – 2.1 million in wind energy, 6.3 million in solar photovoltaic (PV), and 12 million in biofuels-related agriculture and industrylxvii. However, jobs could also be lost as demand for products linked to the carbon intensive energy sector is likely to decline. While some of these additional jobs will be directly relevant to the poor (e.g. jobs in the green construction industry; energy efficiency, supply-chain and manufacturing jobs etc), the majority of the jobs are likely to benefit the poor only indirectly, by facilitating skills and know-how transfer as well as directly contributing to wealth creation.
This will be achieved in the following way: by building private equity fund capacity, and building up the funds’ expertise in low carbon investments, the CP3 Platform (and in particular the CF, which is more focused on funds rather than direct investments) will boost the private equity financial infrastructure in the developing countries. This, in turn, will help unlock the debt markets, strengthening the banking sector’s expertise in lending for low carbon, climate resilient projects. The overall deepening of the financial markets will contribute to job creation in the financial sector as well as skilled manufacturing and corporate jobs, as well as wealth creation, which will eventually translate into improved job opportunities and livelihoods for the poorlxviii.
Finally, it should be noted that the environmental, social and governance standards which will

apply both to funds operations and the individual projects (discussed in the Management Case below) will put in place best-in-class safeguards against any socially adverse impacts of CP3 Platform investments.
In summary, the CP3 Platform as a whole will deliver indirect positive developmental benefits for the poor. By recommending the ‘Balanced Option’ and including CF we are consciously broadening the impacts of the programme away from a direct GHG mitigation focus (which would concentrate equity investments in carbon intensive middle income countries) towards at least some activities in LDCs and the creation of innovative private equity funds in frontier markets such as Sub-Saharan Africa. The Risk Assessment section below sets out our proposed approach to tackling any risks that may arise in relation to delivering these poverty outcomes.
Political appraisal Context
As regards private finance, the international debate on climate change currently suffers from several constraints. Firstly, there is a concern that the developed countries would rely on private finance to avoid their public finance obligations. Secondly, there is a fear that private sector would engage in rent-seeking. Thirdly, there is a concern that private sector investment would bring benefits for the developed countries’ businesses, with little developmental benefits for the local communities.
Beyond the climate negotiations, but no doubt contributing towards the scepticism concerning the role of private finance in low carbon development, there is a genuine lack of examples of successful public-private financing mechanisms in the field of low carbon development aside from the MDBs, delivering significant private finance leverage, emissions reduction and developmental benefits. The key examples are limited to projects financed through the Clean Technology Fundlxix and the investment portfolios of the IFClxx and the EBRDlxxi. As far as funds providing upfront financing are concerned, the examples are even more restricted, the only two relevant initiatives being the EU’s Global Energy Efficiency and Renewable Energy Fund (GEEREF)lxxii and the German Global Climate Partnership Fundlxxiii. Neither of these have leveraged private finance at the top level. The German Global Climate Partnership Fund is largely focused on debt instruments (and therefore complementary, and not contradictory to the CP3 Platform).
While the Clean Development Mechanism (CDM) has played a key role in channelling financing to low carbon development in the developing countries, a significant majority of this financing has been absorbed by projects in India and Chinalxxiv. This has contributed towards undermining the credibility of mechanisms aimed at mobilising private finance in the eyes of other developing countries.
Impact of the CP3 Platform Investing in CP3 Asia alone would help address some of the constraints outlined above.
Firstly, it would help demonstrate the efficiency of delivering emissions reduction at scale, and the associated developmental benefits of increased access to energy, improved energy security and health through public-private financing mechanisms. In doing so, it would help bring on board the governments of India and China, where a significant proportion of CP3 Asia’s investments is expected to go, demonstrating to them the value of both low carbon development, and achieving it with the close cooperation of the private sector. The buy-in from India and China, in turn, would help mainstream the priorities of private sector cooperation in low carbon development among the G77 countries and therefore push forward the global effort on the climate debate.
Focusing on Asia alone would, however, limit the demonstration effect of the programme and would miss the opportunity to broaden the scope of current financial flows into regions where investment is currently lacking (for example, UNEP estimates that Africa accounts for just 2.6% of

all CDM projects )lxxv and IFC estimates Africa has less than 5% of private equity). By supporting CF (bearing in mind its global geographical remit), we will additionally demonstrate that low carbon investments are commercially viable not only in India and China, but also in other regions, including Latin America and, importantly, Africa. This, in turn, will help shift the international debate away from concerns about private finance substituting developed countries’ public finance obligations, and rather towards maximising the value of public finance through leverage of private resources.
Investing via the two Funds in the Platform will also help address two further constraints. Firstly, because the UK’s and other public sector investors’ financing will be on pari passu commercial basis, financial concessionality being present only at the TAPDF level, the Platform will minimise the risk of rent seeking from the private sector and will help demonstrate the value for money of public-private cooperation. Secondly, both Funds will benefit the local private sector, directly through job creation and indirectly through consolidation of the local financial infrastructure, thus minimising the risk of dislocation of benefits to the developing countries.
TABLE BELOW IS FOR CP3 ASIA

D. Comparison of options Based on the critical success criteria, and the economic, social and political appraisal, the following ranking is
given to the options under consideration.
Analysis of options against Critical Success Criteria (CSC) Option 1: Scale Option 2:
Development Option 3: Balanced Option 4: Do Nothing
CSC Weight (1-5)
Score (1-5)
Weighted Score
Score
Weighted Score
Score Weighted Score
Score Weighted Score
Leverages donor funds to deliver climate relevant investment at scale
5 4 20 3 15 4 20 1 5
Builds institutional private equity fund capacity for both mitigation and adaptation type investments
5 3 15 4 20 4 20 1 5
Maximises GHG reductions in large carbon intensive economies
4 4 16 3 12 4 16 1 4
Supports resilient low carbon growth pathways for a wider range of developing countries (including some lower income countries)
4 3 12 4 16 4 16 1 4
Totals
63 63 72 16
E. Measures to be used or developed to assess value for money The value for money (VFM) agenda has been integrated into the programme design.
Economy/Efficiency The programme has been designed based on the potential leverage effectiveness of a fund of funds vs. direct investments, and a comparison of these against other forms of programmatic delivery: The fee structure and programmatic costs of CP3 options have been compared with alternative structures that might provide the same level of sector and geographic reach. This has been supported by competitive bidding for fund management activities, and a comparison of management fees against industry benchmarks. See the Commercial and Management cases below.
Effectiveness The business case has been developed on the basis of a theory of change (see diagram after the initial summary), with evidence in the strategic case setting out demonstrating the market failure and the potential role of private equity in helping to meet the climate change financing gap.
Programme effectiveness is being benchmarked against a range of output indicators (see Evaluation and Logframe), to include:
Ability to mobilise private investment at scale at the fund of funds level in climate relevant projects/companies;
Capacity to develop sustainable private equity infrastructure via incubation of at least 15 funds;
Mainstreaming of ESG indicators;
GHG emissions avoided/reduced;

Energy savings;
Increase in clean energy installations;
Green jobs created;
Working with the MDBs and fund managers, the business case has modelled potential i.e. hypothetical investment portfolios under CP3 Platform. These model hypothetical portfolios include low carbon and adaptation type investments across a range of geographies. Sensitivity analysis has been used to assess the implications of significant changes in carbon price, discount rate and
During programme implementation, a number of indicators will be tracked in order to develop the evidence base for developmental benefits of low carbon investment. These indicators include:
Green Jobs: While the CP3 platform will generate a significant number of new jobs in the climate change industries, it is less clear to what extent these will displace existing jobs, or to what extent these will be higher or lower value jobs that those potentially on offer in other industries. Further work will be done to assign economic values. Energy Access: Even though this is not the main aim of the project, the evaluation methodology will assess mid-term to what extent generic low carbon investment supports access to energy to communities currently underserved, with a view to developing proxy assumptions for future investment use between the relationship between renewables investment and poverty alleviation.
Forest Carbon: The amount of forestry investments will be tracked.
The Monitoring and Evaluation case below sets out how tracking progress against all the indicators will be achieved in practice. It should be highlighted here that fund managers/project developers can only be requested to report against a limited number of indicators (such as financial performance, carbon savings and energy installed), and that the tracking against additional development indicators listed here will need to be commissioned and financed externally (e.g. via the TAPDF facility), as the Monitoring and Evaluation case below explains.
Commercial Case A. Clearly state the procurement/commercial requirements for intervention Please see the analysis under the heading “Indirect Cost” below. C. How do we expect the market place will respond to this opportunity? Please see the analysis under the heading “Indirect Cost” below. D. What are the key underlying cost drivers? How is value added and how will we measure and improve this? Please see the analysis under the heading “Indirect Cost” below. E. What is the intended Procurement Process to support contract award?
Please see the analysis under the heading “Indirect Cost” below. F. How will contract & supplier performance be managed through the life of the intervention? Please see the analysis under the heading “Indirect Cost” below.

Indirect cost A. Why is the proposed funding mechanism/form of arrangement the right one for this intervention, with this development partner? Managing the UK’s investment into the CP3 Platform directly through the government departments would not be the best use of taxpayers’ money, as we do not have the expertise or the human resources required to undertake investment management activities. While this could have been done through CDC at the time of scoping this intervention CDC was in a process of change. Consequently, the two organisations we will be working with for the purposes of the CP3 Platform are the Asian Development Bank (AsDB) and the International Finance Corporation (IFC). Contributions to these two organisations count as ODA. The key reasons for identifying the two organisations as the right partners for this intervention are explained below, as is the choice of the Private Infrastructure Development Group (PIDG) for managing the UK’s contribution into the Technical Assistance and Project Development Facility (TAPDF) and carrying out monitoring and evaluation. Third Party Organisation (TPO) assessment: AsDB
The CP3 Asia Fund which will form part of the CP3 Platform will be focused on Asian investments. Specifically, it will aim to achieve scale in low carbon infrastructure in India, China and the rest of developing Asia through direct investments as well as strengthening of financial private equity infrastructure through funds investments. In selecting a partner which would manage the UK’s investment for the CP3 Asia Fund, therefore, we had to focus on regional presence, direct and indirect low carbon investment expertise, as well as the general track record in the field of development impact.
AsDB is a multilateral development bank, dedicated to reducing poverty in Asia and the Pacific
region through inclusive economic growth, environmentally sustainable growth, and regional integration. AsDB was established in 1966 under the Agreement Establishing the Asian Development Bank (Charter), which is binding upon the member countries that are its shareholders. As of 31 December 2010, AsDB had 67 members, of which 48 were drawn from Asia and the Pacific region. The UK is a shareholder of the AsDB. AsDB is headquartered in Manila, Philippines and has offices worldwide including representative offices in North America (Washington, DC), Europe (Frankfurt), and Japan (Tokyo). AsDB provides loans, technical assistance, and grants to its developing member countries. It also invests in the private sector to help mobilise funds from other sources by mitigating investment risks. On 29 April 2009, an overwhelming majority of AsDB’s 67 member countries endorsed the fifth general capital increase, tripling AsDB’s capital base from USD $55 billion to $165 billion.
In the Multilateral Aid Review (MAR) that DFID undertook in 2010, AsDB received the highest
score possible- 4 on a scale of 4. AsDB was found to play an important role in facilitating regional growth in Asia, was focused on innovation and the private sector, and was committed to working in the low income countries. Specifically, it was found to be taking a leading role in promoting low carbon economic growth, renewable energy and private sector finance for climate change in Asia and the Pacific. AsDB has been making investments in low carbon and resource efficiency sectors since 2003 and has invested over USD $113 million in 8 funds and $50 million in direct equity investments as of December 31, 2010. AsDB’s fund investments that are comparable with the CP3 strategy have generated an aggregate underlying fund net return of 18.2% and have an average holding period of 3.5 years, as of December 31, 2010lxxvi.
CP3 Asia fits very closely into AsDB’s strategic direction of travel. AsDB’s 2020 Strategylxxvii
outlines the Bank’s determination to have, by 2012, 80% of its activities focused on 5 core

investment areas, 3 of which overlap with the remit of the CP3 Asia Fund, namely: infrastructure investment, environmental investments including climate change, and financial sector development. Moreover, the 2020 Strategy commits the Bank to move towards at least 50% or its annual operations being private sector-focused by 2020; again, CP3 Asia will help the Bank achieve its objectives.
It is proposed that the UK’s contribution to the CP3 Asia Fund (namely, £60m) will be given on trust to the AsDB to manage perhaps through a promissory note. Trust funds have been used extensively in the context of development financing generally and by MDBs in relation to managing individual donor financing specifically. For the UK, and our stakeholders, the trust fund route will help ensure that our investment into CP3 Asia is channelled via an organisation we trust to deliver the right results and avoid inefficiencies. From AsDB’s point of view, the trust fund route will help coordinate the UK’s and AsDB’s own equity investments. While the Bank will charge a regular fiduciary management fee, we will negotiate to ensure the fee is as low as possible to deliver best value for money for the taxpayer. It was recently quoted at 0.6%. The Financial Case below sets out more detail on donor trust fund management through the MDBs.
We are confident that the Bank is prioritising anti-corruption practices. In 2009, the Bank separated the audit and integrity functions into the Office of the Auditor General (OAG) and the Office of Anticorruption and Integrity (OAI). OAI reports to the Board and is backed up by transparent policies on whistle blowing and witness protection. AsDB has also undertaken a programme of awareness and anti-corruption orientation across Bank stafflxxviii.
TPO assessment: IFC
CF will be global in scope and will be focused primarily on fund investment, although a small part of the Fund’s investments will go directly into projects. The institution appointed to manage the Fund will therefore need to have global presence and regional expertise, as well as have a sound track record of fund investing, improving financial infrastructure and stimulating low carbon investment in developing countries, while being focused on both commercial and developmental outcomes.
Analysis of the options for appointing the Fund manager for CF and channelling the UK’s
contribution to the CF identified the IFC as the right institution. The IFC, part of the World Bank Group, is the largest Development Finance Institution (DFI), making up c.38% of global DFI investments and it is the only multilateral DFI with a global reach. The UK has a 5.11% shareholding in IFC (which will fall to 4.71% following implementation of the recent selective capital increase). IFC’s mandate and delivery are tightly focussed on private sector development, job creation and economic growth, both through investment activities and advisory services to support businesses and develop the enabling environment. IFC has more than two decades of experience in supporting emerging market PE funds. Since 2000, IFC has made commitments to 124 PE funds across the global emerging markets, for an aggregate $2.0bn While traditional practice in evaluating private equity funds suggests that prior track record is the best guide of future performance, IFC has adapted to the reality that a majority of emerging market private equity funds are run by first-time managers, by developing systematic procedures and disciplined processes to evaluate such managers. Since 2008 IFC has applied this expertise to selecting climate-focussed funds, investing in 12 such funds to date (See paragraph 175 below for IFC’s Fund Selection Criteria). CF represents an extension and acceleration of IFC’s focus on climate private equity funds. The MARlxxix assessed the IFC’s contribution to meeting the UK’s international objectives as scoring 3 out of 4 (“satisfactory”).
Furthermore, the IFC has played a key role in promoting low carbon investments in the developing

countries. IFC’s new climate change investments reached $1.7 billion in 2010 (13% of new commitments) compared to $1 billion in 2009 (10% of new commitments). IFC’s intended 2013 Development Goal is to reach 20 to 25% of the portfolio. Through its wholly owned subsidiary, the IFC Asset Management Company (IFC AMC), moreover, the organisation has recently moved into mobilising and managing third-party (including private sector) capital. IFC AMC funds are open to investors such as governments, pension funds, sovereign wealth funds, institutional investors and others that have never before had access to IFC’s pipeline. IFC AMC currently serves as fund manager for four investment funds: (i) IFC Capitalization Fund; (ii) Africa Capitalization Fund; and (iii) IFC African, Latin American and Caribbean Fund.
In summary, there is a close fit between the CF priorities (incubation of private equity funds and consolidation of financial infrastructure for low carbon development across the developing regions) and the unique expertise that the IFC and the IFC AMC have in this space.
On that basis, it is proposed that the UK’s financial contribution to CF (£50m) is going to be
channelled through a donor trust-fund with the IFC (please see above re a trust fund arrangement for the CP3 Asia Fund). As with AsDB, we will ensure we negotiate down the fiduciary fund management fee as far as possible to ensure best value for money.
The above analysis suggests that IFC AMC is uniquely placed to carry out this role in a way which
delivers value for money (please see below for more detail).
IFC as a whole prioritises anti-corruption practices. As of January 1, 2007, IFC has been applying a policy of combating fraud and corruption for new investment financing, as well as technical assistance and advisory projects. Specifically, procedures apply to technical assistance agreements, and to investment projects for which IFC has committed financing or issued a guarantee. This sanctions approach is part of a larger effort to combat fraud and corruption. In implementing the new procedures, IFC has worked with the World Bank Group’s Institutional Integrity Vice Presidency, which is charged with investigating such allegations involving IFC, World Bank, and MIGA projects, as well as allegations of staff misconductlxxx. The IFC’s anti-corruption practice has been assessed as “excellent” by the MAR.
Third Party Organisation (TPO) assessment: PIDG2
the The proposed Technical Assistance and Project Development Facility (TAPDF) will provide
grants (for general country/regional studies, pre-feasibility studies, environmental and social benefit analysis’ studies designed to maximise pro-poor and developmental impacts etc) as well as non-grant concessional support (for feasibility studies; costs associated with the incubation of new private equity funds; costs associated with negotiating and structuring private equity deals; fund management capacity building etc) for the funds and investee funds within the CP3 Platform. The UK will be providing up to £20m to the TAPDF over the lifetime of the CP3 Platform.
In deciding which institution was the right one for channelling the UK’s financing for the TAPDF,
we appraised several options, including:
Setting up a new institution dedicated to running the TAPDF facility; Using existing technical assistance delivery mechanisms within the AsDB and IFC to channel the TAPDF financing; and
2 Since this Business Case was finalised, PIDG has indicated it will not run the TAPDF facility so an alternative arrangement is being designed for the management of the Technical Assistance.

Opening a new window within the Private Infrastructure Development Group (PIDG).
We have identified the PIDG as offering the optimal route for channelling the UK’s financing for the TAPDF for reasons set out below.
PIDG is a multi-donor organisation which facilitates private investment in the infrastructure sector
in developing countries, with the objectives of promoting economic growth and reducing poverty. PIDG seeks to achieve these objectives by establishing projects and investment vehicles which encourage such investment, maximising private sector efficiencies and the wider availability of private capital. Other key aims include additionality of the PIDG initiatives in the infrastructure market, capacity building, sustainability and value-for-money. At the core of PIDG initiatives is a belief that infrastructure is important to sustainable development and the reduction of poverty and that private sector investment is an essential element to increasing the provision of infrastructure services.
PIDG delivers its programme through a range of funds and facilities, each of which has been
designed to address a specific constraint and/or market failure seen as inhibiting increased private sector investment in the infrastructure of target developing countries, including vehicles focused on infrastructure financing, guarantee provision, project pipeline strengthening etc. Of greatest relevance to what is envisaged through TAPDF is the existing PIDG TA Facility (TAF), which provides grant financing for capacity building relating to PIDG activities. In addition, InfraCo Africa and InfraCo Asia focus on early project development to improve the infrastructure project pipeline in their respective regional jurisdictions.
Both DFID and the IFC are currently full members of the PIDG. The AsDB has provided a grant of
US$1 million to the TAF, has been accorded ‘Special Observer’ status at meetings of the PIDG Governing Council and is actively considering opportunities that will accord it full membership.
Consequently, there appears to be a close fit between the objectives of the TAPDF on the one
hand, and the institutional expertise, management structure and donor membership of the PIDG, which is why the PIDG was singled out as the best delivery channel for TAPDF financing3.
B. Value for money through procurement AsDB Procurement
Both the AsDB and the IFC were scored 3 out of 4 (satisfactory) for their procurement policies in the MAR. The key criticisms identified in relation to the AsDB were that the procurement principles imposed high transaction costs, delays and did not in all circumstances achieve competitive prices. However, the MAR also felt that the likelihood of positive change was high in relation to AsdBlxxxi. The procurement rules of the AsDBlxxxii will not be described here in greater detail, as AsDB will be a conduit of the UK’s contribution to the CP3 Asia Fund and therefore the Bank’s procurement rules will be of limited relevance.
One of the innovative features of the CP3 Asia Fund is that the Fund (and therefore the UK’s
contribution channelled through the AsDB trust fund) will be managed by a private sector entity
3 Since this Business Case was approved PIDG has indicated that it no longer wishes to manage the TAPF so it will most likely be allocated directly to IFC and AsDB.

which will establish a joint venture with AsDB. The reasons for adopting this innovative structure are twofold. On the one hand, market sounding suggested that private sector investors would be reassured by a presence of a private sector Fund manager whose incentives were aligned with those of the Fund. On the other hand, we were keen to ensure that the Fund manager should demonstrate cost-effective ways of working by capitalising on private sector efficiencies while benefitting from the oversight and developmental agenda that an organisation such as AsDB would provide.
In order to ensure that the best private sector operator is chosen to manage DFID’s (and others’)
investments and therefore that the best outcome for the tax-payer is secured, DFID worked with AsDB (who was in charge of procuring the Fund manager’s services) to ensure that a stringent procurement process for the CP3 Asia Fund manager was adhered to. Specifically, the procurement exercise consisted of a desk-top review of the long-list of potential candidates, 40 of which were rated on a set of criteria. The main criteria were (i) overall track record, (ii) Asia Pacific exposure, (iii) infrastructure investment experience, (iv) direct investment capacity, (v) Limited Partner and General Partner (LP/GP) network, (vi) fundraising capacity, (vii) ability to design a strategy with high development impact (technology and skills transfer, jobs, etc), (viii) experience in ESG and working with public institutions.. The second stage included a detailed consultation with 8 down-selected funds, which were appraised on their overall track record, Asia exposure, infrastructure investment experience etc. The short list of 3 parties was then interviewed in person and rated against their institutional background, track record, partnership with public institutions etc. Extensive due diligence was carried out in relation to the preferred candidate. The process was carried out in the course of winter 2010/11.
The preferred candidate selected through the above procurement process, Credit Suisse’s Customized Fund Investment Group (CFIG), is one of the largest and deepest investment teams dedicated to private equity investing. It is a wholly owned subsidiary of Credit Suisse. As of December 31, 2010, CFIG managed over $27 billion in commitments to private equity funds of funds and co-investments, both in the United States and internationally. CFIG has over 200 energy focused professionals globally, with 43 professionals located in Asia, and has an extensive track record of low carbon fund investmentslxxxiii. CFIG will bring to the table its in-depth private equity fund management expertise, its brand, research arm, fund and project pipeline and experience of the private equity markets in Asia, previous experience in working with public entities and investors It also has a strong investment banking and client base in Europe, Asia and North America. As such, it is likely to attract significant institutional investor interest in CP3 Asia. At the same time, by partnering with the AsDB in the joint venture, CFIG are looking to access AsDB’s policy dialogue, regulatory support, risk mitigation and project financing, which will help to deliver the CP3 Asia Fund’s objectives.
Importantly, in the context of the value for money discussion, CFIG has committed to put in a
$50m of Credit Suisse’s financial assets into the CP3 Asia fund to ensure interest alignment. This is a material amount and required separate Credit Suisse Board approval. Moreover, they have shown flexibility on fees and carry, which makes their proposal competitivelxxxiv.
IFC procurement
The MAR assesses IFC (and therefore its subsidiaries, such as the IFC AMC) as good value for money for DFID, having the size and global reach to be a critical player in the DFID corporate priority of private sector development with significant advisory and investment capacity. As far as procurement is concerned, the MAR finds that the IFC’s “strong procurement guidelines, evaluation and audit processes suggest that it is cost effective”lxxxv.
PIDG procurement
There are two aspects to PIDG procurement that are of relevance to the value for money agenda.
First of all, it is important to understand how the choice of PIDG as the delivery mechanism for the TA ensures value for money. Secondly, it is important to briefly consider PIDG’s own procurement rules, which will apply as and when the PIDG tenders out the TAPDF financing.
Channelling the UK’s technical assistance financing for the CP3 Platform through the PIDG
will satisfy our value for money agenda for the following reasons. First of all, the existence of programmes such as the TAF within the PIDG means that the TAPDF will be set up efficiently, avoiding the time delays and administrative expenditure that establishing a new facility would inevitably entail. The presence of other donors also means that additional financing will be more easily mobilised. The existing management structure, in which all three organisations (DFID, IFC and AsDB) already participate, will help avoid added bureaucracy and management layers. Significant track record in designing public-private partnership deals within the PIDG means the in-house expertise will be leveraged for the purposes of the Funds.
PIDG’s procurement practices can best be understood in the context of its overall management
structure. PIDG operates through a Governing Council, the PIDG Trust and a Programme Management Unit (PMU). The Governing Council is the decision-making body of the PIDG and consists of representatives of all the PIDG members. PIDG members provide grant and loan funding to the PIDG Trust, which invests in the companies and facilities that it creates. The Governing Council appoints the PMU to manage its activities. As PIDG is not a legal entity in its own right, it has established the PIDG Trust to own the programmes and perform many of its functions. Moreover, as it is not a legal entity, the PIDG cannot run its own procurement, which is consequently undertaken either by the members or by the PMU, as appropriate. In the latter case, stringent procurement rules apply, as set out in the PIDG Handbooklxxxvi. The rules include a provision that any contract over US$75,000 will require PMU to consult with the Governing Council as well as to go through the Official Journal of the EU (OJEU) notice procedure (if required) and follow the restricted tender process, culminating in the Governing Council approval
It should be noted here that TAPDF financing will be available to the CP3 Fund managers, the CF Fund managers and other PIDG facilities as well as the broader private sector stakeholders whose projects may eventually seek investment from the Platform. This strikes a balance between prioritising the two funds in the CP3 Platform while also ensuring that strong projects originating outside the Platform gain access to technical assistance funding, thus strengthening the project pipeline that the Platform could support.

Financial Case A. How much it will cost
The following payments are planned under the programme:
£60,000,000 as investment into the AsDB-led CP3 Asia Fund; £50,000,000 as investment into the IFC-AMC led CF Fund; and Up to £20,000,000 as investment into the TAPDF which would include £1m towards Evaluation (see Evaluation and Monitoring below)
(Total programme spend: £130,000,000).
Programme development:
programme management for DFID £104,201.94 for scoping work, Nathan EME, over 2010-
11; specialist technical advice to DFID – AsDB – IFC consortium for high level design of the
CP3 Fund, SDCL, £85,000 (agreed in 2010); specialist technical advice to DFID – AsDB – IFC consortium re. fund raising strategy,
SDCL, £28,000, expandable to £58,000 depending on scope of work (agreed in 2010); specialist technical advice to DFID on private equity financial structuring issues, GBRW,
£67,700 (agreed in 2010); specialist legal advice to DFID and support to the PIDG TA facility creation, CA Legal,
£69,500 (agreed in 2011).
Total programme development spend to date: £384,401.94. Please note that additional legal advice from specialist funds lawyers and specialist technical advice from GBRW might be needed once the negotiations of Funds documentation commence. Projected additional project development expenditure: up to £100,000. Total programme spend: up to £485,000. More specifically,
Programme development contract (1) covers programme management for DFID, including liaising with different parts of DFID and with HMG, conducting underlying evidence base analysis and liaising with external stakeholders;
Programme development contract (2) covers initial scoping work, including the high level design of a proposal for the CP3 Platform, including development of a Heads of Terms laying out the objectives, management and corporate governance structure and policy of the Funds;
Programme development contract (3) covers fund-raising advice, building on the previous work done by the consultant for the project and capitalising on the consultant’s networks and relationships in the institutional investor industry;
Programme development contract (4) covers specialist investment advice to DFID on topics of fund raising, private equity and fund management and assistance to DFID with the procurement of a fund manager, conducting due diligence etc, which require specialised track record of fund management and public procurement;
Programme development contract (5) is to provide specialist structuring advice on the technical assistance and project development facility forming part of the CP3 Platform structure, as well as general legal advice on documentation relating to the setting up of the CP3 Platform.

B. How it will be funded: capital/programme/admin It is anticipated that £130,000,000 will be almost entirely capital spend (with the exception of a maximum of £800,000 which will be programme spend i.e. lawyer spend, the salary payments for a PIDG PMU officer(s) tasked with managing the TAPDF and potentially some monitoring/indicator collection work via this or another officer(s)). The table below sets out the proposed annual split. Programme development will be fully programme funded.
Year 2011/12
£ m 2012/13 £m
2013/14 £m
2014/15 £m
Total £m
CDel CP3 Asia - DECC
20 10 - Total CP3 Asia Fund UK Gov spend 60
CP3 Asia - DFID
15 15
CF - DECC
24 16 Total CF UK Gov spend 50 CF – DFID 104
TAPF DECC 3.2 6.4 Total TAPF UK Gov Cdel spend19.2
TAPF DFID Cdel
3.2 6.4
TAPF RDel (DFID only)
Up to 0.2 Up to 0.2 Up to 0.2 Up to 0.2 UK Gov Rdel 0.8
130
C. How funds will be paid out Capital spend
With the exception of the grant to the PIDG Trust, described below, UK’s investment will be channelled through individual trust funds to be set up with the AsDB and the IFC. It is currently not envisaged that these will be multi-donor, although that option is not ruled out and will be revisited following discussions with other donors, if relevant. The proposed trust funds will follow the usual donor trust fund practice (please see the next paragraphs). Money will be placed in an interest-bearing account; interest received will be used towards paying the fiduciary fund management fee (which we will negotiate down to the extent possible).
The UK’s contributions (from DfID and DECC) will be paid directly to the trust funds as
grants . The AsDB and IFC, respectively, will draw down on the trust accounts in accordance with a pre-agreed schedule (likely to involve a series of draw-downs scheduled to minimise the amount of finance held unused in Trust Accounts).
IFC’s management of donor trust-funds
IFC applies the same standard of care in managing the donor resources it receives as to 4 Shortly after approving this Business Case it was agreed that the actual disbursements would be slightly different to reflect likely closure and drawdown timings.

IFC's own resources. To meet this standard, IFC applies the same procedures and processes to donor-funded investments that IFC applies to investments supported by its own funds. The donor funds are invested in compliance with IFC's investment policies and follow the same procedures and guidelines as for IFC's own investments of a similar nature. The same risk management policies (e.g. environmental and social; anti- corruption; anti money laundering; integrity due diligence; operational and financial risk management) and integrated risk management framework apply to donor funds as to IFC's own funds.
Investment agreements on donor-funded investments between IFC and clients are based
on those used by IFC for investments using IFC's own funds. IFC enters into an investment agreement in its own name, but for the ultimate account of the donor. IFC is neither entitled to the interest on the proceeds of, or returns from, investments, nor bears any financial risks with regard to commitment and repayment of the donor-funded investments.
All of the monies held in trust by IFC are treated in accordance with the policy outlined
above, and funding received in support of the CF will be treated in the same mannerlxxxvii.
AsDB and donor trust funds
Similarly to the IFC, AsDB does not manage all donor funds in the same pool; rather, it develops segregated investment strategies for specific funds according to cash flow requirements. Donor trust funds follow overall AsDB’s investment guidelines in terms of credit and exposures that are monitored by the Office of Risk Managementlxxxviii.
TAPDF window in the PIDG
Funds will be transferred directly to the PIDG Trust under a Letter of Agreement which will set out the approved uses of the grant and the monitoring/accounting arrangements. Financial reporting will be the same as for the Funds.
Programme spend
Programme development costs to be paid in accordance with individual contracts with payment against project milestones.
Overseas Development Assistance (ODA)
We have sought legal advice from CA Legal LLP, and have confirmed that despite its non-concessional nature, HMG’s equity contribution to the Funds will become positive ODA at the time of transfer to an AsDB/IFC trust fund, as the transfer will be in the form of a grant and AsDB/IFC are ODA eligible institutions. The Funds are expected to generate commercial returns To ensure the returns do not come back as negative ODA, the reflows will be allocated to future developmental programmes with the methodology for this to be agreed in the trust fund documentation. CA Legal has confirmed that this is the correct approach to take and is a widely used arrangement (see box below for a PIDG example). Options for reflow re-utilisation include setting up a new fund (which might be for lower income countries), and/or boosting the TA facility. We will make sure that we specify upfront our discretion to reapply the unspent trust funds including any proceeds or

have them returned to HMG for ODA use. It should be noted that it may be up to 7 years before there are any reflows.
Dealing with reflows in the PIDG
Under the various funding agreements that the UK and the PIDG companies (and the other members of PIDG) are a party to (and in accordance with the PIDG Constitution), if the PIDG Trust receives any proceeds from its shareholdings that are funded by the UK (i.e on the payment of any dividends or if a PIDG company is wound up), the PIDG Trust may recycle these for other developmental purposes in consultation with DFID. If this does not happen within two years of the proceeds being received by the PIDG Trust, they (or any unspent portion thereof) will be returned to DFID. Such returns would not be treated as negative ODA if recycled within the PIDG.
Legal advice has confirmed that the grant to the PIDG TAPDF will count as ODA. Any repayments of loans or other reflows will be reutilised for Technical Assistance to ensure their positive ODA scoring. State Aid and PIDG/Technical Assistance DFID has sought Legal advice from CA Legal and external counsel (barrister) with regard to the State Aid issues relating to the Technical Assistance. The advice was that this is not likely to be prohibited (incompatible) EU State Aid because it seeks to address market failures (see above) in developing countries. A
Financial safeguards Losses within a project investment or sub-fund
Direct investments or sub-fund investments will usually be into a special purpose vehicle. For example a project company is usually set up dedicated to the wind farm, solar investment etc or for the upstream clean tech investments. The top fund (if it is a direct/co-investment) or the sub-fund will take equity in this project company. If the project company fails then the secured debt-holders will be paid first in whole or in part, followed by employees (depending on local insolvency priority rules) and trade and unsecured creditors. The equity holders are the last to be paid as this is the highest risk (and often highest return) form of investment so in practice may suffer material or total loss. This has occurred recently in investments such as Solyndra where for example PE funds such as Virgin’s collectively are alleged to have lost approximately $1bn.lxxxix Because of this risk, PE funds will only ever invest up to a limit (usually a maximum of 25%) in the sub-fund or project in order to diversify their risks. Based on a brief review of IFC’s portfolio (ignoring the years of 2008 and early 2009 which are regarded as exceptional) we have estimated that between 10 and 15% of investments will return less than their capital. However some project investments will deliver more than the anticipated returns (for example 30%) and these smooth out the losses, delivering the average anticipated return.
Losses in the top level fund
The Limited Partnership Agreements for each Fund will set out liability arrangements in case of investment failure. The standard private equity procedure in a PE fund is that losses are shared among investors pro-rata, depending on the size of their commitment to the Fund. If one of the Funds invests into a project/company which the UK has stated it will not support (e.g. a China/India or Russia investment via CF), then any losses experienced in relation to that investment will not affect the UK’s finances. The UK’s

liability is limited to the sum of the UK’s Commitment and any reflows or returns.
Hurdle As explained below in the section on Fees, the Fund Managers also carry part of the risk of losses. If the Fund returns less than a specified amount above the capital (referred to as “the hurdle rate”), then the Fund Managers will only receive their Management Fee but no “carry fee”. The carry fee is only a reward fee for performing above the annual return on capital (or hurdle) agreed with the fund managers.
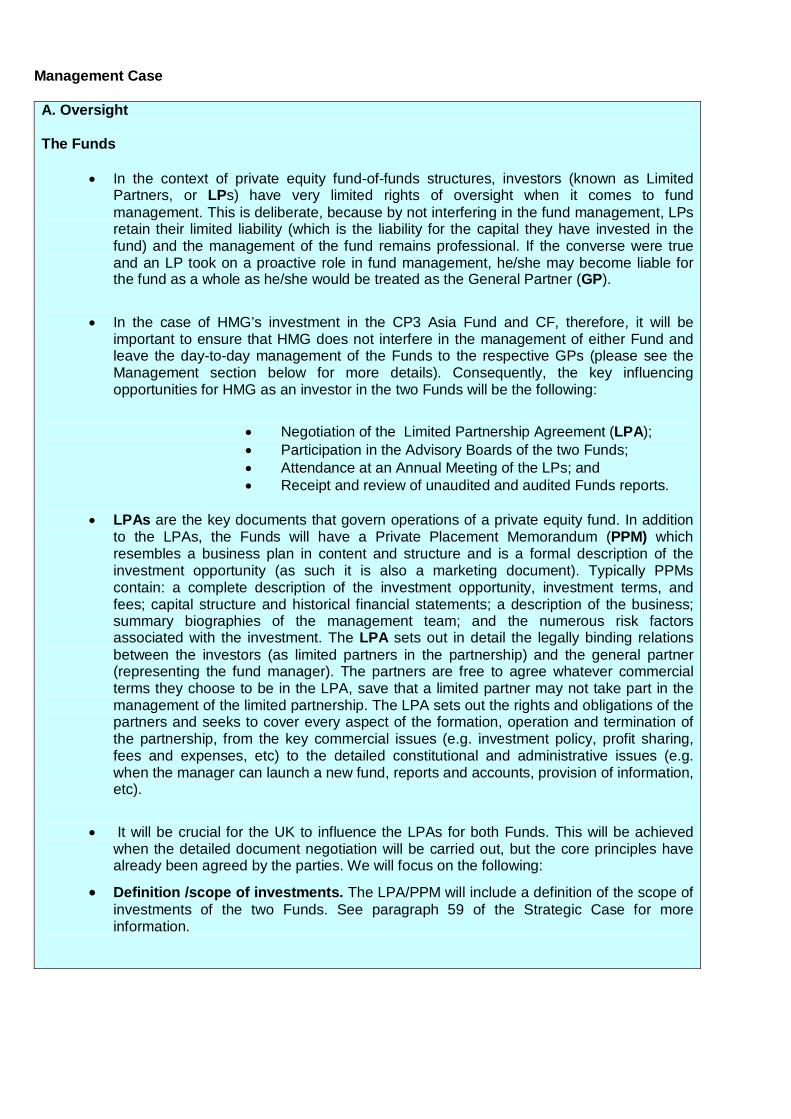
Management Case
A. Oversight The Funds
In the context of private equity fund-of-funds structures, investors (known as Limited Partners, or LPs) have very limited rights of oversight when it comes to fund management. This is deliberate, because by not interfering in the fund management, LPs retain their limited liability (which is the liability for the capital they have invested in the fund) and the management of the fund remains professional. If the converse were true and an LP took on a proactive role in fund management, he/she may become liable for the fund as a whole as he/she would be treated as the General Partner (GP).
In the case of HMG’s investment in the CP3 Asia Fund and CF, therefore, it will be
important to ensure that HMG does not interfere in the management of either Fund and leave the day-to-day management of the Funds to the respective GPs (please see the Management section below for more details). Consequently, the key influencing opportunities for HMG as an investor in the two Funds will be the following:
Negotiation of the Limited Partnership Agreement (LPA); Participation in the Advisory Boards of the two Funds; Attendance at an Annual Meeting of the LPs; and Receipt and review of unaudited and audited Funds reports.
LPAs are the key documents that govern operations of a private equity fund. In addition
to the LPAs, the Funds will have a Private Placement Memorandum (PPM) which resembles a business plan in content and structure and is a formal description of the investment opportunity (as such it is also a marketing document). Typically PPMs contain: a complete description of the investment opportunity, investment terms, and fees; capital structure and historical financial statements; a description of the business; summary biographies of the management team; and the numerous risk factors associated with the investment. The LPA sets out in detail the legally binding relations between the investors (as limited partners in the partnership) and the general partner (representing the fund manager). The partners are free to agree whatever commercial terms they choose to be in the LPA, save that a limited partner may not take part in the management of the limited partnership. The LPA sets out the rights and obligations of the partners and seeks to cover every aspect of the formation, operation and termination of the partnership, from the key commercial issues (e.g. investment policy, profit sharing, fees and expenses, etc) to the detailed constitutional and administrative issues (e.g. when the manager can launch a new fund, reports and accounts, provision of information, etc).
It will be crucial for the UK to influence the LPAs for both Funds. This will be achieved
when the detailed document negotiation will be carried out, but the core principles have already been agreed by the parties. We will focus on the following:
Definition /scope of investments. The LPA/PPM will include a definition of the scope of investments of the two Funds. See paragraph 59 of the Strategic Case for more information.

Integration of Environmental Social and Governance (ESG) requirements into the documentation. Specifically, the AsDB and the IFC have committed to the integration of their ESG requirements into the Funds documentation. For the IFC, this means the IFC Environmental and Social Performance Standardsxc, which are the leading ESG standards developed for the private sector and are generally supported by the donor community (including the UK). For the AsDB, this means integration of the AsDB Environmental and Social Management Systemxci into the Fund documentation. The System was developed on the basis of the IFC Performance Standards, which will help ensure consistency of standards across the two Funds. We have reviewed these standards which include safeguards for population, culture, etc. Other Environmental concerns AsDB and IFC also have specific environmental
safeguards in the area of water. For example AsDB has a specific climate resilient check for each project. As low carbon projects often affect water it should be noted that AsDB has a specific water policy, Water for All (2003) for priority water access poor and a (pending) Water OperationaI Framework 2011-2020 which emphasizes two general approaches to dealing with water scarcity. The first is to develop and manage water resources within a framework of Integrated Water Resources Management (IWRM) with river basins as accounting frameworks. Water for All (2003) states “Investments in water supply and sanitation, irrigation and drainage, hydropower, flood control, and watershed management should be set in the context of managing water resources within river basins. The creation of assets in each subsector, and water use within that sector, have impacts on other sectors that need to be factored into investment decisions to optimize project designs. Competition for use of a dwindling natural resource requires AsDB to support the development of an effective legislative framework that gives users rights to water and provides a mechanism for dispute resolution. Equally, AsDB needs to promote efficiencies in water use by supporting demand management, including water pricing. The poor need to be targeted for equitable access to water” Efficiency in water use will (therefore) be a design feature of AsDB’s water projects and shall be applied to all projects in rural, urban and basin water. “In municipal water, the focus should be on aggressive reduction of non-revenue water…“ Supply-side measures, including the development of new water sources, building storages, and completing other infrastructure to augment water supplies, will be supported but only when coupled with efficiency gains elsewhere in the basin… · “in regard to irrigated agriculture projects, ADB will (also) adhere strictly to the efficiency principle. Only those projects that demonstrate a clear program of substantially improving water use efficiency and enhancing productivity will be supported. Similarly, watershed development or rehabilitation projects will be considered when they demonstrate clear gains in restoring the water balance in the watershed, catchment, sub-basin or basin concerned”
Please see the Monitoring and Evaluation section below for more detail about evaluation. Integration of additional safeguards for forestry investments. Although we are keen to ensure that forestry investments are promoted by the CP3 Platform, it is important that this is done in a way which supports biodiversity and forest livelihoods. We have satisfied ourselves as regards IFC’s Performance Standards and how they are implemented in practice provide an adequate basis for this. The same exercise will be done with the AsDB ESG standards. If these prove inadequate we will insert additional safeguards in the CP3 Asia fund enabling us to have the option to ask that any investments in forestry funds are first notified to DFID (as the issues are developmental this is relevant to DFID rather than DECC), providing us and Whitehall forestry experts with an opportunity to provide a non-binding opinion on the suitability of the investments and/or additional measures that may be needed to ensure their sustainability. Carving out India and China (and potentially Russia) from the UK’s investment in
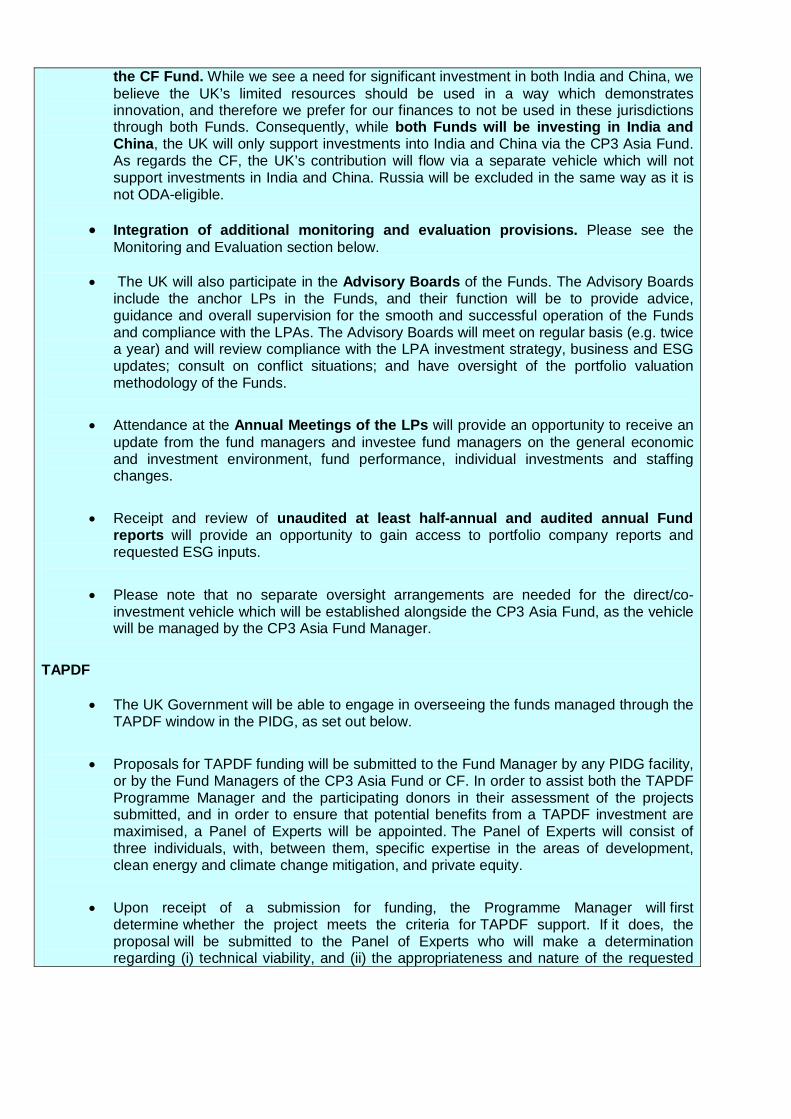
the CF Fund. While we see a need for significant investment in both India and China, we believe the UK’s limited resources should be used in a way which demonstrates innovation, and therefore we prefer for our finances to not be used in these jurisdictions through both Funds. Consequently, while both Funds will be investing in India and China, the UK will only support investments into India and China via the CP3 Asia Fund. As regards the CF, the UK’s contribution will flow via a separate vehicle which will not support investments in India and China. Russia will be excluded in the same way as it is not ODA-eligible.
Integration of additional monitoring and evaluation provisions. Please see the
Monitoring and Evaluation section below. The UK will also participate in the Advisory Boards of the Funds. The Advisory Boards
include the anchor LPs in the Funds, and their function will be to provide advice, guidance and overall supervision for the smooth and successful operation of the Funds and compliance with the LPAs. The Advisory Boards will meet on regular basis (e.g. twice a year) and will review compliance with the LPA investment strategy, business and ESG updates; consult on conflict situations; and have oversight of the portfolio valuation methodology of the Funds.
Attendance at the Annual Meetings of the LPs will provide an opportunity to receive an
update from the fund managers and investee fund managers on the general economic and investment environment, fund performance, individual investments and staffing changes.
Receipt and review of unaudited at least half-annual and audited annual Fund
reports will provide an opportunity to gain access to portfolio company reports and requested ESG inputs.
Please note that no separate oversight arrangements are needed for the direct/co-
investment vehicle which will be established alongside the CP3 Asia Fund, as the vehicle will be managed by the CP3 Asia Fund Manager.
TAPDF
The UK Government will be able to engage in overseeing the funds managed through the TAPDF window in the PIDG, as set out below.
Proposals for TAPDF funding will be submitted to the Fund Manager by any PIDG facility,
or by the Fund Managers of the CP3 Asia Fund or CF. In order to assist both the TAPDF Programme Manager and the participating donors in their assessment of the projects submitted, and in order to ensure that potential benefits from a TAPDF investment are maximised, a Panel of Experts will be appointed. The Panel of Experts will consist of three individuals, with, between them, specific expertise in the areas of development, clean energy and climate change mitigation, and private equity.
Upon receipt of a submission for funding, the Programme Manager will first
determine whether the project meets the criteria for TAPDF support. If it does, the proposal will be submitted to the Panel of Experts who will make a determination regarding (i) technical viability, and (ii) the appropriateness and nature of the requested

funding support. If recommended by the Panel of Experts, the Programme Manager will prepare a Project Proposal Summary for submission to the contributing donors approval and to the other PIDG members, plus AsDB and IFC, for information. As is the case with the existing PIDG technical assistance windows, the Programme Manager will have delegated authority to approve Project Proposals with a value of less than US $75,000, without prior submission to the donors. Contributing donors, plus other PIDG members, the AsDB and IFC, will be informed of such approvals through quarterly reporting by the Programme Manager. Project Proposals with a value of US $75,000 or above, together with Project Summaries and Recommendations, will be submitted by the TAF Programme Manager to the contributing donors, who will have "no-objection" approval rights. Other PIDG members, plus the IFC and AsDB, will be sent copies of the proposals for their information.
If no contributing donor objects to such a Project Proposal, the proposal will be deemed
to have been approved for funding. The overall application processing target is six weeks from receipt of an application to approval. Once a project is approved, the necessary funding will be transferred from the PIDG Trust to a nominated account established for the purpose by the relevant PIDG Facility/Fund manager making the application. That person will then be responsible for managing arrangements and disbursing funds with respect to the Project, with at least 6-monthly progress reports to the TAPDF Programme Manager (which, in turn, would be passed on to HMG as a contributing donor)5.
B. Management CP3 Asia Fund management arrangements
The CP3 Asia Fund will be managed by a so-called General Partner (GP) – i.e., a fund manager. The GP will be a joint venture between CFIG and AsDB, with CFIG holding the majority stake in the joint venture. As set out in the Commercial case which provides considerable detail on the suitability of CFIG and AsDB for the fund management roles, the combination of the two organisations will help to both secure the confidence of the private investors, and ensure that the highest standards of ESG performance are mainstreamed through the fund structure.
In practice, the joint venture between CFIG and AsDB will operate as follows. CFIG will
set up the Investment Management Company (IMC), which will be a 100% owned subsidiary of CFIG. This entity will serve as the investment manager for the CP3 Asia Fund. The IMC will establish an Investment Committee composed of senior fund management professionals from CFIG and one or two AsDB representatives. The IMC, as the day-to-day investment manager, will draw on the full and complete capabilities of CFIG to operate the CP3 Asia Fund most effectively and profitably. For certain special functions requiring expertise beyond the capabilities of the IMC, an Investment Sub-advisor will be retained on a contract. The Investment Sub-advisor will be AsDB. As such, AsDB will receive a fixed percentage of the management fees received by the IMC (the size of the fee is subject to CFIG-AsDB negotiations). AsDB’s main role is to be a “facilitator”: including by building the deal pipeline, sourcing deals, analysing investment opportunities, introducing risk mitigation tools (for example, partial credit guarantees and political credit guarantees), establishing a feedback loop into policy dialogue and
5 Since this Business Case was approved PIDG indicated it does not wish to manage the TAPF so a selection process for TA will need to be established.
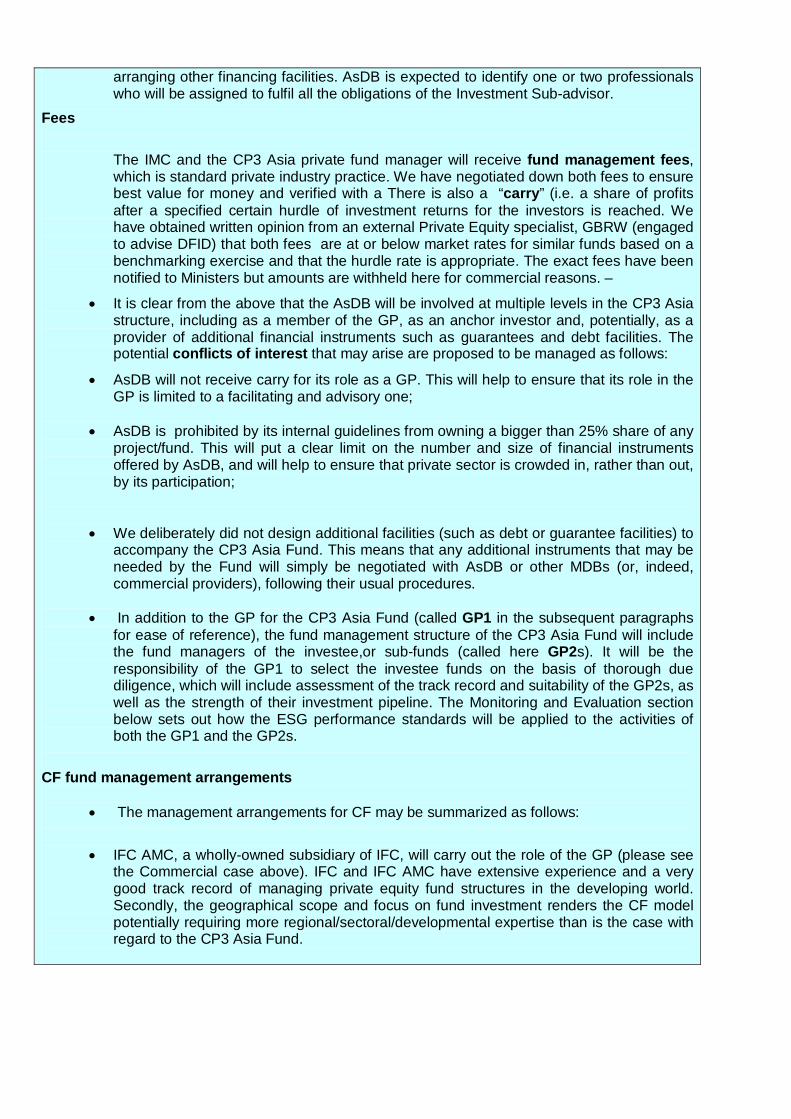
arranging other financing facilities. AsDB is expected to identify one or two professionals who will be assigned to fulfil all the obligations of the Investment Sub-advisor.
Fees
The IMC and the CP3 Asia private fund manager will receive fund management fees, which is standard private industry practice. We have negotiated down both fees to ensure best value for money and verified with a There is also a “carry” (i.e. a share of profits after a specified certain hurdle of investment returns for the investors is reached. We have obtained written opinion from an external Private Equity specialist, GBRW (engaged to advise DFID) that both fees are at or below market rates for similar funds based on a benchmarking exercise and that the hurdle rate is appropriate. The exact fees have been notified to Ministers but amounts are withheld here for commercial reasons. –
It is clear from the above that the AsDB will be involved at multiple levels in the CP3 Asia structure, including as a member of the GP, as an anchor investor and, potentially, as a provider of additional financial instruments such as guarantees and debt facilities. The potential conflicts of interest that may arise are proposed to be managed as follows:
AsDB will not receive carry for its role as a GP. This will help to ensure that its role in the GP is limited to a facilitating and advisory one;
AsDB is prohibited by its internal guidelines from owning a bigger than 25% share of any
project/fund. This will put a clear limit on the number and size of financial instruments offered by AsDB, and will help to ensure that private sector is crowded in, rather than out, by its participation;
We deliberately did not design additional facilities (such as debt or guarantee facilities) to
accompany the CP3 Asia Fund. This means that any additional instruments that may be needed by the Fund will simply be negotiated with AsDB or other MDBs (or, indeed, commercial providers), following their usual procedures.
In addition to the GP for the CP3 Asia Fund (called GP1 in the subsequent paragraphs
for ease of reference), the fund management structure of the CP3 Asia Fund will include the fund managers of the investee,or sub-funds (called here GP2s). It will be the responsibility of the GP1 to select the investee funds on the basis of thorough due diligence, which will include assessment of the track record and suitability of the GP2s, as well as the strength of their investment pipeline. The Monitoring and Evaluation section below sets out how the ESG performance standards will be applied to the activities of both the GP1 and the GP2s.
CF fund management arrangements
The management arrangements for CF may be summarized as follows:
IFC AMC, a wholly-owned subsidiary of IFC, will carry out the role of the GP (please see the Commercial case above). IFC and IFC AMC have extensive experience and a very good track record of managing private equity fund structures in the developing world. Secondly, the geographical scope and focus on fund investment renders the CF model potentially requiring more regional/sectoral/developmental expertise than is the case with regard to the CP3 Asia Fund.

IFC has a prudential limitation of 20% of any investment exposure, applying to IFC's own direct and indirect exposure.
Due to its focus on fund incubation, selection of fund managers will be of paramount
importance. The table below sets out the IFC’s standard approach to manager selectionxcii.
IFC fund selection criteriaxciii
IFC has developed a rigorous methodology for assessing new private equity fund investment opportunities in the climate space, and has applied it in considering recent investment opportunities. IFC's methodology draws on the IFC's fund investing experience noted above; it also draws on IFC's considerable direct investment experience in the climate-friendly investment space in emerging markets.
IFC evaluates each potential investee fund presented using a proprietary scoring and ranking methodology based on IFC’s more than a decade of funds investment experience. The methodology seeks to score a fund proposal on three categories of criteria and a total of 12 measures (see table below). Each measure includes detailed qualitative and/or quantitative standards as well as a specific weighting factor to come up with a score for the measure. The final score of a specific proposal is obtained by adding the score for each measure. Key inputs for the scoring process include the private placement memorandum and other written material provided by potential investee funds, meetings with fund managers and cross checking and preliminary research on the fund manager’s reputation, experience, track record and other important aspects. When meeting with fund managers, IFC would also cover IFC’s policies and standards and do a preliminary assessment regarding the likelihood that such requirements can be implemented by the fund managers.
A scoring and evaluation committee consisting of key investment staff from IFC's Funds Group, together with relevant industry and regional experts and including relevant IFC AMC staff is in charge of reviewing and scoring opportunities presented to the Fund and IFC. The potential investee funds with the best scores are recommended simultaneously to the Fund and for further processing by the IFC teams, and would enter the project pipeline. During the process, IFC will also provide suggestions to potential investee funds to strengthen their strategy or approach, and improve the strategic fit to the IFC criteria.
Investee Fund Selection Criteria (IFC)
Category Measures
Fund Manager
Track record Domain track record and industry expertise Team quality and composition Deal access and local presence
Investment Strategy
Investment strategy Sourcing and deal flow Deal pipeline Structure of the fund and alignment of interests
IFC Role and Additionality
Role Additionality Effectiveness of IFC value-added services Co-investment opportunities

TAPDF management arrangements
As outlined in the Oversight section above, the TAPDF will be managed by the PIDG PMU6 and the proposed management arrangements do not raise any upfront risks.
HMG management arrangements
It is estimated that management of the CP3 Platform, following its implementation, will take up approximately 25% of a Grade 6 or 7 official’s time within DFID and 10% within DECC. This will involve reviewing regular reports, participating in the Advisory Board meetings (or, alternatively, preparing briefing for senior attendance), annual investor meetings, preparing evaluation mechanisms/terms of reference and tenders, maintaining the risk register and reporting progress against milestones (see below). Please note that until just after the first financial close (expected end 2012/early 2013) the CP3 Platform is likely to take up 75% of a Grade 6 or 7 official’s time within DFID and 50% within DECC, including negotiating the Funds documentation, putting in place the financial transfer procedures, drafting and negotiating the relevant trust fund documentation, assisting with marketing presentations and inputting on the TAPDF staff recruitment, terms of reference and TAPDF criteria..
The two funds will each have an Advisory Board on which the UK Government will be
represented. We will request that each of DFID and DECC have the opportunity to send a representative but with a single vote.
Separately to this the UK Government will want to conduct its own progress reviews. In order to do this an ad-hoc programme management board will be set up (Director level), including representatives from DFID and DECC which will meet according to need. This will focus on reviewing progress according to the logframe outputs and outcomes and on setting up the evaluation mechanisms.
Compliance of and removal of Fund Manager The relevant Fund manager must comply with the requirements in the Memorandum and the Partnership agreement. A more than 50% majority (defined by level of commitments) of the investors may remove the fund manager for material breaches which are not remedied within 30 days and usually also by such a decision without proving breach or any cause. IFC have said that they will recuse themselves from voting for any removal of IFC AMC due to their link and potential conflict of interest and therefore depending on the size of other investments, UK Government would have a significant influence. In practice, the UK Government should act in a commercial manner with such decisions because if it does not do so it would be sending a message to private sector investors that entering into public private partnerships with the UK Government entail additional risks.
C. Conditionality Not applicable. D. Monitoring and Evaluation
6 Since this Business Case was finalised, PIDG has indicated that it will no longer carry out this role so an alternative management arrangement is being put in place.

Monitoring strategy:
The monitoring strategy for the CP3 Platform will rely on regular financial and non-financial reporting and publicly available information, The key monitoring provisions are summarised below.
Financial reporting: The CP3 Asia Fund and CF will provide at least half-annual
unaudited, and annual audited reports including financial statements, a fund overview, and an overview of the portfolio with information on each portfolio company’s or fund’s performance and valuation. The fund managers for both Funds will review the information provided by the sub-funds and will follow up with the GP2s as appropriate to clarify any areas where more information is needed (in the case of CF, this will mainly be done by leveraging IFC resources). The TAPDF manager will similarly provide regular financial performance reporting for the TAPDF. In addition the funds will be measured by indices such as Prequin and Tarquin. Some of these indices are available only on a subscription basis and for cost reasons the UK Gov will not subscribe but AsDB and IFC should be able to provide summarised results (which might not be publishable due to copyright reasons) to the UK Government.
ESG Standards: The investment strategies of both Funds and their Investee Funds will
be subject to stringent ESG requirements. A summary of the requirements which will apply to the CP3 Asia Fund and the CF Fund are set out in Annex 1. Investors will have access to the information customarily made available to the Advisory Committee. Environmental and social performance will be evaluated on an annual basis through a report prepared for the AsDB and IFC AMC by the investee fund managers (and shared with HMG as an anchor LP).
Developmental indicators - Publicly available information: The financial and non-
financial reporting by the GP1 and GP2s will not on its own be enough to enable tracking performance against all the indicators outlined in the logframe below. While the fund managers will be able to report certain data (including the number of projects invested in, the ex-ante projections of emissions reduction, the amount of additional equity and debt financing raised by the investee funds, companies and projects), it would be too onerous to expect them to report against other types of indicators. For example, it would not be reasonable to expect fund managers to report against the number of additional households provided with access to clean energy; or the number of jobs created, as they will not have access to such data. Consequently, such information will be obtained and/or extrapolated from public sources where possible, including the IEA World Energy Outlook, MDB reporting, UNFCCC financial flows periodic reporting, Bloomberg New Energy Finance etc. To the extent that this is not possible then it will be necessary to engage an individual via the monitoring budget to gather the information on the indicators.
Developmental indicators - Independent evaluations or independent collection:
Where monitoring and reporting by the fund managers, as well as monitoring through publicly available information is unlikely to deliver sufficient data, on the developmental indicators then the information will be gathered either by engaging an individual in the TAPF to gather the information . This might be done at the same time or as set out detailed in the Evaluation Plan below. This same person could then also aggregate all the data reported via the two platforms and report back to DFID, DECC/ICF and the other donors.
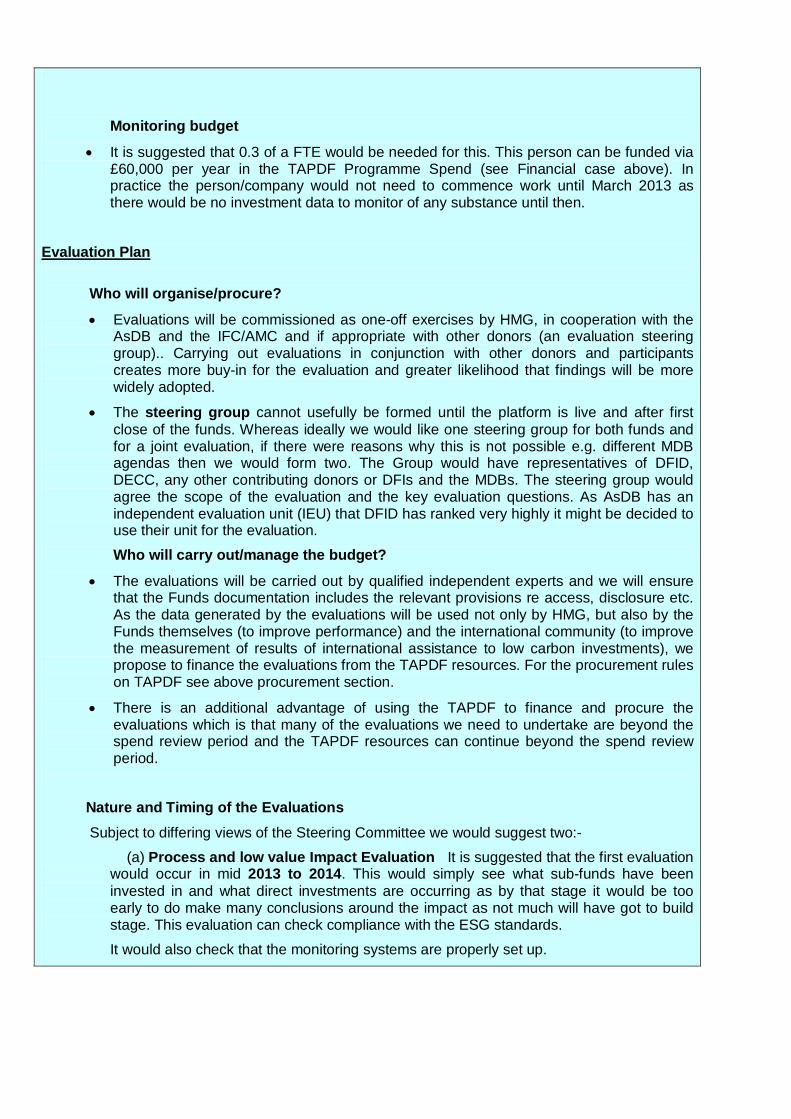
Monitoring budget
It is suggested that 0.3 of a FTE would be needed for this. This person can be funded via £60,000 per year in the TAPDF Programme Spend (see Financial case above). In practice the person/company would not need to commence work until March 2013 as there would be no investment data to monitor of any substance until then.
Evaluation Plan
Who will organise/procure?
Evaluations will be commissioned as one-off exercises by HMG, in cooperation with the AsDB and the IFC/AMC and if appropriate with other donors (an evaluation steering group).. Carrying out evaluations in conjunction with other donors and participants creates more buy-in for the evaluation and greater likelihood that findings will be more widely adopted.
The steering group cannot usefully be formed until the platform is live and after first close of the funds. Whereas ideally we would like one steering group for both funds and for a joint evaluation, if there were reasons why this is not possible e.g. different MDB agendas then we would form two. The Group would have representatives of DFID, DECC, any other contributing donors or DFIs and the MDBs. The steering group would agree the scope of the evaluation and the key evaluation questions. As AsDB has an independent evaluation unit (IEU) that DFID has ranked very highly it might be decided to use their unit for the evaluation.
Who will carry out/manage the budget?
The evaluations will be carried out by qualified independent experts and we will ensure that the Funds documentation includes the relevant provisions re access, disclosure etc. As the data generated by the evaluations will be used not only by HMG, but also by the Funds themselves (to improve performance) and the international community (to improve the measurement of results of international assistance to low carbon investments), we propose to finance the evaluations from the TAPDF resources. For the procurement rules on TAPDF see above procurement section.
There is an additional advantage of using the TAPDF to finance and procure the evaluations which is that many of the evaluations we need to undertake are beyond the spend review period and the TAPDF resources can continue beyond the spend review period.
Nature and Timing of the Evaluations Subject to differing views of the Steering Committee we would suggest two:-
(a) Process and low value Impact Evaluation It is suggested that the first evaluation would occur in mid 2013 to 2014. This would simply see what sub-funds have been invested in and what direct investments are occurring as by that stage it would be too early to do make many conclusions around the impact as not much will have got to build stage. This evaluation can check compliance with the ESG standards.
It would also check that the monitoring systems are properly set up.

Estimated budget £200,000
(b) Impact Evaluation – this will measure whether the two funds and the TAPF have met the Outputs and Outcome, namely whether there has been a change in the climate PE market (Influence indicator) and why/why not. This would involve an agency with detailed knowledge of the financial markets, PE and good financial analysis skills as well as credibility with the financial investors in order to get good information from investors.
Budget £350,000 It is suggested that separately we would seek an impact evaluation to analyse the impact developmental outputs and ask some of the more difficult analysis questions around energy access, health, energy security. It might not be necessary to look at all the sub-projects (estimated about 100 installations and companies) – about half could be a good sample size i.e. 50.
This would probably best occur in 2017 or 2018 as only by that stage would there be installations built, clean tech companies up and running to actually analyse.
The skillset for this evaluation would be good developmental experience.
Because of the two very different subject areas we do not anticipate that one firm could carry out the two evaluations.
Budget for the Developmental evaluation - Assuming the need to visit sites and spend a considerable time in each country etc and then further analyse questionnaires and data as well as build up baseline data this would require more budget.
Budget - £500,000 to £600,000. CP3 Evaluation high level questions These are only initial suggested questions. It is assumed that they would be modified and added to over the time period i.e before 2017 in line with the ICF Evaluation programme. Financial Impact Survey Method/persons to ask INFLUENCE Has CP3 had a (positive) impact on the attitude of pension funds, foundations etc to climate investing such that they are now willing to invest in the sector.
Survey
Has CP3 increased the flows into climate finance/PE. Other influences? Not attributable?
Calculation/tracking Surveys
Are there more PE funds in climate in developing countries as a result of CP3?
Counting (see indicators) Fund manager interviews
How are the CP3 and Dev country climate funds performing financially? In line with MSCI EM indices, other indices Why?/ other potential influences
IRRs of funds Performance indices of individual PE funds

Has the time to close for PE funds improved? If not/why not. Look over long enough period
Questions to fund managers and industry
Have there been issues with raising additional funds e.g. debt for project closure?
Questions to fund managers and project developers
What kind of projects are being invested in and where? (clean tech and installations and sector e.g. forestry)
Information from funds Detailed geographic and sector analysis – charts by %age and year
Who are the co-investors in projects and funds? Why? What does this tell us? How are they changing and why?
How successful has the CP3 project been in driving Adaptation investment? Forestry investment?
Information from funds versus estimated market needs
What affects investment? (investment climate generally, regulatory, returns, fossil fuel subsidies)
Survey – CP3 fund managers Map against indices e.g. WB DB, climate friendly policies etc
Review of delays in project roll out etc Why? Where? What can be done?
How has the TA helped? Evaluation of TA success - amounts - benchmarking
- timing of Projects (faster, slower) To what extent has it driven development in LDCs?
- -
First time fund managers – who and why? IFC and first time fund managers What specific exit and follow on investment issues have occurred with funds? [shows success of wider market if exits easier etc]
Fund managers Q’aire
Development of wider finance market (perhaps influenced by CP3 e.g. angel investment pre- VC)
Questionnaires Business School enquiries

Views of entrepreneurs on clean tech in dev countries Political economy questions Fund manager and project relationships with country governments
DFID offices, MDBs Fund managers Country governments
How is the monitoring working in terms of indicator collection etc?
Developmental Survey ENVIRONMENT Carbon savings Are the amounts being realised and if not why not?
Energy installed base -increase via CP3? Generally or not?
What are typical energy efficiency projects, why and where? Which ones are successful.
PEOPLE Effect of funds and investments on adaptation Government level plans ? What adaptation investments have there been?
Survey/conversation with Governments
Have the projects carried out via the funds increased number of jobs (by gender?) What kind of jobs? Review displacement effect
Survey
Increased energy access If so for which part of population? In which countries? Why? What policy drivers?
Specific project analysis
Increased energy security from the project and increased supply or ?
Who benefits from energy savings? Do they get reinvested?
Specific project analysis
Have energy costs increased or decreased in the countries/locations of investment and what other installations have been built (green or dirty etc)?
IEA data
Review of clean tech upstream investments What tech and innovations have had most developmental effect? Where?
Funds/project investments

ESG standards – Success in embedding Shortfalls Specifics
Funds, countries, projects
Health issues e.g. smoke pollution, water pollution, clean tech improvements – what improvements are attributable to CP3 funds?
Review of inventions, installation pollution output, health data generally in population
What specific resource/environmental issues have there been and how have these been addressed?
People Surveys, reports
What gender issues are there? Eg.offgrid or biomass Forestry issues – what issues have there been and how have they been addressed with indigenous peoples, crafts etc
Project reviews
How is the monitoring working in terms of data collection etc
E. Risk Assessment The CP3 Platform is highly innovative and as such will entail certain risks. We regard the Platform has having an overall risk rating of “HIGH”.
The following paragraphs summarise the key risks, their levels and sets out the main mitigation strategies:
Inability to raise the Funds or one or more of the two funds are smaller than
anticipated: Given that the sectors and regions the Funds will be investing in are perceived as risky by a considerable proportion of investors and in light of the lower liquidity in the financial markets and based on the fact that the UK Government has not been successful recently with the UK Based Business Innovation Fund, there is a risk that the amount of financing the Platform will attract will be less than estimated i.e. the size of the funds may be lower.
Level of risk – medium to high
Risk mitigation: (1) extensive consultations have been carried out with target investors in the design phase to ensure that the structure offers them enough comfort to invest; (2) fund-raising will be phased, so that funds attracted at first close can be invested to demonstrate financial returns, which should in turn attract the next wave of investments at second close; (3) interest expressed by other public sector investors suggests that there will be enough public capital (4) in the case of IFC we have suggested that they consider engaging a placement agent which is a specialist company in institutional fund raising. Despite all of this there is still a risk that there might not be sufficient funds raised to get to

either first close or second close and that then the Economic case for the project fails. This is a consequence of the nature of the risks and of the state of the financial markets. It is of course precisely the reason that HMG is intervening. If financing fund raising were easy or secure then HMG should not intervene and should leave this to the private sector. If the first close does not occur then HMG’s money will be returned less an administrative fee of less than 0.4% per annum. Scenario 4 of the Sensitivity Analysis Table C in the Economic Analysis models the financial results in the event that the fund closes with just public sector investment. In this scenario the results are considerably lower and of course many of the key outcomes in this Platform would not be achieved but there is still a positive NPV.
Lack of viable investments: While the need for low carbon infrastructure investment is
significant, the pipeline of low carbon bankable projects is weak and there is a potential risk that the Funds will struggle to find sound sizeable investments in the sector. Given the high visibility of the CP3 Platform, this could create a negative demonstration effect on the viability of low carbon investments.
Level of risk – Low
Risk mitigation: (1) both fund managers have already identified and shown to UK Government as part of their draft “pitch book” a series of funds and projects in which to invest and have noted that in practice there are many projects which are not reaching closure (2) part of the TAPDF’s function will be to help build the project pipeline; (3) access to private equity finance tends to unlock the project pipeline, with a significantly greater number of commercially viable projects being generated (4) A major safeguard against the risk of lack of dealflow is the selection of a private sector fund manager. The manager’s own reputation rests on the ability to source the deals to match the fund size. Otherwise the investors’ money is not creating a return and this will reflect in the fund performance (rate of return) and lead to criticism by the investors and ultimately loss of future business. Most fund manager staff usually have their own personal funds invested (this is a requirement of most investors) and so they have a personal incentive here too.
Investments fail to yield adequate financial returns: Given the relatively new and
untested nature of the market, there is a risk that investments supported by the Funds do not make the expected high gross returns, creating a negative demonstration effect. This inability to deliver the anticipated financial returns may occur even without any project failure (see below) e.g. many renewable energy projects could be built perform poorly financially.
Level of risk – Low to medium
Risk mitigation: (1) Return expectations of investors will be managed in advance by experienced Fund managers; (2) TAPDF assistance and risk mitigation instruments that may be offered by AsDB and the IFC, and their experience in their routine operations and diversity of the portfolio (including limitation of the percentages held in funds) will help ensure the investments’ commercial viability; (3) the fact that both CFIG and the IFC will act as anchor investors in the Funds will ensure alignment of interests which in turn will help secure the financial returns.
Project failure rate is higher than anticipated The economic case assumes 10% project failure, in other words it assumes that 10% of
the investments will not deliver the anticipated carbon or energy savings/increase. There is a risk that for unanticipated reasons such as force majeures (earthquakes or civil unrest or government changes) more projects fail to deliver the economic benefits. This would impact the Economic case to some degree although given only 45% of potential investments (and no reflows) are modelled there is still headroom.
Level of risk – low to medium
Risk mitigation: (1) experienced fund managers will select and manage projects so that risks of failure are reduced and identified early on so that the actual loss of funds is low. Again the diversification and investment limits reduce the risks here (see above).
Infrastructure projects fail to raise sufficient debt or find other investors to get to close: the funds and sub-funds will only invest a fixed portion (25%) of their funds in a single project for risk diversification and management reasons. They are reliant on co-investors to get the project to closure and construction. Finding such co-investors may be harder in a difficult financial market. This includes for reasons such as Basel 3 capital restrictions on Europe’s banks. In practice AsDB and IFC have said that the debt and Basel 3 risk is much lower in developing countries because projects rely on less debt (they are less highly leveraged) in any event. Equity to debt ratios may be 1:2 as opposed to 1:5 in developed countries. Further, they note that the local banks in places like Asia or Africa are not so capital constrained as those in Europe or the US. For more detail see Part C Leverage – page 42.
Level of risk - medium
Risk mitigation: (1) Both AsDB and IFC are setting up specific facilities for debt which can invest alongside their funds (2) use of non-European banks (3) portfolios are built with lower equity to debt ratios (4) the fund managers will choose many projects which are already well-developed and close to closure or which have a good chance of closure.
Difficulties in reaching exits for investments: the PE fund model relies on being able to exit from a project – usually via a sale to a third party or a float. Exits become difficult in a financial downturn or if there are unusual regulatory constraints imposed. Delayed exits affect the scope for recycling of the funds and delay and to some extent reduce the financial returns and reduce the developmental benefits (as there would not be second round investments).
Level of risk – medium
Risk mitigation: (1) The experienced fund managers will choose investments which are likely to lead to viable exits (2) the fund is of a sufficient duration (including wind down period) to allow time for exits (3) the economic model does not take into account and therefore does not rely on compounding or second round effects (4) the UK Government is not reliant on early financial returns but is a patient capital investor.
Delays in projects being realised/built: again it is a common feature of the renewable
energy and infrastructure market in developing countries that projects are delayed due to regulatory problems in-country or similar problems.
Level of risk – Medium to High
Risk mitigation: (1) IFC AMC and Credit Suisse are both well aware of this issue and should pick sub-investee fund managers and projects which reduce this risk (2) IFC and AsDB will use their on the ground in-country influence where possible. Technical

assistance via TAPF should anticipate some of the regulatory issues and perhaps provide necessary country support. (3) The model in the business case assumes some delays and takes the IEA 3.96 average from written commitment to that project to energy generation.
Competition and overlap between the two Funds: Both Funds will be investing in Asia, including in India and China, which raises the risk of overlap and competition, perhaps reducing their potential financial returns or scope for projects (see above)
Level of risk – Medium to Low
Risk mitigation: (1) funds adopt a portfolio approach to investment management, whereby regional and sectoral diversity facilitates predictable returns. Channelling a portion of investments to Asia is therefore consistent with the portfolio approach. (2) Moreover, it is acceptable for both Funds to be active in both countries, as the financing needs for low carbon development in Asia are substantial, and competition between the financial institutions is to be welcomed. (3) Nevertheless, to ensure that UK financing is used as strategically as possible, there will be a carve out in our investment into CF which will prevent HMG’s finances from being used to support investments in India and China
Reputational risk: CP3 Platform has received a lot of public visibility and attention as a first of a kind, transformational initiative. The UK’s involvement in the design of, and support to, the CP3 Platform is well known to the market. Thus if CP3 fails to deliver the required results, it could pose a reputational risk for HMG.
Level of risk – medium to High
Risk Mitigation: (1) we have been extremely careful in selecting our partners; AsDB and IFC have a track record of demonstrating results in the low carbon investment field, and CFIG has a strong track record of managing private equity funds in Asia; (2) in our external communications we have maintained the emphasis on the innovative and transformational nature of the facility which inevitably comes with a degree of failure risk; and (3) we have run a variety of economic sensitivity scenarios to understand and factor in the potential risks of under-delivery. (4) The size of the funds have been set conservatively.
Regulatory risk: Because the Funds will be soliciting investments from pension funds
based in the US, US Securities and Exchange Commission (SEC) regulations will apply to their structuring and marketing. Specifically, it is prohibited to market the Funds to the general public. This prohibition may extend to discussions of the Funds’ specifics at public events, conferences, on digital media etc. Breachng the regulations (which apply anywhere in the world) could result in criminal prosecution and a moratorium on the Funds’ investment activities.
Level of risk – medium
Risk mitigation: we have received legal advice and are guided by it in our external communications on the Funds. Legal advice will also need to be sought in relation to the publication of this Business Case.
Forestry and environmental: As mentioned above, even low carbon and climate
resilient investments may have other environmental or community impacts. For example large hydro schemes may reduce water or agricultural land availability and damage the environment and forestry investments bear additional risks over and above other types of low carbon investments due to the potential impacts on forest peoples and biodiversity.
All forms of development have some form of environmental trade-off.
Level of risk - medium
.Risk mitigation: as set out previously, IFC and AsDB have extensive awareness of and experience in handling such risks via their Environmental Impact Assessments and ESG Standards. Further, with CP3 Asia there is the ability for HMG to opt out of specific investments. These safeguards would be additional to the stringent IFC and AsDB ESG standards that will govern the Platform investments.
Failure to achieve developmental outcomes: There may be a risk as we focus on attracting institutional investors and delivering significant emission reductions that the objectives of delivering the development outcomes are lost
Level of risk – medium
Risk mitigation: (1)The emphasis on emissions abatement will remain and this is of development importance, including to poor people; (2) DFID officials will be represented at the Advisory Board meetings of the Funds which will enable HMG to provide some strategic steer to the Fund managers (although this should not be overemphasised); and (3) the log-frame included at the end of this document and the evaluation questions sets out the expected developmental impacts, outcomes and outputs against which the Funds’ performance will be tracked and evaluated.
F. Results and Benefits Management The log frame is presented in the following pages, reflecting the data as developed during the appraisal in section D
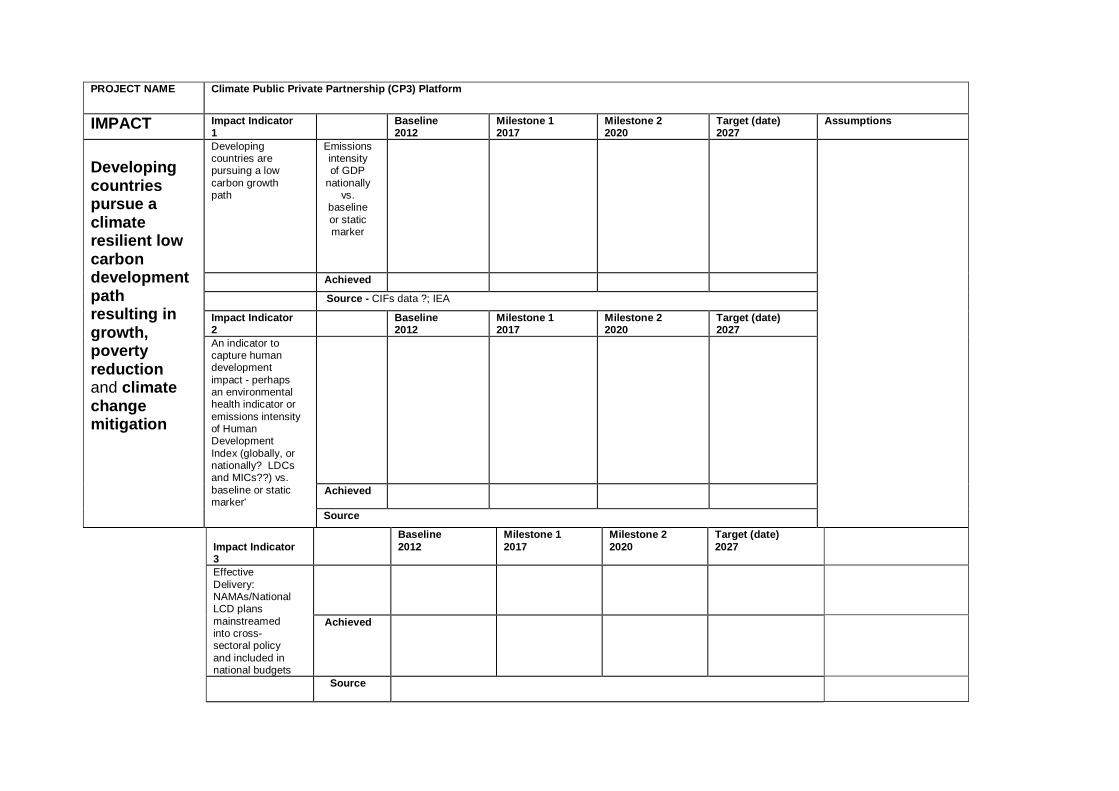
PROJECT NAME Climate Public Private Partnership (CP3) Platform
IMPACT Impact Indicator 1
Baseline 2012
Milestone 1 2017
Milestone 2 2020
Target (date) 2027
Assumptions
Developing countries pursue a climate resilient low carbon development path resulting in growth, poverty reduction and climate change mitigation
Developing countries are pursuing a low carbon growth path
Emissions intensity of GDP
nationally vs.
baseline or static marker
Achieved
Source - CIFs data ?; IEA
Impact Indicator 2
Baseline 2012
Milestone 1 2017
Milestone 2 2020
Target (date) 2027
An indicator to capture human development impact - perhaps an environmental health indicator or emissions intensity of Human Development Index (globally, or nationally? LDCs and MICs??) vs. baseline or static marker'
Achieved
Source
Impact Indicator 3
Baseline 2012
Milestone 1 2017
Milestone 2 2020
Target (date) 2027
Effective Delivery: NAMAs/National LCD plans mainstreamed into cross-sectoral policy and included in national budgets
Achieved
Source

PROJECT NAME Climate Public Private Partnership (CP3) Platform
OUTCOME Outcome Indicator 1
Baseline 2012
Milestone 1 2013
Milestone 2 2017
Target (date) 2020
Assumptions
Increase in private sector investing in climate in developing countries in responsible manner
Increase in the overall size of annual private PE or infrastructure direct finance flows into low carbon development and adaptation (via CP3 or other projects)
Planned $ 200m 2013 (first close)
$ 3bn 2017 (5 years after commencement of investment - all equity investments expected to be finalised by then and financing sorted out)
Baseline + $5bn by 2020 (overall financing of all the deals should be finished by that date)
Note – definition of private should include Sovereign Wealth funds for these purposes.
Achieved
Source CPI Climate Flows report November 2011; OECD / IEA – tracking; Pew Trusts; Bloomberg NEF IEA World Energy Outlook; World Bank,
Outcome indicator 2
Baseline 2013
NA Milestone 1 2017
Target (date) 2020
Assumptions
Percentage of Private sector (pension funds, Sov Wealth funds and foundations i.e. survey respondents) placing funds with PE climate finance or making direct climate infrastructure investments
Planned ? 30% 40% Assumes that due to CP3 increasing PE funds with track records that pension fund managers, foundations feel comfortable investing. Also CP3 demonstration effect should encourage some earlier investors. Note – need to use same survey base consistently
Achieved
Source No baseline as yet.
Survey to be performed by evaluation team in key countries (UK, US, Australia, Asia, Europe)

Outcome Indicator 3
Baseline 2012
Milestone 1 2017
Milestone 2 2020
Milestone3 2022
Assumptions
ESG standards Mainstreamed into climate funds (equivalent to or better than IFC and AsDB’s or CDC’s)
Planned Survey?
50% of funds meet standards
70% of funds meet standards
80% of funds meet standards
Achieved
Source Review/survey of key funds

OUTPUTS – INFLUENCE
OUTPUT 1 Output Indicator 1.1 Baseline Milestone 1 Milestone 2 Assumption
Increased amount of private finance leveraged through the CP3 Platform (including at the investee fund level and including debt)
Amount of private FoF equity ($m) raised -CF WEIGHTING – 5%
Planned £0 (2011)
2013 first close $0m
2013 second close $150m (note this is not actual fund size target)NA
CF – assume no private sector money at first close. CP3 Asia: this is taking the scenario where we only get the $50m Credit Suisse commitment at 1st close and private investment only flows at second close following the demonstration effect of initial investments. The reason the debt figure is 0 at first close is that there will not be any project finance at this stage unless OPIC come in. Debt assumed to be leveraged at 1:1 ratio with equity. All figures are including any money that would otherwise be raised in the Business as Usual (BAU) scenario. If it is wished to see the difference, then the BAU figures in the financial model to the Business case can be subtracted.
Achieved
Source – IFC reporting
Amount of private FoF equity ($m) t raised - CP3 Asia
Baseline Milestone 1 Milestone 2
WEIGHTING – 5%
Planned 2012-2013 first close $50m
2013 second close $300m mid to end
Achieved Source – ADB/Credit Suisse reporting Output Indicator 1.2 Baseline Milestone 1 Milestone 2 Amount of private equity at investee fund level and project level WEIGHTING – 5%
Planned £0 (2011)
2012-2013 first close
2017 (major investments concluded) $500k at investee fund level $3bn equity at project level
2022 $927m equity at investee fund level $4.3bn equity at project level Cumulative – includes previous target
Achieved
Source – IFC and AsDB reporting
Output Indicator 1.3 Baseline Milestone 1 Milestone 2
Amount of debt Planned 0 (2011) 2013 first close 2017 (major 2022

leveraged at project/ company level from equity invested
investments concluded) $4bn private debt
$6bn private debt Note – includes previous target.
Achieved WEIGHTING – 5% Source - IFC and AsDB reporting

OUTPUT 2 Output Indicator 2.1 Milestone 1 Milestone 2 Assumption
Funds perform well in industry and sector e.g. Emerging Market indices
Performance of CF and CP3 Asia WEIGHTING – 5%
Planned NA 2020 Top quartile ranking (if ranked)
2022 Top quartile ranking
Both top funds are ranked in industry indices as Emerging Market funds. Sub-funds get to closure and also ranked in EM or similar indices. Due to needing performance time, assumed that funds are not ranked until 2017 or later.
Achieved
Source MSCI EM or similar index
Performance of sub-funds
Milestone 1 Milestone 2
WEIGHTING – 5%
Planned NA 2020 10% of sub-funds which are ranked are in top quartile ranking
2022 35% of sub-funds which are ranked are in top quartile ranking
Achieved Source – MSCI EM or similar index
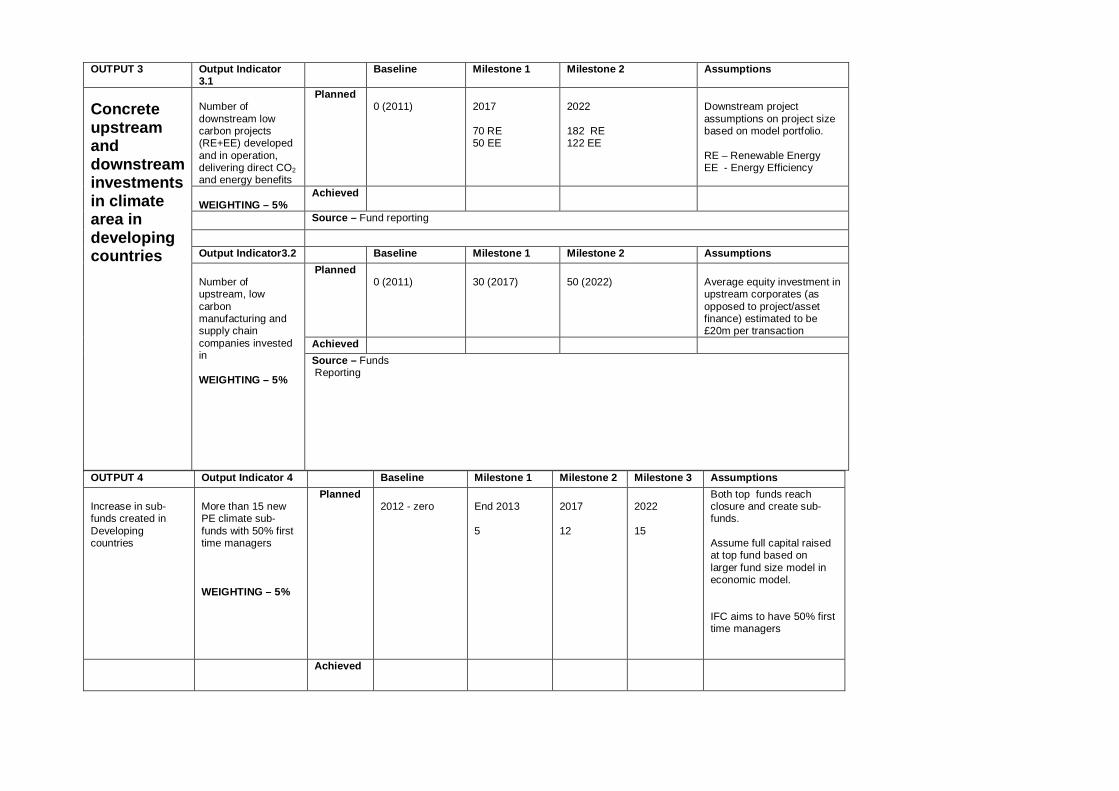
OUTPUT 4 Output Indicator 4 Baseline Milestone 1 Milestone 2 Milestone 3 Assumptions Increase in sub-funds created in Developing countries
More than 15 new PE climate sub-funds with 50% first time managers WEIGHTING – 5%
Planned 2012 - zero
End 2013 5
2017 12
2022 15
Both top funds reach closure and create sub-funds. Assume full capital raised at top fund based on larger fund size model in economic model. IFC aims to have 50% first time managers
Achieved
OUTPUT 3 Output Indicator 3.1
Baseline Milestone 1 Milestone 2 Assumptions
Concrete upstream and downstream investments in climate area in developing countries
Number of downstream low carbon projects (RE+EE) developed and in operation, delivering direct CO2 and energy benefits
Planned 0 (2011)
2017 70 RE 50 EE
2022 182 RE 122 EE
Downstream project assumptions on project size based on model portfolio. RE – Renewable Energy EE - Energy Efficiency
WEIGHTING – 5%
Achieved
Source – Fund reporting
Output Indicator3.2 Baseline Milestone 1 Milestone 2 Assumptions Number of upstream, low carbon manufacturing and supply chain companies invested in WEIGHTING – 5%
Planned 0 (2011)
30 (2017)
50 (2022)
Average equity investment in upstream corporates (as opposed to project/asset finance) estimated to be £20m per transaction
Achieved Source – Funds Reporting

Source - Reports from IFC (and potentially AsDB
OUTPUTS – ENVIRONMENT
OUTPUT 5 Output Indicator 5 Baseline Milestone 1 Milestone 2 Milestone 3 Assumption Proportion of subfunds with ESG standards implemented
WEIGHTING – 5%
Planned 2012 - zero
2013 100%
2017 100%
2020 100%
Both top funds reach closure and create sub-funds. All subfunds trained and contracted to use IFC or AsDB ESG standards.
Achieved
Source - Reports from IFC and AsDB and verification by evaluators
OUTPUT 6 Output Indicator 6 Baseline Milestone 1 Milestone 2 Assumptions Co2 savings via CP3 Asia and CF
WEIGHTING -15%
Planned 2012 - zero
2017 50m t/Co2e
2022 265m t/CO2 e (130m t/Co2e additional to BAU)
Assume full capital raised at top fund based on larger fund size model in economic model. CO2 Benefits: CO2 benefits accrue for up to 25 years post investment (10 years for energy efficiency) based on model portfolio. Accounted for at time of investment as expected benefit. No modelling done of upstream investments i.e. supply/cleantech. Assume that in 2017 only some investments are built/delivering CO2.
Achieved

OUTPUT 7 Output Indicator 7 Baseline Milestone 1 Milestone 2 Assumption
On and off-grid low carbon electricity generating projects funded by the Platform
MW of installed low carbon electricity capacity
Planned 2012 - zero
2017 1000 MW
2022 6969 MW
Assume full capital raised at top fund based on larger fund size model in economic model. Installed capacity based on assumptions in model portfolio of RE downstream power projects. Assume that most RE plants will take 3 to 4 years to build plus negotiation period therefore limited number in 2017. Figures include BAU. If it is wished these can be subtracted by using the numbers in the financial model.
Achieved
WEIGHTING – 15%

OUTPUT 8 Output Indicator 8 Baseline Milestone 1 Milestone 2 Assumption Energy savings via CF and CP3 Asia
WEIGHTING – 10%
Planned 2012 - zero
2017 50,000,000 MW
2022 237,684,400 MW
Assume full capital raised at top fund based on larger fund size model in economic model. Energy saving benefits are expected from point of investment Will take some time for savings to be achieved due to deployment of changes Figures include BAU. If it is wished this can be subtracted by using the numbers in the financial model.
Achieved

OUTPUTS – PEOPLE
OUTPUT 9 Baseline NA Milestone 1 Milestone 2
Jobs estimates are based on MDB forecasts, but are gross, and are assumed to appear 3 years post investment. Further work is required to understand displacement of existing employment and the relative value of green vs. non green jobs. increased private sector flows on costs of renewable power. Energy Access and Innovation – no forecast as not primary aim of project. Ex post evaluation only
Prosperity: Jobs created (split by gender) . See ICF indicator. WEIGHTING -5%
Planned 2012 - 0
NA 15,400 (2017)
2020 or 2022 – 40,000
Achieved Source Ex-ante projections based on the two MDBs reporting on their existing portfolios in clean tech and
infrastructure. To be reported on regular basis by fund managers; ex-post independent evaluations to be carried out on
periodic basis
OUPUT 10 Baseline NA Milestone 1 Milestone 2
Energy Access: Number of poor households provided with improved energy access through the Platform (see ICF indicator) WEIGHTING 2.5%
Planned 2012 - 0
N/A
NA
NA
Achieved
Source No ex-ante estimates clearly available as at time of BC preparation as not clear where investments will be made. Ex-post independent evaluations to be carried out on periodic basis to establish evidence base based on investments
OUTPUT 11 Baseline NA Milestone 1 Milestone 2
Innovation: New technological innovations deployed at scale (see ICF indicator) WEIGHTING 2.5%
Planned 2012 - 0 N/A 2020 - TBC
Achieved
Source No Target set – monitor after investments to see if any technologies have influenced transfer or Co2 savings etc Or if technologies have reduced prices for adaptation or otherwise

OUTPUT12 Output Indicator 13
Baseline Milestone 1 Milestone 2 Assumptions
Adaptation Investments Not scored/weighted See section on evaluation in Business case
Planned
2012 - zero
2017 2-5% of Funds’ portfolio
2020 or 2022 2 to 5% of Funds’ portfolio
Based on information provided by MDBs.
Achieved
Source - Reports from IFC and AsDB, sub-funds and verification by evaluators
OUTPUT 13 Baseline Milestone 1 Milestone 2
Forestry Investments Not weighted or scored. See section on Evaluation in Business Case
Planned
2012 - zero
2017 2 to 5% of Funds’ portfolio
2020

MOBILISATION AND LEVERAGE DATA ON PROJECT
Inward flows of private finance into low carbon investments generate economic development, poverty reduction and emissions reductions
Public Leverage: Private equity leverage within the CP3 platform at Fund of funds level (public funds: private funds) See ICF Mobilisation Indicator
Planned
0 (2012)
£400m public funds (excluding UKGov) $100m ADB $75m IFC And $200m other
$100m additional
Should not include Sovereign Wealth funds within definition as they act as if private money. Can include Development Banks
It is likely that at first close of CF the private finance leverage will be low as public institutions will need to demonstrate success before attracting large-scale private financing. Further, not much financing is forthcoming in Calendar year Q1 and Q2. The FoF leverage is maximised at second close with no more equity investments after that. Note the second close may be a rolling one.
Achieved
Source - Targets from model estimates IFC and AsDB/Credit Suisse Private Leverage at FoF Level - CF
Baseline Milestone1
Milestone 2 second close
0 (2012)
None –first close
1:1.2
Definition should include Sovereign wealth funds
Achieved
Source – Targets from model and then actual Leverage ratios reported by IFC AMC
Private Leverage at FoF Level – CP3 Asia
Baseline Milestone 1 Milestone 3
first close second close Definition should include Sovereign wealth funds
Planned 1:1.2 (Credit Suisse - $50m)
1:6
Achieved
Source Targets from financial model and remainder reported AsdB/Credit Suisse Baseline Milestone 1 Milestone 2 Target (date)

Wider private private funds mobilised within CF at sub fund and project level Private equity investments into sub funds and project level equity and debt)
Planned End 2013
End 2017 Amounts quoted are total in fund (not additional to BAU) $250m – equity at sub fund level $1bn at sub fund level $1bn private debt at project level
End 2022 Amounts quoted are total in fund (not additional to BAU) $450m equity at sub fund level (including the previous target) $1.7bn at project level (including the previous target) $2.5bn private debt at project elvel (includes the previous target)
Achieved Source Target from Model and then reports from IFC and funds Baseline Milestone 1 Milestone 2 Target (date) Wider private funds mobilised within CP3 Asia (project level equity and debt and sub-funds equity and debt)
Planned NA End 2013 $100m sub fund equity $200m debt at project level $200m equity at project level
End 2017 $300m sub fund equity $1bn debt at project level $1.3bn equity at project level
End 2022 $475 equity at sub fund level $3.5bn debt at project level $2.6bn equity at project level As previously, all amounts are cumulative i.e. include previous Milestone’s targets All figures include BAU
Achieved Source – Targets derived from financial model. AsDB/Credit Suisse
Baseline Target (date) Assumptions Total Financial
Leverage Planned
2022
This includes the BAU case

UK Gov pound to total UK Gov pound to private sector
1 to 116 (UK pound to total) 1 to 92.2 (UK pound to private sector amount raised)
and looks at total mobilisation, although of course there are attribution issues, the leverage is of interest to see the catalytic effect of UK Gov £
Achieved Source – Targets derived from financial model. AsDB/Credit Suisse Baseline Target (date) Assumptions
Public sector at FoF to total private finance leveraged
Planned 2022 1 to 20
This includes the BAU case and looks at total mobilisation of public to private
Achieved Source Figures taken from financial model
Public sector total (FoF, sub fund, project and debt) versus private finance (FoF, subfund, project equity and debt)
Planned


Annex 1: Summary of Environmental, Social and Governance requirements applicable to the CP3 Asia Fund and CF
The CP3 Asia Fundxciv
Screening and categorisation: All potential investments will be screened for prohibited activities (e.g. production involving forced labour, commercial logging operations etc). The Environmental and Social Safeguard Manager of the CP3 Asia Fund or the investee fund (whichever is applicable) will then screen the investment against an environmental assessment checklist and social safeguard screening check-list. The investment will be classified as one of the following categories: category A (with potential significant environmental and/or social impacts); category B (with less significant environmental and/or social impacts), and category C (with minimal or no impacts). For category A investments, the deal team will advise the investee company that Safeguard Requirements 1-3 of the AsDB Safeguard Policy Statement will apply, including preparation of an environmental impact assessment, an environmental management plan etc. The investee company will submit these reports to the CP3 Asia Fund Manager and to the AsDB. For Category B and C projects, less stringent requirements will apply. Due diligence: The Environmental and Social Safeguard Manager will undertake environmental and social due diligence. Depending on the complexity of the investment, this may be a desk review (for category C investments), a site visit (for category B), or a full-scale review (for category A). For category A and B investments, a due diligence report will be prepared and will be used to inform the decision making of the investment committee of the investee fund. For investments likely to be classified as category A for any of their environment, involuntary resettlement, or indigenous peoples impacts, the investee fund will refer the investment to AsDB and provide relevant and social information to the Bank early in the due diligence process. The draft EIA report will be made publicly available at least 120 days before approval of the investment. Compliance monitoring and reporting: After category A or B investment is approved, the Environmental and Social Safeguard Manager (i) communicates with the investee company and confirms from time to time that the company is undertaking the compliance obligations with all applicable environmental and social safeguard requirements; and the investee fund will promptly report to AsDB any actual or potential breaches of compliance requirements after becoming aware of it. For a category A investment, the Manager will visit the site to monitor the implementation of the relevant compliance plans. Environmental and social performance will be evaluated on an annual basis. The benchmark for performance will be the ongoing compliance against the applicable environmental and social safeguard requirements. The investee fund will ensure that the investee company submits an annual environmental and social monitoring report, and will review and assess the investee company’s performance on environmental and social safeguard issues. Based on the annual monitoring reports, the Manager will prepare an annual environmental and social performance report and submit it to the CP3 Asia Fund Manger and AsDB. Please note: Although the above summary is based on the scenario where an investee fund (i.e. a fund into which the CP3 Asia Fund invests) carries out investments into companies, the same principles will apply with regard to the investee fund’s investments into projects. The same principles will also apply to the CP3 Asia Fund itself, whether it invests in funds or directly into projects.

CF xcv Please note that although there are some variations between the two schemes, the AsDB Environmental and Social Management system is based largely on the IFC Policy on Environmental and Social and Environmental Sustainability and Performance Standards, which, in the context of the CP3 Platform, helps to ensure consistency between the two Funds. The IFC policy covers the environmental and social management system (including project categorisation, monitoring, reporting, dealing with community grievances etc), and includes stringent Performance Standards on specific aspects of development-related investments (e.g. pollution prevention and abatement or land resettlement). The IFC’s Policy is considered to set the industry standard and has been adopted as a benchmark by such voluntary initiatives as the Equator Principles for large-scale project financingxcvi. Consequently, the paragraphs below only focus on how the IFC ESG policies will apply in the context of investments through financial intermediaries (i.e. investee funds).
Monitoring and reporting in the CF structure: IFC has developed a specific procedure - based on its Performance Standards - which it agrees with its investee funds. This includes a requirement that they abide by IFC's Performance Standards in their investments and operations. In order to monitor that the manager is implementing this agreement in practice, IFC normally requires that the investee fund provides documentation pertaining to the ESG aspects of the investee fund's first three investments, for review by IFC. Additional provisions apply to high-risk projects beyond the investee fund's first three investments, where the IFC retains an ongoing active role in their management. CF will follow the same procedures in respect of the investments it makes; and in cases where IFC is not itself an LP in an investee fund of the Fund, the Fund will still work with the relevant IFC teams to ensure that these procedures are followed (this will be part of the services agreement between IFC AMC and IFC concerning the Fund).
i AsDB, UN Foundation, Engaging Private Sector Capital at Scale in Financing Low Carbon Infrastructure in Developing Countries (draft), 2010. ii Stern review on the economics of climate change, 2006. iii Sources: CIA World Factbook, 2010, BP Statistical Review of World Energy, 2010 iv World Bank, Winds of Change: East Asia’s Sustainable Energy Future, 2010. v Ibid. vi Indian National Action Plan on Climate Change, 2008. vii Sources: PPIAF, WWF. viii Africa Partnership Forum, Climate Change and Africa, 2007. ix Ibid. x Grantham Institute, Possibilities for Africa in Global Action on Climate Change, 2009. xi Inter-American Development Bank, Climate Change Strategy, 2009. xii IEA, World Energy Outlook, 2007. xiii WB, Low Carbon, High Growth: Latin American Responses to Climate Change, 2009. xiv Source for this paragraph: AsDB, Understanding and Responding to Climate Change in Developing Asia, 2009. xv WB, Distributional Impacts of Climate Change in India, 2011. xvi Stern review on the economics of climate change, 2006. xvii AsDB, The Economics of Climate Change in Southeast Asia: A Regional Review, 2009. xviii Grantham Institute, Meeting the Climate Challenge: Using Public Funds to Leverage Private Investment in Developing Countries, 2009.

xix SDCL, A public-Private Initiative to Catalyse the Flow of Private Sector Funds into Low Carbon and Resource Efficient Infrastructure Investments In Asia, 2010 (not published). xx IPCC, Climate Change 2007: Impacts, Adaptation and Vulnerability, 2007. xxi Ibid. xxii Africa Partnership Forum, Climate Change and Africa, 2007. xxiii Grantham Institute, Possibilities for Africa in Global Action on Climate Change, 2009. xxiv WB, Low Carbon, High Growth: Latin American Responses to Climate Change, 2009. xxv Ibid. xxvi AsDB, Asia Climate Change and Clean Energy Venture Capital Initiative Call for Proposals, 2010. xxvii World Resources Institute, EarthTrends (online database). xxviii Africa Partnership Forum, Climate Change and Africa, 2007. xxix IEA, World Energy Outlook, 2009. xxx UNFCCC Secretariat, Investment and Financial Flows, 2007. xxxi WB, A Strategic Framework for Development and Climate Change A Strategic Framework for Development and Climate Change, October 2008. xxxii Ecofys, Developmental benefits of Private Investment in Climate Change Mitigation and Adaptation in Developing Countries, 2010. xxxiii AsDB, UN Foundation, Engaging Private Sector Capital at Scale in Financing Low Carbon Infrastructure in Developing Countries (draft), 2010. xxxiv E.Angelo, Limited Partners’ Perceptions and Management of Risk in Private Equity Investment”, 2010. xxxv Israeli Cleantech Partners supported better place, better place is described on its website ((http://www.betterplace.com) and Israeli Cleantech Partners is described here: (http://www.israelcleantech.com). xxxvi David Wolman, 2010 “Want to Help Developing Countries? Sell Them Good Stuff — Cheap” Wired October 2010, (http://www.wired.com/magazine/2010/09/st_essay_pennies/). xxxvii xxxviii VCC, 2009 "Berkeley Energy Raises $74M Cleantech Fund To Invest In India, Asia" VCCIRCLE (http://www.vccircle.com/500/news/berkeley-energy-raises-74m-cleantech-fund-to-invest-in-india-asia).
xxxix -- Source: IFC report on Climate Change and Private Equity (2011) .
xl Engaging Private equity and venture capital funds in climate friendly investments November 2011 , IFC – the Role for the Public Sector (“Castalia Report”) http://www.ifc.org/ifcext/sustainability.nsf/Content/Publications_Report_ClimateFriendlyInvestments xli www.opic.gov/fulllist - Autumn 2011 list of funds xlii Page 37-41 of Lerner, 2009 “Boulevard of Broken Dreams” Princeton University Press xliii See the following sources: Grantham Institute, Meeting the Climate Challenge: Using Public Funds to Leverage Private Investment in Developing Countries, 2009; IPD, Columbia University and Institute of Development Studies, The Role of Private Investment in Increasing Climate Friendly Technologies in Developing Countries, 2009; SEFI, Public Finance Mechanisms to Mobilise Investment in Climate Change Mitigation, 2008; UNEP FI and Vivid Economics, Catalysing Low-Carbon Growth in the Developing Countries, 2010; UNEP SEFI, Public Finance Mechanisms To Catalyse Sustainable Energy Sector Growth, 2005; World Economic Forum, Task Force on Low-Carbon Prosperity Recommendations, 2010; BASE, SEFI, Public Finance Mechanisms to Increase Investment in Energy Efficiency, 2006. xliv http://www.efinancialnews.com/story/2011-12-14/governments-1bn-sterling-small-businesses-fund-flops xlv See the following sources: Grantham Institute, Meeting the Climate Challenge: Using Public Funds to Leverage Private Investment in Developing Countries, 2009; IPD, Columbia University and Institute of Development Studies, The Role of Private Investment in Increasing Climate Friendly Technologies in Developing Countries, 2009; SEFI, Public Finance Mechanisms to Mobilise Investment in Climate Change Mitigation, 2008; UNEP FI and Vivid Economics, Catalysing Low-Carbon Growth in the Developing Countries, 2010; UNEP SEFI, Public Finance Mechanisms To Catalyse Sustainable Energy Sector Growth, 2005; World Economic Forum, Task Force on Low-Carbon Prosperity Recommendations, 2010; BASE, SEFI, Public Finance Mechanisms to Increase Investment in Energy Efficiency, 2006. xlvi Sources: guidance from DFID Chief Economist; HM Treasury Green Book.

xlvii Climate Friendly Investments: Assessing the Opportunities for Private Equity and Venture Capital Investors IFC Oct 2011 page 8 http://www.ifc.org/ifcext/sustainability.nsf/Content/Publications_Report_ClimateFriendlyInvestments
xlviii DECC business plan http://www.decc.gov.uk/assets/decc/about%20us/decc-business-plan-2011-2015.pdf xlix DFID, The Engine of Development: the Private Sector and Prosperity for Poor People”, 2011. l Please see the Commercial case below. li http://www.cpsl.cam.ac.uk/Leaders%20Groups/P8%20Investment.aspx lii Feedback from investors was received at several targeted working sessions, including ones held at: the P8 Summit in Seoul (June 2010), the P8 Summit in Brussels (February 2011) and DFID discussions with large US pension funds held in May 2011 (New York – Washington). At all three working sessions a small minority of investors argued that first loss equity would be the only way to reduce investor risk. However, the majority have consistently fed back that “the opportunity to invest alongside government and MDBs is a key benefit of the CP3 proposals” (notes from the Brussels P8 Summit). This was due to the perceived policy risk and the importance of government and MDB intermediaries in addressing that risk: for example, in relation to the CP3 Asia Fund, consistent feedback was that “policy risk was a predominant concern for potential investors. AsDB’s links with local governments; its ongoing policy dialogue; the presence of developed and developing countries on AsDB’s board; and AsDB’s experience of investing in the region were all seen as significant advantages by the investors consulted” (DFID notes from the May 2011 investor discussions). liii An 2006 academic paper by the University of Illinois studied 238 projects in 13 Asian countries between 1994-2005. Average project cost was USD $545 million. Mean value of leverage was 75.02%, meaning 75% debt, 25% equity, for a 3x leverage. An Asian Development bank Source: Vaaler, Paul M., et al. "Risk and Capital Structure in Asian Project Finance." University of Illinois at Urbana-Champaign, College of Business. 2006. Link: http://www.business.illinois.edu/working_papers/papers/06-0127.pdf Previous sample was from 1994 to 2005 and risk profile of these countries particularly China and India improved dramatically since then. Current debt ratios are higher. Project Finance International (pfie.com) contains selected data on annual infrastructure project finance deals. A search of the 2010 to 2008 league tables of deals comparable to Cp3 Asia indicated that (weighted) industry average leverage ratio in Asia was 3.4x liv An 2006 academic paper by the University of Illinois studied 238 projects in 13 Asian countries between 1994-2005. Average project cost was USD $545 million. Mean value of leverage was 75.02%, meaning 75% debt, 25% equity, for a 3x leverage. Source: Vaaler, Paul M., et al. "Risk and Capital Structure in Asian Project Finance." University of Illinois at Urbana-Champaign, College of Business. 2006.: http://www.business.illinois.edu/working_papers/papers/06-0127.pdf Project Finance International (pfie.com) contains selected data on annual infrastructure project finance deals. A search of the 2010 to 2008 league tables of deals comparable to Cp3 Asia indicated that (weighted) industry average leverage ratio in Asia was 3.4x. AsDB own deal samples are near 3 x having increased in recent years reflecting stronger position of Asian market. lv Monitoring and Tracking Long-term Finance to Support Climate Action – Barbara Buchner (CPI), Jessica Brown (ODI) and Jan Coffee-Morlot (OECD) May 2011 and Climate Finance Effectiveness Background Paper – Leveraging climate finance a survey of methodologies – Jessica Brown, Barbara Buchner, Katharine Sierra and Gernot Wagner September 2011 lvi Conference at OECD on Tracking Private Finance Flows November 2011 www.oecd.org lvii DECC UK variable resource cost forecasts are on average around 50-70% of retail prices. We should expect resource costs to be a lower share of retail prices in the UK than in countries with little mitigation policy, as UK price forecasts include the carbon price and policy costs that are passed through onto end users (in particular in the domestic sector). 2010 prices show a smaller difference for commercial and industrial users, as there are significantly lower policy costs in these years, so can be used to get a better estimate - at around 80%. lviii A direct rebound effect occurs when people use some of the financial savings they have gained from the greater efficiency of a good, to purchase more of the same good. An indirect rebound effect occurs when people use some of the financial savings they have gained from the greater efficiency of a good, to purchase more of other different goods and services. Rebound effects limit energy use savings and emissions reductions. Rebound effects also produce welfare benefits by allowing additional consumption. Empirical estimates of the direct rebound are broad. A number of estimates

(for developed countries) suggest that they tend towards a range of 25-30% for consumers. Insufficient studies have been carried out for producers, yet estimates suggest that producer direct rebounds are sufficiently high to merit analysis. Indirect estimates are more challenging, with complex and varying methodologies. Nonetheless, the evidence suggests that indirect rebounds do occur. The HMT/DECC Greenhouse Gas Appraisal guidance recommends that the “full retail price (including tax)”[ be used to value welfare benefits to consumers. This seems reasonable given that through purchase, consumers have revealed their preferences, that the goods or services bought are of greater (or at least equal) value to them as the amount paid. lix Due to the long results chain and multiple points of equity and debt leverage between contribution to the Fund of Funds and investment projects, the benefit cost ratios are very large for UK contribution unless you pro rate (either on FoF basis – take %age of all results based on UK Government %age shareholding in the FoF or on a pure attribution basis i.e. look at all funds contributed and then divide UK Gov contribution by that and apply that ratio to the results) Hence difference BCRs produced lx For an overview of potential RE technology costs, see Mott McDonald’s submission to the UK Climate Change Committee, Costs of low-carbon generation technologies (May 2011) http://www.theccc.org.uk/reports/renewable-energy-review - page 11 Executive summary and final pages of report- lxi Brooks World Poverty Institute, Poverty and Climate Change in Urban Bangladesh, 2011. lxii Policy Department Economic and Scientific Policy, European Parliament, Climate Change and India: Impacts, Policy Responses and a Framework for EU-India Cooperation. 2008.. lxiii World Health Organisation, Protecting Health from Climate Change – Connecting Science, Policy and People, 2009. lxiv Intergovernmental Panel on Climate Change, Third Assessment Report, 2001. lxv FAO, Gender: the Missing Component of the Response to Climate Change, 2006. lxvi See DFID Factsheets: Poverty Reduction in a Low Carbon Economy www.aeat.com/.../DFID-Low-carbon.../DFID_low_carbon_development_poverty_reduction.pdf lxvii UNEP (2008), Green Economy Initiative Report. http://www.unep.org/GreenEconomy/Portals/93/documents/Full_GER_screen.pdf lxviii The evidence base on the developmental benefits of private investment into low carbon, climate resilient companies and infrastructure, includes the following sources: AsDB, UN Foundation, Engaging Private Sector Capital at Scale in Financing Low Carbon Infrastructure in Developing Countries (draft), 2010; Ecofys, Benefits of Private Investment in Climate Change Mitigation and Adaptation in Developing Countries, 2010; and AGF Final Report, http://www.un.org/wcm/content/site/climatechange/pages/financeadvisorygroup/pid/13300. lxix http://www.climateinvestmentfunds.org/cif/node/2 lxx http://www.ifc.org/ifcext/climatebusiness.nsf/Content/ClimateBusinessHome. lxxi http://www.ebrd.com/pages/sector/energyefficiency.shtml lxxii http://geeref.com/ lxxiii http://www.bmu-klimaschutzinitiative.de/en/projects?p=9&d=567. lxxiv http://cdmpipeline.org/regions_7.htm. lxxv Ibid. lxxvi http://www.adb.org/ lxxvii AsDB, Strategy 2020: the Long-Term Strategic Framework of the Asian Development Bank 2008-2020, approved in 2008. lxxviii DFID, Multilateral Aid Review: Assessment of the Asian Development Bank. lxxix DFID, Multilateral Aid Review: Assessment of International Finance Corporation. lxxx http://www.ifc.org/anticorruption. lxxxi DFID, Multilateral Aid Review: Assessment of the Asian Development Bank. lxxxii AsDB’s procurement principles are available here: http://www.adb.org/procurement/ lxxxiii https://www.credit-suisse.com/news/en/media_release.jsp?ns=40432 lxxxiv The details of the fees cannot be published for commercial sensitivity reasons. lxxxv DFID, Multilateral Aid Review: Assessment of the International Finance Corporation. lxxxvi The PIDG Handbook, 2007. lxxxvii Information provided by the IFC. lxxxviii Information provided by the AsDB.

lxxxix Financial Times – Venture Capital – Patience is a virtue in the hunt for game – changing green google http://www.ft.com/cms/s/0/3e1ede78-fe48-11e0-bac4-00144feabdc0.html#axzz1dPnqWuni xc http://www.ifc.org/ifcext/sustainability.nsf/Content/EnvSocStandards. xci Not available online; hard copy is held by DFID and can be obtained from the AsDB. xcii Information provided by IFC AMC. xciii Information provided by IFC AMC. xciv Based on AsDB’s Environmental and Social Management System, supplied by the AsDB. xcv http://www.ifc.org/ifcext/sustainability.nsf/Content/EnvSocStandards. xcvi http://www.equator-principles.com/.