intra-catalyst reductant chemistry in lean nox traps: a ...intra-catalyst reductant chemistry in...
TRANSCRIPT
Intra-catalyst Reductant Chemistry in Lean NOx Traps:A Study on Sulfur Effects
Jim Parks ([email protected]), Matt Swartz, Shean Huff, Brian WestOak Ridge National LaboratoryFuels, Engines, Emissions Research Center
DEER 2006August 20-24, 2006Detroit, MI
Sponsor: U.S. Department of Energy, OFCVTProgram Managers: Ken Howden, Gurpreet Singh, Kevin Stork
8/17/2006
OAK RIDGE NATIONAL LABORATORYU. S. DEPARTMENT OF ENERGY
Study Focus Area: Sulfur Effects on Reductant Utilization by Lean NOx Trap Catalysts
• Lean NOx Trap (LNT) catalysts are effective at reducing NOx fromdiesel engines but need…− Periodic “regeneration” (rich exhaust) with suitable reductants− Durability against negative sulfur effects
Sulfur degrades performance over time by poisoning NOx sitesdeSulfation (high temperature clean up) recovers lost site activity
• ORNL has studied regeneration chemistry on a light-duty diesel engine platform with in-cylinder combustion techniques− Intra-catalyst sampling has been applied to characterize reductant
utilization [SAE 2006-01-1416, SAE 2005-01-3876, SAE 2004-01-3023]
• Study presented here focuses on the effects of sulfur on intra-catalyst chemistry during in-cylinder regeneration
OAK RIDGE NATIONAL LABORATORYU. S. DEPARTMENT OF ENERGY
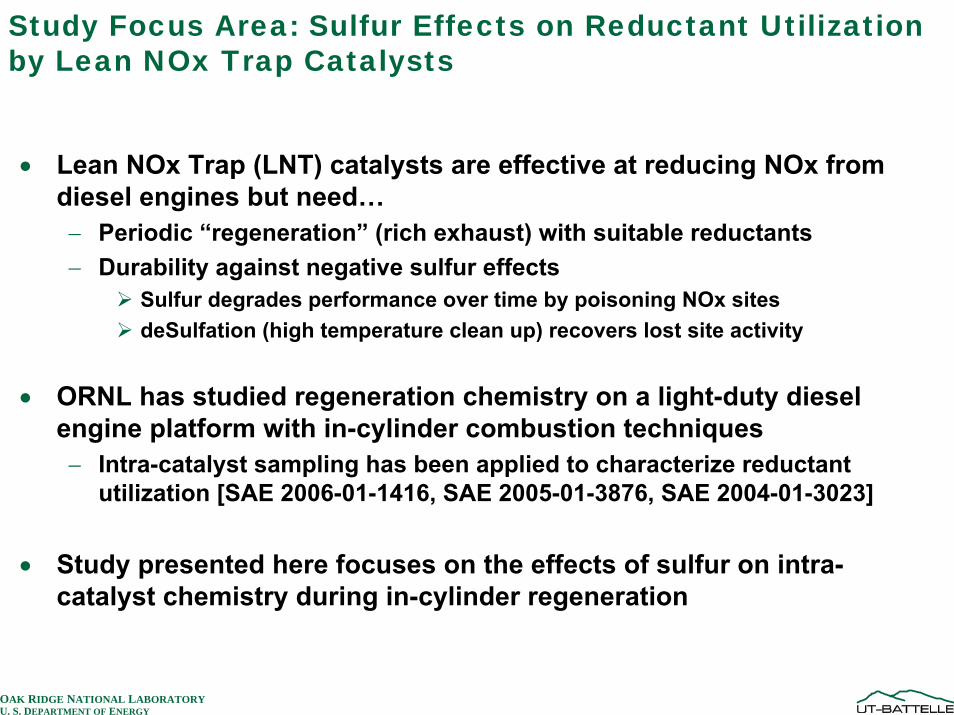
Two engine control strategies for achieving intermittent rich combustion for regeneration of LNT
main
pilot
“Delayed andExtended Main”
(DEM)
main
pilot
“Post 80 Injection”(P80)
post
Two LNT Regeneration Strategies Chosen Based on Difference in Chemistry• Delayed and Extended Main (DEM):
− Throttle for reduced air flow− Extra fuel injected near main injection timing to achieve rich conditions
• Post 80 Injection (P80):− Throttle for reduced air flow− Extra fuel injected after main injection later in cycle to achieve rich conditions
OAK RIDGE NATIONAL LABORATORYU. S. DEPARTMENT OF ENERGY
0.0
0.5
1.0
1.5
2.0
2.5
3.0
3.5
4.0
Spec
ies
Con
cent
ratio
n (%
)
0
5
10
15
20
25 Inlet Airflow
(g/s)CO
HC
H2
Airflow
CO
H2
Airflow
DEMHC
0 5 10 15 20 25 30
Time (sec)
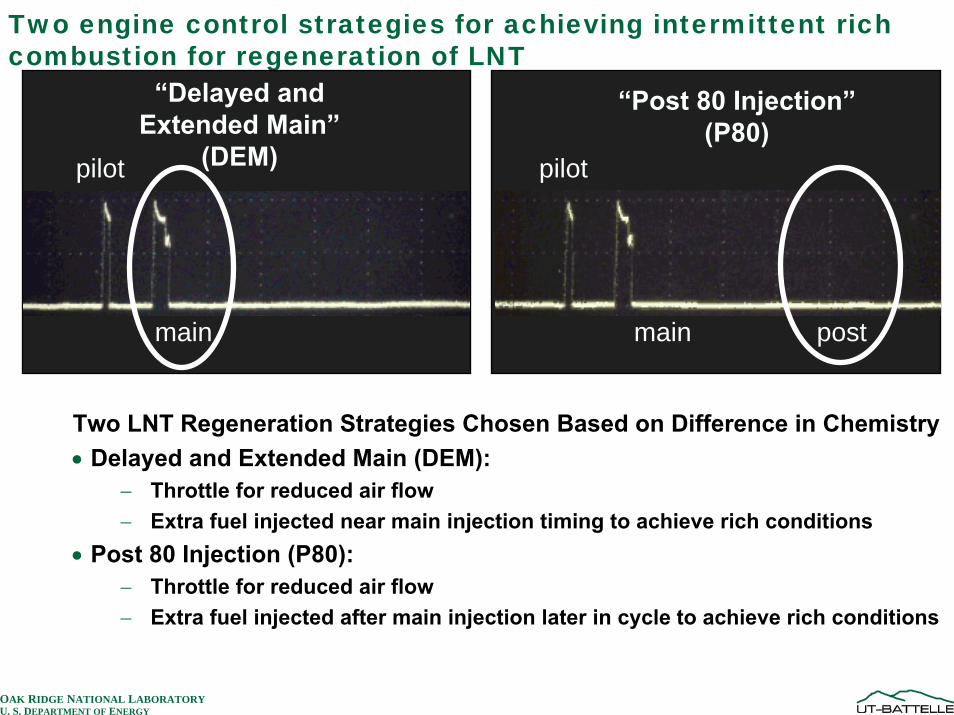
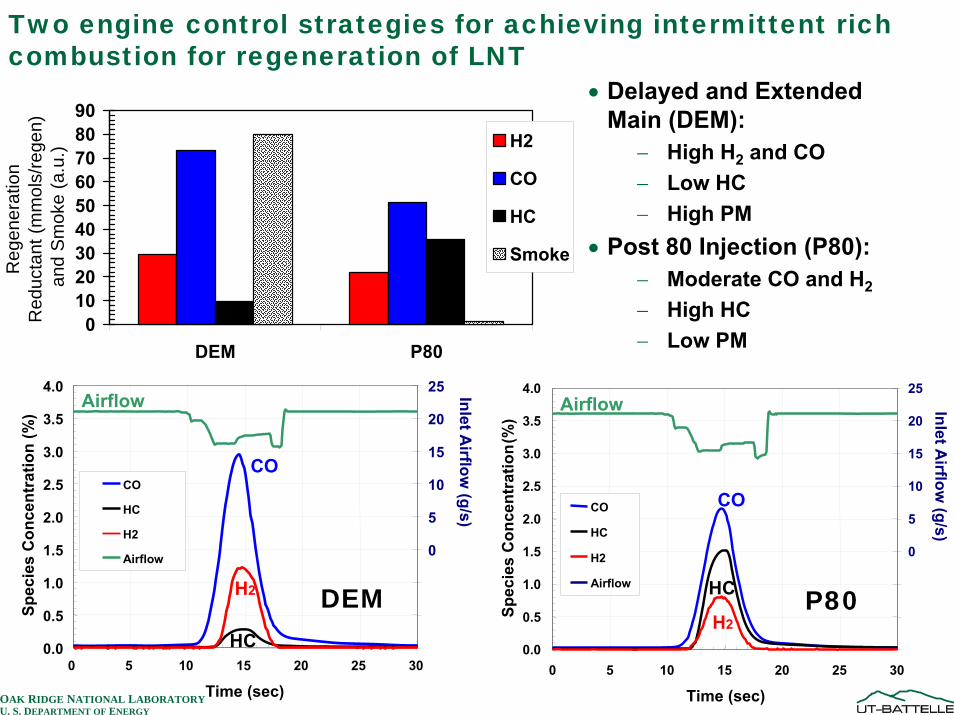
Two engine control strategies for achieving intermittent rich combustion for regeneration of LNT
0.0
0.5
1.0
1.5
2.0
2.5
3.0
3.5
4.0
0 5 10 15 20 25 30
Time (sec)
Spec
ies
Con
cent
ratio
n(%
)
15
10
5
0
5
10
15
20
25
Inlet Airflow
(g/s)
CO
HC
H2
Airflow
CO
H2
Airflow
P80HC
• Delayed and Extended Main (DEM):
− High H2 and CO− Low HC− High PM
• Post 80 Injection (P80):− Moderate CO and H2
− High HC− Low PM
0102030405060708090
DEM P80
Reg
ener
atio
n R
educ
tant
(mm
ols/
rege
n)
and
Sm
oke
(a.u
.) H2
CO
HC
Smoke
OAK RIDGE NATIONAL LABORATORYU. S. DEPARTMENT OF ENERGY
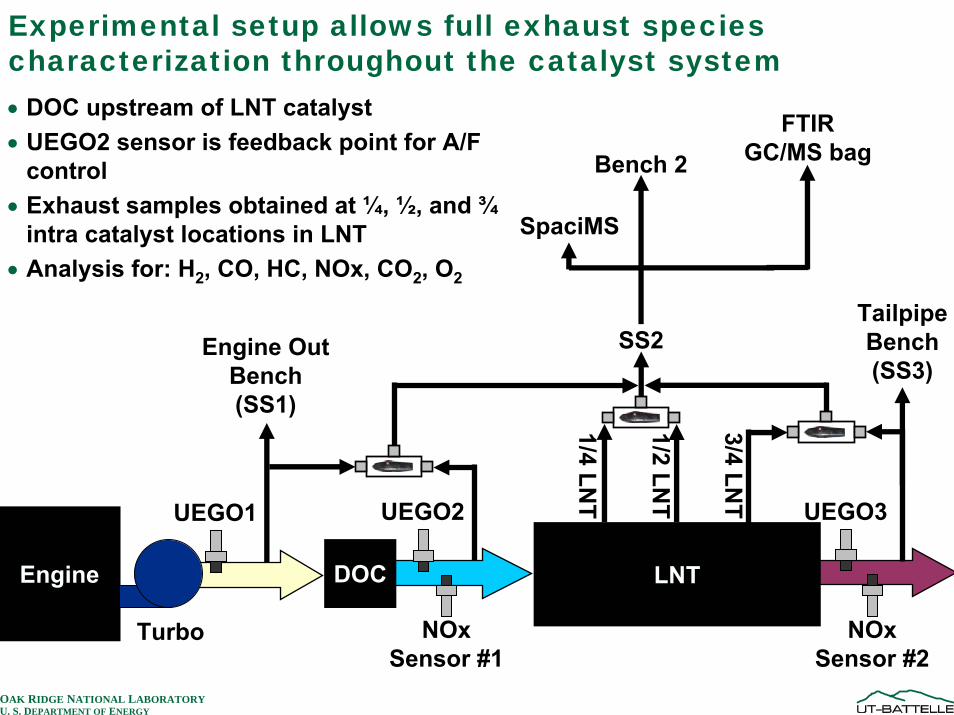
Experimental setup allows full exhaust species characterization throughout the catalyst system• DOC upstream of LNT catalyst• UEGO2 sensor is feedback point for A/F
control• Exhaust samples obtained at ¼, ½, and ¾
intra catalyst locations in LNT• Analysis for: H2, CO, HC, NOx, CO2, O2
Engine DOC LNT
Engine OutBench(SS1)
UEGO1 UEGO2 UEGO3
SS2
NOxSensor #1
NOxSensor #2
Turbo
1/4 LNT
1/2 LNT
3/4 LNT
FTIRGC/MS bag
(dilute)
Air
Bench 2
SpaciMS
TailpipeBench(SS3)
OAK RIDGE NATIONAL LABORATORYU. S. DEPARTMENT OF ENERGY
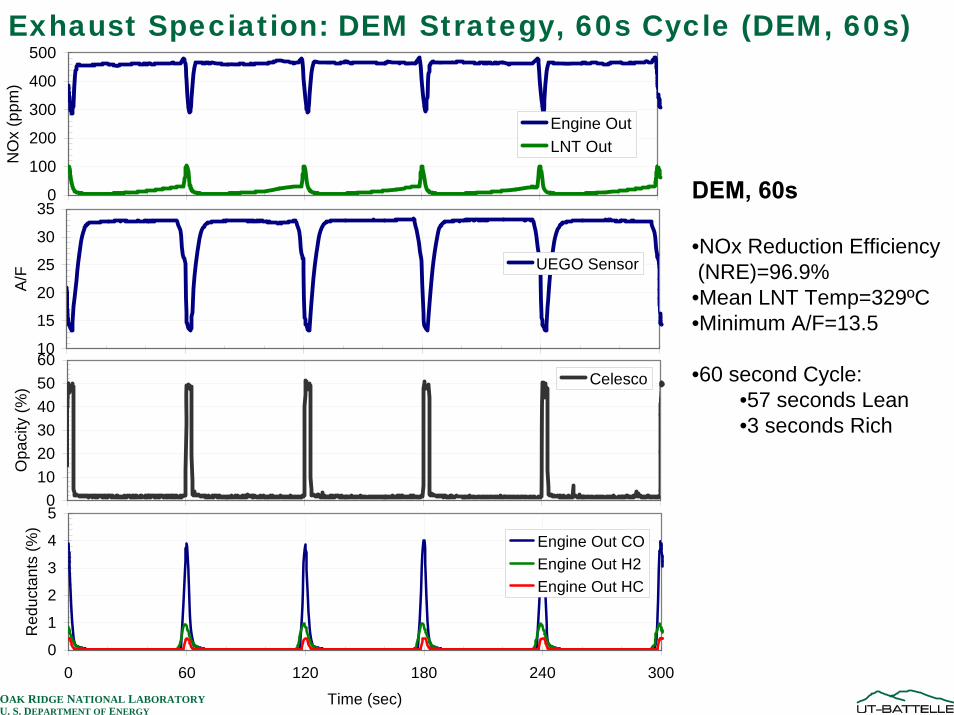
Exhaust Speciation: DEM Strategy, 60s Cycle (DEM, 60s)
0
100
200
300
400
500
NO
x (p
pm)
Engine OutLNT Out
10
15
20
25
30
35
A/F
UEGO Sensor
0102030405060
Opa
city
(%) Celesco
0
1
2
3
4
5
0 60 120 180 240 300
Time (sec)
Red
ucta
nts
(%)
Engine Out COEngine Out H2Engine Out HC
DEM, 60s
•NOx Reduction Efficiency(NRE)=96.9%
•Mean LNT Temp=329ºC•Minimum A/F=13.5
•60 second Cycle:•57 seconds Lean•3 seconds Rich
OAK RIDGE NATIONAL LABORATORYU. S. DEPARTMENT OF ENERGY
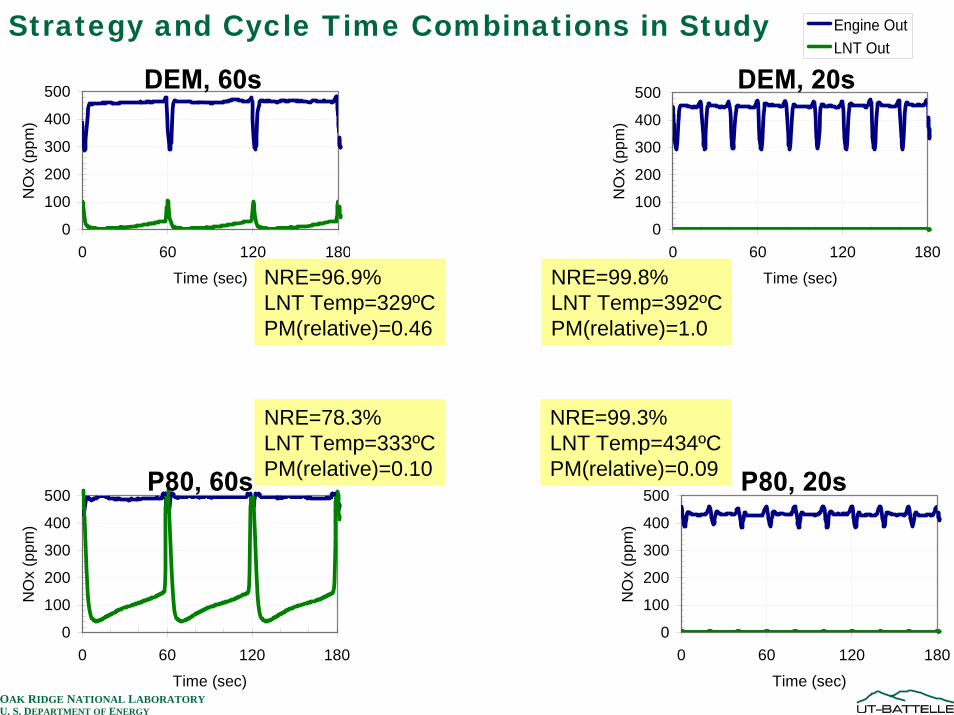
Strategy and Cycle Time Combinations in Study Engine OutLNT Out
0
100
200
300
400
500
0 60 120 180
Time (sec)
NO
x (p
pm)
DEM, 60s
0
100
200
300
400
500
0 60 120 180
Time (sec)
NO
x (p
pm)
DEM, 20s
NRE=96.9%LNT Temp=329ºCPM(relative)=0.46
NRE=99.8%LNT Temp=392ºCPM(relative)=1.0
0
100
200
300
400
500
0 60 120 180
Time (sec)
NO
x (p
pm)
0
100
200
300
400
500
0 60 120 180
Time (sec)
NO
x (p
pm)
NRE=78.3%LNT Temp=333ºCPM(relative)=0.10
NRE=99.3%LNT Temp=434ºCPM(relative)=0.09P80, 60s P80, 20s
OAK RIDGE NATIONAL LABORATORYU. S. DEPARTMENT OF ENERGY
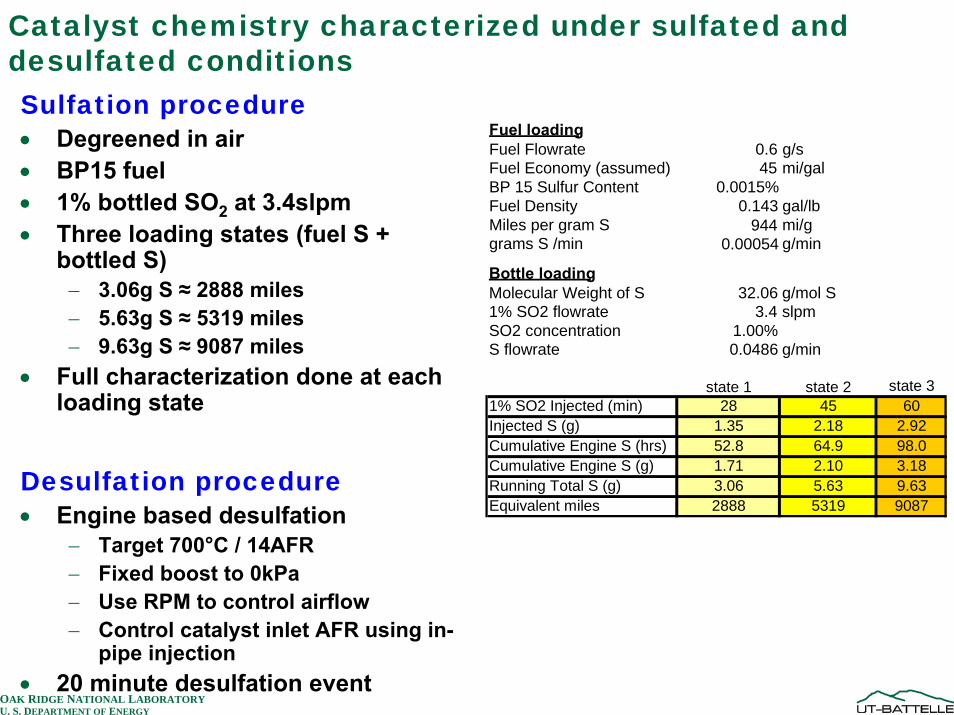
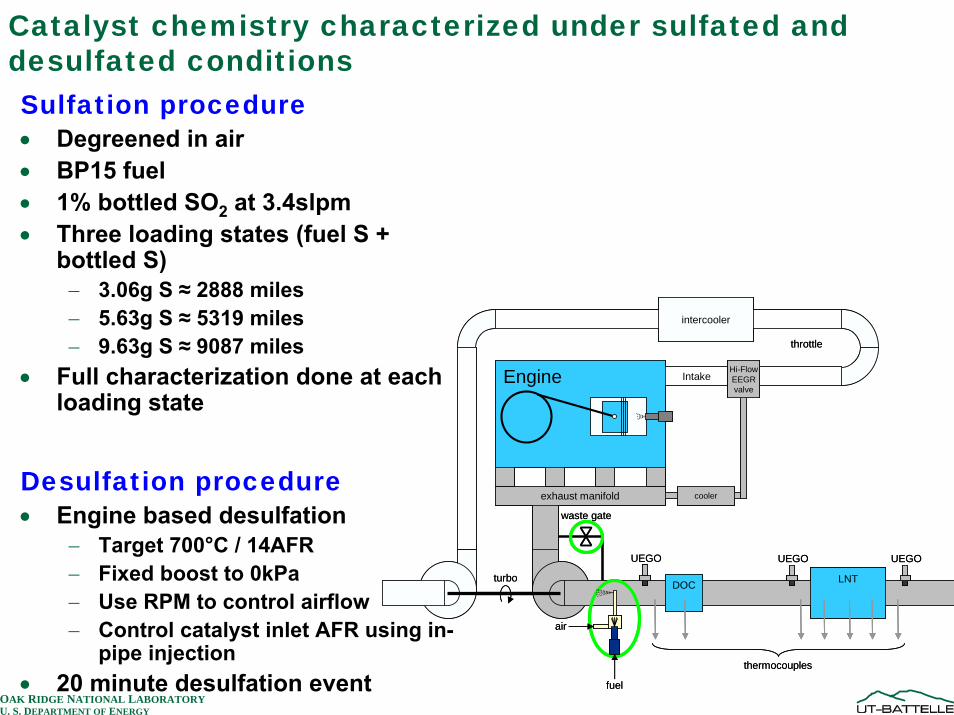
Catalyst chemistry characterized under sulfated and desulfated conditionsSulfation procedure• Degreened in air• BP15 fuel • 1% bottled SO2 at 3.4slpm• Three loading states (fuel S +
bottled S)− 3.06g S ≈ 2888 miles− 5.63g S ≈ 5319 miles− 9.63g S ≈ 9087 miles
• Full characterization done at each loading state
Desulfation procedure• Engine based desulfation
− Target 700°C / 14AFR− Fixed boost to 0kPa− Use RPM to control airflow− Control catalyst inlet AFR using in-
pipe injection• 20 minute desulfation event
Fuel loadingFuel Flowrate 0.6 g/sFuel Economy (assumed) 45 mi/galBP 15 Sulfur Content 0.0015%Fuel Density 0.143 gal/lb Miles per gram S 944 mi/ggrams S /min 0.00054 g/min
Bottle loadingMolecular Weight of S 32.06 g/mol S1% SO2 flowrate 3.4 slpmSO2 concentration 1.00%S flowrate 0.0486 g/min
state 1 state 2 state 31% SO2 Injected (min) 28 45 60Injected S (g) 1.35 2.18 2.92Cumulative Engine S (hrs) 52.8 64.9 98.0Cumulative Engine S (g) 1.71 2.10 3.18Running Total S (g) 3.06 5.63 9.63Equivalent miles 2888 5319 9087
OAK RIDGE NATIONAL LABORATORYU. S. DEPARTMENT OF ENERGY
Catalyst chemistry characterized under sulfated and desulfated conditionsSulfation procedure• Degreened in air• BP15 fuel • 1% bottled SO2 at 3.4slpm• Three loading states (fuel S +
bottled S)− 3.06g S ≈ 2888 miles− 5.63g S ≈ 5319 miles− 9.63g S ≈ 9087 miles
• Full characterization done at each loading state
Desulfation procedure• Engine based desulfation
− Target 700°C / 14AFR− Fixed boost to 0kPa− Use RPM to control airflow− Control catalyst inlet AFR using in-
pipe injection• 20 minute desulfation event
Engine Intake
exhaust manifold cooler
Hi-FlowEEGRvalve
DOC LNT
air
fuel
waste gate
intercooler
turbo
UEGO
thermocouples
UEGO UEGO
throttle
Engine Intake
exhaust manifold cooler
Hi-FlowEEGRvalve
DOC LNT
air
fuel
waste gate
intercooler
turbo
UEGO
thermocouples
UEGO UEGO
throttle
OAK RIDGE NATIONAL LABORATORYU. S. DEPARTMENT OF ENERGY
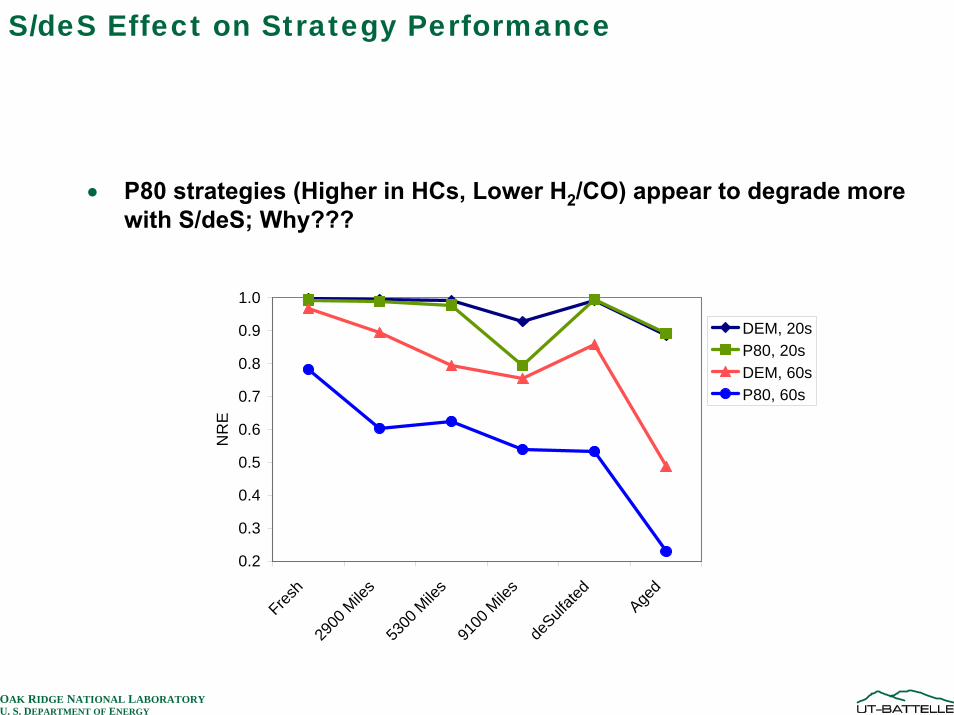
S/deS Effect on Strategy Performance
• P80 strategies (Higher in HCs, Lower H2/CO) appear to degrade more with S/deS; Why???
0.2
0.3
0.4
0.5
0.6
0.7
0.8
0.9
1.0
Fresh
2900
Mile
s53
00 M
iles
9100
Mile
sde
Sulfate
d
Aged
NR
E
DEM, 20sP80, 20sDEM, 60sP80, 60s
OAK RIDGE NATIONAL LABORATORYU. S. DEPARTMENT OF ENERGY
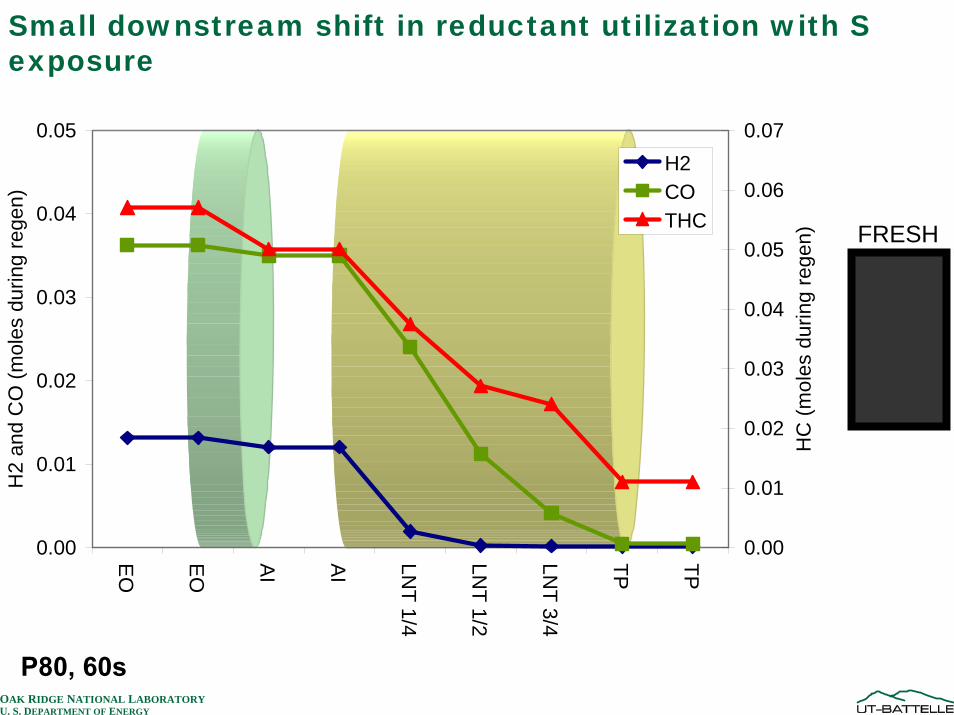
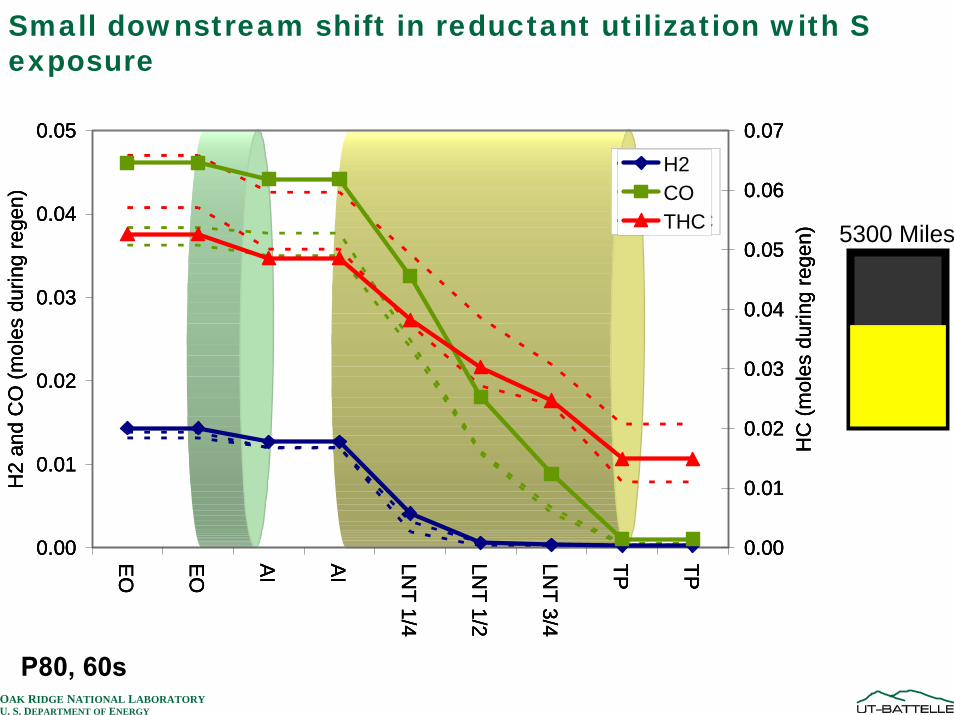
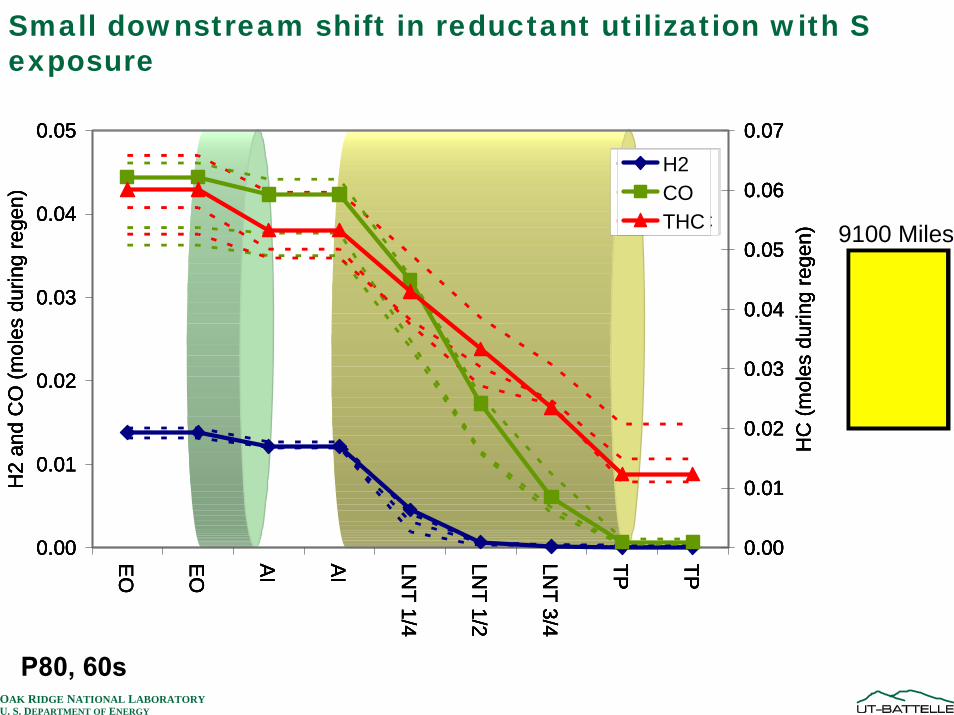
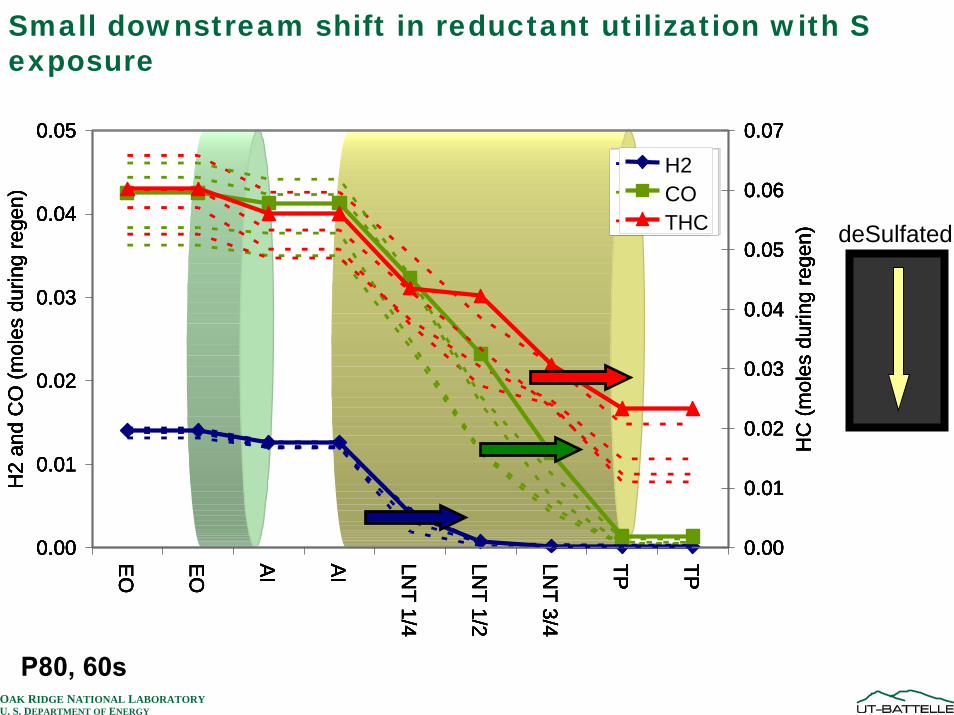
Small downstream shift in reductant utilization with S exposure
0.00
0.01
0.02
0.03
0.04
0.05
EO
EO
AI
AI
LNT 1/4
LNT 1/2
LNT 3/4
TP TP
H2
and
CO
(mol
es d
urin
g re
gen)
0.00
0.01
0.02
0.03
0.04
0.05
0.06
0.07
HC
(mol
es d
urin
g re
gen)
H2COTHC
P80, 60s, Fresh
FRESH
P80, 60s
OAK RIDGE NATIONAL LABORATORYU. S. DEPARTMENT OF ENERGY
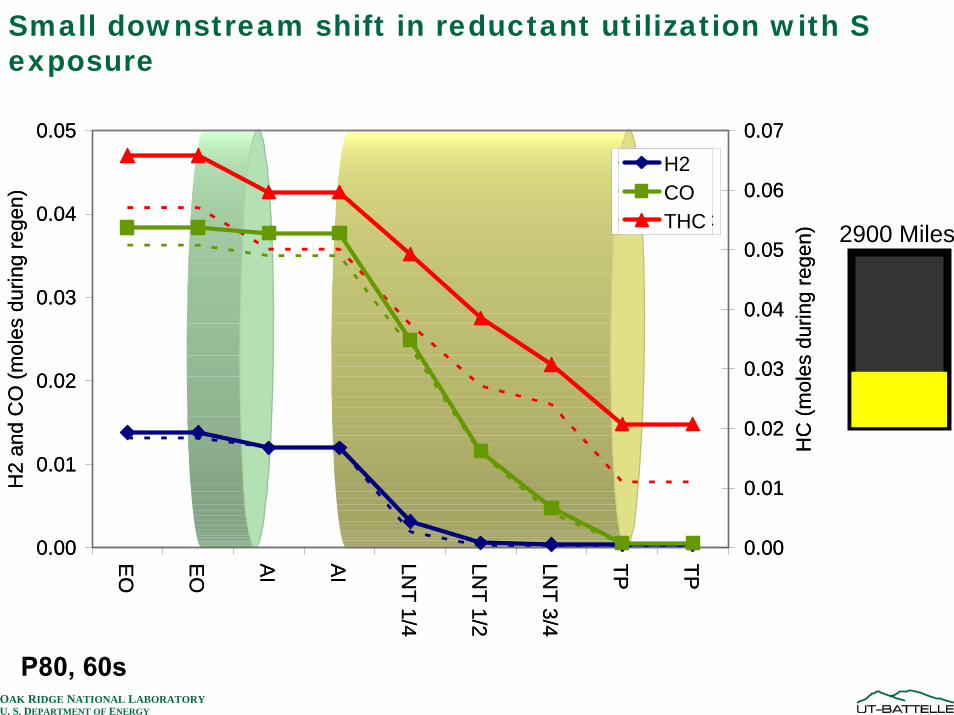
Small downstream shift in reductant utilization with S exposure
0.00
0.01
0.02
0.03
0.04
0.05
EO
EO
AI
AI
LNT 1/4
LNT 1/2
LNT 3/4
TP TP
H2
and
CO
(mol
es d
urin
g re
gen)
0.00
0.01
0.02
0.03
0.04
0.05
0.06
0.07
HC
(mol
es d
urin
g re
gen)
H2COTHC
P80, 60s, Fresh
0.00
0.01
0.02
0.03
0.04
0.05
EO
EO
AI
AI
LNT 1/4
LNT 1/2
LNT 3/4
TP TP
H2
and
CO
(mol
es d
urin
g re
gen)
0.00
0.01
0.02
0.03
0.04
0.05
0.06
0.07
HC
(mol
es d
urin
g re
gen)
H2COTHC
P80, 60s, Mild
2900 Miles
P80, 60s
OAK RIDGE NATIONAL LABORATORYU. S. DEPARTMENT OF ENERGY
Small downstream shift in reductant utilization with S exposure
0.00
0.01
0.02
0.03
0.04
0.05
EO
EO
AI
AI
LNT 1/4
LNT 1/2
LNT 3/4
TP TP
H2
and
CO
(mol
es d
urin
g re
gen)
0.00
0.01
0.02
0.03
0.04
0.05
0.06
0.07
HC
(mol
es d
urin
g re
gen)
H2COTHC
P80, 60s, Fresh
0.00
0.01
0.02
0.03
0.04
0.05
EO
EO
AI
AI
LNT 1/4
LNT 1/2
LNT 3/4
TP TP
H2
and
CO
(mol
es d
urin
g re
gen)
0.00
0.01
0.02
0.03
0.04
0.05
0.06
0.07
HC
(mol
es d
urin
g re
gen)
H2COTHC
P80, 60s, Mild
0.00
0.01
0.02
0.03
0.04
0.05
EO
EO
AI
AI
LNT 1/4
LNT 1/2
LNT 3/4
TP TP
H2
and
CO
(mol
es d
urin
g re
gen)
0.00
0.01
0.02
0.03
0.04
0.05
0.06
0.07
HC
(mol
es d
urin
g re
gen)
H2COTHC
P80, 60s, Mild
5300 Miles
P80, 60s
OAK RIDGE NATIONAL LABORATORYU. S. DEPARTMENT OF ENERGY
Small downstream shift in reductant utilization with S exposure
0.00
0.01
0.02
0.03
0.04
0.05
EO
EO
AI
AI
LNT 1/4
LNT 1/2
LNT 3/4
TP TP
H2
and
CO
(mol
es d
urin
g re
gen)
0.00
0.01
0.02
0.03
0.04
0.05
0.06
0.07
HC
(mol
es d
urin
g re
gen)
H2COTHC
P80, 60s, Fresh
0.00
0.01
0.02
0.03
0.04
0.05
EO
EO
AI
AI
LNT 1/4
LNT 1/2
LNT 3/4
TP TP
H2
and
CO
(mol
es d
urin
g re
gen)
0.00
0.01
0.02
0.03
0.04
0.05
0.06
0.07
HC
(mol
es d
urin
g re
gen)
H2COTHC
P80, 60s, Mild
0.00
0.01
0.02
0.03
0.04
0.05
EO
EO
AI
AI
LNT 1/4
LNT 1/2
LNT 3/4
TP TP
H2
and
CO
(mol
es d
urin
g re
gen)
0.00
0.01
0.02
0.03
0.04
0.05
0.06
0.07
HC
(mol
es d
urin
g re
gen)
H2COTHC
P80, 60s, Mild
0.00
0.01
0.02
0.03
0.04
0.05
EO
EO
AI
AI
LNT 1/4
LNT 1/2
LNT 3/4
TP TP
H2
and
CO
(mol
es d
urin
g re
gen)
0.00
0.01
0.02
0.03
0.04
0.05
0.06
0.07
HC
(mol
es d
urin
g re
gen)
H2COTHC
P80, 60s, 9100mile
9100 Miles
P80, 60s
OAK RIDGE NATIONAL LABORATORYU. S. DEPARTMENT OF ENERGY
Small downstream shift in reductant utilization with S exposure
deSulfated
0.00
0.01
0.02
0.03
0.04
0.05
EO
EO
AI
AI
LNT 1/4
LNT 1/2
LNT 3/4
TP TP
H2
and
CO
(mol
es d
urin
g re
gen)
0.00
0.01
0.02
0.03
0.04
0.05
0.06
0.07
HC
(mol
es d
urin
g re
gen)
H2COTHC
P80, 60s, Fresh
0.00
0.01
0.02
0.03
0.04
0.05
EO
EO
AI
AI
LNT 1/4
LNT 1/2
LNT 3/4
TP TP
H2
and
CO
(mol
es d
urin
g re
gen)
0.00
0.01
0.02
0.03
0.04
0.05
0.06
0.07
HC
(mol
es d
urin
g re
gen)
H2COTHC
P80, 60s, Mild
0.00
0.01
0.02
0.03
0.04
0.05
EO
EO
AI
AI
LNT 1/4
LNT 1/2
LNT 3/4
TP TP
H2
and
CO
(mol
es d
urin
g re
gen)
0.00
0.01
0.02
0.03
0.04
0.05
0.06
0.07
HC
(mol
es d
urin
g re
gen)
H2COTHC
P80, 60s, Mild
0.00
0.01
0.02
0.03
0.04
0.05
EO
EO
AI
AI
LNT 1/4
LNT 1/2
LNT 3/4
TP TP
H2
and
CO
(mol
es d
urin
g re
gen)
0.00
0.01
0.02
0.03
0.04
0.05
0.06
0.07
HC
(mol
es d
urin
g re
gen)
H2COTHC
P80, 60s, deS
0.00
0.01
0.02
0.03
0.04
0.05
EO
EO
AI
AI
LNT 1/4
LNT 1/2
LNT 3/4
TP TP
H2
and
CO
(mol
es d
urin
g re
gen)
0.00
0.01
0.02
0.03
0.04
0.05
0.06
0.07
HC
(mol
es d
urin
g re
gen)
H2COTHC
P80, 60s, 9100mile
P80, 60s
H2COTHC
OAK RIDGE NATIONAL LABORATORYU. S. DEPARTMENT OF ENERGY
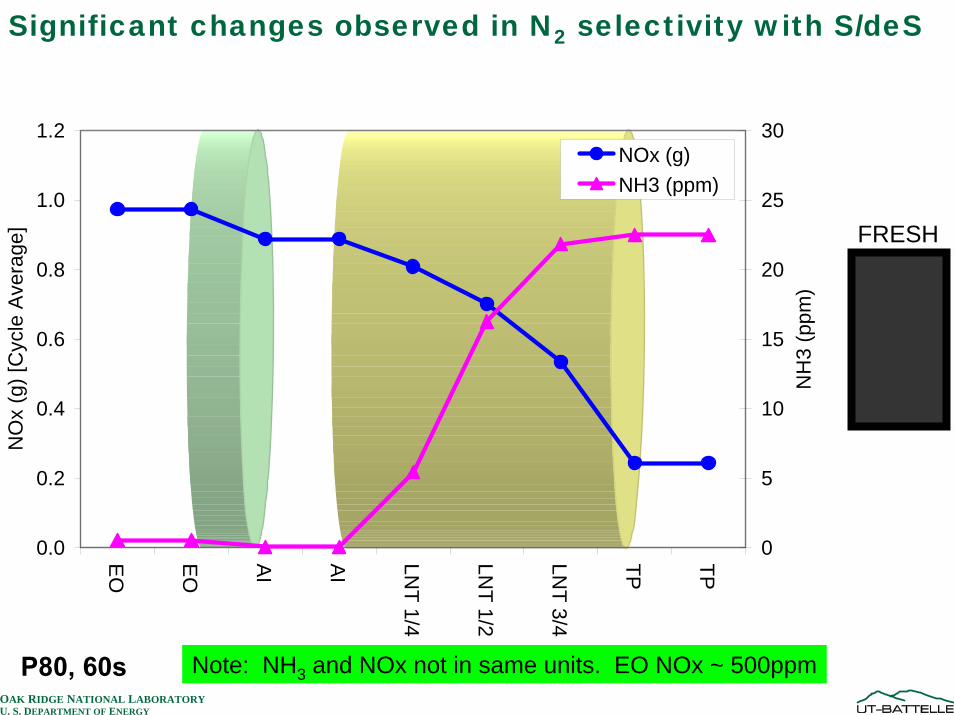
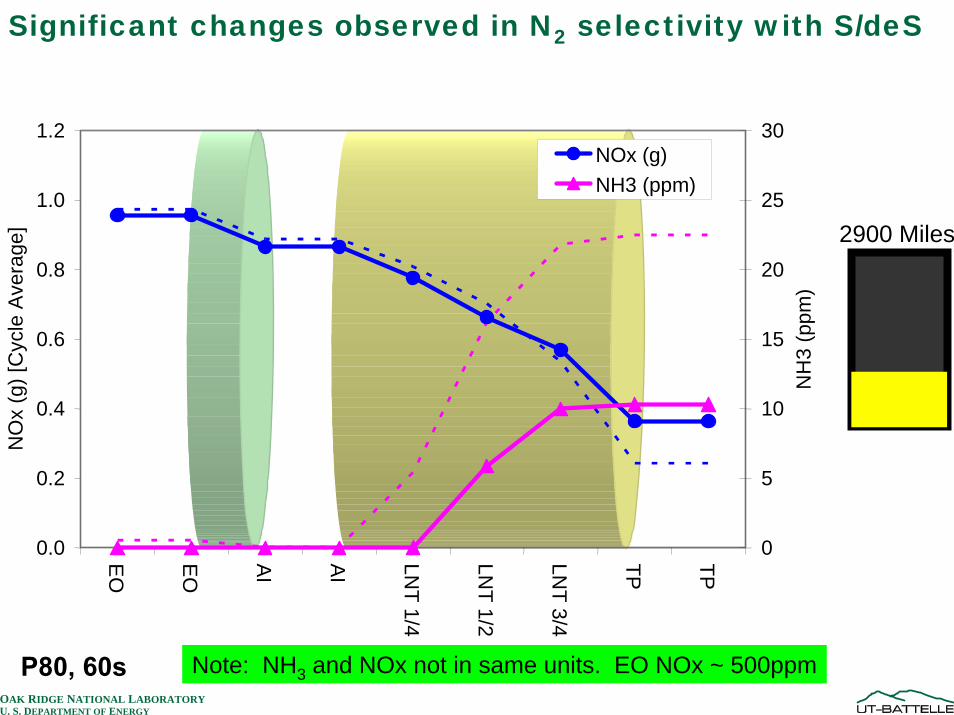
Significant changes observed in N2 selectivity with S/deS
0.0
0.2
0.4
0.6
0.8
1.0
1.2
EO
EO
AI
AI
LNT 1/4
LNT 1/2
LNT 3/4
TP TP
NO
x (g
) [C
ycle
Ave
rage
]
0
5
10
15
20
25
30
NH
3 (p
pm)
NOx (g)NH3 (ppm)
P80, 60s, Fresh
Note: NH3 and NOx not in same units. EO NOx ~ 500ppm
FRESH
P80, 60s
OAK RIDGE NATIONAL LABORATORYU. S. DEPARTMENT OF ENERGY
0.0
0.2
0.4
0.6
0.8
1.0
1.2
EO
EO
AI
AI
LNT 1/4
LNT 1/2
LNT 3/4
TP TP
NO
x (g
) [C
ycle
Ave
rage
]
0
5
10
15
20
25
30
NH
3 (p
pm)
NOx (g)NH3 (ppm)
P80, 60s, Mild
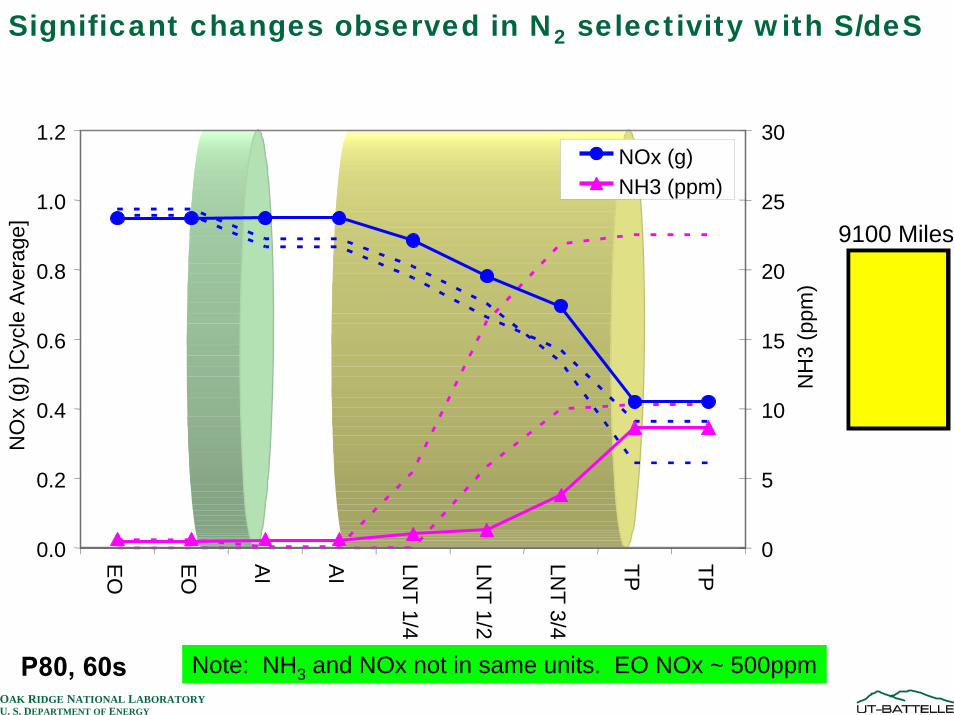
Significant changes observed in N2 selectivity with S/deS
2900 Miles
P80, 60s Note: NH3 and NOx not in same units. EO NOx ~ 500ppm
OAK RIDGE NATIONAL LABORATORYU. S. DEPARTMENT OF ENERGY
Significant changes observed in N2 selectivity with S/deS
9100 Miles
P80, 60s Note: NH3 and NOx not in same units. EO NOx ~ 500ppm
0.0
0.2
0.4
0.6
0.8
1.0
1.2
EO
EO
AI
AI
LNT 1/4
LNT 1/2
LNT 3/4
TP TP
NO
x (g
) [C
ycle
Ave
rage
]
0
5
10
15
20
25
30
NH
3 (p
pm)
NOx (g)NH3 (ppm)
OAK RIDGE NATIONAL LABORATORYU. S. DEPARTMENT OF ENERGY
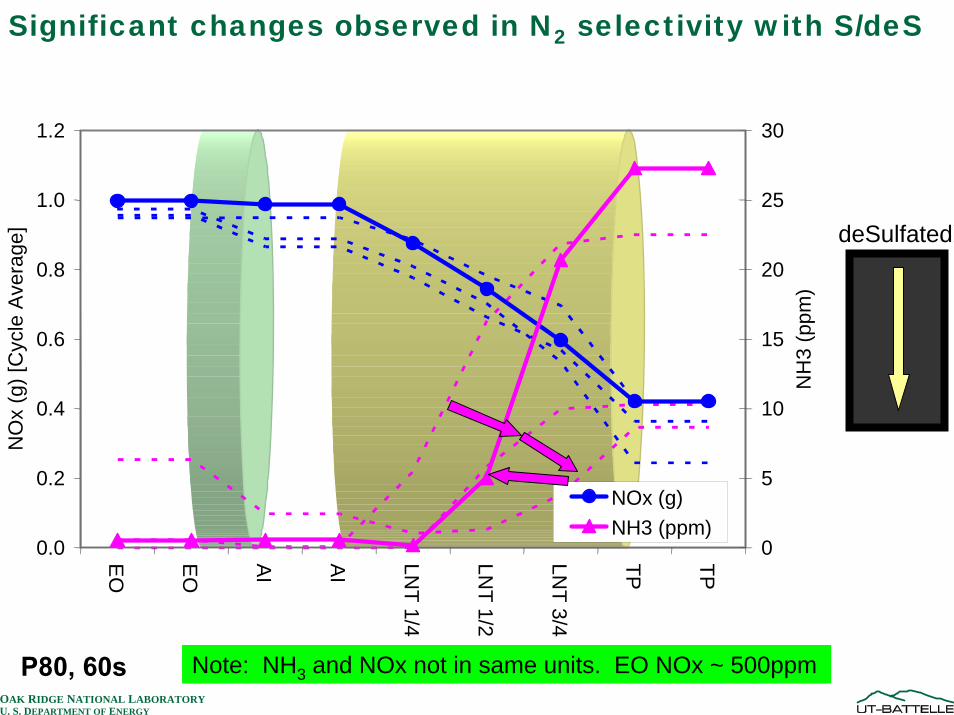
Significant changes observed in N2 selectivity with S/deS
deSulfated
P80, 60s Note: NH3 and NOx not in same units. EO NOx ~ 500ppm
0.0
0.2
0.4
0.6
0.8
1.0
1.2
EO
EO
AI
AI
LNT 1/4
LNT 1/2
LNT 3/4
TP TP
NO
x (g
) [C
ycle
Ave
rage
]
0
5
10
15
20
25
30
NH
3 (p
pm)
NOx (g)NH3 (ppm)
P80, 60s, deS
Note: NH3 and NOx not in same units. EO NOx ~ 500ppm
OAK RIDGE NATIONAL LABORATORYU. S. DEPARTMENT OF ENERGY
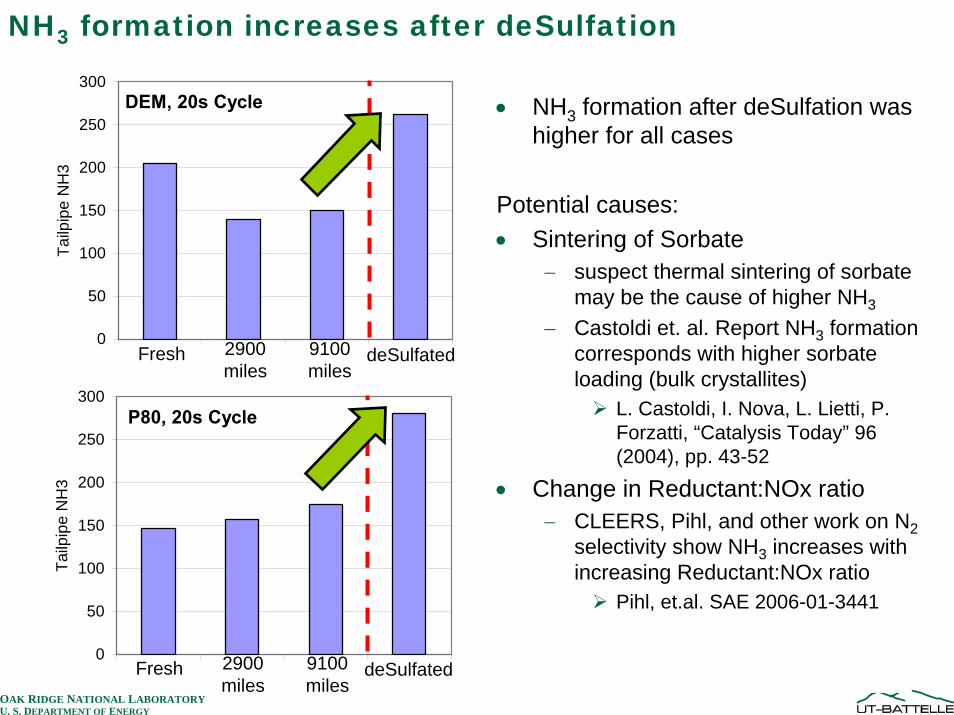
NH3 formation increases after deSulfation
DEM, 20s Cycle
0
50
100
150
200
250
300Ta
ilpip
e N
H3
P80, 20s Cycle
0
50
100
150
200
250
300
Tailp
ipe
NH
3
DEM, 60s Cycle
0
50
100
150
200
250
300
Tailp
ipe
NH
3
P80, 60s Cycle
0
50
100
150
200
250
300
Tailp
ipe
NH
3
Fresh 2900miles
9100miles
deSulfated
Fresh 2900miles
9100miles
deSulfated
Fresh 2900miles
9100miles
deSulfated
Fresh 2900miles
9100miles
deSulfated
• NH3 formation after deSulfation was higher for all cases
Potential causes:• Sintering of Sorbate
− suspect thermal sintering of sorbate may be the cause of higher NH3
− Castoldi et. al. Report NH3 formation corresponds with higher sorbate loading (bulk crystallites)
L. Castoldi, I. Nova, L. Lietti, P. Forzatti, “Catalysis Today” 96 (2004), pp. 43-52
• Change in Reductant:NOx ratio− CLEERS, Pihl, and other work on N2
selectivity show NH3 increases with increasing Reductant:NOx ratio
Pihl, et.al. SAE 2006-01-3441
OAK RIDGE NATIONAL LABORATORYU. S. DEPARTMENT OF ENERGY
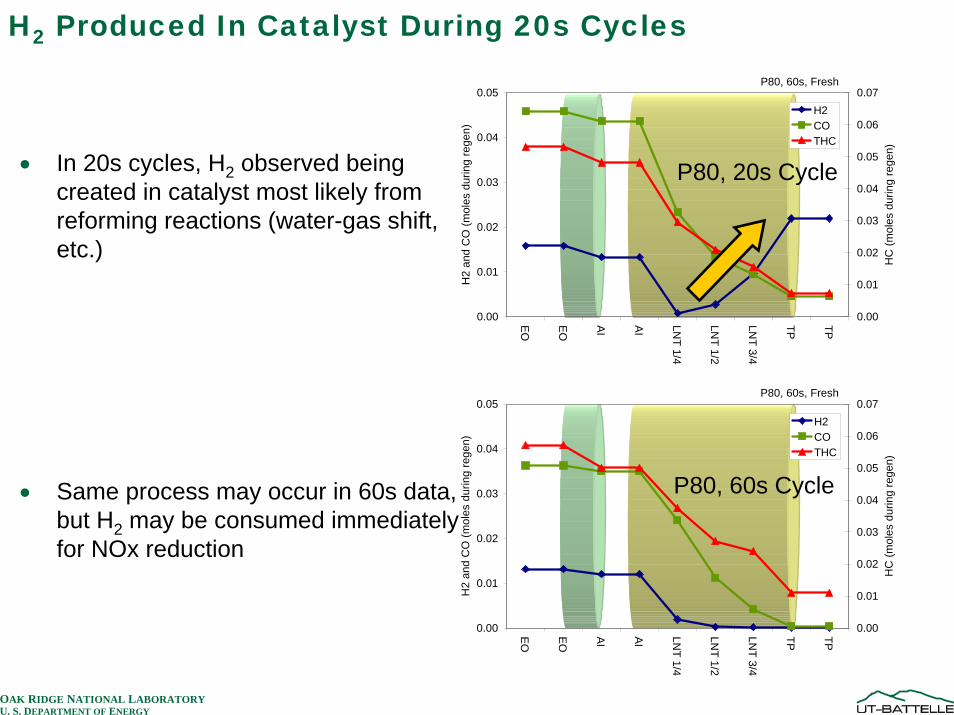
H2 Produced In Catalyst During 20s Cycles
• In 20s cycles, H2 observed being created in catalyst most likely from reforming reactions (water-gas shift, etc.)
• Same process may occur in 60s data, but H2 may be consumed immediately for NOx reduction
0.00
0.01
0.02
0.03
0.04
0.05
EO EO AI AI LNT 1/4
LNT 1/2
LNT 3/4
TP TP
H2
and
CO
(mol
es d
urin
g re
gen)
0.00
0.01
0.02
0.03
0.04
0.05
0.06
0.07
HC
(mol
es d
urin
g re
gen)
H2COTHC
P80, 60s, Fresh
P80, 20s Cycle
0.00
0.01
0.02
0.03
0.04
0.05
EO EO AI AI LNT 1/4
LNT 1/2
LNT 3/4
TP TP
H2
and
CO
(mol
es d
urin
g re
gen)
0.00
0.01
0.02
0.03
0.04
0.05
0.06
0.07
HC
(mol
es d
urin
g re
gen)
H2COTHC
P80, 60s, Fresh
P80, 60s Cycle
OAK RIDGE NATIONAL LABORATORYU. S. DEPARTMENT OF ENERGY
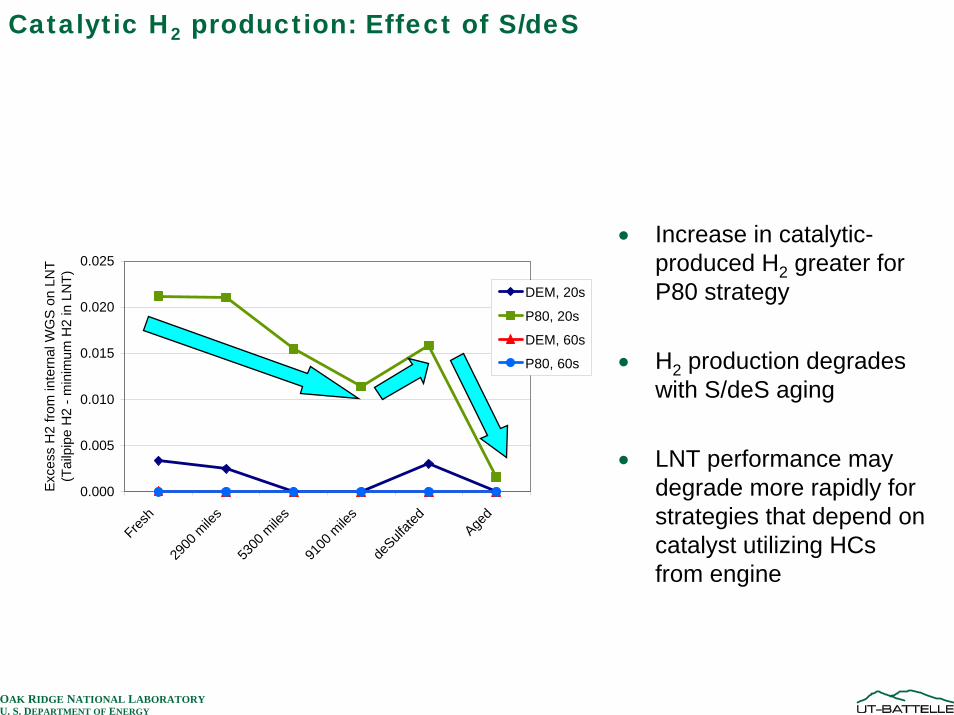
Catalytic H2 production: Effect of S/deS
• Increase in catalytic-produced H2 greater for P80 strategy
• H2 production degrades with S/deS aging
• LNT performance may degrade more rapidly for strategies that depend on catalyst utilizing HCs from engine
0.000
0.005
0.010
0.015
0.020
0.025
Fresh
2900
mile
s
5300
mile
s
9100
mile
s
deSulf
ated
Aged
Exc
ess
H2
from
inte
rnal
WG
S o
n LN
T(T
ailp
ipe
H2
- min
imum
H2
in L
NT)
DEM, 20s
P80, 20s
DEM, 60s
P80, 60s
OAK RIDGE NATIONAL LABORATORYU. S. DEPARTMENT OF ENERGY
Summary
• In general, reductant utilization in LNT moved downstream only slightly with S/deS− Process is consistent; optimism for modeling
• NH3 formation increased after deSulfation process− Regeneration control strategies must adjust accordingly with age
• Strategies with high HC and low H2/CO (P80) may depend on catalytic H2/CO production for regeneration− S/deS degradation of catalytic H2/CO production may have greater
degradation impact on the effectiveness of P80-like strategies
• Preparing Paper for SAE Fall Powertrain and Fluids Conference