intracellular magnetite biomineralization in bacteria proceeds by a distinct pathway involving...
TRANSCRIPT
BiomineralizationDOI: 10.1002/anie.200700927
Intracellular Magnetite Biomineralization in Bacteria Proceeds by aDistinct Pathway Involving Membrane-Bound Ferritin and an Iron(II)Species**Damien Faivre, Lars H. B�ttger, Berthold F. Matzanke, and Dirk Sch�ler*
Magnetotactic bacteria (MTB) are microorganisms that havethe ability to navigate along geomagnetic field lines owing tothe presence of magnetosomes, which are intracellularorganelles comprising membrane-enveloped crystals of amagnetic material.[1] The unique crystalline and magneticproperties of magnetosomes have brought them into the focusof multidisciplinary interest as they are used in biotechno-logical applications[2] or as biomarkers for life on Mars.[3]
Under microoxic conditions, the magnetotactic bacteriumMagnetospirillum gryphiswaldense biomineralizes up to 100cubooctahedral magnetite (Fe3O4) crystals per cell, which isaccompanied by the intracellular accumulation of tremen-dous amounts of iron (up to 4% of the dry weight[4]). Thisamount indicates that MTB use very efficient systems foruptake, transport, and precipitation of iron that, however, arestill poorly understood. On the basis of M-ssbauer spectro-scopic and biochemical analyses, it was suggested that forbacterial magnetite formation, Fe3+ ions are taken up fromthe environment and subsequently reduced intracellularly.Mineral precipitation then occurs within the magnetosome
vesicles, possibly by partial reduction of a hydrated ferricoxide.[5–7]
However, individual steps of the mechanism haveremained obscure, as previous approaches were limitedowing to an insufficient control of growth rate and extra-cellular oxygen concentrations during bacterial cultivation. Inparticular, no time-resolved data from early steps of magne-tite precipitation are available. Thus, the following questionsare addressed in this study:1) Which iron species are transported from the cell exterior
into the magnetosome vesicles?2) Are there any inorganic phases in addition to magnetite
associated with magnetosomes, for example, a precursorsuch as ferrihydrite (Fe5HO8·4H2O) or an oxidized phasesuch as maghemite (g-Fe2O3)?
3) Are the metabolic routes of intracellular iron used for thebiosynthesis of magnetite the same as those involved ingeneral iron metabolism in nonmagnetic cells?
In this study, we used a cell-suspension assay for thegrowth-independent study of magnetite formation underhighly controlled conditions. M-ssbauer spectroscopy andelectron microscopy were employed for time-resolved anal-ysis of the intracellular iron metabolite pattern of iron-induced magnetosome formation.
Magnetite formation could be induced in iron-starvednonmagnetic wild-type (WT) cells by the addition of eitherferric citrate or ferrous ascorbate (Figure 1), indicating thatthe bacteria are capable of intracellular reduction or oxida-tion of extracellular iron to form the mixed-valence Fe3O4
crystals. Magnetite crystallites were not detected by TEMuntil 55 min after iron addition, coincident with the appear-ance of magnetically oriented cells as detected by Cmag
measurements (Figure 1). Over time, the average particledimensions increased from 18.1 to 31.5 nm, and the number ofcrystals per cell from 16 to 30. After 6 h, formation of chainswas complete. Electron diffraction (ED) revealed thatmagnetosome particles at all stages consisted exclusively ofmagnetite, as no other mineral phase or structure could bedetected (data not shown), although ferrihydrite might haveescaped detection by ED owing to its poor crystallinity.[8]
In Figure 2a, typical M-ssbauer spectra of whole cells,20 h after induction and at 130 K (spectrum A) and 4.3 K(spectrum B), are presented; the corresponding M-ssbauerparameters are listed in Table 1. M-ssbauer spectra can becharacterized by three different parameters: the isomer shiftd, the quadrupole splitting DEQ, and the magnetic hyperfinefield BHF. In the absence of quadrupole splitting or magnetic
[*] Prof. D. Sch�lerMicrobiologyDepartment of BiologyLMU M�nchenMaria-Ward-Strasse 1a, 80638 M�nchen (Germany)Fax: (+49)89-2180-6127E-mail: [email protected]
Dr. D. Faivre,[+] Prof. D. Sch�lerDepartment of MicrobiologyMax Planck Institute for Marine MicrobiologyCelsiusstrasse 1, 28359 Bremen (Germany)
L. H. B>ttgerInstitute of PhysicsUniversity of L�beckRatzeburger Allee 160, 23538 L�beck (Germany)
Prof. B. F. MatzankeIsotopes LaboratoryUniversity of L�beckRatzeburger Allee 160, 23538 L�beck (Germany)
[+] Current address:Max-Plank-Institut f�r Kolloid- und GrenzflBchenforschungAbteilung BiomaterialienWissenschaftspark Golm, 14424 Potsdam (Germany)
[**] This research was supported by the Max Planck Society and theBiofuture program of the BMBF. R. Sonntag is acknowledged forhelp with the fermentation procedure and J. Schorch for technicalassistance with the cell fractioning. D.F. acknowledges supportfrom a Marie Curie Fellowship from the European Union (projectBacMag, EIF-2005-009637).
AngewandteChemie
8495Angew. Chem. Int. Ed. 2007, 46, 8495 –8499 � 2007 Wiley-VCH Verlag GmbH & Co. KGaA, Weinheim

interaction, a single resonance absorption is observed, whichis characterized by the isomer shift d. It originates from theelectric monopole interaction between the nucleus andelectronic shell. The isomer shift is a measure for theoxidation state and for the degree of covalent bonding ofthe iron atom with the ligand. The quadrupole splitting DEQ
originates from the electric quadrupole interaction betweenthe nucleus and electronic shell. It results in the splitting ofthe resonance absorption line and is a measure for thesymmetry of the metal chelate and for the covalent distribu-tion of ligand–metal bonding. Finally, the magnetic hyperfinefieldBHF is a result of magnetic dipole interaction between thenucleus and electrons and generates six-line or even morecomplicated spectra.
In our experiments, the spectrum at 130 K exhibits twomagnetically split sextets attributed to magnetite A and Bsites (subspectrum 1 and 2, respectively, in Figure 2a),[5, 9,10]
high-spin [Fe2+(O/N)6x�]2�x (subspectrum 3 in Figure 2a,
oxygen or oxygen/nitrogen ligands), and an Fe3+ quadrupoledoublet (subspectrum 4 in Figure 2a). The Fe3+ doubletspecies displays features typical of ferrihydrite ((FeOOH)8·(FeOH2PO4)) and not of FeOOH.[9,11]
The biogenic origin of this material, that is, ferritin and notinorganic ferrihydrite, was further verified by biochemical
analysis. In SDS-PAGE (sodium dodecylsulfate poly-acrylamide gel electrophoresis) of the membrane andsoluble fractions of disrupted cells, a reddish, high-molecular-mass protein (M> 100 kDa) that carrieslarge amounts of iron and disintegrates into 20–40-kDa subunits (data not shown) could be identified.The spectrum at 4.3 K is dominated by a typicalmagnetite six-line pattern. The ferrihydrite doubletseen in the spectrum at 130 K is completely missing at4.3 K as a result of magnetic ordering. The six-linepattern of ferrihydrite is, however, not visible as adistinct species at 4.3 K because it is masked by thedominant magnetite and will only exhibit very broadlines caused by the typical particle distribution offerritin. The magnetic transition above 4.3 K indicatesthat either the magnetic anisotropy constant K or thevolume V of the crystallites is larger than in typicalbacterial ferritins,[11] a feature which fits better withmammalian-type ferritin exhibiting a low phosphatecontribution.
Figure 1. Time-resolved magnetosome formation after induction: Mag-netite formation was induced in resting iron-deprived cells by additionof either FeII or FeIII into the medium (black symbols and continuousline for FeIII, open symbols and dashed line for FeII) and was followedby intracellular iron accumulation ([Fe]intra (d.w.: dry weight), dia-monds), magnetic response (Cmag, squares), and TEM. The micro-graphs show the increase in particle number and dimensions (arrowpointed at every third magnetosome) in representative cells at differenttimes after induction (scale bar: 1 mm). Formation of chains iscomplete after 340 minutes.
Figure 2. a) M>ssbauer spectrum of whole WT cells after 1230 min ofmagnetite formation at 130 K (A) and 4.3 K (B). The spectrum at 130 Kconsists of two magnetite sextets (1 and 2), an Fe2+ component (3),and a ferritin doublet (4); individual components are represented bydashed or faded traces, with the addition of the components shownwith c. At 4.3 K the ferritin doublet vanishes and forms a magneti-cally split sextet beneath the magnetite components, which arebroadened owing to their Verwey transition. The transmission T isscaled to 1. b) M>ssbauer spectra of the mutant strain MSR-1B at80 K. Jagged gray trace: experimental data; c: addition of theindividual components; III) ferritin; I) FeII ; II) unspecified iron compo-nent.
Communications
8496 www.angewandte.org � 2007 Wiley-VCH Verlag GmbH & Co. KGaA, Weinheim Angew. Chem. Int. Ed. 2007, 46, 8495 –8499

All M-ssbauer spectra of whole WT cells of the inductionexperiments exhibit the same components as the M-ssbauerspectra of Figure 2a. By M-ssbauer spectroscopy, first tracesof magnetite, ferritin, and Fe2+ were detected already20 minutes after induction with 57Fe3+ citrate (Figure 3a,b).The amount of all components increases within 40 min. Then,the Fe2+ and ferritin contributions only slightly changewhereas magnetite growth accelerates. The magnetitegrowth rate decelerates 215 min after induction (Figure 3b).
As expected, no magnetite was detected by TEM andM-ssbauer spectroscopy in mutant strain MSR-1B, whichlacks the magnetosome genes as a result of deletion. Mutantcells (Figure 2b) were also shown to contain: an Fe2+ species(subspectrum I in Figure 2b), which however was present inlower quantities than in the WT; an unspecified compound(subspectrum II in Figure 2b), which might possibly be aniron–sulfur protein; and ferritin (subspectrum III in Fig-ure 2b). This observation suggests that two different meta-bolic routes for the intracellular iron might coexist, one tosatisfy biochemical requirements comprising ferritin andsmall amounts of Fe2+, and the other one comprising Fe2+
and magnetite. Experiments involving shifts of iron-replete,but nonmagnetic, cells to iron-depleted conditions indicatedthat these pools are not readily interchangeable in the WT(data not shown).
Nonmagnetic soluble fraction (SF) and membrane frac-tion (MF) and the isolated magnetic magnetosomes (IMs)were separated from disrupted mature cells with fullydeveloped magnetosome chains to determine the subcellularlocalization of the observed iron species. The IMs exclusivelyexhibited the typical two sextets (subspectra 5 and 6 inFigure 4a) of magnetite. This result was unexpected, as amagnetic sextet compound was identified by M-ssbauerspectroscopy in magnetosome preparations from the closelyrelated M. magnetotacticum and attributed to ferrihydrite.[6]
On the basis of this observation,after uptake and partial oxidationof Fe2+, the following mechanismincluding ferrihydrite as a precur-sor was proposed [Eqs. (1), (2)].
5 Fe3þ þ 5H2O! 5FeðOHÞx3�x
þ5Hþ ! Fe5HO8 � 4H2Oð1Þ
Fe5HO8 � 4H2Oþ Fe2þ ! Fe3O4 ð2Þ
In our study, the MF and SF(Figure 4b,c) yielded spectra con-sistent with ferritin (subspectra 7–9,13 in Figure 4b,c), an Fe2+ com-pound (subspectrum 12 in Fig-ure 4c), and a conspicuous com-pound present in low amount (sub-spectra 10 and 11 in Figure 4c).Fe2+ species, similar to thatobserved in M. gryphiswaldense,have been detected in many bacte-rial systems and were attributed to
a cytoplasmic low-molecular-mass Fe2+ pool.[12] Surprisingly,the Fe2+ ions found here were predominantly present in theMF, whereas only little Fe2+ was observed in the SF. The
Table 1: Summary of the M>ssbauer parameters used to fit the spectra. The numbers in parenthesescorrespond to the subspectra.
Sample T [K] d [mms�1] DEq [mms�1] BHF [T] Relative contribution [%]
Whole cellsmagnetite A (1) 130 0.38 0 49.5 23.9magnetite B (2) 130 0.76 0 47.4 47.8FeII (3) 130 1.27 2.81 – 6.4ferritin (4) 130 0.47 0.77 – 21.9
IMmagnetite A (5) 130 0.38 0 49.9 33.3magnetite B (6) 130 0.76 0 47.9 66.7
SFferritin[a] (7) 4.3 0.49 0.77 – 13.2ferritin[b] (8) 4.3 0.49 0 47.4 86.8ferritin (9) 77 0.47 0.77 – 100
MFsmall magnetite A (10) 130 0.38 0 46.8 4.3small magnetite B (11) 130 0.76 0 44.8 8.6FeII (12) 130 1.26 2.86 – 9.0ferritin (13) 130 0.47 0.77 – 78.1
[a] Relaxing part. [b] Nonrelaxing part, hyperfine distribution.
Figure 3. a) Stack graph of the M>ssbauer spectra at different timesafter iron induction. From top (black) to bottom (light gray): 20, 40,60, 95, 125, 155, 215, and 1230 min after 57Fe induction. b) Total areasA of the M>ssbauer spectra (scaled by sample masses) plotted againsttime after 57Fe induction: high-spin FeII (black, E), ferritin (dark gray,D), and magnetite (A and B sites; light gray, C). The lines are shownonly as a guide for the eyes.
AngewandteChemie
8497Angew. Chem. Int. Ed. 2007, 46, 8495 –8499 � 2007 Wiley-VCH Verlag GmbH & Co. KGaA, Weinheim www.angewandte.org
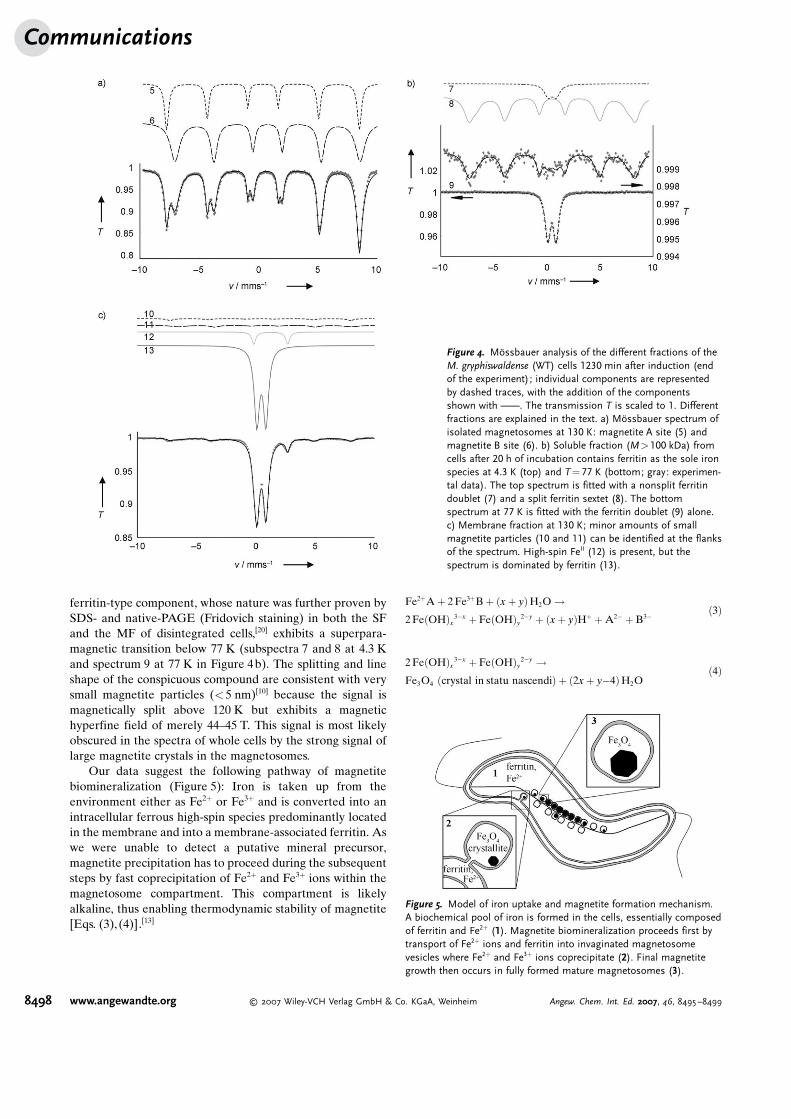
ferritin-type component, whose nature was further proven bySDS- and native-PAGE (Fridovich staining) in both the SFand the MF of disintegrated cells,[20] exhibits a superpara-magnetic transition below 77 K (subspectra 7 and 8 at 4.3 Kand spectrum 9 at 77 K in Figure 4b). The splitting and lineshape of the conspicuous compound are consistent with verysmall magnetite particles (< 5 nm)[10] because the signal ismagnetically split above 120 K but exhibits a magnetichyperfine field of merely 44–45 T. This signal is most likelyobscured in the spectra of whole cells by the strong signal oflarge magnetite crystals in the magnetosomes.
Our data suggest the following pathway of magnetitebiomineralization (Figure 5): Iron is taken up from theenvironment either as Fe2+ or Fe3+ and is converted into anintracellular ferrous high-spin species predominantly locatedin the membrane and into a membrane-associated ferritin. Aswe were unable to detect a putative mineral precursor,magnetite precipitation has to proceed during the subsequentsteps by fast coprecipitation of Fe2+ and Fe3+ ions within themagnetosome compartment. This compartment is likelyalkaline, thus enabling thermodynamic stability of magnetite[Eqs. (3), (4)].[13]
Fe2þAþ 2Fe3þBþ ðxþ yÞH2O!2FeðOHÞx3�x þ FeðOHÞy2�y þ ðxþ yÞHþ þA2� þB3�
ð3Þ
2FeðOHÞx3�x þ FeðOHÞy2�y !Fe3O4 ðcrystal in statu nascendiÞ þ ð2xþ y�4ÞH2O
ð4Þ
Figure 5. Model of iron uptake and magnetite formation mechanism.A biochemical pool of iron is formed in the cells, essentially composedof ferritin and Fe2+ (1). Magnetite biomineralization proceeds first bytransport of Fe2+ ions and ferritin into invaginated magnetosomevesicles where Fe2+ and Fe3+ ions coprecipitate (2). Final magnetitegrowth then occurs in fully formed mature magnetosomes (3).
Figure 4. M>ssbauer analysis of the different fractions of theM. gryphiswaldense (WT) cells 1230 min after induction (endof the experiment); individual components are representedby dashed traces, with the addition of the componentsshown with c. The transmission T is scaled to 1. Differentfractions are explained in the text. a) M>ssbauer spectrum ofisolated magnetosomes at 130 K: magnetite A site (5) andmagnetite B site (6). b) Soluble fraction (M>100 kDa) fromcells after 20 h of incubation contains ferritin as the sole ironspecies at 4.3 K (top) and T =77 K (bottom; gray: experimen-tal data). The top spectrum is fitted with a nonsplit ferritindoublet (7) and a split ferritin sextet (8). The bottomspectrum at 77 K is fitted with the ferritin doublet (9) alone.c) Membrane fraction at 130 K; minor amounts of smallmagnetite particles (10 and 11) can be identified at the flanksof the spectrum. High-spin FeII (12) is present, but thespectrum is dominated by ferritin (13).
Communications
8498 www.angewandte.org � 2007 Wiley-VCH Verlag GmbH & Co. KGaA, Weinheim Angew. Chem. Int. Ed. 2007, 46, 8495 –8499
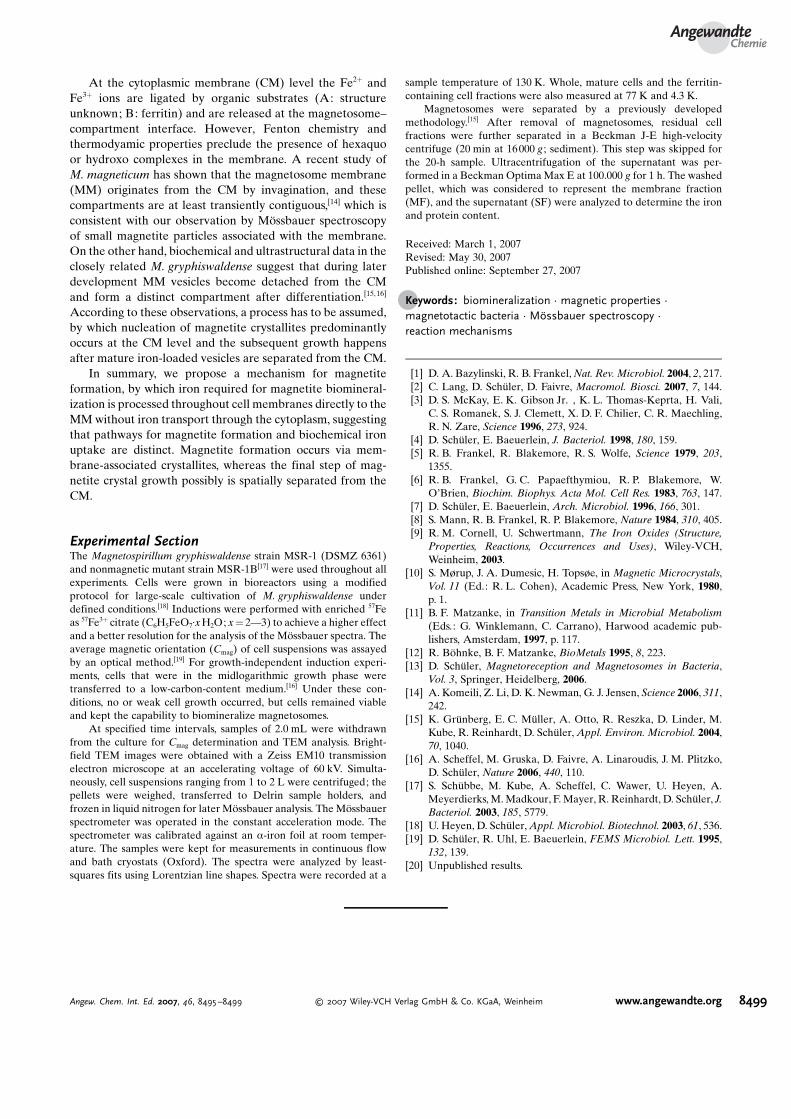
At the cytoplasmic membrane (CM) level the Fe2+ andFe3+ ions are ligated by organic substrates (A: structureunknown; B: ferritin) and are released at the magnetosome–compartment interface. However, Fenton chemistry andthermodyamic properties preclude the presence of hexaquoor hydroxo complexes in the membrane. A recent study ofM. magneticum has shown that the magnetosome membrane(MM) originates from the CM by invagination, and thesecompartments are at least transiently contiguous,[14] which isconsistent with our observation by M-ssbauer spectroscopyof small magnetite particles associated with the membrane.On the other hand, biochemical and ultrastructural data in theclosely related M. gryphiswaldense suggest that during laterdevelopment MM vesicles become detached from the CMand form a distinct compartment after differentiation.[15,16]
According to these observations, a process has to be assumed,by which nucleation of magnetite crystallites predominantlyoccurs at the CM level and the subsequent growth happensafter mature iron-loaded vesicles are separated from the CM.
In summary, we propose a mechanism for magnetiteformation, by which iron required for magnetite biomineral-ization is processed throughout cell membranes directly to theMM without iron transport through the cytoplasm, suggestingthat pathways for magnetite formation and biochemical ironuptake are distinct. Magnetite formation occurs via mem-brane-associated crystallites, whereas the final step of mag-netite crystal growth possibly is spatially separated from theCM.
Experimental SectionThe Magnetospirillum gryphiswaldense strain MSR-1 (DSMZ 6361)and nonmagnetic mutant strain MSR-1B[17] were used throughout allexperiments. Cells were grown in bioreactors using a modifiedprotocol for large-scale cultivation of M. gryphiswaldense underdefined conditions.[18] Inductions were performed with enriched 57Feas 57Fe3+ citrate (C6H5FeO7·xH2O; x= 2—3) to achieve a higher effectand a better resolution for the analysis of the M-ssbauer spectra. Theaverage magnetic orientation (Cmag) of cell suspensions was assayedby an optical method.[19] For growth-independent induction experi-ments, cells that were in the midlogarithmic growth phase weretransferred to a low-carbon-content medium.[16] Under these con-ditions, no or weak cell growth occurred, but cells remained viableand kept the capability to biomineralize magnetosomes.
At specified time intervals, samples of 2.0 mL were withdrawnfrom the culture for Cmag determination and TEM analysis. Bright-field TEM images were obtained with a Zeiss EM10 transmissionelectron microscope at an accelerating voltage of 60 kV. Simulta-neously, cell suspensions ranging from 1 to 2 L were centrifuged; thepellets were weighed, transferred to Delrin sample holders, andfrozen in liquid nitrogen for later M-ssbauer analysis. The M-ssbauerspectrometer was operated in the constant acceleration mode. Thespectrometer was calibrated against an a-iron foil at room temper-ature. The samples were kept for measurements in continuous flowand bath cryostats (Oxford). The spectra were analyzed by least-squares fits using Lorentzian line shapes. Spectra were recorded at a
sample temperature of 130 K. Whole, mature cells and the ferritin-containing cell fractions were also measured at 77 K and 4.3 K.
Magnetosomes were separated by a previously developedmethodology.[15] After removal of magnetosomes, residual cellfractions were further separated in a Beckman J-E high-velocitycentrifuge (20 min at 16000 g ; sediment). This step was skipped forthe 20-h sample. Ultracentrifugation of the supernatant was per-formed in a Beckman Optima Max E at 100.000 g for 1 h. The washedpellet, which was considered to represent the membrane fraction(MF), and the supernatant (SF) were analyzed to determine the ironand protein content.
Received: March 1, 2007Revised: May 30, 2007Published online: September 27, 2007
.Keywords: biomineralization · magnetic properties ·magnetotactic bacteria · M>ssbauer spectroscopy ·reaction mechanisms
[1] D. A. Bazylinski, R. B. Frankel,Nat. Rev. Microbiol. 2004, 2, 217.[2] C. Lang, D. SchKler, D. Faivre, Macromol. Biosci. 2007, 7, 144.[3] D. S. McKay, E. K. Gibson Jr. , K. L. Thomas-Keprta, H. Vali,
C. S. Romanek, S. J. Clemett, X. D. F. Chilier, C. R. Maechling,R. N. Zare, Science 1996, 273, 924.
[4] D. SchKler, E. Baeuerlein, J. Bacteriol. 1998, 180, 159.[5] R. B. Frankel, R. Blakemore, R. S. Wolfe, Science 1979, 203,
1355.[6] R. B. Frankel, G. C. Papaefthymiou, R. P. Blakemore, W.
OMBrien, Biochim. Biophys. Acta Mol. Cell Res. 1983, 763, 147.[7] D. SchKler, E. Baeuerlein, Arch. Microbiol. 1996, 166, 301.[8] S. Mann, R. B. Frankel, R. P. Blakemore, Nature 1984, 310, 405.[9] R. M. Cornell, U. Schwertmann, The Iron Oxides (Structure,
Properties, Reactions, Occurrences and Uses), Wiley-VCH,Weinheim, 2003.
[10] S. Mørup, J. A. Dumesic, H. Topsøe, in Magnetic Microcrystals,Vol. 11 (Ed.: R. L. Cohen), Academic Press, New York, 1980,p. 1.
[11] B. F. Matzanke, in Transition Metals in Microbial Metabolism(Eds.: G. Winklemann, C. Carrano), Harwood academic pub-lishers, Amsterdam, 1997, p. 117.
[12] R. B-hnke, B. F. Matzanke, BioMetals 1995, 8, 223.[13] D. SchKler, Magnetoreception and Magnetosomes in Bacteria,
Vol. 3, Springer, Heidelberg, 2006.[14] A. Komeili, Z. Li, D. K. Newman, G. J. Jensen, Science 2006, 311,
242.[15] K. GrKnberg, E. C. MKller, A. Otto, R. Reszka, D. Linder, M.
Kube, R. Reinhardt, D. SchKler, Appl. Environ. Microbiol. 2004,70, 1040.
[16] A. Scheffel, M. Gruska, D. Faivre, A. Linaroudis, J. M. Plitzko,D. SchKler, Nature 2006, 440, 110.
[17] S. SchKbbe, M. Kube, A. Scheffel, C. Wawer, U. Heyen, A.Meyerdierks, M. Madkour, F. Mayer, R. Reinhardt, D. SchKler, J.Bacteriol. 2003, 185, 5779.
[18] U. Heyen, D. SchKler, Appl. Microbiol. Biotechnol. 2003, 61, 536.[19] D. SchKler, R. Uhl, E. Baeuerlein, FEMS Microbiol. Lett. 1995,
132, 139.[20] Unpublished results.
AngewandteChemie
8499Angew. Chem. Int. Ed. 2007, 46, 8495 –8499 � 2007 Wiley-VCH Verlag GmbH & Co. KGaA, Weinheim www.angewandte.org