intrinsic properties of a complete sample of hete-2 … · intrinsic properties of a complete...
TRANSCRIPT

HAL Id: hal-00340198https://hal.archives-ouvertes.fr/hal-00340198
Submitted on 20 Nov 2008
HAL is a multi-disciplinary open accessarchive for the deposit and dissemination of sci-entific research documents, whether they are pub-lished or not. The documents may come fromteaching and research institutions in France orabroad, or from public or private research centers.
L’archive ouverte pluridisciplinaire HAL, estdestinée au dépôt et à la diffusion de documentsscientifiques de niveau recherche, publiés ou non,émanant des établissements d’enseignement et derecherche français ou étrangers, des laboratoirespublics ou privés.
Intrinsic properties of a complete sample of HETE-2gamma-ray bursts. A measure of the GRB rate in the
Local UniverseA. Pélangeon, J.-L. Atteia, Y. E. Nakagawa, K. Hurley, A. Yoshida, R.
Vanderspek, M. Suzuki, N. Kawai, G. Pizzichini, M. Boër, et al.
To cite this version:A. Pélangeon, J.-L. Atteia, Y. E. Nakagawa, K. Hurley, A. Yoshida, et al.. Intrinsic properties of acomplete sample of HETE-2 gamma-ray bursts. A measure of the GRB rate in the Local Universe.Astronomy and Astrophysics - A
A, EDP Sciences, 2008, 491, pp.157-171. <10.1051/0004-6361:200809709>. <hal-00340198>

1Astronomy & Astrophysicsmanuscript no. 9709ms.hyper310 c© ESO 2008November 20, 2008
Intrinsic properties of a complete sampleof HETE-2 Gamma-ray bursts
A measure of the GRB rate in the Local Universe
A. Pelangeon1, J-L. Atteia1, Y. E. Nakagawa2,3, K. Hurley5, A. Yoshida2,3, R. Vanderspek4, M. Suzuki14, N. Kawai3,6,G. Pizzichini7, M. Boer8, J. Braga9, G. Crew4, T. Q. Donaghy10, J. P. Dezalay11, J. Doty4, E. E. Fenimore12,
M. Galassi12, C. Graziani10, J. G. Jernigan5, D. Q. Lamb10, A. Levine4, J. Manchanda13, F. Martel4, M. Matsuoka14,J-F. Olive11, G. Prigozhin4, G. R. Ricker4, T. Sakamoto15,20,21, Y. Shirasaki16, S. Sugita17, K. Takagishi18,
T. Tamagawa3, J. Villasenor4, S. E. Woosley19, and M. Yamauchi18
1 Laboratoire d’Astrophysique de Toulouse-Tarbes, Universite de Toulouse, CNRS, 14 Av Edouard Belin, 31400 Toulouse,France2 Department of Physics and Mathematics, Aoyama Gakuin University, 5-10-1 Fuchinobe, Sagamihara, Kanagawa 229-8558, Japan3 RIKEN (Institute of Physical and Chemical Research), 2-1 Hirosawa, Wako, Saitama 351-0198, Japan4 Center for Space Research, Massachusetts Institute of Technology, 70 Vassar Street, Cambridge, MA, 02139, USA5 Space Sciences Laboratory, University of California at Berkeley, 7 Gauss Way, Berkeley, CA, 94720-7450, USA6 Department of Physics, Tokyo Institute of Technology, 2-12-1 Ookayama, Meguro-ku, Tokyo, 152-8551, Japan7 INAF/IASF Bologna, via Gobetti 101, 40129 Bologna, Italy8 Observatoire de Haute-Provence (CNRS/OAMP), Saint Michel l’Observatoire, France9 Instituto Nacional de Pesquisas Espaciais, Avenida Dos Astraunotas 1758, Sao Jose dos Campos 12227-010, Brazil
10 Department of Astronomy and Astrophysics, University of Chicago, 5640 South Ellis Avenue, Chicago, IL, 60637, USA11 Centre d’Etude Spatiale des Rayonnements, Universite de Toulouse, CNRS, 9 Av du Colonel Roche, 31028 Toulouse, France12 Los Alamos National Laboratory, P.O. Box 1663, Los Alamos, NM, 87545, USA13 Department of Astronomy and Astrophysics, Tata Institute of Fundamental Research, Homi Bhabha Road, Mumbai, 400 005, India14 Tsukuba Space Center, National Space Development Agency ofJapan, Tsukuba, Ibaraki, 305-8505, Japan15 NASA Goddard Space Flight Center, Greenbelt, MD, 20771, USA16 National Astronomical Observatory, 2-21-1, Osawa, Mitaka, Tokyo, 181-8588, Japan17 Department of Physics, Aoyama Gakuin University, Chitosedai, 6-16-1, Setagaya-ku, Tokyo, 157-8572, Japan18 Faculty of Engineering, Miyazaki University, Gakuen Kibanadai Nishi, Miyazaki, 889-2192, Japan19 Department of Astronomy and Astrophysics, Univ of California at Santa Cruz, 477 Clark Kerr Hall, Santa Cruz, CA, 95064, USA20 Center for Research and Exploration in Space Science and Technology (CRESST), NASA Goddard Space Flight Center, Greenbelt,
MD 20771, USA21 Joint Center for Astrophysics, University of Maryland, Baltimore County, 1000 Hilltop Circle, Baltimore, MD 21250, USA
Received/ Accepted
ABSTRACT
Context. As a result of the numerous missions dedicated to the detection of Gamma-ray bursts (GRBs), the observed properties ofthese events are now well known. However, studying their parameters in the source frame is not simple since it requires havingmeasurements of both the bursts’ parameters and of their distances.Aims. Taking advantage of the forthcoming Catalog of the High Energy Transient Explorer 2 (HETE-2) mission, the aim of thispaper is to evaluate the main properties of HETE-2 GRBs – the peak energy (Epeak), the duration (T90) and the isotropic energy (Eiso)– in their source frames and to derive their unbiased distribution.Methods. We first construct a complete sample containing all the bursts localized by the Wide-Field X-ray Monitor (WXM) on-boardHETE-2, which are selected with a uniform criterion and whose observed parameters can be constrained. We then derive theintrinsicEpeak, T90 andEiso distributions using their redshift when it is available, ortheir pseudo-redshift otherwise. We finally compute the‘volume of detectability’Vmax of each GRB, i.e. the volume of the universe in which the burstis bright enough to be part of oursample, and the corresponding number of GRB within their visibility volume NVmax, in order to derive a weight for each detectedburst accounting both for the detection significance and thestar formation history of the universe.Results. We obtain unbiased distributions of three intrinsic properties of HETE-2 GRBs:Eintr
peak, T intr90 and the isotropic energy of
the burst. These distributions clearly show the predominence of X-ray flashes (XRFs) in the global GRB population. We alsoderive the rate of local GRBs:RH2
0 & 11 Gpc−3yr−1, which is intermediate between the local rate obtained by considering only the‘high-luminosity’ bursts (∼1 Gpc−3yr−1) and that obtained by including the ‘low-luminosity’ bursts (& 200 Gpc−3yr−1).Conclusions. This study shows that the XRFs are predominent in the GRB population and are closely linked to the ‘classical’ GRBs.We show that HETE-2 detected no low-luminosity GRB like GRB 980425 or XRF 060218, due to the small size of its detectors,excluding this type of burst from our statistical analysis.The comparison of the GRB rate derived in this study with the known rateof Type Ib/c supernovae clearly shows that the progenitors of SNe Ib/c must have some special characteristics in order to produceagamma-ray burst or an X-ray flash.
Key words. Gamma rays: bursts – X rays: bursts

1. Introduction
In recent years we have learned that long Gamma-ray bursts(T90 > 2 sec.) are associated with the death of massive stars(M & 20-30 M⊙). This origin has been clearly established bythe association of a few nearby GRBs with Type Ib/c supernovae(SNe Ib/c): GRB 980425 detected by Beppo-SAX (Pian et al.1999) and SN 1998bw (Galama et al. 1998; Kulkarni et al.1998), GRB 021211 detected by HETE-2 (Crew et al. 2002,2003) and SN 2002lt (Della Valle et al. 2003), GRB 030329also detected by HETE-2 (Vanderspek et al. 2003, 2004) andSN 2003dh (e.g. Matheson et al. 2003; Stanek et al. 2003;Hjorth et al. 2003a; Mazzali et al. 2003), GRB 031203 detectedby INTEGRAL (Gotz et al. 2003) and SN 2003lw (Malesani etal. 2004), GRB 050525A detected by Swift-BAT (Band et al.2005) and SN 2005nc (Della Valle et al. 2006b). The associationof the nearby GRB 060218 detected by Swift-BAT (Cusumanoet al. 2006) with SN 2006aj (Masetti et al. 2006; Modjaz etal. 2006; Pian et al. 2006; Campana et al. 2006; Sollerman etal. 2006; Mirabal et al. 2006b; Cobb et al. 2006) provided aremarkable example of this paradigm. Even though a massivestar’s explosion can explain the production of both the GRB andthe supernova (see for instance the collapsar model proposedby Woosley 1993; see also Woosley & Bloom 2006; DellaValle 2006a), these two phenomena are profoundly different innature: the GRB is due to an ultra-relativistic outflow generatedby a newborn black hole or magnetar, while the supernova ispowered by the radioactive decay of56Ni within a massive shellof matter ejected at sub-relativistic velocities (e.g. Soderberget al. 2006d). The question of the link between GRBs and SNehas recently become more complicated by the discovery of twolow-redshift, long gamma-ray bursts – GRB 060505 atz=0.089and GRB 060614 atz =0.125 – which were not associated witha supernova (Gehrels et al. 2006; Fynbo et al. 2006b; DellaValle et al 2006d; Gal-Yam et al. 2006). It is thus fair to say thatdespite very significant advances in our understanding of GRBs,the global picture continues to escape us and key issues remainto be elucidated. Concerning the connection between GRBs andsupernovae, the observational clues are based on two facts:theclear association of some GRBs with Type Ib/c supernovae, andthe evidence, based on statistical studies, that the majority of the9000 Type Ib/c supernovae exploding each year in the universedo not produce GRBs. This last point was addressed by Bergeret al. (2003), Soderberg et al. (2006a, 2006b, 2006c, 2006d,2004b) and Della Valle (2005, 2006a, 2006c).
While the SNe Ib/c population is rather well sampled inour local environment, the situation is quite different for GRBs,which need a complex series of detections to be fully char-acterized: detection of the high-energy signal in space, quicktransmission to the ground, identification of the afterglowatX-ray, optical or radio wavelengths, and measurement of theredshift. This situation makes our understanding of the GRBpopulation much less secure than for supernovae. Indeed, theobservations by Beppo-SAX, HETE-2, and now Swift havedemonstrated the diversity of the GRB population, which iscomposed of classical GRBs, short-duration GRBs, X-rayflashes (XRFs), and low-luminosity GRBs. In this classification,the ‘classical GRBs’ appear to be the ‘high-luminosity’ part(HL-GRBs) of a population which could consist mostly of low-luminosity or subluminous bursts (LL-GRBs), like GRB 980425(Tinney at al. 1998) and GRB 060218 (Mirabal et al 2006a), or
Send offprint requests to: A. Pelangeon & J-L. Atteiae-mail:[alexandre.pelangeon/atteia]@ast.obs-mip.fr
of X-ray flashes.
In this paper we take advantage of the broad energy cov-erage of HETE-2 instruments (2-400 keV) to discuss theglobal properties of the GRB population, and to infer a rateof GRB+XRF events which can be compared with theoreticalpredictions and with the known rate of Type Ib/c supernovae.This work is partly based on the forthcoming catalog of HETE-2GRBs (Vanderspek et al. 2008). For a description of the HETE-2mission and its instrumentation, see Ricker et al. (2001), Atteiaet al. (2003a) and Villasenor et al. (2003).Our work relies on the construction of a complete GRB samplecontaining all the long-duration bursts localized by theWideField X-Ray Monitor (WXM)and having a signal-to-noise ratio(SNR) larger than a given threshold inFREGATE(FREnchGAmma-ray TElescope) or in the WXM. For each burst inthis sample, we compute the intrinsic properties at the source(T90, Epeak, and Eiso) by correcting the observed propertiesfor the effect of the redshift. When a spectroscopic redshift isnot available (62 GRBs out of 82), we use thepseudo-redshiftfollowing the method of Pelangeon et al., i.e. the estimateof theredshift which is partly based on both theEpeak–Eiso (e.g. Amatiet al. 2002) andEpeak–Liso (Yonetoku et al. 2004) correlations,and derived from the spectral properties of the prompt emission(for more details see Pelangeon et al. 2006a and Pelangeon& Atteia 2006b). We emphasize that this procedure has littleimpact on the final results since it introduces an additionaluncertainty which is much smaller than the intrinsic dispersionof the parameters under study. In a second step we derive the‘visibility distance’ for each burst (zmax), the distance at whichthe SNR of the burst reaches the threshold of our analysis, andthe number of GRB within its visibility volume (NVmax). Wethen attribute to each GRB a weightW = 1/NVmax, accountingboth for the detection significance and the star formationhistory of the universe. Consequently, this method enablesusto renormalize the global distribution, taking into account thetrue rate of occurrence of each type of GRB. We finally derivethe GRB rate detected by HETE-2, and we discuss the relativeimportance of XRFs and classical GRBs in the overall GRBpopulation.
This paper is organized as follows: Section 2 is devotedto the description of the HETE-2 GRB sample. Section 3references and describes the tools necessary for our study.The three parameters studied here,Epeak, T90, and Eiso, arediscussed in Sections 4, 5 and 6 respectively. The remainingthree sections are dedicated to the interpretation of the results.In Section 7, we check the existence of correlations betweentheintrinsic parameters. In Section 8, we show that our study givessome clues to the nature of X-ray flashes in terms of intrinsicenergetics and distance-scales. Finally, in Section 9 we discussthe rate of GRBs in the local universe and compare it withprevious estimates obtained by other authors. A summary of themain results obtained in this paper is presented in Section 10.
2. Obtaining of a complete sample of HETE-2 bursts
2.1. Instrumentation
Since its launch in October 2000, the HETE-2 satellite (Rickeret al. 2001), dedicated to the detection and observation ofGamma-Ray Bursts, has detected 250 events classified asGRBs(Vanderspek et al. 2008). Thanks to the combination of its 3instruments, theFREnch GAmma-ray TElescope(FREGATE,

Pelangeonet al.: Intrinsic properties of a complete sample ofHETE-2GRBs 3
Atteia et al. 2003a), theWide-field X-ray Camera(WXM,Shirasaki et al. 2003) and theSoft X-ray Camera(SXC,Villasenor et al. 2003), HETE-2 has a broad energy range cover-ing the hardX-rays andγ-rays (2-400 keV), allowing the detec-tion of bothclassicalandsoftGRBs (XRFs). Moreover, HETE-2 was designed to provide GRB positions to the communitythrough theGRB Coordinates Network (GCN)(Barthelmy etal. 2000) with an accuracy of one to several arcminutes, withinseconds of the trigger. Consequently, multi-wavelength groundfollow-up was done for most HETE-2 GRBs, leading to the de-termination of 25 spectroscopic redshifts.
2.2. Burst selection
It is of prime importance for our study to construct a GRB sam-ple for which the detection criteria are fully understood and canbe reproduced. This is essential for the determination of the visi-bility volume of each GRB in the sample. In addition it is neces-sary to be able to compute for each burst the three parametersofour study:Epeak, T90, and the fluence. This section explains theconstruction of the sample1.
2.2.1. Availability of the spectral data
We considered all the 250 events that constitute the total sampledetected by HETE-2, i.e. both triggered and untriggered bursts,thus reducing the bias due to trigger algorithms. Then, we se-lected the bursts for which the angle of incidence was measuredby any experiment. Its knowledge is necessary to perform thespectral analysis of the bursts and to derive theirEpeak andEiso.Of the 250 GRBs, 132 have no accurate localization and wererejected, leaving 118 GRBs.Among these bursts, we have also rejected GRB 040810 becausethis long and intense burst occurred as the instruments werebe-ing shut down. Consequently only the precursor was detectedbyHETE-2.
2.2.2. Technical problems
Of the remaining 117 GRBs, 2 bursts were rejected due to tech-nical problems: GRB 010110 was detected and localized by theWXM when FREGATE was not working. It is thus impossibleto constrain the spectral parameters with only the WXM data.The second burst rejected is GRB 021113. At the moment of itsdetection there were onboard software problems that did notper-mit the trigger to reach the ground. The spectral data are thus notavailable.
2.2.3. WXM localization
Considering the 115 remaining GRBs with a known angle, weremoved 24 GRBs for which the angle was obtained through thelocalization by theInter Planetary Network(IPN) or theSwiftsatellite (Gehrels et al. 2004). Indeed, as the IPN and Swifthavedifferent sensitivities, we would have added a bias to our sampleby considering them.Moreover, in order to have bursts well within the field of viewof the WXM, we have considered an ‘incident angle limit’ of45. This angle corresponds to a limit of detection for the WXM(Shirasaki et al. 2003), and to a decrease of the effective area for
1 The order of the steps described in this Section is not important; wecould have performed them in any order and obtained the same sample.
FREGATE (Atteia et al. 2003a). With this cut, only one burst isrejected: GRB 020201, whose angle is 55. This step leaves 90GRBs in the sample (see Fig. 1).
2.2.4. Short-duration bursts
We also rejected the two bursts classified without ambiguityas short-duration bursts: GRB 020531 (Lamb et al. 2003) andGRB 050709 (Villasenor et al. 2005). This is based on the factthat this class of burst is probably not associated with the sameprogenitors as the long GRBs. As one goal of this paper is todiscuss the rate of long GRBs in the local universe and to com-pare it with the rate of SNe, we have excluded the short-durationbursts, leaving 88 bursts in the sample.
2.2.5. Threshold cut
Finally, in order to have homogeneous detection criteria for allthe events of the sample, we removed the GRBs with a signal-to-noise ratio (SNR) lower than a given threshold in FREGATEand in the WXM. These SNR were computed as follows:
– we measured the peak count rate of each burst. ForFREGATE we used two different time resolutions (1.3 and5.2 s) and two different energy ranges (6-80 and 30-400 keV)corresponding to the bands used by the instrument to trigger.For the WXM we used three different time resolutions (1.2,4.9 and 9.8 s) and the total energy range of the WXM (2-25 keV).
– we computed a SNR for each burst in all the combinationsof time resolution and energy range. We kept only the GRBsfor which the SNR exceeded 7.9 in FREGATE or 5.8 in theWXM (in at least one combination of the time and energyranges, see Fig. 2).
This last criterion removed 6 bursts with a low SNR:GRB 011103, XRF 020903, GRB 030323, GRB 030706,GRB 040131 and GRB 040228.
Our final sample contains 82 GRBs whose properties aregiven in Tables 2 and 3.
2.3. The cases of XRF 020903 and GRB 030323
These two bursts have a spectroscopic redshift but they are re-jected from our sample due to their SNR just below the thresh-olds of FREGATE and the WXM (Fig. 2). As they have spec-troscopic redshifts –z = 0.25 for XRF 020903 (Soderberg etal. 2004a) andz = 3.372 for GRB 030323 (Vreeswijk et al.2003) – we can argue that even if they had been present in oursample, the results presented in this paper would actually havebeen reinforced. Indeed, situated at a moderately high redshift,GRB 030323 has a large visibility volume and thus a low weight.On the other hand, the nearby XRF 020903 has a small visibilityvolume and hence a large weight. Since this is an XRF with alow Epeak, adding it to our GRB sample would have increasedthe predominance of X-ray flashes which is shown in Section 4,and strengthened the conclusions of this paper.
3. Deriving the intrinsic properties of HETE-2 GRBs
3.1. Burst parameters
We have used the spectral parameters and durations availablein the HETE-2 Catalog (Vanderspek et al. 2008) which summa-

4 Pelangeonet al.: Intrinsic properties of a complete sample ofHETE-2GRBs
10 1000
0.1
0.2
0.3
0.4
0.5
0.6
0.7
0.8
0.9
1
Θ (deg)
N(<
Θ)
Fig. 1. Boresight angle cumulative distribution of the 115 GRBslocalized by HETE-2/WXM, the Interplanetary Network orSwift. The dark dashed vertical line represents the ‘angle limit’of 45, corresponding to the limit of detection by the WXM. TheGRBs localized by the WXM are represented with black opencircles, the ones localized by the IPN are in blue filled triangles,and the ones localized by Swift are in dark-red filled stars.
rizes the information on GRBs detected by HETE-2 during theentire mission and thus complements the previous spectral anal-yses based on smaller samples of HETE-2 GRBs performed byBarraud et al. (2003, 2004) and Sakamoto et al. (2005).
3.2. Burst distance
At the end of the 90s, the growing sample of GRBs withmeasured redshift allowed new types of studies: searches forcorrelations between physical quantities – characterizing thegamma-ray bursts’ light-curves and/or spectra –in their restframe. Following the discovery of correlations betweenEiso, theisotropic equivalent energy emitted by the burst, and various in-trinsic GRB properties, it has been suggested that some GRBobservables could be used as luminosity indicators, and henceas redshift indicators. The most used are thelag-luminosity(τlag–Lp,iso) correlation (Norris, Marani & Bonnell 2000), thevariability-luminosity (V–Lp,iso) correlation (e.g. Fenimore &Ramirez-Ruiz 2000; Reichart & al. 2001; Lloyd-Ronning, Fryer& Ramirez-Ruiz 2002a) and theEpeak–Eiso correlation – sug-gested by several authors (see e.g. Lloyd, Petrosian & Mallozzi2000; Atteia 2000; Lloyd-Ronning & Ramirez-Ruiz 2002b) –before Amati et al. (2002) firmly established it with a study of 12GRBs with known redshift. Other correlations were found later,such as theEpeak–Lp,iso correlation (Yonetoku et al. 2004), theEpeak–Eγ correlation (Ghirlanda, Ghisellini & Lazzati 2004) andtheEpeak–Lp,iso–T0.45 correlation (Firmani et al. 2006). Recently,in his construction of the Hubble Diagram from a sample of 69GRBs with redshifts, Schaefer (2007) showed that the use offive of these correlations simultaneously – lag-luminosity(τlag–Lp,iso, Norris et al. 2000);V–Lp,iso (Fenimore & Ramirez-Ruiz2000);Epeak–Lp,iso (Schaefer 2003);Epeak–Eγ (Ghirlanda et al.2004) and the minimum light-curves rise time versus luminosity
10 1000
0.1
0.2
0.3
0.4
0.5
0.6
0.7
0.8
0.9
1
S/N
N(<
S/N
)
Fig. 2. Signal-to-noise ratio (SNR) cumulative distribution ofthe 88 GRBs localized by the WXM and within 45 of the bore-sight. The threshold of FREGATE (SNR=7.9), is representedwith the right-most vertical magenta dashed line, whereas thethreshold of the WXM (SNR=5.8) is represented with the left-most vertical magenta dashed line. The different symbols showthe configuration of time resolution and energy range leading tothe highest SNR for each burst: a given shape is associated with agiven energy range and a given color corresponds to a given timeresolution: [WXM/2-25 keV/1.2 s]= light-green filled circles;[WXM /2-25 keV/4.9 s]= light-green open circles; [WXM/2-25 keV/9.8 s]= dark filled circles; [FREG/6-80 keV/1.3 s]=red filled triangles; [FREG/6-80 keV/5.2 s]= red open trian-gles; [FREG/30-400 keV/1.3 s]= blue filled squares; [FREG/30-400 keV/5.2 s]= blue open squares. Note that there is only onelight-green filled circle and one light-green open circle (left partof the figure) due to the fact that only one burst has its highestSNR in the configuration [WXM/2-25 keV/1.2 s] and one burstin the configuration [WXM/2-25 keV/4.9 s].
(τRT − Lp,iso, Schaefer 2002)2 – led to more reliable luminositydistances than the use of only one distance indicator.The design of HETE-2 permitted the study of the energetics atwork in GRBs, both in the observer and in the source frames.For example, theEpeak-Eiso correlation (Amati et al. 2002) wasconfirmed and extended at lower energy, thanks to the sampleof HETE-2 X-ray rich GRBs (XRRs) and X-ray flashes (Amati2003; Lamb, Donaghy & Graziani 2004a; Lamb et al. 2004b;Amati 2006), particularly XRF 020903 (Sakamoto et al. 2004).The HETE-2 sample is thus appropriate for the determinationof pseudo-redshiftsbased on theEpeak-Eiso correlation. A firstattempt in this direction was proposed by Atteia (2003b), whichwas later revised by Pelangeon et al. (2006a) to take into accountthe complex lightcurves of some long GRBs3.The accuracy of this redshift indicator and its use in this study isdiscussed in the following paragraph.
2 See e.g. Ghirlanda, Ghisellini & Firmani (2006) or Schaefer(2007)for a complete summary of these correlations.
3 See alsohttp://www.ast.obs-mip.fr/grb/pz

Pelangeonet al.: Intrinsic properties of a complete sample ofHETE-2GRBs 5
3.3. Justification of the pseudo-redshifts used in this study
As shown in Table 3, 18 GRBs contained in our sample havea spectroscopic redshift and 2 have a photometric redshift(GRB 020127 and GRB 030115). We computed a pseudo-redshift for the remaining 62 (among the 20 bursts having aknown redshift, 14 were used for calibrating the pseudo-z).In order to test the impact of the use of pseudo-redshifts in thiswork:
– we computed the pseudo-redshifts of the 20 GRBs having aspectroscopic or photometric redshift,
– for these same 20 GRBs we computed the ratio between thepseudo-redshift and the redshift, and the ratio of thepseudo-intrinsic propertiesderived with pseudo-redshifts to thein-trinsic propertiesderived using the redshift (Fig. 3).
We note that the dispersion of the ratio between the pseudo-redshifts and the redshifts is smaller than a factor of 2,except for two outliers: GRB 020819 and GRB 051022 forwhich the spectroscopic redshift differs from the pseudo-redshift by factors of 2.95 and 2.15 respectively. For these20 GRBs, the dispersion between the luminosity distanceestimated with the pseudo-redshifts (DL,estim) and the lu-minosity distance measured with the redshifts (DL,meas) is:σDL = log(DL,estim/DL,meas) = 0.125 dex, i.e a factor of 1.344.The dispersion is also smaller than a factor of 2 for theEpeak(Fig. 3, top-right panel) and theT90 parameters (Fig. 3, bottom-left panel). This is not surprising since these two quantitiesvary as (1+ z), reducing the impact of the redshift errors.Eiso,which is more redshift-dependent thanEpeak and the duration,is more scattered and its dispersion is larger than a factor of2. This corresponds to the bursts having the highest differencebetween their spectroscopic redshift and their pseudo-redshift:GRB 020819, GRB 040912B and GRB 051022 have a pseudo-zestimate two to three times higher than their redshift; andGRB 020124, GRB 030115 and GRB 050408 for which thepseudo-z is lower than the spectroscopic redshift by a factor of2 (Fig. 3, bottom-right panel).We consider that the good agreement of pseudo-z with spec-troscopic redshifts for the 20 GRBs having a measuredz isencouraging. One may question however if the pseudo-z valuescomputed without knowing the spectroscopic redshift are asaccurate as those computed when the redshift is known – i.e. dopseudo-z have predictive power? – Unfortunately, most of thebursts for which we have computed a pseudo-z do not have red-shift measurements, so comparison with the redshift-estimatescannot be done. However, in some cases the pseudo-z valueswe issued inGCN Circularswere followed by a spectroscopicmeasurement. For instance, we determined the pseudo-redshiftsof GRB 0505255 and GRB 0701256 before their redshifts
4 If we do not consider the two outliers GRB 020819 andGRB 051022 the dispersion isσDL = 0.089 dex, i.e a factor of 1.23.
5 The first GCN Circular containing the computation of a pseudo-redshiftin nearly real timewas done for this burst, using the spectral pa-rameters obtained by Konus-WIND (Golenetskii et al 2005a).We foundz= 0.36± 0.10 (Atteia & Pelangeon 2005b) whereas the spectroscopicredshift obtained by spectroscopy of the host galaxy and published theday after wasz = 0.606 (Foley et al. 2005). The difference betweenthe pseudo-redshift and the redshift was due to an incorrectpublishedfluence (Golenetskii et al. 2005b). As soon as the correct value wasavailable, we recomputed the pseudo-redshift of this burstand foundz= 0.64± 0.10 (Atteia & Pelangeon 2005c).
6 We have computed a redshift-estimate of this bright burst using thespectral parameters derived from two different instruments, Rhessi (ˆz=
0.1
1.0
10
redshift redshift
1 50.1
1
redshift1 5
redshift
pseudo−z / z pseudo−Epeak
intr / E
peak
intr
pseudo−T90B
intr / T
90B
intr pseudo−Eiso
/ Eiso
Fig. 3. Ratio between thepseudo-redshiftand the redshift forthe 20 GRBs contained in our sample for which both quanti-ties are available (upper-left panel). The ratio of the 3pseudo-intrinsic andintrinsicparameters studied are also shown, respec-tively Epeak (upper-right panel),T90 (lower-left panel) andEiso
(lower-right panel). In all plots, the filled region corresponds toa deviation from the equality between the two parameters by afactor of 2, and the error bars are at the 1σ level (stat.+syst.)
were known. The spectroscopic measurements have confirmedour estimates. Moreover, two other GRBs detected in 2003and 2004 by HETE-2 had a pseudo-redshift (Pelangeon et al.2006a) but no redshift. Some later observations of the hostgalaxies resulted in the determination of their spectroscopicredshifts, in agreement with their pseudo-redshifts: Rau et al.(2005) measured the redshift of the host galaxy of GRB 030531to be z = 0.782± 0.001 (z = 0.64 ± 0.15, Pelangeon et al.2006a), and Stratta et al. (2007) obtained the redshift of theX-ray flash 040912:z = 1.563± 0.001 from the [OII] line ofthe host-galaxy spectrum, also consistent with its previouslydetermined pseudo-redshift (ˆz = 2.90± 1.60, Pelangeon et al.2006a).
In order to quantify the effect of the uncertainty from thepseudo-redshifts on the intrinsic distributions, we performedthe following test: we artificially increased the errors on thepseudo-z values which are taken into account in the constructionof the intrinsic parameters distributions (see Section 4.3). Thisextra dispersion takes on three values corresponding to factorsof 1.4, 2.0 and 3.0. We tested the impact of this extra dispersionon the intrinsicEpeak distributions (‘simple’ and ‘unbiased’),and thus we show that even if the pseudo-z were only accurateto a factor of 2 or 3, this would not significantly change theintrinsic parameter distributions and all the subsequent resultsobtained in this paper (see Sect. 4).
It was recently proposed by Butler et al. (2007) that thecorrelations between the intrinsic GRB parameters found in
1.63± 0.80, Pelangeon & Atteia 2007a) and Konus-WIND (ˆz= 1.34±0.30, Pelangeon & Atteia 2007b). Both values were consistentwith aredshift of∼1.5. The spectroscopic redshiftz ∼ 1.54 was measuredseveral days after our estimate (Fox et al. 2007; see also Cenko et al.2008).

6 Pelangeonet al.: Intrinsic properties of a complete sample ofHETE-2GRBs
the pre-Swift era were due to instrumental biases (e.g. detectorthresholds effects) rather than to real physical properties ofthe sources. This is the result of a study they performed on asample of 77 Swift GRBs with measured redshifts, where theyfound that those GRBs are on average harder than the pre-Swiftmeasurements, i.e. they have higherEpeak and lowerEiso. As aconsequence, they conclude that these correlations cannotbeused to estimate the GRB redshifts.Since no clear conclusion can be drawn from this debate, wehave also considered this possibility and we calculated allthedistributions twice: one case where we attribute a pseudo-redshift to the 62 bursts which have no redshift, and the othercase where we randomly attribute one of the 24 secure redshiftsmeasured for the HETE-2 long GRBs. Therefore, for all thedistributions we obtain we will comment on how they changebetween the two cases.
Throughout the paper we use the following notations:
– the spectroscopic or photometric redshifts are denoted byz.– the pseudo-redshifts are denoted by ˆz.– zsample refers to the value of the redshift used in our study:
this is the spectroscopic/photometric redshift (z) when it isavailable and the pseudo-redshift (ˆz) otherwise (see Table 2).
4. Parameter 1: Epeak
4.1. Measuring the Epeak of X-ray flashes
The peak energy of a burst is generally measured using theXSPECsoftware (Arnaud & Dorman 2003) and fitting a phe-nomenological model –GRB (Band) Model(Band et al. 1993)or Cutoff Power Law Model– on the spectral data. However, forsome X-ray flashes, the peak energy is lower than 10 keV, sothe data do not constrain the four parameters of the Band func-tion. For those bursts, the value obtained is too close to thelowerboundary of FREGATE (6 keV) and of the WXM (2 keV). Inthis case, we observe a power-law spectrum instead of a Bandfunction. To solve this problem, Sakamoto et al. (2004) showedthat a modified function, called theConstrained Band Model(CBM), based on a three-dimensional subspace of the full four-dimensional Band function parameter space, could be used. Weadopted this model to fit the data when it was necessary (seeTable 2).However, in order to check whether such a model could add abias to the estimate ofEpeak, we used XSPEC to simulate anXRF spectrum as follows:
– we use the data of a real XRF, in order to have real back-ground statistics and instrumental response matrices.
– we construct a fake burst that follows a Band model with typ-ical values of -1.0 and -2.3 for the power-law indices at lowand high energy respectively. These parameters correspondto the mean values for GRB spectra according to BATSE re-sults (see e.g. Preece et al. 2000; Kaneko et al. 2006). Thetwo other parameters,Epeak and the normalization, are thevariable parameters that let us produce fake XRFs of greateror lesser intensity.
– we generate fake data files for XRFs of various brightnessesand variousEpeak.
– we then perform a spectral analysis using a Band model anda Constrained Band model, and compare the parameters ob-tained.
We find that the Band model is valid forEpeak down to 8 keV.For this limiting value, the errors on the spectral parameters are
slightly larger than those obtained using the Constrained Bandfunction, but they are still valid. ForEpeak below 8 keV, theConstrained Band model is preferable: it gives correctEpeakval-ues or provides at least reliable upper limits.In all cases we obtain consistent values between the CBM andthe Band function when both functions are applicable, and thesevalues are consistent with the ones we introduced to producethefake XRFs. We thus conclude that the values determined withthe Constrained Band model are not biased.
4.2. The observed Epeak distribution
Several points can be noticed in Figure 4: first, theEobspeakdistribu-
tion peaks at about 100 keV and extends over the entire energyrange of HETE-2 (2-400 keV). Second, the two classes of bursts(classical GRBs and X-ray flashes) are clearly distinguished. Asa comparison, the study of Kaneko et al. (2006) on the completespectral catalog of bright BATSE Gamma-Ray Bursts, leads toanEobs
peakdistribution peaking at about 300 keV, extended at highenergies up to several MeV and without significant events at verylow energies. The paucity of soft (∼a few keV) and hard (∼MeV)bursts in our sample is probably not real. For the soft bursts,this is clearly visible by a simple comparison of the BATSEand HETE-2Epeak distributions. As BATSE triggers were gen-erally done on the count rate between 50 and 300 keV, the ratiobetween the XRFs and the GRBs is low. For HETE-2, the en-ergy range extends down to 2 keV and enables the detection ofmore XRFs but still prevents the detection of XRFs withEpeakbelow a few keV. As far as the hard tail of theEpeak distribu-tion is concerned, the low sensitivity of the detectors at highenergy is also one of the causes of the inefficient detection ofhard bursts. Moreover, two bursts emitting the same energy withdifferent hardness do not have the same number of photons: thesofter GRB has more photons than the harder one. Consequently,BATSE-like or HETE2-like missions are probably not able toderive a true observedEpeak distribution. The distributions ob-tained clearly show that theEobs
peak distribution depends stronglyon the energy range of the instruments involved.
4.3. The intrinsic Epeak distribution
So far, the intrinsicEpeak distribution has been very little dis-cussed, mainly due to the difficulty of measuring both theEpeakand the redshift of the bursts. On the one hand, BATSE, Beppo-SAX and HETE-2 did constrain theEobs
peak thanks to their wideenergy ranges, but the bursts they detected suffered from a lackof redshift determination. On the other hand, thanks to its perfor-mance and fast localization capability, Swift currently enablesmore redshift measurements, but the narrow energy range of theBAT instrument (15-150 keV) does not allow a good constraintof theEobs
peak.As mentioned by Amati (2006), about 70 intrinsicEpeak areavailable, but this sample contains bursts detected by differentsatellites. Our work is based on a sample containing all the burstslocalized with a single satellite, hence avoiding selection effectsinherent to the use of data from different instruments.We see in Figure 5 that theEintr
peak distribution is broader than the
Eobspeak distribution. At high energies, some bursts have anEintr
peakreaching a few MeV. Nevertheless, as we previously mentioned,the energy range of HETE-2 (2-400 keV) prevents us from draw-ing any conclusion about the high energy part of theEpeakdistri-bution.

Pelangeonet al.: Intrinsic properties of a complete sample ofHETE-2GRBs 7
At low energies, bursts having anEobspeak lower than 20 keV, and
defined as X-ray flashes in the observer frame, still have a lowEpeak in their source frame. For most of those GRBs, the low in-trinsic peak energy is due to their intrinsic faintness as they areat low or intermediate redshift. (This point is discussed inmoredetail in Section 8).Joining these two extreme energy ranges, the intrinsicEpeak dis-tribution of HETE-2 GRBs extends over 3 decades in energy.The true width of the distribution is probably even larger be-cause bursts withEpeak lower than 1 keV are not detected, andbursts withEpeak greater than 1 MeV cannot be constrained byan HETE2-like mission.
1 2 3 40
5
10
15
20
log Epeakobs (keV)
Num
ber
of G
RB
s
Fig. 4. Distribution of theEobspeakmeasured for the complete sam-
ple of 82 GRBs detected and localized by HETE-2. The sub-sample’s histogram of bursts with secure redshifts (z) is shownin red, and the total sample’s histogram is shown in grey. Thebursts on the left part of the histogram correspond to the eventsthat have a measured higher limit inEobs
peak of about 4 keV (seeTable 2). The energy range of HETE-2 (2-400 keV) is symbol-ized by the magenta horizontal solid line.
4.4. The unbiased Epeak distribution
4.4.1. Construction
In order to derive thetrue Epeak distribution, the distance-scaleis not the only correction that has to be applied to the observedEpeakdistribution. All the bursts do not have the same brightnessand are not detected at the same significance in the observerframe. We took this into account to correct the intrinsicEpeakdistribution obtained in the previous section.To do this we used the following method:
(1) in order to take into account the errors on all the pa-rameters used (spectral properties and redshift) we havecomputed ‘smoothed distributions’ by:
– producing for each burst a set of 100Eobspeak,sim randomly se-
lected within the 90% confidence level (c.l.) error range of
1 2 3 40
5
10
15
20
log Epeakintr (keV)
Num
ber
of G
RB
s
Fig. 5. Distribution of Eintrpeak for the complete sample of 82
GRBs detected and localized by HETE-2. The histogram relatedto the sub-sample of bursts with secure redshifts (z) is shownin red, and the total sample’s histogram is shown in grey. Theblue dashed histogram corresponds to the studied case 2 (seePart 3.3), i.e. the sample of 62 GRBs without secure redshiftthatare randomly given a redshift from the HETE-2 redshift distri-bution.
the measuredEobspeak given in Table 27 and 100 redshifts ran-
domly selected within the 90% c.l. error range of their cor-responding spectroscopic/photometric redshift or pseudo-redshiftzsim. Combined with the 100 simulatedEobs
peak,sim, we
thus obtained a sample of 100 simulatedEintrpeak,sim.
– representing each of the 8200 simulated bursts (b) with anormal distribution of the logarithmicEintr
peak values (LEintrp,b ):
fb(lep,i) =1σLEintr
p,b
× exp
[
−12
( lep,i − µLEintrp,b
σLEintrp,b
)2]
(1)
wherelep,i is the variable of the functionsfb, µLEintrp,b
is the
base 10 logarithm ofEintrpeak,sim related to the burstb andσLEintr
p,b
is set to 0.05.
(2) then, we computed for the 8200 simulated GRBs a weightrelated to their detection significance. For that, we:
– determine the maximum redshiftzmax at which the sourcecould have been detected by the instruments, by first com-paring the SNR computed in Section 2 (see Table 2) to theSNR threshold of the HETE-2 instruments, and then by red-shifting the sources until their peak photon flux reaches theSNR threshold of the trigger instrument, giving us both thevisibility distance between the source and the satellite andthe maximum redshiftzmax.
– assume that the GRB rate follows the star formation rate. Forthis we have adopted the model SFR2 of Porciani & Madau
7 For some XRFs, the lower error limit could not be constrained. Inthis case the value was set toEobs
peak,min = 1 keV. For some other GRBs, itwas the upper error limit which was not constrained. In this case we setthe value toEobs
peak,max = 1 MeV.

8 Pelangeonet al.: Intrinsic properties of a complete sample ofHETE-2GRBs
(2001) that reproduces a fast evolution betweenz = 0 andz= 1 and remains constant beyondz≥ 2
RSFR2(z) ∝ 0.15h65exp(3.4z)
exp(3.4z) + 22(2)
– derive for each burst the number of GRB per year within itsvisibility volume
NVmax∝
∫ zmax
0dz
dV(z)dz
RS FR2(z)
1+ z(3)
In this equationdV(z)/dz is the comoving element volume,described by
dV(z)dz=
cH0
4π dl2(z)(1+ z)2 [ΩM(1+ z)3 + ΩK(1+ z)2 + ΩΛ]1/2
(4)
whereH0 is the Hubble constant,ΩK is the curvature contri-bution to the present density parameter (ΩK = 1−ΩM −ΩΛ),ΩM is the matter density andΩΛ is the vacuum density.Throughout this paper we have assumed a flatΛCDM uni-verse where (H0,ΩM,ΩΛ)=(65h65 km s−1Mpc−1, 0.3, 0.7).This procedure allows us to give each burst a weight (Wb)inversely proportional toNVmax. The rationale of weightingeach burst by 1/NVmax is the following: the visibility vol-ume is different for each GRB of our sample. Moreover,each burst observed is randomly taken from all the bursterspresent in its visibility volume. In this way, rare bright bursts,having a large visibility volume, will have low weights,while faint local GRBs will have heigher weights. This pro-cedure also takes into account the fact that the GRB rateevolves with redshift, leading to the fact that GRBs are aboutten times more frequent atz ∼ 1 than at present. Note thatan evolution of the GRB distributions with the redshift is notincluded in this procedure, although such evolution probablyexists (e.g. Daigne, Rossi & Mochkovitch 2006). This caseis not addressed here because we do not have a sufficientnumber of GRBs.
(3) the total smoothed distribution (SD) is the sum of the individ-ual functionsfb(lep,i), normalized by the corresponding burst’sweightWb
SD(LEintrpeak,sample)
=1
nsimu×
nburst∑
b=1
Wb × fb(lep,i) (5)
with nsimu the number of simulations (100) for each burst andnburst the number of bursts contained in our sample (82).
4.4.2. Results
The resulting unbiasedEpeakdistribution for our sample of burstswith this method is shown in Figure 6. In this Figure we seethat theEpeakdistribution has dramatically changed, with a cleardomination of the bursts having low intrinsicEpeak, i.e. the X-ray flashes.As explained in Section 3, we tested whether a high accuracyfor the pseudo-redshifts was necessary, i.e. whether the resultsobtained could depend on these estimated distance scales. To dothis, we performed the same analysis as described throughoutthis Section, but this time for simulated redshifts randomly se-lected within the error ranges based on the initial ones and artifi-cially increased by factors of 1.4, 2.0 and 3.0. We find that boththe distribution of intrinsicEpeak and the unbiased distributionof intrinsic Epeak do not significantly depend on the accuracy of
0 1 2 3 410
−11
10−10
10−9
10−8
10−7
log Epeakintr (keV)
Num
ber
of G
RB
s / N
Vm
ax
Fig. 6. Unbiased distributions of the intrinsicEpeak for the com-plete sample of 82 GRBs detected and localized by HETE-2.The smoothed distribution (SD) based on the 20 bursts havinga spectroscopic/photometric redshift (z) is represented by thelower solid red curve and the one corresponding to the com-plete sample is shown with the upper solid black curve. The threeblack dotted smoothed distributions show the test performed toquantify the impact of the pseudo-redshift accuracy in thisstudy(all the pseudo-redshifts are given an error range artificially in-creased by factors of 1.4, 2.0 and 3.0). The blue dashed SD corre-sponds to case 2 (see Part 3.3), i.e. the sample of 6200 simulatedGRBs (corresponding to the 62 GRBs of our sample withoutsecure redshift) which are randomly given a redshift from theHETE-2 redshift distribution.
the pseudo-z within a factor 2 or 3 (Fig. 6). This result can beexplained by the intrinsic dispersion of the parameters studiedwhich is so large that the uncertainties in the distance scales donot strongly affect the results.Moreover, we also performed this analysis by assuming for thedistance of each of the 62 GRBs without secure redshift a setof 100 redshifts randomly taken from the total redshift distribu-tion of HETE-2 long bursts (24 values). The results obtainedinthis case differ significantly because the predominence of lowEintr
peak bursts has disappeared. With this method, the distributionis flat and broad. Here again, the distribution’s width may notreflect the true one, but it contributes interesting information tothe unbiasedEpeak distribution, which is probably situated – ‘inreality’ – between the two curves presented in Fig. 6 (black solidline and blue dashed line).
5. Parameter 2: T90
In this section we study the duration distribution of the completesample of HETE-2 GRBs. We adoptedT90 as the common defi-nition for all the bursts. We derive in the following sub-sectionsthe observed, intrinsic and unbiased logT90 distributions us-ing the same method as described for the study of the intrinsiclog Epeak distribution (Sect. 4).
5.1. The observed T90 distribution
T90 is defined as the duration for which 90% of the counts in agiven energy range are detected. Recall that in this study weonly

Pelangeonet al.: Intrinsic properties of a complete sample ofHETE-2GRBs 9
focus on long-duration GRBs. Over the 4 FREGATE bands (A:6-40 keV;B: 6-80 keV;C: 30-400 keV;D: >400 keV) we chosethe one that contained both the classical GRBs and the XRFs,i.e. the bandB (6-80 keV). The logT90 distribution in this energyrange (see Fig. 7) extends from 0.33 to 2.73. The mean value ofthis distribution is 1.40 and the median value 1.33.
5.2. The intrinsic T90 distribution
The histograms are shown in Figure 8. We caution that the ob-servedT90 are measured in the same energy range in the observerframe (see Table 2). Since this energy range depends on the red-shift of the source, it is different for each burst and this has animpact on the intrinsic duration measurement.The histogram of the intrinsic logT90 in the (6-80 keV) energyrange extends from -0.26 to 2.40. The mean value of this distri-bution is 1.01 and the median value is 1.00.Contrary to the logEpeakdistribution, the intrinsic logT90 distri-bution is not broader than the observed logT90 distribution andis extended over about the same range (∼2.5 decades).
−1 0 1 2 30
5
10
15
20
log T90,Bobs (s)
Num
ber
of G
RB
s
Fig. 7. Distributions of the logT90 measured in the observerframe and in bandB of FREGATE (6-80 keV) for the completesample of 82 GRBs localized by HETE-2. The histogram relatedto the sub-sample of bursts with secure redshifts (z) is shown inred, and that of the total sample is shown in grey.
5.3. The unbiased T90 distribution
Correcting the intrinsicT90 for the NVmax (see Part 4.4) we ob-tained the unbiasedT90 distribution (Fig. 9).We note that the GRB population is dominated by events with anintrinsic duration of about 10 s (for an energy range of 6-80 keVin the observer frame). Nevertheless, a non-negligable numberof GRBs have a long intrinsic duration lasting about 300 s.If we consider the case 2 study (Fig. 9), we obtain a significantlydifferent unbiasedT90 distribution, more flat than the one ob-tained in case 1, i.e. no typical intrinsic duration for the GRBappears when considering distances randomly taken within thetotal redshift distribution of HETE-2 GRBs.
−1 0 1 2 30
5
10
15
20
log T90,Bintr (s)
Num
ber
of G
RB
s
Fig. 8. Intrinsic log T90 distributions for the complete sampleof 82 GRBs detected and localized by HETE-2. The histogramof the sub-sample of bursts with secure redshifts (z) is shown inred, and the total sample histogram is shown in grey. The bluedashed histogram corresponds to the case 2 (see Part 3.3), i.e. tothe 62 GRBs without secure redshift that were randomly givenaredshift from the HETE-2 redshift distribution.
−1 0 1 2 310
−11
10−10
10−9
10−8
10−7
10−6
log T90,Bintr (s)
Num
ber
of G
RB
s / N
Vm
ax
Fig. 9. Unbiased distributions of the intrinsic logT90 for thecomplete sample of 82 GRBs detected and localized by HETE-2.The smoothed distribution based on the 20 bursts with spectro-scopic/photometric redshifts (z) is represented by the lower solidred curve; the one for the complete sample is given by the up-per solid black line. The blue dashed SD corresponds to case 2(see Part 3.3), i.e. the sample of 6200 simulated GRBs (corre-sponding to the 62 GRBs of our sample without secure redshift)which were randomly given a redshift from the HETE-2 redshiftdistribution.
6. Parameter 3: isotropic energy
6.1. The observed fluence
Taking the fluences (i.e. the fluxes integrated over the durationof the bursts’ spectra) in the HETE-2 Catalog (Vanderspek et
10 Pelangeonet al.: Intrinsic properties of a complete sample ofHETE-2GRBs
al. 2008) and applying the same method described in Section 4,we show in Figure 10 the histograms of the logarithmic fluencein the energy range 2-30 keV. The distribution of the logSXextends between -7.12 and -4.24. The mean and median valuesof this distribution are -5.90 and -6.00, respectively.
6.2. The isotropic energy
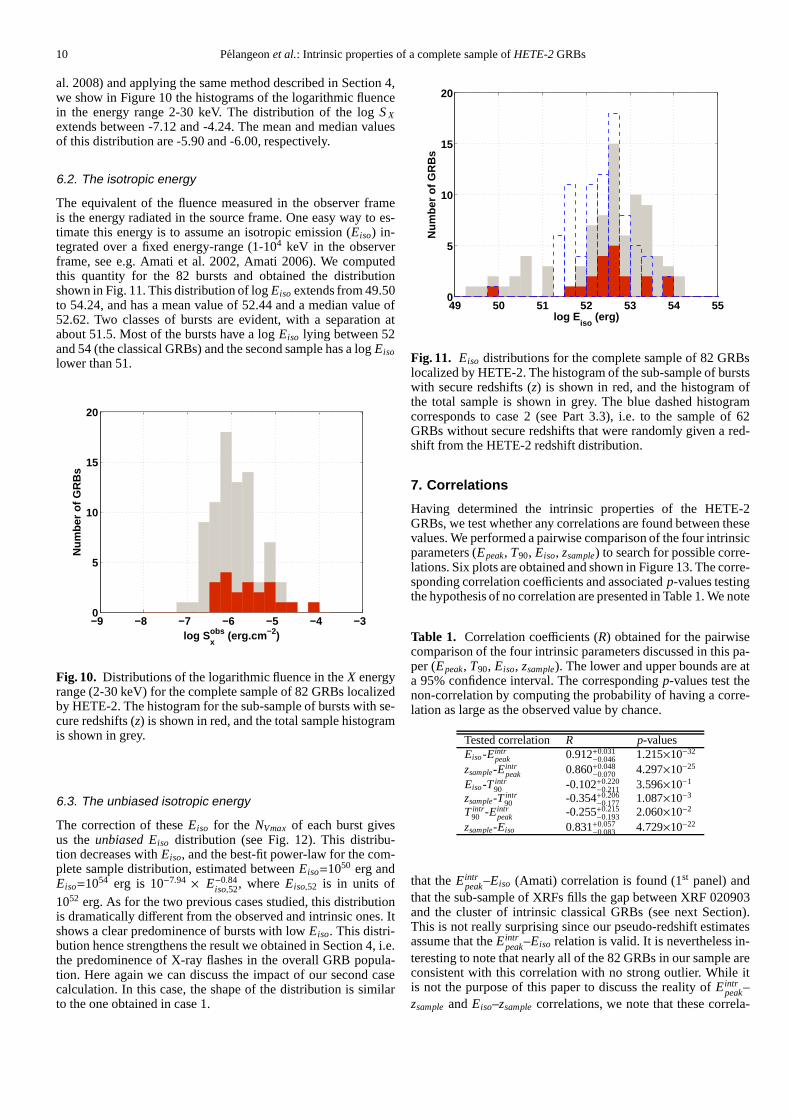
The equivalent of the fluence measured in the observer frameis the energy radiated in the source frame. One easy way to es-timate this energy is to assume an isotropic emission (Eiso) in-tegrated over a fixed energy-range (1-104 keV in the observerframe, see e.g. Amati et al. 2002, Amati 2006). We computedthis quantity for the 82 bursts and obtained the distributionshown in Fig. 11. This distribution of logEiso extends from 49.50to 54.24, and has a mean value of 52.44 and a median value of52.62. Two classes of bursts are evident, with a separation atabout 51.5. Most of the bursts have a logEiso lying between 52and 54 (the classical GRBs) and the second sample has a logEisolower than 51.
−9 −8 −7 −6 −5 −4 −30
5
10
15
20
log Sxobs (erg.cm −2)
Num
ber
of G
RB
s
Fig. 10. Distributions of the logarithmic fluence in theX energyrange (2-30 keV) for the complete sample of 82 GRBs localizedby HETE-2. The histogram for the sub-sample of bursts with se-cure redshifts (z) is shown in red, and the total sample histogramis shown in grey.
6.3. The unbiased isotropic energy
The correction of theseEiso for the NVmax of each burst givesus theunbiased Eiso distribution (see Fig. 12). This distribu-tion decreases withEiso, and the best-fit power-law for the com-plete sample distribution, estimated betweenEiso=1050 erg andEiso=1054 erg is 10−7.94 × E−0.84
iso,52, whereEiso,52 is in units of1052 erg. As for the two previous cases studied, this distributionis dramatically different from the observed and intrinsic ones. Itshows a clear predominence of bursts with lowEiso. This distri-bution hence strengthens the result we obtained in Section 4, i.e.the predominence of X-ray flashes in the overall GRB popula-tion. Here again we can discuss the impact of our second casecalculation. In this case, the shape of the distribution is similarto the one obtained in case 1.
49 50 51 52 53 54 550
5
10
15
20
log Eiso
(erg)
Num
ber
of G
RB
s
Fig. 11. Eiso distributions for the complete sample of 82 GRBslocalized by HETE-2. The histogram of the sub-sample of burstswith secure redshifts (z) is shown in red, and the histogram ofthe total sample is shown in grey. The blue dashed histogramcorresponds to case 2 (see Part 3.3), i.e. to the sample of 62GRBs without secure redshifts that were randomly given a red-shift from the HETE-2 redshift distribution.
7. Correlations
Having determined the intrinsic properties of the HETE-2GRBs, we test whether any correlations are found between thesevalues. We performed a pairwise comparison of the four intrinsicparameters (Epeak, T90, Eiso, zsample) to search for possible corre-lations. Six plots are obtained and shown in Figure 13. The corre-sponding correlation coefficients and associatedp-values testingthe hypothesis of no correlation are presented in Table 1. Wenote
Table 1. Correlation coefficients (R) obtained for the pairwisecomparison of the four intrinsic parameters discussed in this pa-per (Epeak, T90, Eiso, zsample). The lower and upper bounds are ata 95% confidence interval. The correspondingp-values test thenon-correlation by computing the probability of having a corre-lation as large as the observed value by chance.
Tested correlation R p-valuesEiso-Eintr
peak 0.912+0.031−0.046 1.215×10⁻³²
zsample-Eintrpeak 0.860+0.048
−0.070 4.297×10⁻²⁵
Eiso-T intr90 -0.102+0.220
−0.211 3.596×10⁻¹
zsample-T intr90 -0.354+0.206
−0.177 1.087×10⁻³
T intr90 -Eintr
peak -0.255+0.215−0.193 2.060×10⁻²
zsample-Eiso 0.831+0.057−0.083 4.729×10⁻²²
that theEintrpeak–Eiso (Amati) correlation is found (1st panel) and
that the sub-sample of XRFs fills the gap between XRF 020903and the cluster of intrinsic classical GRBs (see next Section).This is not really surprising since our pseudo-redshift estimatesassume that theEintr
peak–Eiso relation is valid. It is nevertheless in-teresting to note that nearly all of the 82 GRBs in our sample areconsistent with this correlation with no strong outlier. While itis not the purpose of this paper to discuss the reality ofEintr
peak–zsampleandEiso–zsamplecorrelations, we note that these correla-

Pelangeonet al.: Intrinsic properties of a complete sample ofHETE-2GRBs 11
49 50 51 52 53 54 550
1
2
3
4
log Eiso
log
Epe
akin
tr
−1 0 10
1
2
3
4
log zsample
log
Epe
akin
tr
−1 0 1 2 30
1
2
3
4
log T90,Bintr
log
Epe
akin
tr
−1 0 1−1
0
1
2
3
log zsample
log
T90
, Bin
tr49 50 51 52 53 54 55
−1
0
1
2
3
log Eiso
log
T90
, Bin
tr
−1 0 149
50
51
52
53
54
55
log zsample
log
Eis
o
Fig. 13. Correlations between the intrinsic parameters studied:Eintrpeak, T intr
90 , Eiso and the distance-scalezsample. In each panel theGRBs that have a measured redshift (z) are represented with the green filled circles, and the ones having a pseudo-redshift (ˆz)are symbolized with the blue open circles. In the top left panel, by way of comparison, we show (solid line) the best-fit power-lawEintr
peak=77× 0.57iso,52 (with Eintr
peak in keV andEiso,52 in units of 1052 erg) found by Amati (2006) and also the vertical logarithmicdeviationof 0.4 (dotted lines) displayed in Amati (2006). In the top right panel the dashed curve marks the redshift evolution of the Epeak,assuming a burst withE(z=0)
peak = 40 keV (see Stratta et al. 2007).
tions could be partially or totally explained by selection effectswhich practically prevent the detection of low-luminosityGRBsat high redshift. In the three last plots, no other ’simple’ tightcorrelation is found, but these plots interestingly show the in-strumental limits affecting the detection of the bursts (duration,energetics and redshift). For instance, we can clearly see thatHETE-2 was lucky to detect the bright GRB 030329 (see pan-els 2 and 6). Hence Figure 13 can be used to show the charac-teristics of the bursts missed by HETE-2, i.e. mainly the GRBsat low-redshift with highEintr
peak or highEiso; and conversely theGRBs with lowEpeak occuring at high redshift.
8. The nature of X-ray flashes
The demonstration of the existence of X-ray flashes (Heise etal. 2001; Kippen et al. 2001) was immediately followed by sev-eral theories attempting to explain their nature and to determinewhether they belong to the same class as the classical GRBs, orwhether they are different cosmological events. Thanks to vari-ous studies of samples of X-ray flashes, several clues now allowus to unambiguously associate XRFs with the classical GRBs.XRFs are GRBs with lowerEpeak and higher fluxes inX-raysthan in γ-rays (e.g. Kippen et al. 2003, 2004; Barraud et al.2003; Sakamoto et al. 2005). The other spectral parameters ofthe prompt emission and the temporal behaviour of XRF after-glows at various wavelengths are identical to those of classicalGRBs (e.g. D’Alessio, Piro & Rossi 2006).In our complete sample, we have 22 bursts classified as XRFs.

12 Pelangeonet al.: Intrinsic properties of a complete sample ofHETE-2GRBs
49 50 51 52 53 54 55−11
−10.5
−10
−9.5
−9
−8.5
−8
−7.5
−7
−6.5
log Eiso
(erg)
Num
ber
of G
RB
s / N
Vm
ax
Fig. 12. UnbiasedEiso distributions for the complete sample of82 GRBs localized by HETE-2. The smoothed distribution basedon the 20 bursts with a spectroscopic/photometric redshift (z) isrepresented by the lower solid red curve; the one for the com-plete sample is shown by the upper solid black line. The bluedashed SD corresponds to case 2 (see Part 3.3), i.e. the sam-ple of 6200 simulated GRBs (corresponding to the 62 GRBsof our sample without secure redshifts) which were randomlygiven a redshift from the HETE-2 redshift distribution. Thebest-fit power-law (green dashed line) for the complete sample, esti-
mated betweenEiso =1050 and 1054 erg is 10−7.94×(
Eiso
1052
)−0.84.
In the following section we discuss some results obtained withthis sample.
8.1. The redshift distribution of HETE-2-XRFs
To explain the origin of the XRFs, Heise et al. (2001) proposedthat they areclassical GRBsoccuring at high redshift. If we con-sider the redshift distribution of the HETE-2 complete sample,we note that the sub-sample of XRFs has a mean distance scale< zsample >
HETE−2XRFs = 0.82, lower than the mean redshift of the
‘classical’ GRBs:< zsample >HETE−2GRBs = 2.09 (see Fig. 14). The
mean redshift of the XRFs contained in our sample is also lowerthan the mean redshift of the Swift XRFs derived by Gendre,Galli & Piro (2007):< z >Swift
XRFs= 1.40 for a sample of 9 XRFswith known redshifts. Consequently, we reject this hypothesis,as was previously done in other studies, e.g. by Barraud et al.(2003) who highlighted this fact with the similar duration distri-butions they obtained for the XRFs and the long classical GRBs.
8.2. Do X-ray flashes form a distinct population ?
We consider in this paragraph the question posed, e.g., in Strattaet al. (2007):do the XRFs form a continuum extending the ‘clas-sical GRBs’ to soft energies, or do they form a distinct popula-tion, the intrinsic XRFs (i-XRFs)?Fig. 13 (panel 1) shows the Amati relation for the complete sam-ple of 82 HETE-2 bursts and Fig. 13 (panel 2) plots theEintr
peakversus the distance-scales of the sources. We do not find anyclear evidence for a distinct population and the results indicatea continuum between the classical GRBs and the XRFs. Indeed,
0 1 2 3 4 5 6 70
0.2
0.4
0.6
0.8
1
redshift
cum
ulat
ive
dist
ribut
ion
Fig. 14. Four distance-scale cumulative distribution functions(cdf). The cdf of the HETE-2 complete sample is shown with thegreen solid line. The two cumulative distributions for the ‘clas-sical’ GRBs and the XRFs are shown with the blue dashed lineand the red dotted line, respectively. We note that most of the 22XRFs are definitely situated at intermediate or low redshift. Forcomparison, we also considered all the long-duration bursts withredshifts detected by Swift-BAT from the beginning of the mis-sion to GRB 080210 (the last Swift burst with a spectroscopicredshift measured to date). The corresponding cdf is the blacksolid line.
according to the HETE-2 sample, several XRFs are situated inthe gap between the group of intrinsic classical GRBs and thetwo intrinsic XRFs 020903 (Sakamoto et al. 2004) and 060218(Amati et al. 2007), as is XRF 050416, a soft burst detected bySwift (Sakamoto et al. 2006a, 2006b). However, half of the sub-sample of the observed XRFs are part of the cluster of intrinsicclassical GRBs when considered in their source frame. This factwas also noted by Stratta et al. (2007).
9. The rate of GRBs in the Local Universe
9.1. The rate of GRBs in the Local Universe, as measured byHETE-2
The various corrections (distance scale, number of GRB withinthe visibility volume) applied to the distributions obtained in theobserver frame allowed us to obtain theunbiaseddistributionsof the intrinsic parameters, i.e. distributions that reflect moreclosely the true distributions of these parameters and the dom-inant characteristics of the gamma-ray burst population.This study also allows us to derive the rate of GRBs detected andlocalized by HETE-2 (RH2
0 ). For that purpose, we consider thateach GRB in our sample contributes to the local rate in propor-tion to:
hb =NVloc(z= 0.1)
NVmax(z= zb,max)(6)
with theNV(z) computed according to Eq. 3, and we obtain therate of HETE-2 GRBs during the mission,
τ =1
Vloc
nburst∑
b=1
hb (7)

Pelangeonet al.: Intrinsic properties of a complete sample ofHETE-2GRBs 13
which is 3.30 Gpc−3.
In order to normalize this rate per year, we took into ac-count the effective monitoring time of the WXM, obtainedfrom:
Tm =Tmission× Tǫ
4π× Scov (8)
where Tm is the effective monitoring time of the WXM,Tmission = 69 months is the duration of the mission,Tǫ = 37%is the mean observation efficiency duringTmission, andScov =
2π(1− cos45) = 1.84 sr the sky-coverage of the WXM8.The effective monitoring time of the WXM is henceTm = 0.31 yr. Using this, the rate of GRBs in the Local Universeper Gpc3 and per year can be found to be∼10.6 Gpc−3yr−1. Thisresult is a lower limit because as shown in Section 4, the burststhat dominate the overall population are the ones with lowEintr
peak,and as we showed in Section 7, HETE-2 missed the bursts withintrinsic Epeak lower than 1 or 2 keV as well as bursts occuringat very high redshifts.If we consider the unbiased distributions obtained in case 2(shown as dotted blue lines throughout the different Figures), weobtain 1.02 Gpc−3, corresponding to a rate of∼3.3 Gpc−3yr−1.As shown in Section 4, the population of gamma-ray burstsis dominated by the X-ray flashes. This is understandable asXRFs are soft but also faint in the observer frame, accordingtothe hardness-intensity relation derived by Barraud et al. (2003).Therefore, if the rate of detected bursts is in fact higher for clas-sical GRBs than for XRFs, we can guess that this is only due toinstrumental limitations, such as the size and the sensitivity ofthe detectors.
9.2. Comparison with the rates of GRBs obtained in previousstudies
Several studies have derived local rates of GRBs using variousmethods mainly based on theoretical considerations.According to the results obtained so far, the predicted rateofGRBs in the Universe seems to be between unity (or less) GRBand several hundreds per Gpc3 and per year. These results seemto be related to the nature of the bursts considered in the studies,i.e (1) ‘classical GRBs’ also called ‘high-luminosity GRBs’(HL-GRBs) and/or (2) sub-luminous (low-luminosity) GRBs(LL-GRBs).
(1) Several authors obtained a GRB rate close to 1 Gpc−3 yr−1.The method they used is generally based on the determinationof the luminosity function (LF) by fitting a phenomenologicalmodel to the log(N) − log(P) relation of well-known GRBcatalogs. Assuming that GRBs trace the star formation rate(SFR), a model of the SFR is adopted for it and the rate of GRBsis determined.For instance, Guetta et al. (2004, 2005) use the 2204 GRBs oftheGUSBAD Catalog(Schmidt 2004) and a sample consistingof 595 long GRBs detected by BATSE. Following Schmidt(2001), they use these samples to find the luminosity functionby fitting a single power-law model to the BATSE observedpeak flux distribution. In addition, they assumed that theGRB rate follows the SFR and hence adopted either the SFRmodel SFR2 of Porciani & Madau (2001) or the SFR model ofRowan-Robinson (1999). The estimated rate lies between 0.1
8 Recall that throughout this study, we only consider the GRBslocal-ized by the WXM.
and 1.1 Gpc−3yr−1. This rate is in agreement with the one foundby Schmidt (2001): 0.5 Gpc−3yr−1 with 1391 GRBs containedin the BATSE DISCLA 2 Catalog(Schmidt 1999) and the onerecently found by Liang et al. (2007) (1.12+0.43
−0.20 Gpc−3yr−1) witha sample of 45 HL Swift-GRBs. The rate of HL HETE-2 GRBsis also consistent with all these results, since we obtain a lowerlimit RH2
0>∼0.45 Gpc−3yr−1 (see Part 9.3).
(2) GRB 060218, detected by Swift-BAT (Cusumano et al.2006), was found to be at very low-redshiftz =0.0331 (Mirabalet al. 2006a). Moreover, its association with the supernovaSN 2006aj (Pian et al. 2006) recalled the characteristics ofGRB 980425, the closest GRB ever identified, at a redshiftz =0.0085 (Tinney et al. 1998). These GRBs associated withSNe are peculiar in the sense that they constitute the two nearestlong duration bursts detected in eight years. Liang et al. (2007)show that the detection of these two events implies a local rateof low-luminosity GRBs (LL-GRBs) of RLL ∼ 800 Gpc−3yr−1,in agreement with Guetta & Della Valle (2007) who find a rateof GRB 980425-like events of∼ 430 Gpc−3yr−1 and a rate ofGRB 060218-like events of∼ 350 Gpc−3yr−1.The rate of LL-GRBs, which is considerably higher than therate of HL-GRBs, could be explained in two ways: first, thelog(N) − log(P) distribution of BATSE bursts often used to fitthe GRB luminosity function cannot constrain it down to suchlow luminosities, because a GRB 060218-like event could nottrigger BATSE. Second, the use of a phenomenological modelfor the GRB LF requires a choice for the extrema valuesLminandLmax. However, due to instrumental limitations, the trueLmin
of GRBs is unknown. Thus, the number of low-luminosity GRBis quite uncertain.
9.3. Discussion
We showed that the study of the complete sample of GRBslocalized by the WXM on-board HETE-2 led to a rateRH2
0>∼ 10.6 Gpc−3yr−1. Our result is independent of any assump-
tion on the luminosity function, as it is based on measured data.We note that this measured rate is at least 10 times higher thanthe HL-GRB rate and 10 times lower than the LL-GRB one.Howcan we explain this ‘intermediate’ result?
– (RH20 < RLL
0 ): We first note that we have no event likeGRB 980425 or GRB 060218 in our sample. Previousstudies showed that it was impossible for an HETE-likemission with a WXM-like camera to detect a burst likeXRF 060218. This burst occured at a distanced =145 Mpc,and Soderberg et al. (2006d) show that the WXM couldhave detected it at a maximum distance of 110 Mpc. For aburst similar to GRB 980425 occurring atd = 36.1 Mpc,the WXM could have detected it to a distanced = 60 Mpc.However, Guetta et al. (2004) show that with their model ofthe LF, the local rate of nearby bright bursts observable byHETE-2 within this distance is only 0.057 yr−1.
– (RH20 > RHL
0 ): If we now imagine that HETE-2 was a missionthat could not detect X-ray flashes, we can try to re-do all thesteps to derive the rate of GRBs detected and localized by it(see Part. 9.1) in the sample of 60 ‘classical’ GRBs. We ob-tain RH2
0>∼ 0.45 Gpc−3yr−1. This result is in good agreement
with the rates usually obtained when only the HL-GRBS areconsidered:∼[0.1–1] Gpc−3yr−1.

14 Pelangeonet al.: Intrinsic properties of a complete sample ofHETE-2GRBs
Consequently, we infer that the difference between the rateof HL-GRBs obtained with BATSE and the rate measuredwith HETE-2 is due to the X-ray flashes. These soft eventscannot be detected in the BATSE energy range (50-300 keV).With our method based on observed properties of GRBs,XRFs and classical GRBs can be distinguished. The averagelower redshift of XRFs leads to higher weights for the XRFsthan for classical GRBs9. In fact, it appears that XRFs con-stitute an intermediate class in terms of frequency betweenthe HL-GRBs and the LL-GRBs, and the rate of XRFs couldbe higher than the rate of classical GRBs by a factor of∼10–100.
Despite their higher softness, faintness and frequency, ourstudy brings the XRFs closer to the classical GRBs. This is notthe case for GRB 980425 or XRF 060218-like events that areundetectable and out of reach of a HETE-2-like mission.
9.4. Comparison with the rate of Type Ib/c SNe
If we compare the measured rate of GRBs based on the com-plete HETE-2 sample and the rate of SNe Ib/c considered inSoderberg et al. (2006d),RSNeIb/c
0 = 9+3−5 × 10³ Gpc−3yr−1 mea-
sured by Cappellaro, Evans & Turatto (1999) and Dahlen et al.(2004), the ratio is&0.1%.This low ratio highlights the fact that not all the type Ib/c SNeproduce GRBs. The main explanation invokes a mildly relativis-tic jet, which is the source of the GRB, but that does not appearin all SNe Ib/c. Indeed, if the optical luminosities of GRBs andSNe can be considered to be similar, optical spectroscopy revealsbroad absorption lines in SNe spectra associated with GRBs,in-dicative of fast ejecta. These peculiar highly energetic SNe, oftendesignedHypernovae(HNe) would not represent more than 3%of the SNe Ib/c, as obtained by the studies based on the compar-ison of radio luminosities of GRB afterglows and SNe Ib/c (seee.g. Berger et al. 2003; Soderberg et al. 2006b; Soderberg 2007).From previous studies of the predicted local rate of GRBs, andwith our measured local rate, we now have a ratio between theSNe Ib/c and the GRBs lying in the range∼[0.1%-3%]. Thissmall ratio could imply that the escape of the ultra-relativisticjet from the progenitor star is not the only ingredient needed toproduce a GRB. In addition, several studies of stellar rotation,binarity, asymmetry and metallicity have shown that the progen-itors must have some special characteristics in order to producea gamma-ray burst.
10. Summary
In this paper we have presented the study of a sample con-taining all the gamma-ray bursts detected by HETE-2 above acertain thresholdand localized by the WXM. Our main goalwas (1) to provide intrinsic distributions of the main globalproperties associated with the GRBs, i.e. taking into accountthe cosmological effects. The parameters studied are the peakenergy (Epeak), the duration (T90) and the total energy (Eiso).The second purpose of this paper is (2) to derive unbiaseddistributions of these properties, taking into account thespatialdensity of GRBs, and to measure the rate of HETE-2 GRBs inthe local universe.
(1) The main conclusions are the following:
9 Recall that the weight taken for each burst is inversely proportionalto the number of GRBs within its visibility volume and is obviouslyredshift-dependent.
– the intrinsicEpeak distribution is quite broad, containing atthe extreme sides of the energy range a large sample of X-ray flashes and few ‘classical’ hard bursts. Nevertheless, wecaution that the true width of this distribution is probablyeven broader than derived here, since the detector character-istics prevented HETE-2 from detecting bursts with an in-trinsic peak energy of 1 or 2 keV or, at the opposite end,bursts with an intrinsic peak energy of a few MeV.
– the intrinsicT90 distribution shows that HETE-2 did not lo-calize very long duration bursts (T90 >1000 s). This maybe a limitation of the orbit because due to its antisolar posi-tion, the detectors are turned off every half-orbit when theyhave the Earth in their field of view, i.e. every∼ 45 min. Onthe other hand, some events have an intrinsic duration below2 seconds and might be considered as ‘intrinsically short’.
– the intrinsicEiso distribution extends over more than fourdecades in energy. Most of the observed bursts haveEiso
higher than 1052 erg: the ‘classical’ GRBs. The distributionextends down to lowerEiso (1050–1051 erg), correspondingto the sample of HETE-2 XRFs.
(2) The main conclusions are the following:
– the ‘unbiased’ distributions are dramatically different fromtheir uncorrected shapes. Indeed, the unbiasedEpeak distri-bution shows a predominence of bursts with intrinsicEpeaklower than 10 keV and the unbiasedEiso distribution showsa predominence of bursts withEiso lower than 1050–1051 erg.TheEiso distribution can be fitted between 1050 and 1054 ergby a simple power-law with a slope of -0.84.However, we caution that the ‘simple’ distributions of theintrinsic parameters probably suffer from biases. The samepoint may be made for the shapes of the ’unbiased’ distri-butions: the true ones are probably also different, as shownby the two studies performed using different distances for thebursts without secure redshifts – case 1: pseudo-redshiftsandcase 2: known spectroscopic redshifts randomly attributed– which lead to different shapes for theEpeak and theT90distributions. This emphasizes the predominence of X-rayflashes and the existence of a typical intrinsic duration forthe GRBs in the first case, whereas a nearly constant numberof GRBs through both theEpeak energy range and the du-rations is highlighted in the second case. We may guess thatthe true distributions are situated between the results of thesetwo cases.
– a possible application of our study is the determination of therate of GRBs measured by HETE-2 in the Local Universe.We obtained a lower limit of 10.6 Gpc−3yr−1, which is in-termediate in magnitude between the rates usually foundwhen a population of High-Luminosity GRBs is considered(∼1 Gpc−3yr−1) or when the Low-Luminosity GRBs are alsotaken into account (>∼100 Gpc−3yr−1). We explain this resultwith two arguments. First, HETE-2 did not detect LL-GRBslike GRB 980425 or XRF 060218 – mainly due to the smallsize of its detectors – so the rate cannot be as high as the onefound for LL-GRBs. Second, it is the sample of XRFs de-tected by HETE-2 that makes the difference between the ratewe obtained and the one found for HL-GRBs. As a conse-quence, thanks to the construction of unbiased distributionsof the intrinsic properties of HETE-2 GRBS, we experimen-tally showed in this paper the dominance in terms of fre-quency of the X-ray flashes over the ‘classical GRBs’, a fre-quency which is nevertheless lower than the sub-luminousbursts, and much smaller than the Type Ib/c supernovae.
Pelangeonet al.: Intrinsic properties of a complete sample ofHETE-2GRBs 15
Acknowledgements.The HETE-2 mission was supported in the US by NASAcontract NASW-4690, in France by CNES contract 793-01-8479and in Japanin part by the Ministry of Education, Culture, Sports, Science and Technologyand by Grant-in-Aid for Scientific Research on Priority Areas 19047001. Theauthors acknowledge the valuable support of the HETE-2 Operation Team. APis supported in France by the Ministry of National Education, Research andTechnology. YEN is supported by the JSPS Research Fellowships for YoungScientists. This work is supported in part by a special postdoctoral researchersprogram in RIKEN. KH is grateful for support under MIT Contract SC-R-293291. G. Pizzichini aknowledges financial support as partof ASI contractI/088/06/0. Finally, the authors acknowledge the referee for his/her valuable andrelevant remarks that helped improving the content of this paper.
References
Amati, L., Frontera, F., Tavani, M., in’t Zand, J. J. M., Antonelli, A., et al. 2002,A&A, 390, 81
Amati, L. 2003, Chinese J. Astron. Astrophys.,Suppl., 3, 455Amati, L. 2006, MNRAS, 372, 233Amati, L., Della Valle, M., Frontera, F., Malesani, D., Guidorzi, C., Montanari,
E. & Pian, E. 2007, A&A, 463, 913Ando, M., Ohta, K., Watanabe, C., Aoki, K., Ohyama, Y., Kawabata, K. S., et al.
2003a, GCN Circ. 1882Ando, M., Ohta, K., Watanabe, C., Aoki, K., Ohyama, Y., Kawabata, K. S., et al.
2003b, GCN Circ. 1884Arnaud, K. & Dorman, B. 2003,XSPEC, An X-Ray Spectral Fitting Package,
User’s Guide for version 11.3xAtteia, J-L. 2000, A&A, 353, L18Atteia, J-L. et al. 2003a, inProc. of Gamma-Ray Burst and Afterglow Astronomy
2001, Woods Hole: A Workshop Celebrating the First Year of the HETEMission.AIP Conference Proceedings, 662, 17
Atteia, J-L. 2003b, A&A, 407, L1Atteia, J-L., Kawai, N., Vanderspek, R., Pizzichini, G., Ricker, G. R., et al.
2005a, ApJ, 626, 292Atteia, J-L. & Pelangeon, A. 2005b, GCN Circ. 3476Atteia, J-L. & Pelangeon, A. 2005c, GCN Circ. 3721Band, D., Matteson, J., Ford, L., Schaefer, B., Palmer, D., Teegarden, B. et al.
1993, ApJ, 413, 281Band, D., Cummings, J., Perri, M., Holland, S., Burrows, D. N., Gehrels, N., et
al. 2005, GCN Circ. 3466Barraud, C., Olive, J-F., Lestrade, J. P., Atteia, J-L., Hurley, K., et al. 2003, A&A,
400, 1021Barraud, C., Atteia, J-L., Olive, J-F., Hurley, K., Ricker,G., Kawai, N., et al.
2004, AIPC, 727, 81Barth, A. J., Sari, R., Cohen, M. H., Goodrich, R. W., Price, P. A., Fox, D. W., et
al. 2003, ApJ, 584, L47Barthelmy, S. D., Cline, T. L., Butterworth, P., Kippen, R. M., et al. 2000, in
Proc. of Gamma-ray bursts: 5th Huntsville Symposium.AIP ConferenceProceedings, 526, 731
Berger, E., Kulkarni, S. R., Frail, D. A., & Soderberg, A. M. 2003, ApJ, 599, 408Berger, E., Gladders, M. & Oemler, G. 2005, GCN Circ. 3201Berger, E., Fox, B. B., Kulkarni, S. R., Frail, D. A., & Djorgovski, S. G. 2007,
ApJ, 660, 504Bloom, J. S., Morrell, N. & Mohanty, S. 2003, GCN Circ. 2212Butler, N. R., Kocevski, D., Bloom, J. S. & Curtis, J. L. 2007,ApJ, 671, 656Caldwell, N., Garnavich, P., Holland, S., Matheson, T. & Stanek, K. Z. 2003,
GCN Circ. 2053Campana, S., Mangano, V., Blustin, A. J., Brown, P., Burrows, D. N., Chincarini,
G., et al. 2006, Nature, 442, 1008Cappellaro, E., Evans, R. & Turatto, M. 1999, A&A, 351, 459Castro-Tirado, A. J., Perez, E., Gorosabel, J., Castro Ceron, J. M., Andersen, M.,
Hjorth, J., et al. 2002, GCN Circ. 1635Cenko, S. B., Fox, D. B., Penprase, B. E., Cucchiara, A., Price, P. A., Berger,
Edo, et al. 2008, ApJ, 677, 441Cobb, B. E., Bailyn, C. D., van Dokkum, P. G., Natarajan, P. 2006, ApJ, 645,
L113Crew, G., Villasenor, J., Vanderspek, R., Doty, J., Monnelly, G., Butler, N., et al.
2002, GCN Circ. 1734Crew, G. B., Lamb, D. Q., Ricker, G. R., Atteia, J.-L., Kawai,N., Vanderspek,
R., et al. 2003, ApJ, 599, 387Cusumano, G., Barthelmy, S., Gehrels, N., Hunsberger, S., Immler, S., Marshall,
F., et al. 2006, GCN Circ. 4775Dahlen, T., Strolger, L-G., Riess, A. G., Mobasher, B., Chary, R-R., Conselice,
C. J. 2004, ApJ, 613, 189Daigne, F., Rossi, E. M. & Mochkovitch, R. 2006, MNRAS, 372, 1034D’Alessio, V., Piro, L. & Rossi, E. M. 2006, A&A, 460, 653
Della Valle, M., Malesani, D., Benetti, S., Testa, V., Hamuy, M., Antonelli, L. A.et al. 2003, A&A, 406, L33
Della Valle, M. 2005,Interacting Binaries: Accretion, Evolution, and Outcomes,797, 150
Della Valle, M. 2006a,in Proc. of Gamma-ray bursts in the Swift era: SixteenthMaryland Astrophysics Conference, ed. S. S. Holt, N. Gehrels& J. Nousek,AIP Conference Proccedings, 836, 367
Della Valle, M., Malesani, D., Bloom, J. S., Benetti, S., Chincarini, G.,D’Avanzo, P., et al. 2006b ApJ, 642, 103
Della Valle, M. 2006c, Chinese J. Astron. Astrophys.,Suppl., 6, 315Della Valle, M., Chincarini, G., Panagia, N., Tagliaferri,G., Malesani, D., Testa,
V., et al. 2006d, Nature, 444, 1050Djorgovski 2001, GCN Circ. 1108Fenimore, E. E. & Ramirez-Ruiz, E. 2000, astro-ph/0004176Firmani, C., Ghisellini, G., Avila-Reese, V. & Ghirlanda, G. 2006, MNRAS, 370,
185Foley, R. J., Chen, H-W., Bloom, J., Prochaska, J. X. 2005, GCN Circ. 3483Fox, D. B., Price, P. A., Soderberg, A. M., Berger, E., Kulkarni, S. R., Sari, R.,
et al. 2003, ApJ, 586, L5Fox D. B., Berger E., Price P. A., Cenko S. B., et al. 2007, GCN Circ. 6071Fugazza, D., Fiore, F., Cocchia, M., Antonelli, L. A., Covino, S., Pianet, E., et
al. 2003, GCN Circ. 1983Fugazza, D., Fiore, F., Covino, S., Antonelli, L. A., D’Avanzo, P., Cocchia, F., et
al. 2004, GCN Circ. 2782Fynbo, J. P. U., Watson, D., Thone, C. C., Sollerman, J., Bloom, J. S., Davis,
T. M., et al. 2006b, Nature, 444, 1047Galama, T. J., Vreeswijk, P. M.; van Paradijs, J., Kouveliotou, C., Augusteijn, T.,
Bohnhardt, H., et al. 1998, Nature, 395, 670Gal-Yam, A., Berger, E., Fox, D. B., Soderberg, A. M., Cenko,S. B., Cameron,
P. B., et al. 2005, GCN Circ. 4156Gal-Yam, A., Fox, D. B., Price, P. A., Ofek, E. O., Davis, M. R., Leonard, D. C.,
et al. 2006, Nature, 444, 1053Gehrels, N., Chincarini, G., Giommi, P., Mason, K. O., Nousek, J. A., et al. 2004,
ApJ, 611, 1005Gehrels, N., Norris, J. P., Barthelmy, S. D., Granot, J., Kaneko, Y., Kouveliotou,
C., et al. 2006, Nature, 444, 1044Gendre, B., Galli, A. & Piro, L. 2007, A&A, 465, L13Ghirlanda, G., Ghisellini, G. & Lazzati, D. 2004, ApJ, 616, 331Ghirlanda, G., Ghisellini, G. & Firmani, C. 2006, New Journal of Physics, 8, 123Golenetskii, S., Aptekar, R., Mazets, E., Pal’shin, V., Frederiks, D., Cline, T., et
al. 2005a, GCN Circ. 3474Golenetskii, S., Aptekar, R., Mazets, E., Pal’shin, V., Frederiks, D., Cline, T., et
al. 2005b, GCN Circ. 3660Gotz, D., Mereghetti, S., Beck, M., Borkowski, J., et al. 2003, GCN Circ. 2459Greiner, J., Guenther, E., Klose, S., Schwarz, R., et al. 2003a, GCN Circ. 1886Greiner, J., Peimbert, M. Estaban, C., Kaufer, A., Vreeswijk, P., Jaunsen, A., et
al. 2003b, GCN Circ., 2020Guetta, D., Perna, R., Stella, L. & Vietri, M. 2004, ApJ, 615,L73Guetta, D., Piran, T. & Waxman, E. 2005, ApJ, 619, 412Guetta, D. & Della Valle, M. 2007, ApJ, 657, L73Heise, J., in’t Zand, J., Kippen, R.M. & Woods, P.M. 2001,in Proc. 2nd
Rome Workshop: Gamma-Ray Bursts in the Afterglow Era, ed. E.Costa,F. Frontera& J. Hjorth (Berlin: Springer-Verlag), 16
Hjorth, J., Sollerman, J., Møller, P., Fynbo, J. P. U., Woosley, S. E., Kouveliotou,C., et al. 2003a, Nature, 423, 847
Hjorth, J., Møller, P., Gorosabel, J., Fynbo, J. P. U., Toft,S., Jaunsen, A. O., etal. 2003b, ApJ, 597, 699
Jakobsson, P., Hjorth, J., Fynbo, J. P. U., Weidinger, M., Gorosabel, J., Ledoux,C., et al. 2004, A&A, 427, 785
Jakobsson, P., Frail., D. A., Fox, D. B., Moon, D-S., Price, P. A., Kulkarni, S. R.,et al. 2005a, ApJ, 629, 45
Jakobsson, P., Fynbo, J. P. U., Paraficz, D., Telting, J., Jensen, B. L., Hjorth, J.,et al. 2005b, GCN Circ., 4029
Kaneko, Y., Preece, R. D., Briggs, M. S., Paciesas, W. S., Meegan, C. A., Band,D. L. 2006, ApJ, 166, 298
Kelson, D. D., Koviak, K., Berger E., Fox, D. B., et al. 2004, GCN Circ. 2627Kippen, R. M., et al., 2001,in Proc. 2nd Rome Workshop: Gamma-Ray Bursts in
the Afterglow Era, ed. E. Costa, F. Frontera& J. Hjorth (Berlin: Springer-Verlag), 22
Kippen, R .M., Woods, P. M., Heise, J., in’t Zand, J.J.M., Briggs, M. S. & Preece,R. D. 2003, AIPC, 662, 244
Kippen, R. M., in’t Zand, J. J. M., Woods, P. M., Heise, J., Briggs, M. S. &Preece, R. D. 2004, AIPC, 727, 119
Kulkarni, S. R., Frail, D. A., Wieringa, M. H., Ekers, R. D., Sadler, E. M., Wark,R. M., et al. 1998, Nature, 395, 663
Lamb, D. Q., Ricker, G. R., Atteia, J-L., Hurley, K., Kawai, N., Shirasaki, Y.,et al. 2003,in proc. 3rd Rome Workshop on Gamma-Ray Bursts in theAfterglow Era, astro-ph/0312503

16 Pelangeonet al.: Intrinsic properties of a complete sample ofHETE-2GRBs
Lamb, D. Q., Donaghy, T. Q. & Graziani, C. 2004a, New A Rev., 48, 459Lamb, D. Q., Ricker, G. R., Atteia, J-L., Barraud, C., Boer, M., Braga, J., et al.
2004b, New A Rev., 48, 423Lazzati, D., Perna, R., Flasher, J., Dwarkadas, V. V. & Fiore, F. 2006, MNRAS,
372, 1791Levan, A., Fruchter, A., Rhoads, J., Mobasher, B., Tanvir, N., Gorosabel, J., et
al. 2006, ApJ, 647, 471Liang, E., Zhang, B., Virgili, F. & Dai, Z. G. 2007, ApJ, 662, 1111Lloyd, N. M., Petrosian, V. & Mallozzi, R. S. 2000, ApJ, 534, 227Lloyd-Ronning, N. M, Fryer, C. L. & Ramirez-Ruiz, E. 2002a, ApJ, 574, 554Lloyd-Ronning, N. M, & Ramirez-Ruiz, E. 2002b, ApJ, 576, 101Maiorano, E., Masetti, N., Palazzi, E., Savaglio, S., Rol, E., Vreeswijk, P. M., et
al. 2006, A&A, 455, 423Malesani, D., Tagliaferri, G., Chincarini, G., Covino, S.,Della Valle, M.,
Fugazza, D., et al. 2004, ApJ, 609, L5Martini, P., Garnavich, P. & Stanek, K. Z. 2003, GCN Circ. 1980Masetti, N., Palazzi, E., Pian, E., Patat, F., et al. 2006, GCN Circ. 4803Matheson, T., Garnavich, P. M., Stanek, K. Z., Bersier, D., Holland, S. T.,
Krisciunas, K., et al. 2003, ApJ, 599, 394Mazzali, P. A., Deng, J, Tominaga, N., Maeda, K., Nomoto, K.,Matheson, T., et
al. 2003, ApJ, 599, 95Mirabal, N., Halpern, J. P., et al. 2006a, GCN Circ. 4792Mirabal, N., Halpern, J. P., An, D., Thorstensen, J. R.& Terndrup, D. M. 2006b,
ApJ, 643, L99Modjaz, M., Stanek, K. Z., Garnavich, P. M., Berlind, P., Blondin, S., Brown,
W., et al. 2006, ApJ, 645, L21Norris, J. P., Marani, G. F. & Bonnell, J. T. 2000, ApJ, 534, 248Pelangeon, A., Atteia, J-L., Ricker, G. R., Lamb, D. Q., et al. 2006a,in Proc.
of Gamma-ray bursts in the Swift era: Sixteenth Maryland AstrophysicsConference, ed. S. S. Holt, N. Gehrels& J. Nousek, AIP ConferenceProccedings, 836, 149
Pelangeon, A. & Atteia, J-L. 2006b, GCN Circ. 5004Pelangeon, A. & Atteia, J-L. 2007a, GCN Circ. 6033Pelangeon, A. & Atteia, J-L. 2007b, GCN Circ. 6054Perna, R, Sari, R & Frail, D. 2003, ApJ, 594, 379Pian, E., Amati, L., Antonelli, L. A., Butler, R. C., Costa, E., Cusumano, G., et
al. 1999, A&AS, 138, 463Pian, E., Mazzali, P. A., Masetti, N., Ferrero, P., Klose, S., Palazzi, E., et al. 2006,
Nature, 442, 1011Porciani, C., & Madau, P. 2001 ApJ, 548, 522Preece, R. D., Briggs, M. S., Mallozzi, R. S., Pendleton, G. N., Paciesas, W. S.
& Band, D. L. 2000, ApJS, 126, 19Price, P. A., Schmidt, B. P., Kulkarni, S. R., et al. 2002, GCNCirc. 1259Price, P. A., Fox, D. W., Djorgovski, S. G., West, M., Cote, P., Jordan, A., et al.
2003, GCN Circ. 1889Prochaska, J. X., Bloom, J. S., Chen, H.-W., Foley, R. J., Roth, K., et al. 2005,
GCN Circ. 3204Rau, A., Salvato, M. & Greiner, J. 2005, A&A, 444, 425Reichart, D. E., Lamb, D. Q., Fenimore, E. E., Ramirez-Ruiz,E., Cline, T. L. &
Hurley, K. 2001, ApJ, 552, 57Ricker, G. R., Atteia, J-L., Crew, G., et al. 2001, AIPC, 662,3Rol, E., Vreeswijk, P., Jaunsen, A., et al. 2003, GCN Circ. 1981Rowan-Robinson, M. 1999, Ap&SS, 266, 291Sakamoto, T., Lamb, D. Q., Graziani, C., Donaghy, T. Q., Suzuki, M., Ricker,
G., et al. 2004, ApJ, 602, 875Sakamoto, T., Lamb, D.Q., Kawai, N., Yoshida, A., et al. 2005, ApJ, 629, 311Sakamoto, T., Barbier, L., Barthelmy, S. D., Cummings, J. R., Fenimore, E. E.,
Gehrels, N., et al. 2006a, ApJ, 636, 73Sakamoto, T., Barbier, L., Barthelmy, S. D., Cummings, J. R., Fenimore, E. E.,
Gehrels, N., et al. 2006b,in Proc. of Gamma-ray bursts in the Swift era:Sixteenth Maryland Astrophysics Conference, ed. S. S. Holt, N. Gehrels&J. Nousek, AIP Conference Proccedings, 836, 578
Savaglio, S., Fiore, F., Israel, G., Marconi, G., Antonelli, L.A., Fontana, A., etal. 2002, GCN Circ. 1633
Schaefer, B. E. 2002,Gamma-Ray Bursts: The Brightest Explosions in theUniverse (Harvard)
Schaefer, B. E. 2003, ApJ, 583, L71Schaefer, B. E. 2007, ApJ, 660, 16Schmidt, M. 1999, ApJ, 523, L117Schmidt, M. 2001, ApJ, 552, 36Schmidt, M. 2004, ApJ, 616, 1072Shin, M-S., Berger, E., Penprase, B. E., Fox, D. B., Price, P.A., Kulkarni, S. R.,
et al. 2006, ApJ subm., astro-ph/0608327Shirasaki, Y., Kawai, N., Yoshida, A., Matsuoka, M., Tamagawa, T., et al. 2003,
PASJ, 55, 1033Soderberg, A. M., Kulkarni, S. R., Berger, E., Fox, D. B., Price, P. A., Yost, S. A.,
et al. 2004a, ApJ, 606, 994Soderberg, A. M., Frail, D. A., & Wieringa, M. H. 2004b, ApJ, 607, L13
Soderberg, A. M., Kulkarni, S. R., Price, P. A., Fox, D. B., Berger, E., Moon,D.-S., et al. 2006a, ApJ, 636, 391
Soderberg, A. M., Nakar, E., Berger, E., & Kulkarni, S. R. 2006b, ApJ, 638, 930Soderberg, A. M. 2006c,in Proc. of Gamma-ray bursts in the Swift era: Sixteenth
Maryland Astrophysics Conference, ed. S. S. Holt, N. Gehrels& J. Nousek,AIP Conference Proccedings, 836, 380
Soderberg, A. M., Kulkarni, S. R., Nakar, E., Berger, E., Cameron, P. B., Fox,D. B., et al. 2006d, Nature, 442, 1014
Soderberg, A. M. 2007,in Proc. for ’Supernova 1987A: 20 Years After:Supernovae and Gamma-Ray Bursters’AIPC, New York, eds. S. Immler,K.W. Weiler, and R. McCray, astro-ph/0706.3047
Sollerman, J., Jaunsen, A. O., Fynbo, J. P. U., Hjorth, J., Jakobsson, P.,Stritzinger, M., et al. 2006, A&A, 454, 503
Stanek, K. Z., Matheson, T., Garnavich, P. M., Martini, P., Berlind, P., Caldwell,N., et al. 2003, ApJ, 591, L17
Stratta, G., Basa, S., Butler, N., Atteia, J-L., Gendre, B.,Pelangeon, A., et al.2007, A&A, 461, 485
Tinney, C., et al. 1998, IAUC 6896, 1Vanderspek, R., Crew, G., Doty, J., Villasenor, J., Monnelly, G., Butler, N., et al.
2003, GCN Circ. 1997Vanderspek, R., Sakamoto, T., Barraud, C., Tamagawa, T., Graziani, C., Suzuki,
M., et al. 2004, ApJ, 617, 1251Vanderspek, R., and the HETE-2 Team,in prepVillasenor, J. S., et al. 2003, inGamma-Ray Burst and Afterglow Astronomy
2001, ed. G. R. Ricker & R. K. Vanderspek (Melville, NY: AIP), 33Villasenor, J. S., Lamb, D. Q., Ricker, G. R., Atteia, J-L., Kawai, N., et al. 2005,
Nature, 437, 855Vreeswijk, P., Fruchter, A., Hjorth, J., Kouveliotou, C., et al. 2002, GCN Circ.
1785Vreeswijk, P., Wijers, R., Rol, E., Hjorth, J., et al. 2003, GCN Circ. 1953Wiersema, K., Starling, R. L. C., Rol, E., Vreeswijk, P., Wijers, R. A. M. J., et
al. 2004, GCN Circ. 2800Woosley, S. E. 1993, ApJ, 405, 273Woosley, S. E., Bloom, J. S. 2006, ARA&A, 44, 507Yonetoku, D., Murakami, T., Nakamura, T., Yamazaki, R., Inoue, A.K., Ioka, K.
2004, ApJ, 609, 935

Pelangeonet al.: Intrinsic properties of a complete sample ofHETE-2GRBs 17
Table 2.Observed properties and distances used in this study.The GRB names in the formatYYMMDDare given in column 1. Columns 2 to 5 contain the spectral parameters measured for each burst: theslope of the power-laws at low-energy (α) and at high-energy when possible (β); the peak energy (Eobs
peak) in keV and the fluence in the energyrange 2-30 keV (SX), in units of 10−7 ergs cm−2. TheT90 durations in the FREGATE bandB (6-80 keV) are reported in column 6. The signal-to-noise ratio (SNR) corresponding to the best combinationof energy range and time resolution (see Section 2) are in column 7. Thezsample(i.e.the spectroscopic/photometric redshifts when available or the pseudo-redshifts otherwise) are reported in column 8. The last column contains thereferences for the redshifts.
GRB α β Eobspeak (keV) SX T90,B SNR zsample Ref.zsample
001226 −1 −2.094+0.194−0.293 22.32+7.48
−7.42 17.03+1.7−1.7 90.69± 2.5 10.35 0.98+0.3
−0.3 [0]010213 −1 −3+0.2
−0.5 3.4+0.4−0.4 7.9+0.3
−0.5 20.12± 2.16 41.98 0.17+0.06−0.06 [0]
010225 −1.3+0.3−0.3 −− 32+27
−9 3.5+0.4−0.4 6.3± 0.6 7.94 1.47+0.55
−0.55 [0]010326 −1.08+0.25
−0.22 −− 51.8+18.6−11.3 2.42+0.39
−0.39 2.15± 0.32 20.71 2.93+1.65−1.65 [0]
010612 −1.1+0.2−0.2 −− 240+290
−82 8.8+1.4−1.3 49.98± 3.54 23.52 5.25+2.2
−2.2 [0]010613 −1+0.3
−0.3 −2+0.1−0.2 46+18
−10 102+7−7 146.74± 2.44 45.05 0.64+0.2
−0.2 [0]010629 −1.1+0.1
−0.1 −− 46+5−4 25.4+1.7
−1.7 15.8± 0.28 40.15 0.91+0.4−0.4 [0]
010921 −1.6+0.1−0.1 −− 89+22
−14 72+3−3 21.92± 1.18 71.52 0.45+0.005
−0.005 [1; 2]010928 −0.7+0.1
−0.1 −− 410+120−75 13.7+1.2
−1.4 31.73± 0.97 39.04 3.64+0.8−0.8 [0]
011019 −1.4 −− 19+18−9 3+0.6
−0.6 22.5± 2.24 8.75 0.5+0.5−0.5 [0]
011130 −− −2.7+0.3−0.3 < 3.9 5.9+1
−1 10.64± 2.86 7.66 < 0.17 [0]011212 −1.23 −2.15+0.26
−1.33 < 3.74 4.85+0.49−0.49 39.62± 6.55 8.09 0.34+0.22
−0.22 [0]020124 −0.87+0.19
−0.16 −2.6+0−0.65 82+17
−17 20+1.4−1.4 51.17± 1.55 21.63 3.198+0.004
−0.004 [3]020127 −1+0.1
−0.1 −− 100+47−24 6.7+0.5
−0.5 6.99± 0.26 27.65 1.9+0.2−0.4 [4]
020305 −1.06+0.14−0.13 −2.3 245.1+276.7
−99.9 27.49+1.94−4.82 39.06± 1.17 28.54 1.98+0.7
−0.7 [0]020317 −0.6+0.6
−0.5 −− 28+13−7 2.2+0.4
−0.4 7.14± 1.04 12.11 2.11+0.55−0.55 [0]
020331 −0.8+0.1−0.1 −− 92+21
−14 16+1−1 179.4± 5.99 28.15 2.21+0.7
−0.7 [0]020625 −1.1 −− 8.5+5.4
−2.9 2.4+0.6−0.5 13.98± 3.82 8.18 0.73+0.13
−0.13 [0]020801 −0.3+0.4
−0.3 −2+0.2−0.3 53+14
−11 26+3−3 460.33± 3.63 15.54 1.21+1
−1 [0]020812 −1.1+0.3
−0.3 −− 88+110−30 8+1
−1 18.28± 1.55 14.63 3.48+1.8−1.8 [0]
020813 −1.36+0.05−0.05 −2.3 253.4+52.4
−35.6 147.91+7.32−7 87.34± 0.6 92.98 1.255+0.005
−0.005 [5]020819 −0.9+0.2
−0.1 −2+0.2−0.5 50+18
−12 25.2+1.1−1.1 28.8± 7.19 50.61 0.41+0.01
−0.01 [6]021004 −1+0.2
−0.2 −− 80+53−23 7.7+0.7
−0.7 48.94± 2.5 13.85 2.31+0.01−0.01 [7; 8; 9]
021016 −1.2+0.11−0.12 −2.3 226.2+268.7
−86.4 34.17+2.44−3.59 80.63± 0.95 28.55 2.8+1.6
−1.6 [0]021021 −1.3 −− 15+14
−8 2.5+0.6−0.6 18.9± 5.13 6.28 1+0.5
−0.5 [0]021104 −1.1+0.5
−0.5 −− 28+17−8 10+2
−2 21.18± 4.08 10.52 1.1+0.3−0.3 [0]
021112 −0.9+0.4−0.3 −− 57+39
−21 1.3+0.3−0.3 3.24± 1.28 9.86 4.15+1.9
−1.9 [0]021211 −0.805+0.112
−0.105 −2.37+0.18−0.31 46.8+5.8
−5.1 13.6+0.5−0.5 4.23± 0.27 76.24 1.006+0.001
−0.001 [10; 11]030115 −1.3+0.1
−0.1 −− 83+53−22 7.9+0.6
−0.6 20.33± 3.54 27.29 2.2+0.1−0.1 [12]
030226 −0.9+0.2−0.2 −− 97+27
−17 13+1−1 76.23± 3.96 16.3 1.98+0.02
−0.02 [13; 14; 15; 16; 17]030324 −1.5+0.1
−0.1 −− 150+630−65 5.5+0.4
−0.4 10.98± 2.84 21.27 > 2.3 [0]030328 −1.14+0.03
−0.03 −2.1+0.2−0.4 130+14
−13 82+1−1 138.27± 3.05 55.68 1.5216+0.0006
−0.0006 [18; 19; 20; 21]030329 −1.32+0.02
−0.02 −2.44+0.08−0.08 70.2+2.3
−2.3 576+5−5 25.91± 0.39 581.25 0.1685+0.0001
−0.0001 [22; 23; 24]030416 −− −2.3+0.1
−0.2 2.6+0.5−1.8 9+0.9
−0.9 14.29± 2.29 18.02 0.11+0.04−0.04 [0]
030418 −1.5+0.1−0.1 −− 46+32
−14 17.1+1.1−1.1 139.23± 7.76 9.26 3.07+1.7
−1.7 [0]030429 −1.1+0.3
−0.2 −− 35+12−8 4.7+0.5
−0.5 12.95± 2.69 13.25 2.658+0.004−0.004 [25]
030519 −0.8+0.1−0.1 −1.7+0.1
−0.1 138+18−15 87.1+2.4
−2.4 12.85± 0.56 193.85 0.86+0.1−0.1 [0]
030528 −1.3+0.2−0.1 −2.7+0.3
−1 32+5−5 62+3
−3 62.8± 4.49 28.11 0.782+0.001−0.001 [26]
030723 −− −1.9+0.2−0.2 < 8.9 2.8+0.5
−0.5 9.63± 1.5 9.74 0.54+0.15−0.15 [0]
030725 −1.51+0.04−0.04 −− 102+19
−14 94+2−2 174.31± 17.07 88.56 0.89+0.2
−0.2 [0]030821 −0.9+0.1
−0.1 −− 84+15−11 10+0.6
−0.6 19.42± 0.44 21.43 1.77+0.5−0.5 [0]
030823 −1.3+0.2−0.2 −− 27+8
−5 23.1+1.6−1.6 50.39± 3.11 15.49 0.83+0.3
−0.3 [0]030824 −− −2.1+0.1
−0.1 6.1+1.9−4.2 8.9+1.1
−1.1 10.13± 1.04 12.84 0.26+0.1−0.1 [0]
030913 −0.8+0.3−0.2 −− 120+110
−37 1.8+0.2−0.2 6.58± 2.3 14.23 6.04+2.7
−2.7 [0]031026 −1.13+0.36
−0.21 −2.3 870.3+129.7−679 3.56+1.26
−3.46 65.58± 4.55 8.46 6.67+2.9−2.9 [0]
031109A −1.17+0.03−0.04 −2.3 185.2+29.8
−23.7 98.3+3−2.9 57.32± 0.46 78.68 0.94+0.2
−0.2 [0]031109B −1.27+0.28
−0.24 −− 37.7+28.4−12.29 4.9+0.5
−0.6 531.25± 72.25 8.7 2.05+0.9−0.9 [0]
031111A −0.82+0.05−0.05 −− 404.4+67.8
−51.4 14.9+0.6−0.7 7.94± 0.53 151.81 2.14+0.4
−0.4 [0]031111B −− −2.2+0.2
−0.38 6.01+3.8−5.01 9.85+0.99
−0.99 27.34± 2.16 5.81 0.11+0.17−0.17 [0]
031203 −1.18+0.1−0.09 −2.3 148.2+32.45
−23.91 22.68+1.44−1.68 10.38± 0.29 92.35 2.17+0.7
−0.7 [0]

18 Pelangeonet al.: Intrinsic properties of a complete sample ofHETE-2GRBs
Table 2. (continued)
GRB α β Eobspeak (keV) SX T90,B SNR zsample Ref.zsample
031220 −1.51+0.23−0.2 −3.25+1.3
−6.75 46.9+62.1−16.4 5.5+0.6
−0.5 9.69± 0.93 13.9 1.53+1.2−1.2 [0]
040319 −0.89+0.24−0.2 −− 56.6+14.1
−9.7 6+0.6−0.5 6.1± 0.85 23.12 1.79+1.2
−1.2 [0]040423 −1.02+0.31
−0.27 −− 30.7+4.8−4 22.7+2.6
−2.2 45.87± 1.13 17.47 1.26+0.7−0.7 [0]
040425 −0.86+0.09−0.08 −− 299.9+72.9
−48.7 17.2+1.4−1.4 138.81± 1.65 11.16 2.23+0.5
−0.5 [0]040511 −0.92+0.15
−0.14 −− 93.9+15.7−11.3 31.7+0.3
−2.8 45.8± 0.53 36.61 1.83+0.5−0.5 [0]
040701 −− −2.3+0.25−0.31 < 3.44 5.44+0.55
−0.55 11.67± 5.72 12.76 0.2146+0.0005−0.0005 [27]
040709 −1.25+0.08−0.07 −− 70.9+8.3
−6.7 80.6+4.2−4 82.48± 0.24 58.3 1+0.3
−0.3 [0]040802 −0.85+0.23
−0.2 −− 92.2+18.8−13 4.79+0.68
−0.68 3.05± 0.18 39.39 1.81+0.65−0.65 [0]
040825A −1.51+0.22−0.22 −− 60+30
−30 9.6+1.5−1.5 39.2± 2.01 10.47 1.06+0.5
−0.5 [0]040825B −1.48+0.21
−0.17 −− 25.1+15.6−8.2 12+0.9
−0.9 15.8± 5.45 10.3 2.2+0.8−0.8 [0]
040912A −1.17+1.54−0.62 −2.49+0.24
−0.4 14.16+3.32−4.32 20.36+2.04
−2.04 9.21± 0.27 39.44 0.33+0.3−0.3 [0]
040912B −1.25+0.82−0.58 −− 17+13
−13 9.5+0.95−0.95 122.41± 7.18 8.19 1.563+0.001
−0.001 [28]040916 −1 −− < 3.5 7.74+0.91
−0.91 349± 10.23 6.66 < 0.7 [0]040924 −1.03+0.09
−0.09 −− 41.1+2.3−2.3 23.4+0.24
−0.24 3.37± 0.08 85.97 0.859+0.005−0.005 [29]
041004 −1.3+1.17−0.17 −− 53.7+11.7
−7.5 133.8+19.7−18.4 50.13± 2.49 35.64 0.58+0.2
−0.2 [0]041006 −1.3+0.05
−0.05 −− 47.7+3−2.7 38.9+0.6
−0.9 22.08± 0.33 120.37 0.716+0.005−0.005 [30]
041016 −1.13+0.36−0.21 −2.3 165.3+731.8
−75.2 8.21+1.53−1.93 21.96± 1.7 13.59 3.49+1.7
−1.7 [0]041127 −1.01+0.27
−0.16 −2.27+0.24−0.47 35+10
−10.2 26.9+0.07−1.4 49.14± 2.26 25.19 0.96+0.5
−0.5 [0]041211 −0.69+0.48
−0.2 −1.48+0.16−0.54 132+116
−76.3 10.6+0.4−0.8 113.84± 4.2 44.38 3.29+0.9
−0.9 [0]050123 −0.71+0.22
−0.2 −− 40.2+6−5 6.7+0.5
−3.7 14.72± 1.17 25.06 1.53+0.85−0.85 [0]
050209 −1.52+0.3−0.15 −2.3 445+555
−350.5 5.5+0.82−5.4 18.38± 0.59 15.37 2.93+1.6
−1.6 [0]050408 −1.76+0.09
−0.06 −2.2+0.16−0.28 25.9+10.5
−7.3 32.4+0.3−1.1 28.39± 0.56 50.85 1.2357+0.0002
−0.0002 [31; 32]050509 −− −− < 19 6+0.6
−0.6 21± 5 7.06 0.68+0.3−0.3 [0]
050729 −0.61+0.43−0.32 −2.3 78.42+23.22
−16.03 3.97+0.69−0.65 5.23± 0.51 24.35 2.5+0.75
−0.75 [0]050807 −1.53+0.42
−0.22 −2.3 69.47+102.9−31.12 14.15+1.84
−3.36 10.32± 1 19.17 0.79+0.75−0.75 [0]
050922 −0.83+0.23−0.26 −− 130.5+50.9
−26.8 5.4+0.54−0.54 6.13± 1.4 38.25 2.198+0.001
−0.001 [33]051021 −1.04+0.11
−0.1 −− 96+26−16.6 19.2+0.5
−0.7 36.79± 1.13 35.54 1.37+0.5−0.5 [0]
051022 −1.01+0.02−0.03 −1.95+0.25
−0.14 213+18−18 214+2
−2 178± 8 226.38 0.8+0.01−0.01 [34]
051028 −0.94+0.18−0.16 −− 249+167
−70 7.99+0.59−0.67 14.66± 1 25.35 3.66+1.8
−1.8 [0]051211 −0.07+0.5
−0.41 −− 121+33−20.3 0.765+0.228
−0.228 4.9± 0.61 18.83 4.83+1.9−1.9 [0]
060115 −0.74+0.12−0.1 −1.81+0.12
−0.21 94.6+21.4−17.6 22.4+0.4
−0.5 20.68± 0.45 87.09 1.52+0.25−0.25 [0]
060121 −0.79+0.12−0.11 −− 114+14.2
−10.9 8.98+0.67−0.67 2.61± 0.1 80.37 1.92+0.35
−0.35 [0]
[0]= our work; [1]= Djorgovski (2001); [2]= Price et al. (2002); [3]= Hjorth et al. (2003b); [4]= Berger et al. (2007); [5]= Barth et al. (2003); [6]=Jakobsson et al. (2005a); [7]= Savaglio et al. (2002); [8]= Castro-Tirado et al. (2002); [9]= Lazzati et al. (2006); [10]= Vreeswijk et al. (2002);[11]= Fox et al. (2003); [12]= Levan et al. (2006); [13]= Ando et al. (2003a); [14]= Ando et al. (2003b); [15]= Greiner et al. (2003a); [16]= Priceet al. (2003); [17]= Shin et al. (2006); [18]= Martini et al. (2003); [19]= Rol et al. (2003); [20]= Fugazza et al. (2003); [21]= Maiorano et al.(2006); [22]= Greiner et al. (2003b); [23]= Caldwell et al. (2003); [24]= Bloom et al. (2003); [25]= Jakobsson et al. (2004); [26]= Rau, Salvato& Greiner (2005); [27]= Kelson et al. (2004); [28]= Stratta et al. (2007); [29]=Wiersema et al. (2004); [30]= Fugazza et al. (2004); [31]= Berger,Gladders & Oemler (2005); [32]= Prochaska et al. (2005); [33]= Jakobsson et al. (2005b); [34]= Gal-Yam et al. (2005).

Pelangeonet al.: Intrinsic properties of a complete sample ofHETE-2GRBs 19
Table 3. Intrinsic properties of our complete sample of HETE-2 localized GRBs.For each burst, the values reported in columns 2, 3 and 4 are base 10 logarithms which enable us to obtain the individual lognormal distributionsof the Epeak, T90,B andEiso. Thezmax used to derive the correspondingVmax are shown in column 5. The resultingV/Vmax are reported in the lastcolumn.
GRB logEintrpeak log T intr
90,B log Eiso,52 zmax V/Vmax
001226...... 1.648± 0.091 1.66± 0.037 0.516± 0.112 1.12± 0.19 0.779± 0.012010213...... 0.593± 0.03 1.239± 0.028 −2.172± 0.023 0.39± 0.08 0.091± 0.009010225...... 2.003± 0.122 0.403± 0.059 −0.173± 0.08 1.5± 0.3 1010326...... 2.341± 0.111 −0.264± 0.106 0.518± 0.115 4.85± 1.47 0.552± 0.049010612...... 3.306± 0.168 0.916± 0.095 1.457± 0.11 9.22± 2.2 0.61± 0.052010613...... 1.891± 0.087 1.952± 0.034 0.711± 0.12 1.42± 0.28 0.173± 0.016010629...... 1.938± 0.06 0.925± 0.053 0.357± 0.054 1.86± 0.49 0.228± 0.029010921...... 2.128± 0.053 1.177± 0.014 −0.076± 0.028 1.18± 0.01 0.104± 0.001010928...... 3.293± 0.073 0.841± 0.048 1.814± 0.12 9.23± 1.43 0.406± 0.027011019...... 1.525± 0.178 1.168± 0.089 −1.324± 0.123 0.65± 0.34 0.63± 0.038011130...... 0.43± 0.162 0.958± 0.068 −2.26± 0.06 0.19± 0.05 0.705± 0.038011212...... 0.471± 0.177 1.476± 0.063 −1.703± 0.061 0.38± 0.16 0.679± 0.028020124...... 2.531± 0.053 1.086± 0.008 1.999± 0.083 5.58± 0.06 0.532± 0.005020127...... 2.481± 0.082 0.399± 0.032 0.553± 0.059 3.45± 0.38 0.376± 0.016020305...... 2.995± 0.17 1.118± 0.058 1.22± 0.107 4.11± 0.91 0.367± 0.03020317...... 1.98± 0.093 0.36± 0.06 0.23± 0.185 2.59± 0.41 0.727± 0.016020331...... 2.48± 0.077 1.755± 0.057 1.189± 0.073 3.83± 0.74 0.455± 0.032020625...... 1.141± 0.135 0.991± 0.096 −1.498± 0.126 0.53± 0.29 0.671± 0.035020801...... 2.054± 0.129 2.339± 0.117 1.241± 0.222 1.68± 0.85 0.507± 0.049020812...... 2.752± 0.182 0.606± 0.103 1.063± 0.121 4.78± 1.39 0.716± 0.035020813...... 2.773± 0.042 1.588± 0.002 1.982± 0.016 3.8± 0.03 0.169± 0.002020819...... 1.858± 0.079 1.304± 0.067 −0.251± 0.076 0.96± 0.02 0.124± 0.002021004...... 2.492± 0.104 1.17± 0.013 0.754± 0.087 3.1± 0.02 0.655± 0.006021016...... 3.037± 0.17 1.358± 0.115 1.517± 0.096 5.01± 1.83 0.451± 0.064021021...... 1.56± 0.16 0.961± 0.102 −0.751± 0.143 1.08± 0.3 0.927± 0.009021104...... 1.84± 0.109 1.002± 0.06 0.097± 0.116 1.25± 0.21 0.77± 0.012021112...... 2.517± 0.148 −0.216± 0.137 0.482± 0.168 4.74± 1.22 0.875± 0.015021211...... 1.977± 0.03 0.321± 0.015 0.348± 0.043 2.93± 0.02 0.149± 0.002030115...... 2.484± 0.094 0.802± 0.043 0.592± 0.03 4.04± 0.11 0.436± 0.006030226...... 2.481± 0.053 1.409± 0.014 0.923± 0.065 2.9± 0.03 0.556± 0.004030324...... 3.237± 0.255 0.374± 0.097 0.847± 0.035 6.05± 1.26 0.586± 0.032030328...... 2.515± 0.029 1.739± 0.005 1.381± 0.013 4.08± 0.02 0.226± 0.001030329...... 1.915± 0.008 1.345± 0.004 0.03± 0.008 1.16± 0.00 0.007± 0.000030416...... 0.295± 0.173 1.1± 0.042 −2.501± 0.139 0.21± 0.03 0.228± 0.01030418...... 2.309± 0.147 1.558± 0.113 1.175± 0.055 3.19± 1.07 0.906± 0.015030429...... 2.122± 0.069 0.554± 0.054 0.54± 0.049 3.39± 0.02 0.718± 0.004030519...... 2.409± 0.036 0.841± 0.018 1.21± 0.067 3.74± 0.29 0.075± 0.005030528...... 1.753± 0.043 1.549± 0.02 0.483± 0.035 1.34± 0.01 0.307± 0.003030723...... 0.793± 0.279 0.795± 0.045 −1.258± 0.105 0.6± 0.09 0.802± 0.013030725...... 2.282± 0.045 1.965± 0.036 0.752± 0.016 2.6± 0.33 0.132± 0.012030821...... 2.372± 0.063 0.845± 0.048 0.719± 0.058 3± 0.53 0.447± 0.024030823...... 1.717± 0.071 1.439± 0.043 0.101± 0.054 1.14± 0.23 0.53± 0.022030824...... 0.74± 0.17 0.915± 0.041 −1.659± 0.089 0.29± 0.1 0.551± 0.03030913...... 2.996± 0.147 −0.012± 0.137 1.023± 0.189 8.19± 2.21 0.772± 0.032031026...... 3.595± 0.234 0.947± 0.093 2.178± 0.136 6.89± 1.69 0.969± 0.004031109A...... 2.564± 0.044 1.47± 0.024 1.02± 0.025 2.93± 0.38 0.129± 0.011031109B...... 2.231± 0.174 2.145± 0.129 0.664± 0.099 3.09± 1.18 0.94± 0.01031111A...... 3.116± 0.045 0.402± 0.037 1.288± 0.053 10.51± 1.17 0.182± 0.018031111B...... 0.752± 0.272 1.359± 0.027 −1.808± 0.14 0.19± 0.05 1031203...... 2.683± 0.074 0.517± 0.057 1.661± 0.057 6.63± 1.31 0.26± 0.034031220...... 2.204± 0.19 0.585± 0.117 0.013± 0.062 2.08± 0.82 0.64± 0.048040319...... 2.183± 0.129 0.37± 0.124 0.5± 0.13 2.9± 1.31 0.421± 0.062040423...... 1.845± 0.085 1.314± 0.078 0.607± 0.102 1.8± 0.58 0.507± 0.041040425...... 3.001± 0.064 1.634± 0.038 1.307± 0.07 2.73± 0.35 0.739± 0.009040511...... 2.421± 0.062 1.22± 0.05 1.255± 0.076 3.46± 0.63 0.366± 0.03040701...... 0.405± 0.146 0.955± 0.122 −2.096± 0.074 0.3± 0.01 0.384± 0.013040709...... 2.15± 0.051 1.618± 0.041 0.898± 0.035 2.49± 0.5 0.182± 0.021040802...... 2.43± 0.077 0.033± 0.062 0.955± 0.115 3.74± 0.79 0.358± 0.036

20 Pelangeonet al.: Intrinsic properties of a complete sample ofHETE-2GRBs
Table 3. (continued)
GRB logEintrpeak log T intr
90,B log Eiso,52 zmax V/Vmax
040825A...... 2.056± 0.133 1.287± 0.068 −0.088± 0.069 1.17± 0.35 0.772± 0.02040825B...... 1.942± 0.123 0.701± 0.098 0.698± 0.039 2.49± 0.52 0.838± 0.014040912A...... 1.247± 0.095 0.851± 0.064 −0.782± 0.24 0.61± 0.36 0.162± 0.043040912B...... 1.62± 0.194 1.68± 0.015 0.327± 0.131 1.82± 0.01 0.754± 0.007040916...... 0.465± 0.163 2.401± 0.052 −1.329± 0.052 0.42± 0.18 0.856± 0.028040924...... 1.88± 0.014 0.259± 0.006 0.292± 0.029 2.5± 0.02 0.129± 0.001041004...... 1.938± 0.059 1.504± 0.037 0.632± 0.235 1.13± 0.25 0.213± 0.019041006...... 1.915± 0.016 1.11± 0.004 0.219± 0.013 2.37± 0.02 0.092± 0.001041016...... 3.263± 0.288 0.689± 0.096 1.64± 0.243 4.95± 1.35 0.7± 0.031041127...... 1.809± 0.091 1.417± 0.067 0.458± 0.08 1.53± 0.49 0.341± 0.038041211...... 2.804± 0.188 1.42± 0.054 1.496± 0.263 8.66± 1.5 0.389± 0.029050123...... 2.013± 0.092 0.765± 0.085 0.434± 0.142 2.73± 0.86 0.395± 0.045050209...... 3.311± 0.274 0.669± 0.111 1.2± 0.212 4.24± 1.36 0.663± 0.043050408...... 1.778± 0.083 1.103± 0.005 0.537± 0.007 2.68± 0.01 0.261± 0.002050509...... 1.104± 0.345 1.12± 0.095 −0.836± 0.125 0.64± 0.28 0.807± 0.026050729...... 2.455± 0.084 0.172± 0.059 1.515± 0.214 4.87± 0.86 0.447± 0.026050807...... 2.25± 0.224 0.781± 0.117 0.15± 0.117 1.14± 0.67 0.411± 0.066050922...... 2.656± 0.073 0.285± 0.062 0.742± 0.132 4.59± 0.08 0.378± 0.007051021...... 2.386± 0.067 1.184± 0.053 0.685± 0.061 3.04± 0.65 0.289± 0.028051022...... 2.585± 0.022 1.995± 0.012 1.356± 0.014 3.71± 0.05 0.065± 0.001051028...... 3.103± 0.152 0.509± 0.1 1.273± 0.125 6.72± 2.05 0.522± 0.049051211...... 2.862± 0.101 −0.076± 0.085 2.24± 0.377 7.71± 1.85 0.652± 0.035060115...... 2.397± 0.056 0.91± 0.025 1.096± 0.065 4.63± 0.46 0.203± 0.014060121...... 2.526± 0.043 −0.045± 0.033 1.499± 0.069 5.37± 0.62 0.253± 0.018