intro macroeconomics
TRANSCRIPT

Intro Intro Macroeconomics Macroeconomics
Final Final Paper/ProjectPaper/ProjectNancy SokNancy Sok
Economics 1AEconomics 1A
Summer 2011 – Joel BeutelSummer 2011 – Joel Beutel

IntroductionIntroduction
The following four slides will show The following four slides will show the United States information the United States information regarding about their economic regarding about their economic records. For instance, the GDP, the records. For instance, the GDP, the employment rate, labor force and employment rate, labor force and many more. many more.
The United States of The United States of AmericaAmerica
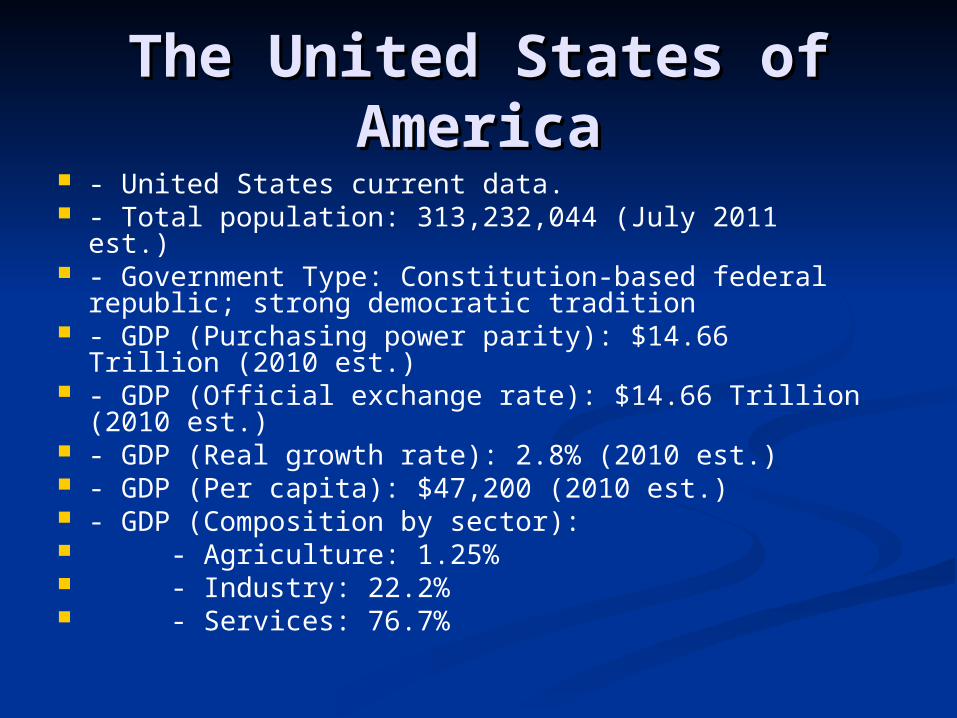
- United States current data. - Total population: 313,232,044 (July 2011 est.) - Government Type: Constitution-based federal
republic; strong democratic tradition - GDP (Purchasing power parity): $14.66 Trillion
(2010 est.) - GDP (Official exchange rate): $14.66 Trillion
(2010 est.) - GDP (Real growth rate): 2.8% (2010 est.) - GDP (Per capita): $47,200 (2010 est.) - GDP (Composition by sector): - Agriculture: 1.25% - Industry: 22.2% - Services: 76.7%
The United States of The United States of AmericaAmerica
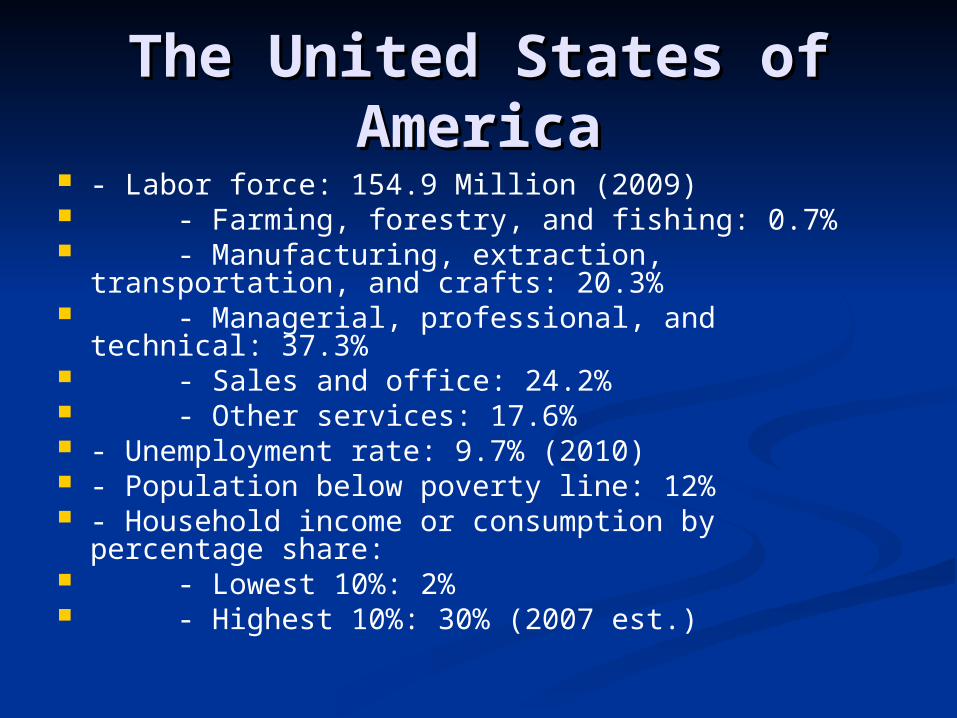
- Labor force: 154.9 Million (2009) - Farming, forestry, and fishing: 0.7% - Manufacturing, extraction, transportation,
and crafts: 20.3% - Managerial, professional, and technical:
37.3% - Sales and office: 24.2% - Other services: 17.6% - Unemployment rate: 9.7% (2010) - Population below poverty line: 12% - Household income or consumption by percentage
share: - Lowest 10%: 2% - Highest 10%: 30% (2007 est.)
The United States of The United States of AmericaAmerica
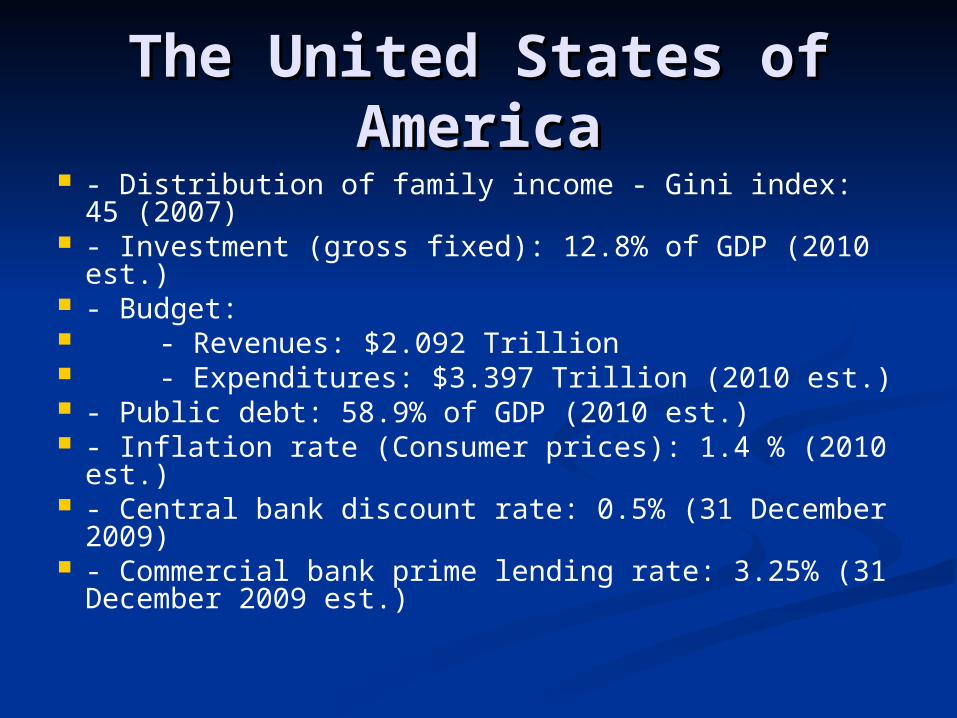
- Distribution of family income - Gini index: 45 (2007)
- Investment (gross fixed): 12.8% of GDP (2010 est.)
- Budget: - Revenues: $2.092 Trillion - Expenditures: $3.397 Trillion (2010 est.) - Public debt: 58.9% of GDP (2010 est.) - Inflation rate (Consumer prices): 1.4 % (2010
est.) - Central bank discount rate: 0.5% (31 December
2009) - Commercial bank prime lending rate: 3.25% (31
December 2009 est.)
The United States of The United States of AmericaAmerica
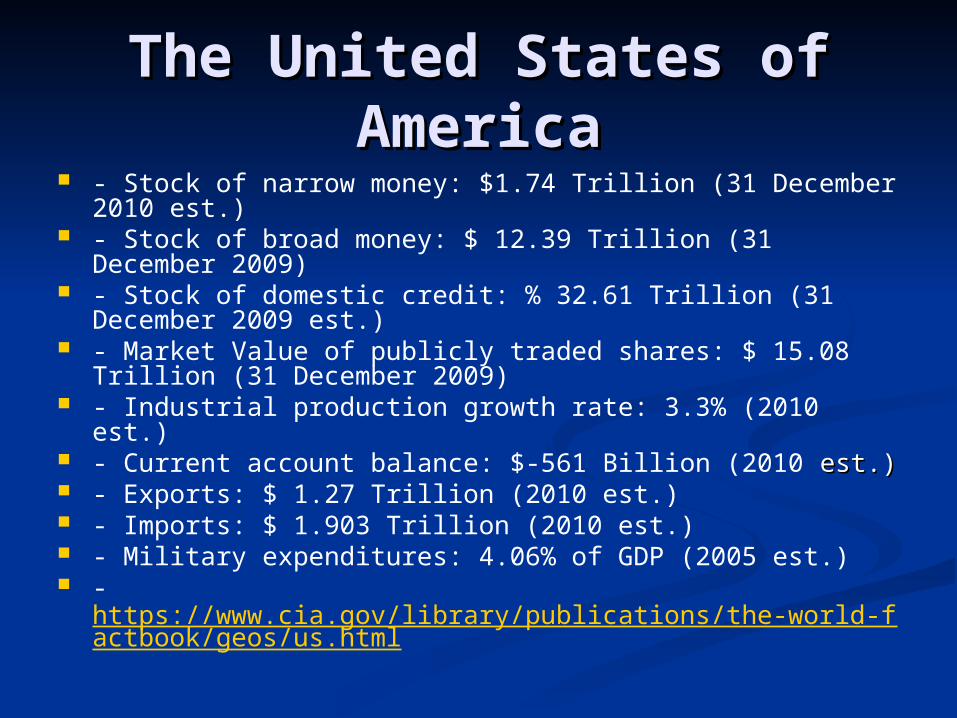
- Stock of narrow money: $1.74 Trillion (31 December 2010 est.)
- Stock of broad money: $ 12.39 Trillion (31 December 2009)
- Stock of domestic credit: % 32.61 Trillion (31 December 2009 est.)
- Market Value of publicly traded shares: $ 15.08 Trillion (31 December 2009)
- Industrial production growth rate: 3.3% (2010 est.) - Current account balance: $-561 Billion (2010 est.) est.) - Exports: $ 1.27 Trillion (2010 est.) - Imports: $ 1.903 Trillion (2010 est.) - Military expenditures: 4.06% of GDP (2005 est.) -
https://www.cia.gov/library/publications/the-world-factbook/geos/us.html
The United States The United States compared to Cambodiacompared to Cambodia
The United States statistics in the The United States statistics in the economy is probably considered economy is probably considered excellent among other countries such excellent among other countries such as Cambodia. My parents are from as Cambodia. My parents are from Cambodia, that’s why I choose to Cambodia, that’s why I choose to compare U.S with Cambodia. The compare U.S with Cambodia. The following slides will show Cambodia following slides will show Cambodia statistics in their economy such as GDP, statistics in their economy such as GDP, employment rate, exports and imports employment rate, exports and imports and many more. and many more.
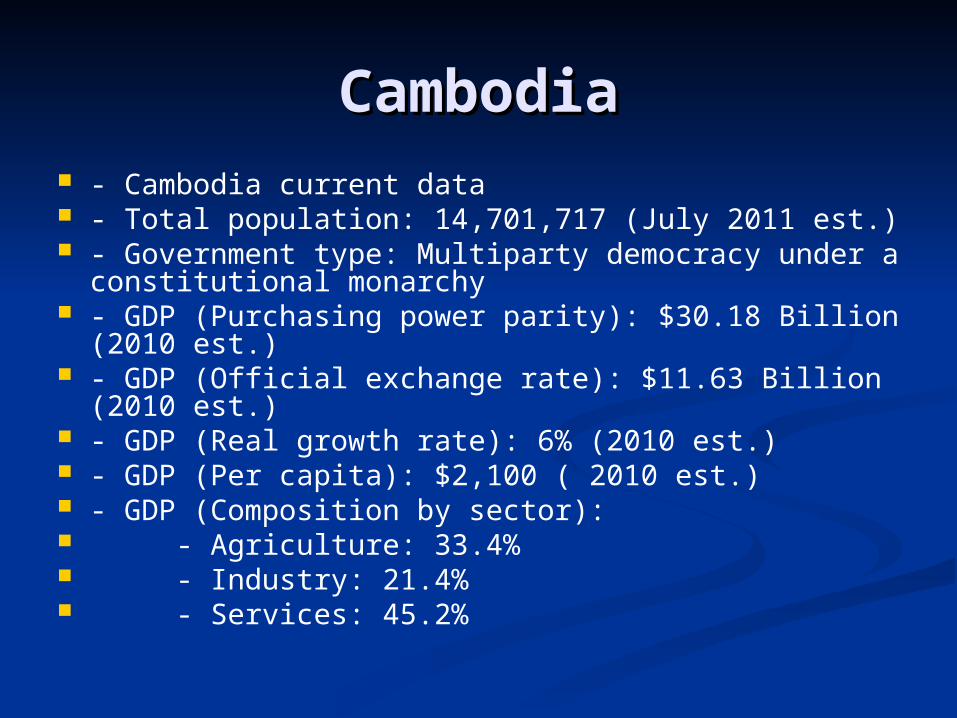
CambodiaCambodia - Cambodia current data - Total population: 14,701,717 (July 2011 est.) - Government type: Multiparty democracy under a
constitutional monarchy - GDP (Purchasing power parity): $30.18 Billion
(2010 est.) - GDP (Official exchange rate): $11.63 Billion (2010
est.) - GDP (Real growth rate): 6% (2010 est.) - GDP (Per capita): $2,100 ( 2010 est.) - GDP (Composition by sector): - Agriculture: 33.4% - Industry: 21.4% - Services: 45.2%
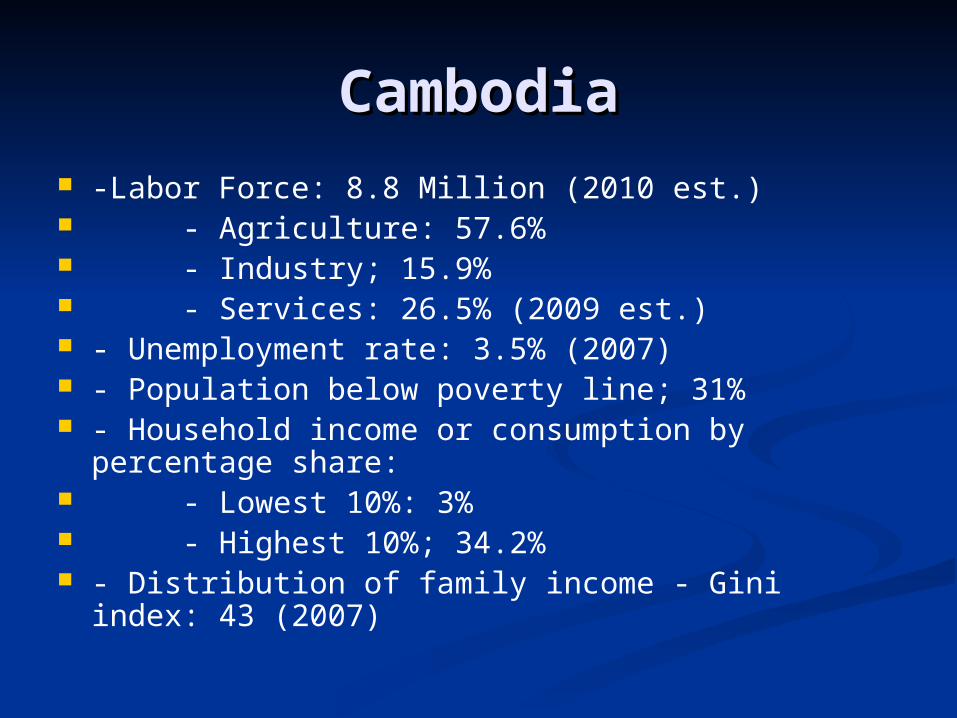
CambodiaCambodia -Labor Force: 8.8 Million (2010 est.) - Agriculture: 57.6% - Industry; 15.9% - Services: 26.5% (2009 est.) - Unemployment rate: 3.5% (2007) - Population below poverty line; 31% - Household income or consumption by
percentage share: - Lowest 10%: 3% - Highest 10%; 34.2% - Distribution of family income - Gini index: 43
(2007)
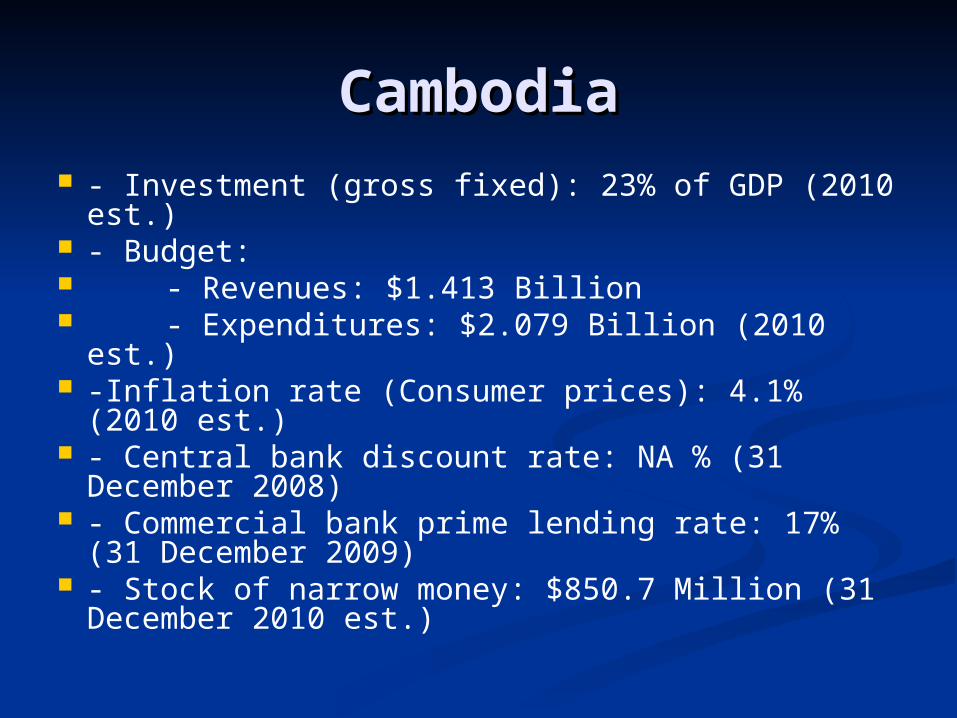
CambodiaCambodia - Investment (gross fixed): 23% of GDP (2010
est.) - Budget: - Revenues: $1.413 Billion - Expenditures: $2.079 Billion (2010 est.) -Inflation rate (Consumer prices): 4.1% (2010
est.) - Central bank discount rate: NA % (31
December 2008) - Commercial bank prime lending rate: 17%
(31 December 2009) - Stock of narrow money: $850.7 Million (31
December 2010 est.)
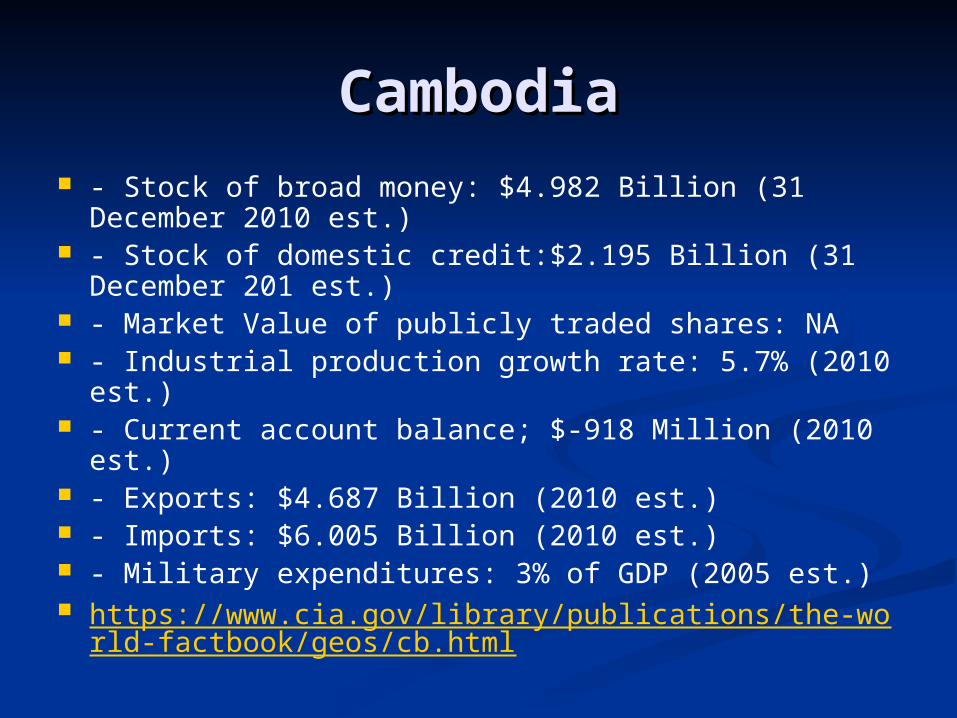
CambodiaCambodia - Stock of broad money: $4.982 Billion (31
December 2010 est.) - Stock of domestic credit:$2.195 Billion (31
December 201 est.) - Market Value of publicly traded shares: NA - Industrial production growth rate: 5.7% (2010
est.) - Current account balance; $-918 Million (2010 est.) - Exports: $4.687 Billion (2010 est.) - Imports: $6.005 Billion (2010 est.) - Military expenditures: 3% of GDP (2005 est.) https://www.cia.gov/library/publications/the-world-f
actbook/geos/cb.html
What is ahead…What is ahead…
The following slides are the The following slides are the comparison between the United comparison between the United States and Cambodia. You will see the States and Cambodia. You will see the real real GDP growth, GDP (PPP) share of world, GDP per capita (PPP), GDP purchasing power parity, GNI (Gross National Income), unemployment rate, inflation, industrial production growth, imports and exports.
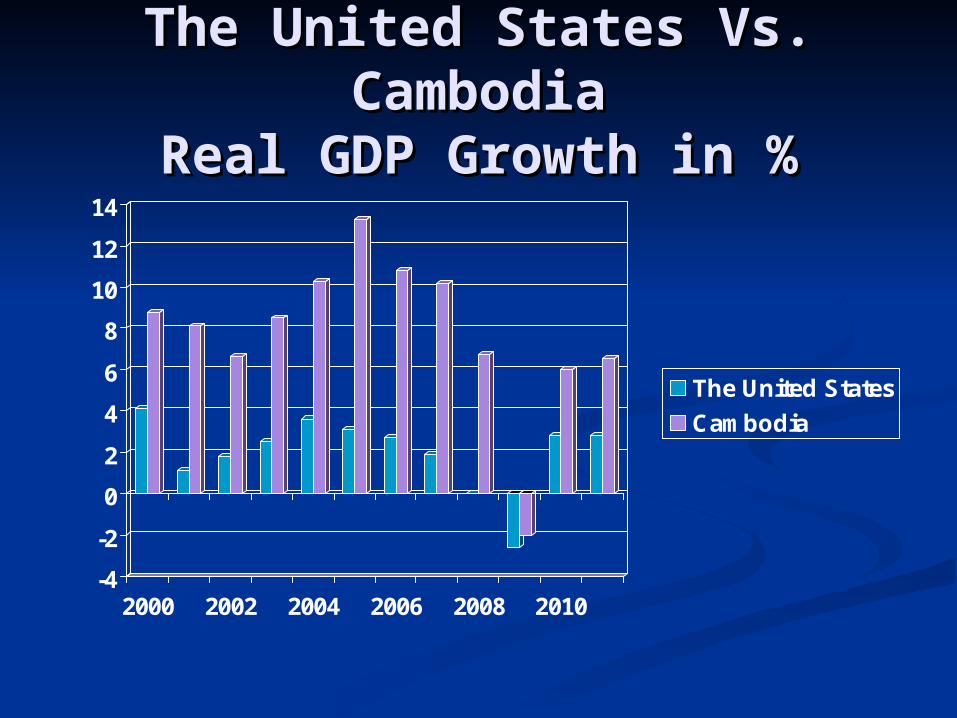
The United States Vs. The United States Vs. CambodiaCambodia
Real GDP Growth in %Real GDP Growth in %
-4
-2
0
2
4
6
8
10
12
14
2000 2002 2004 2006 2008 2010
The United States
Cambodia
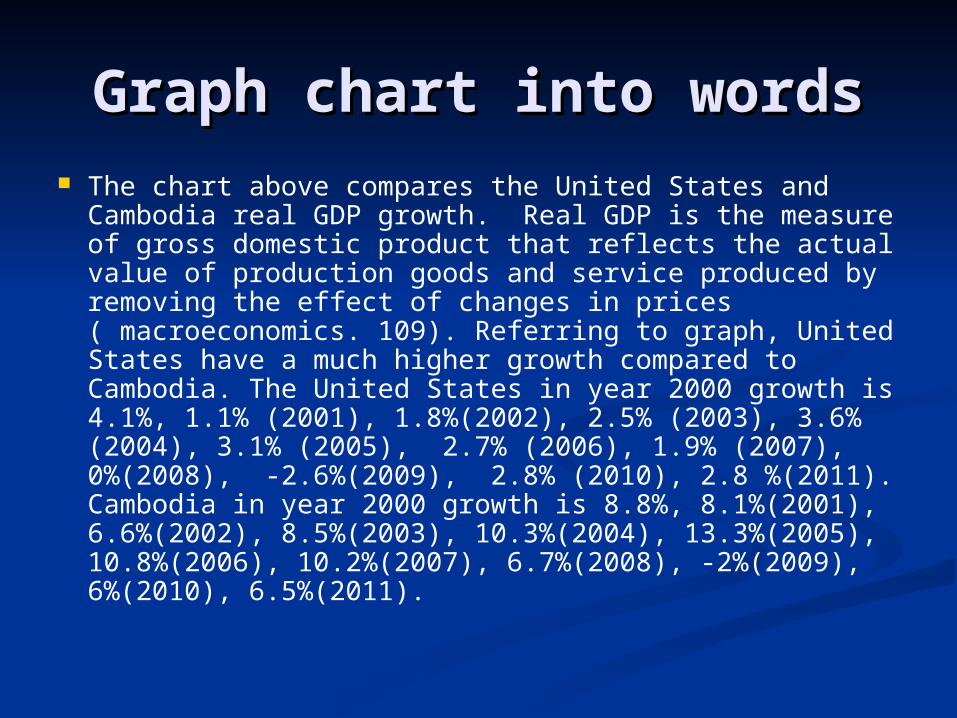
Graph chart into wordsGraph chart into words The chart above compares the United States and
Cambodia real GDP growth. Real GDP is the measure of gross domestic product that reflects the actual value of production goods and service produced by removing the effect of changes in prices ( macroeconomics. 109). Referring to graph, United States have a much higher growth compared to Cambodia. The United States in year 2000 growth is 4.1%, 1.1% (2001), 1.8%(2002), 2.5% (2003), 3.6% (2004), 3.1% (2005), 2.7% (2006), 1.9% (2007), 0%(2008), -2.6%(2009), 2.8% (2010), 2.8 %(2011). Cambodia in year 2000 growth is 8.8%, 8.1%(2001), 6.6%(2002), 8.5%(2003), 10.3%(2004), 13.3%(2005), 10.8%(2006), 10.2%(2007), 6.7%(2008), -2%(2009), 6%(2010), 6.5%(2011).
SourcesSources
The United States Real GDP growth The United States Real GDP growth source: (source: (http://www.gfmag.com/gdp-data-couhttp://www.gfmag.com/gdp-data-country-reports/151-the-united-states-gdntry-reports/151-the-united-states-gdp-country-report.html#axzz1QXDMap-country-report.html#axzz1QXDMaLzwLzw))
Cambodia Real GDP growth source: Cambodia Real GDP growth source: ((http://www.gfmag.com/gdp-data-couhttp://www.gfmag.com/gdp-data-country-reports/306-cambodia-gdp-counntry-reports/306-cambodia-gdp-country-report.html#axzz1Psh9z1Qitry-report.html#axzz1Psh9z1Qi))

The United States Vs. The United States Vs. CambodiaCambodia
GDP (PPP)-Share of world GDP (PPP)-Share of world total in %total in %
0
5
10
15
20
25
1980 1990 2000 2010 2015
The United States
Cambodia
Graph chart into wordsGraph chart into words
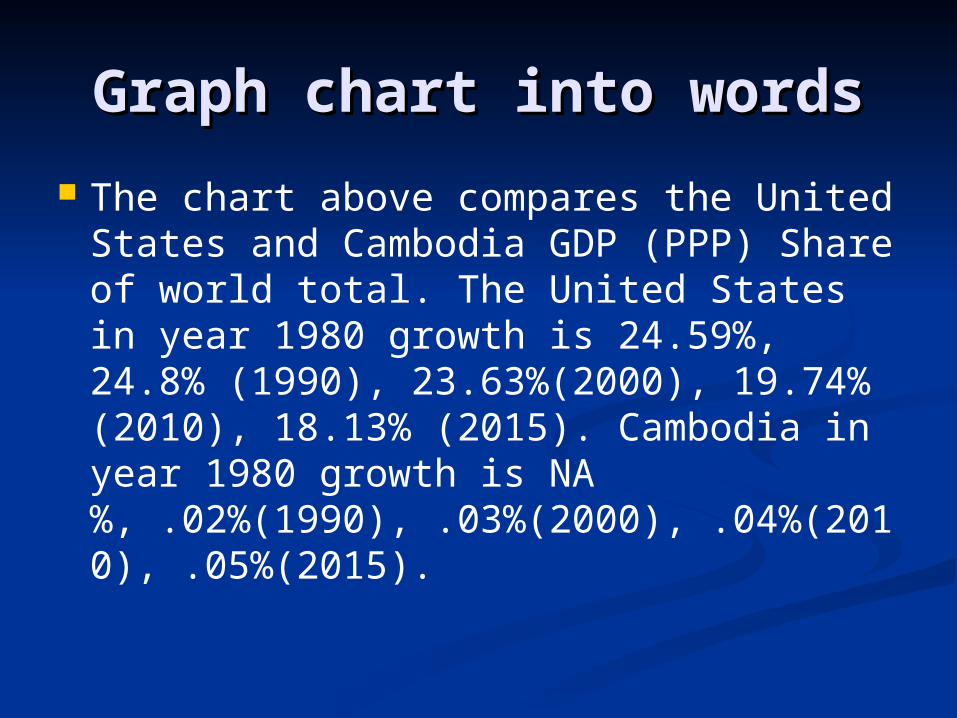
The chart above compares the United States and Cambodia GDP (PPP) Share of world total. The United States in year 1980 growth is 24.59%, 24.8% (1990), 23.63%(2000), 19.74% (2010), 18.13% (2015). Cambodia in year 1980 growth is NA%, .02%(1990), .03%(2000), .04%(2010), .05%(2015).
SourceSource
The United States GDP (PPP) source: The United States GDP (PPP) source: ((http://www.gfmag.com/gdp-data-couhttp://www.gfmag.com/gdp-data-country-reports/151-the-united-states-gdntry-reports/151-the-united-states-gdp-country-report.html#axzz1QXDMap-country-report.html#axzz1QXDMaLzwLzw))
Cambodia GDP (PPP) source: (Cambodia GDP (PPP) source: (http://www.gfmag.com/gdp-data-couhttp://www.gfmag.com/gdp-data-country-reports/306-cambodia-gdp-counntry-reports/306-cambodia-gdp-country-report.html#axzz1Psh9z1Qitry-report.html#axzz1Psh9z1Qi))
The United States Vs. The United States Vs. Cambodia GDP per capita Cambodia GDP per capita
(PPP) in US$(PPP) in US$
0
5000
10000
15000
20000
25000
30000
35000
40000
45000
50000
2000 2002 2004 2006 2008
The United States
Cambodia
Graph chart into words Graph chart into words
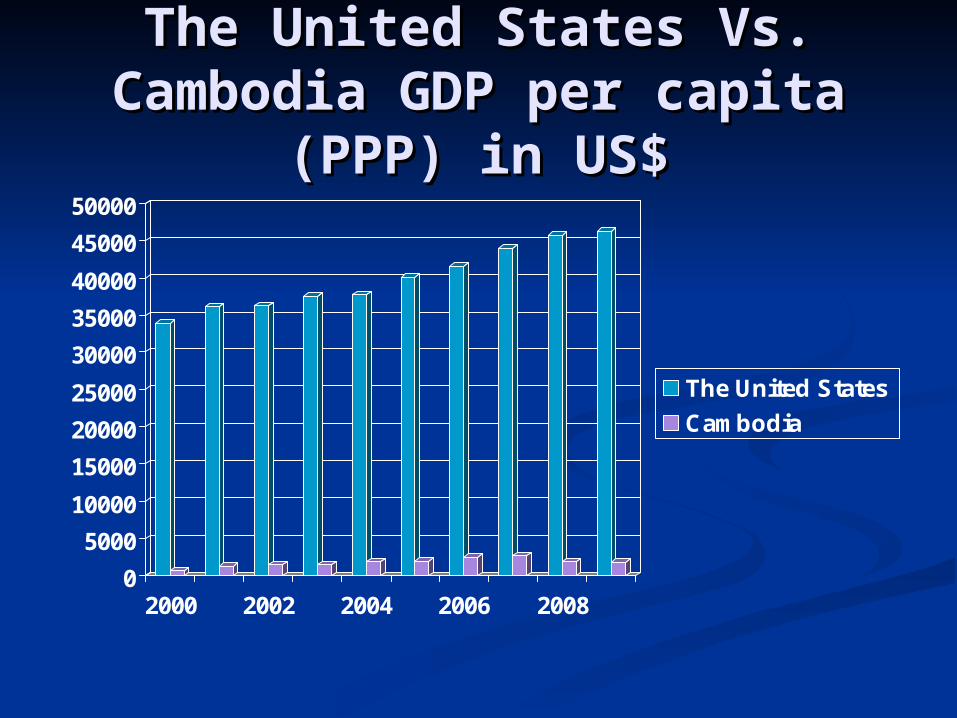
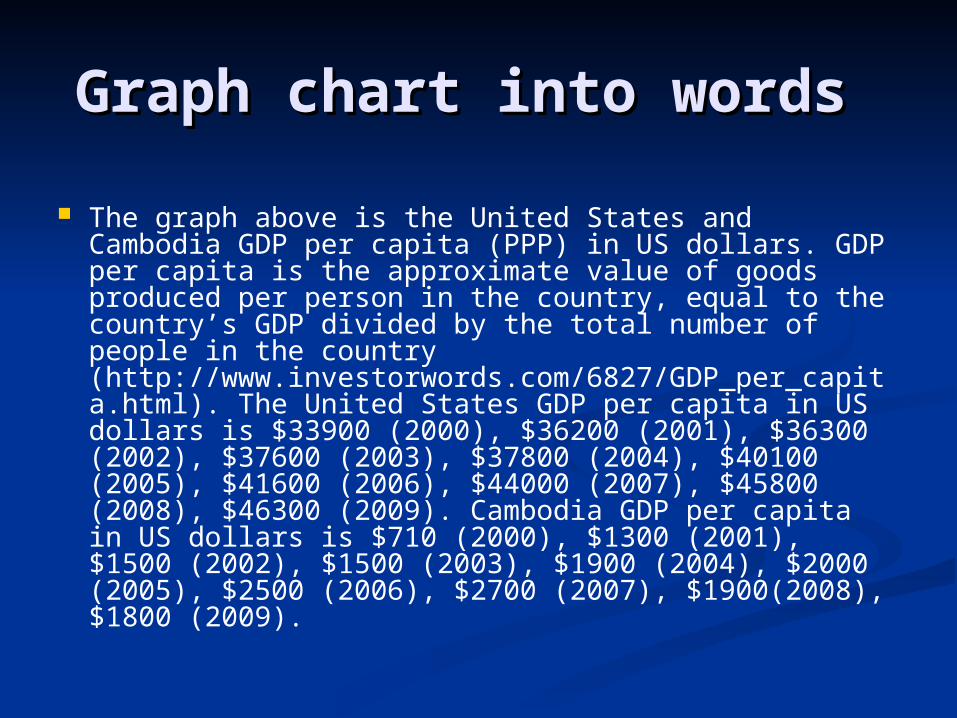
The graph above is the United States and Cambodia GDP per capita (PPP) in US dollars. GDP per capita is the approximate value of goods produced per person in the country, equal to the country’s GDP divided by the total number of people in the country (http://www.investorwords.com/6827/GDP_per_capita.html). The United States GDP per capita in US dollars is $33900 (2000), $36200 (2001), $36300 (2002), $37600 (2003), $37800 (2004), $40100 (2005), $41600 (2006), $44000 (2007), $45800 (2008), $46300 (2009). Cambodia GDP per capita in US dollars is $710 (2000), $1300 (2001), $1500 (2002), $1500 (2003), $1900 (2004), $2000 (2005), $2500 (2006), $2700 (2007), $1900(2008), $1800 (2009).
SourceSource
The United States GDP per capita The United States GDP per capita source: (source: (http://http://www.indexmundi.com/g/g.aspx?cwww.indexmundi.com/g/g.aspx?c==us&vus&v=67=67))
Cambodia GDP per capita source: (Cambodia GDP per capita source: (http://http://www.indexmundi.com/g/g.aspx?cwww.indexmundi.com/g/g.aspx?c==cb&vcb&v=67=67))
The United States Vs. The United States Vs. CambodiaCambodia
GDP (purchasing power parity) in GDP (purchasing power parity) in Billion US$Billion US$
0
2000
4000
6000
8000
10000
12000
14000
2000 2002 2004 2006 2008
The United States
Cambodia
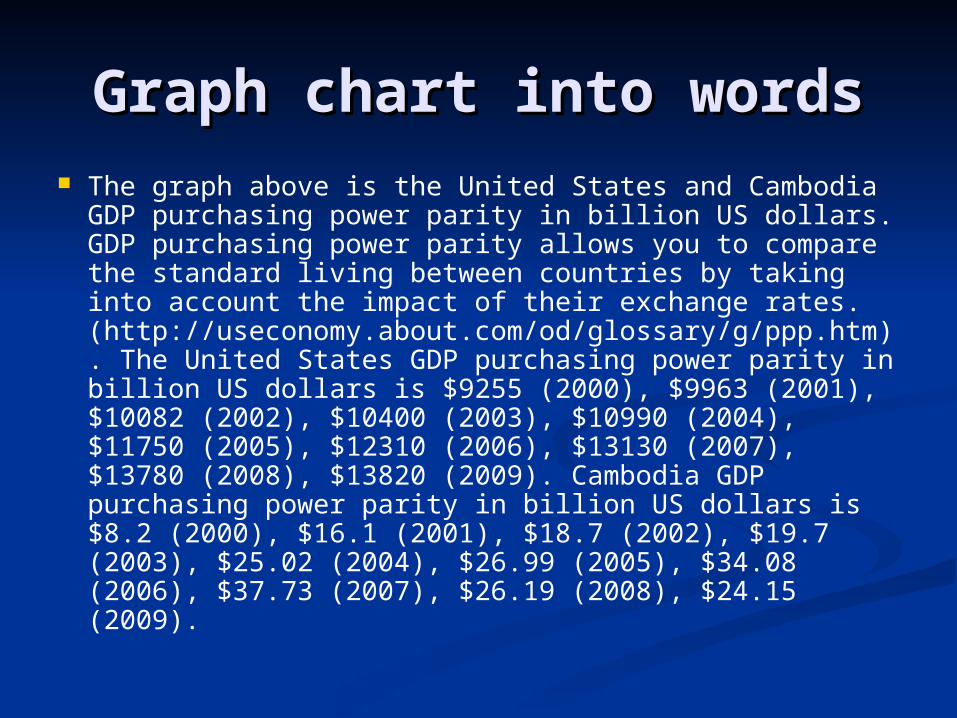
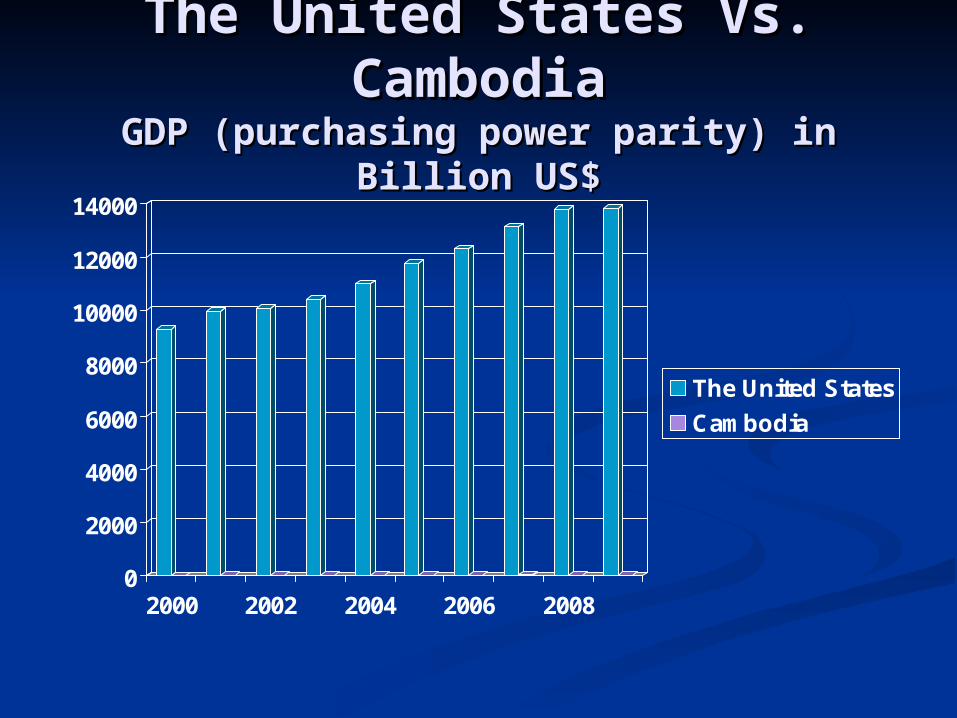
Graph chart into wordsGraph chart into words The graph above is the United States and Cambodia
GDP purchasing power parity in billion US dollars. GDP purchasing power parity allows you to compare the standard living between countries by taking into account the impact of their exchange rates. (http://useconomy.about.com/od/glossary/g/ppp.htm). The United States GDP purchasing power parity in billion US dollars is $9255 (2000), $9963 (2001), $10082 (2002), $10400 (2003), $10990 (2004), $11750 (2005), $12310 (2006), $13130 (2007), $13780 (2008), $13820 (2009). Cambodia GDP purchasing power parity in billion US dollars is $8.2 (2000), $16.1 (2001), $18.7 (2002), $19.7 (2003), $25.02 (2004), $26.99 (2005), $34.08 (2006), $37.73 (2007), $26.19 (2008), $24.15 (2009).
SourceSource
The United States GDP purchasing The United States GDP purchasing power source: (power source: (http://http://www.indexmundi.com/g/g.aspx?vwww.indexmundi.com/g/g.aspx?v=65&c==65&c=us&lus&l=en=en))
Cambodia GDP purchasing power Cambodia GDP purchasing power source: (source: (http://http://www.indexmundi.com/g/g.aspx?vwww.indexmundi.com/g/g.aspx?v=65&c==65&c=cb&lcb&l=en=en))
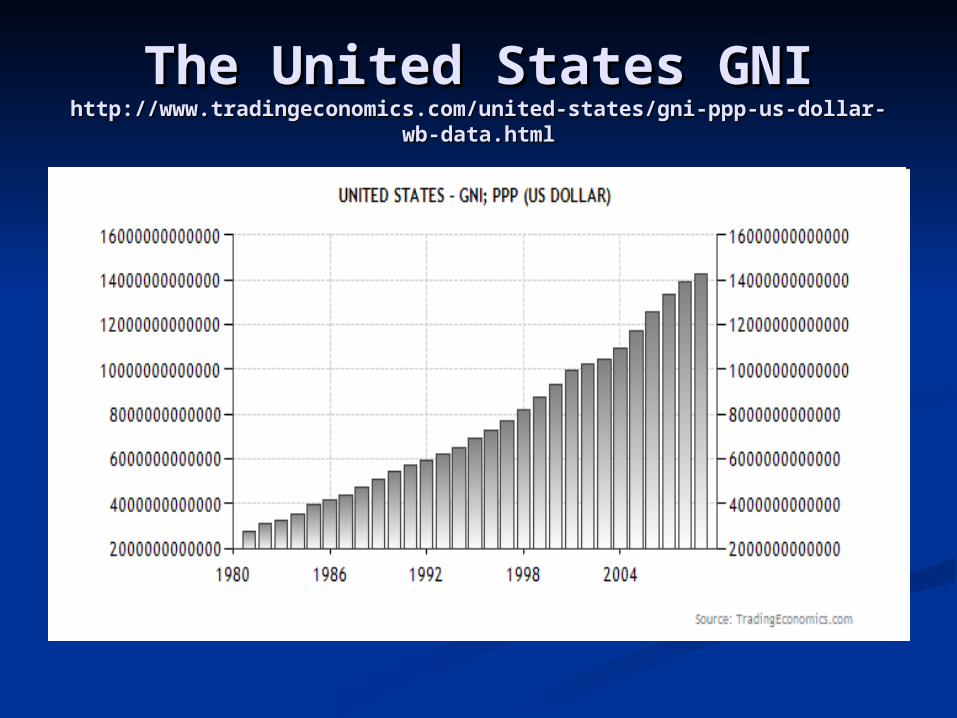
The United States GNIThe United States GNIhttp://www.tradingeconomics.com/united-states/gni-ppp-us-dollar-wb-http://www.tradingeconomics.com/united-states/gni-ppp-us-dollar-wb-
data.htmldata.html
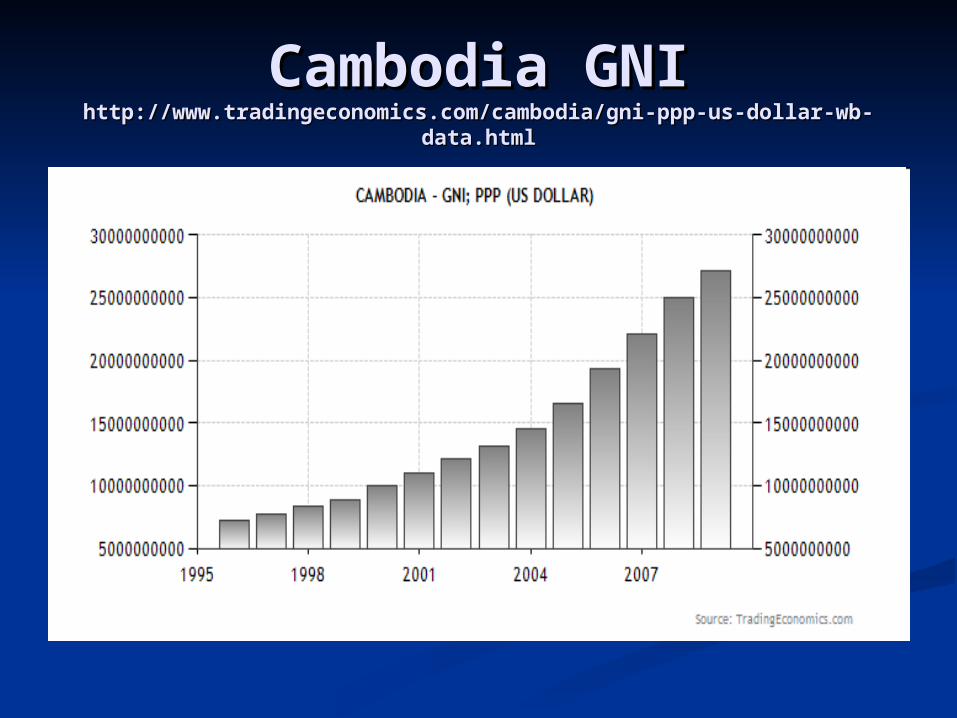
Cambodia GNICambodia GNIhttp://www.tradingeconomics.com/cambodia/gni-ppp-us-dollar-wb-http://www.tradingeconomics.com/cambodia/gni-ppp-us-dollar-wb-
data.htmldata.html

Graph chart into wordsGraph chart into words
The graph above is the United States and Cambodia GNI. Gross national income is measure all domestic incomes earned in production (macroeconomics 106). The United States continue to increase from 1980 starting at 25000000000 in US dollars to 14000000000000 in US dollars. Cambodia continue to increase from 1995 starting at 550000000 in US dollars to 26000000000 in US dollars.
The United States Vs. The United States Vs. CambodiaCambodia
Unemployment Rate in %Unemployment Rate in %
0
1
2
3
4
5
6
7
8
9
10
2000 2002 2004 2006 2008 2010
The United States
Cambodia
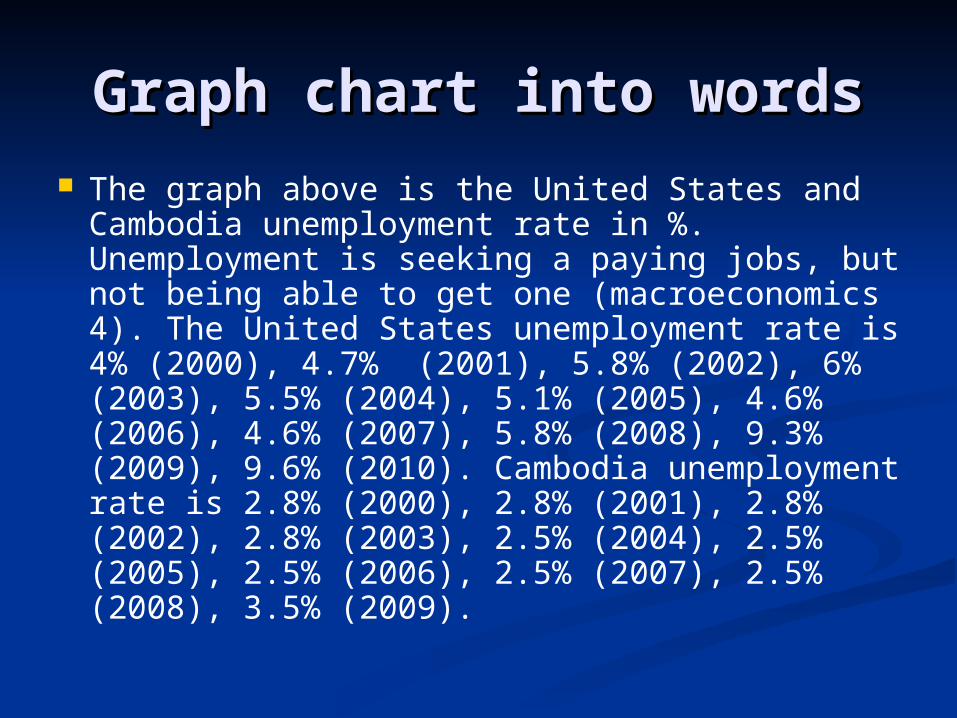
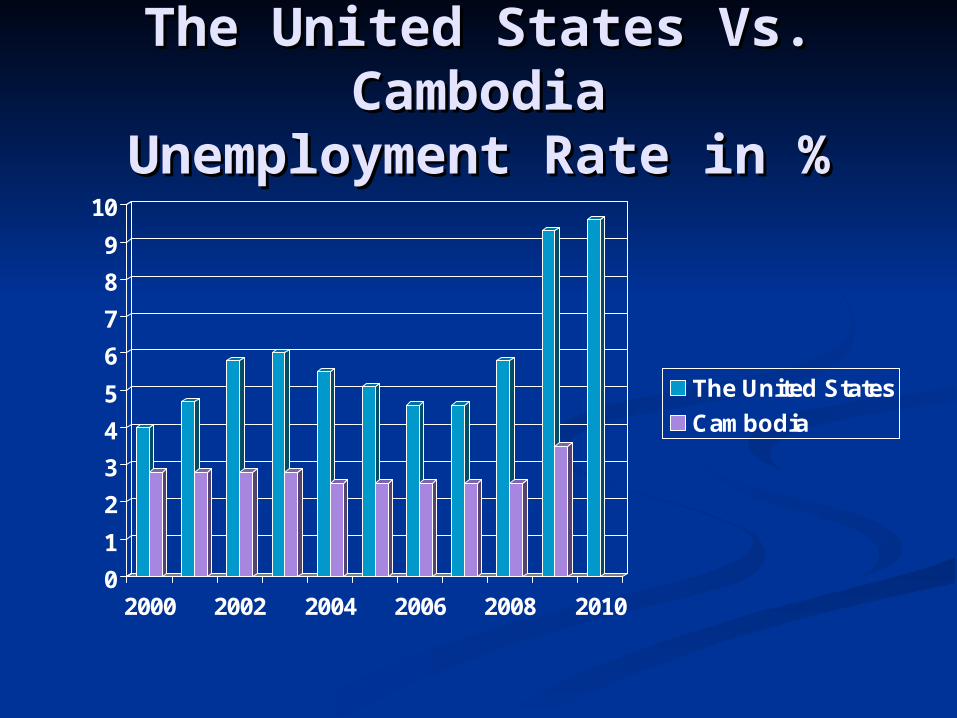
Graph chart into wordsGraph chart into words The graph above is the United States and
Cambodia unemployment rate in %. Unemployment is seeking a paying jobs, but not being able to get one (macroeconomics 4). The United States unemployment rate is 4% (2000), 4.7% (2001), 5.8% (2002), 6% (2003), 5.5% (2004), 5.1% (2005), 4.6% (2006), 4.6% (2007), 5.8% (2008), 9.3% (2009), 9.6% (2010). Cambodia unemployment rate is 2.8% (2000), 2.8% (2001), 2.8% (2002), 2.8% (2003), 2.5% (2004), 2.5% (2005), 2.5% (2006), 2.5% (2007), 2.5% (2008), 3.5% (2009).
SourceSource
The United States unemployment The United States unemployment rate source: (rate source: (http://www.infoplease.com/ipa/A010http://www.infoplease.com/ipa/A0104719.html4719.html))
Cambodia unemployment rate Cambodia unemployment rate source: (source: (http://http://www.indexmundi.com/g/g.aspx?cwww.indexmundi.com/g/g.aspx?c==cb&vcb&v=74=74))
The United States Vs. The United States Vs. CambodiaCambodia
Inflation in %Inflation in %
-5
0
5
10
15
20
25
2008 2009 2010 2011
The United States
Cambodia
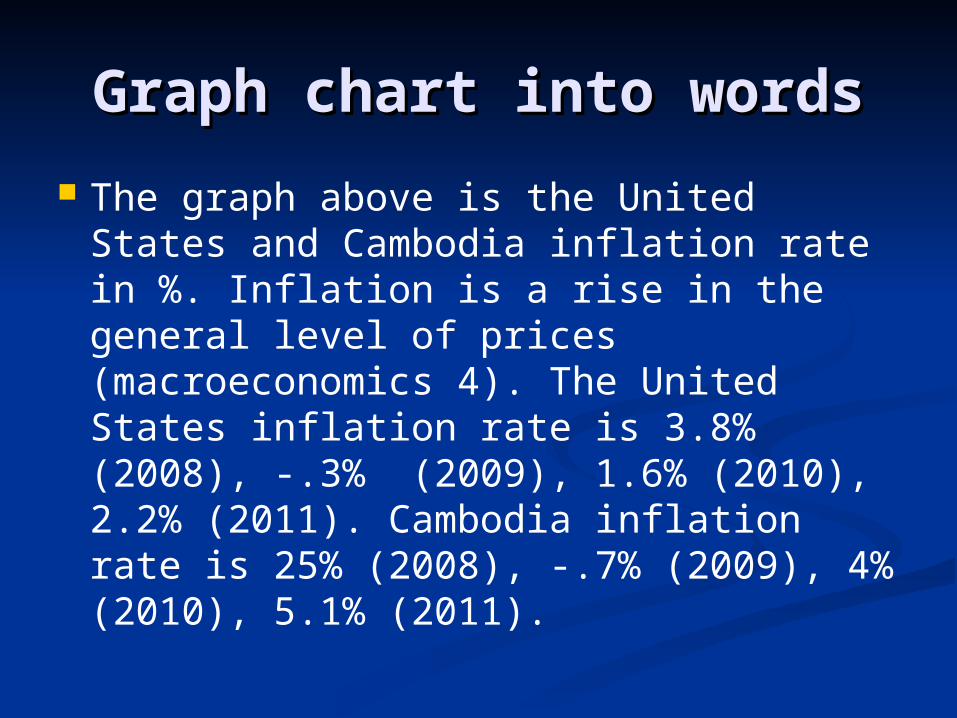
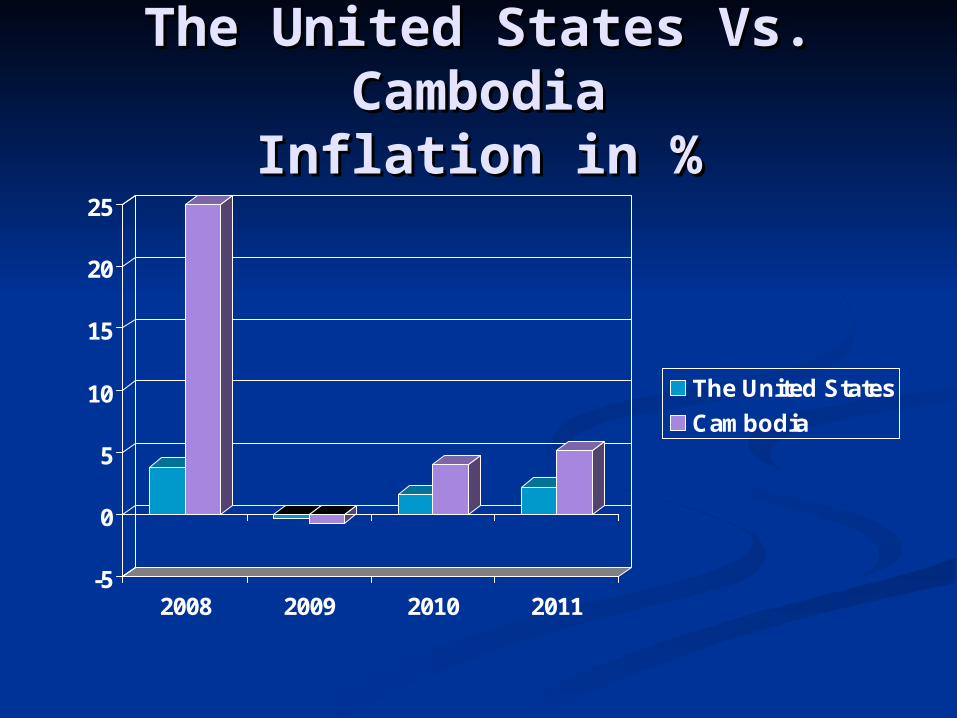
Graph chart into wordsGraph chart into words
The graph above is the United States and Cambodia inflation rate in %. Inflation is a rise in the general level of prices (macroeconomics 4). The United States inflation rate is 3.8% (2008), -.3% (2009), 1.6% (2010), 2.2% (2011). Cambodia inflation rate is 25% (2008), -.7% (2009), 4% (2010), 5.1% (2011).

SourceSource
The United States inflation source: (The United States inflation source: (http://www.gfmag.com/gdp-data-couhttp://www.gfmag.com/gdp-data-country-reports/151-the-united-states-gdntry-reports/151-the-united-states-gdp-country-report.html#axzz1QXDMap-country-report.html#axzz1QXDMaLzwLzw))
Cambodia inflation source: (Cambodia inflation source: (http://www.gfmag.com/gdp-data-couhttp://www.gfmag.com/gdp-data-country-reports/306-cambodia-gdp-counntry-reports/306-cambodia-gdp-country-report.html#axzz1Psh9z1Qitry-report.html#axzz1Psh9z1Qi))
The United States Vs. The United States Vs. Cambodia Cambodia Industrial Industrial
production growth rate in %production growth rate in %
-10
-5
0
5
10
15
20
25
2003 2005 2007 2009 2011
The United States
Cambodia
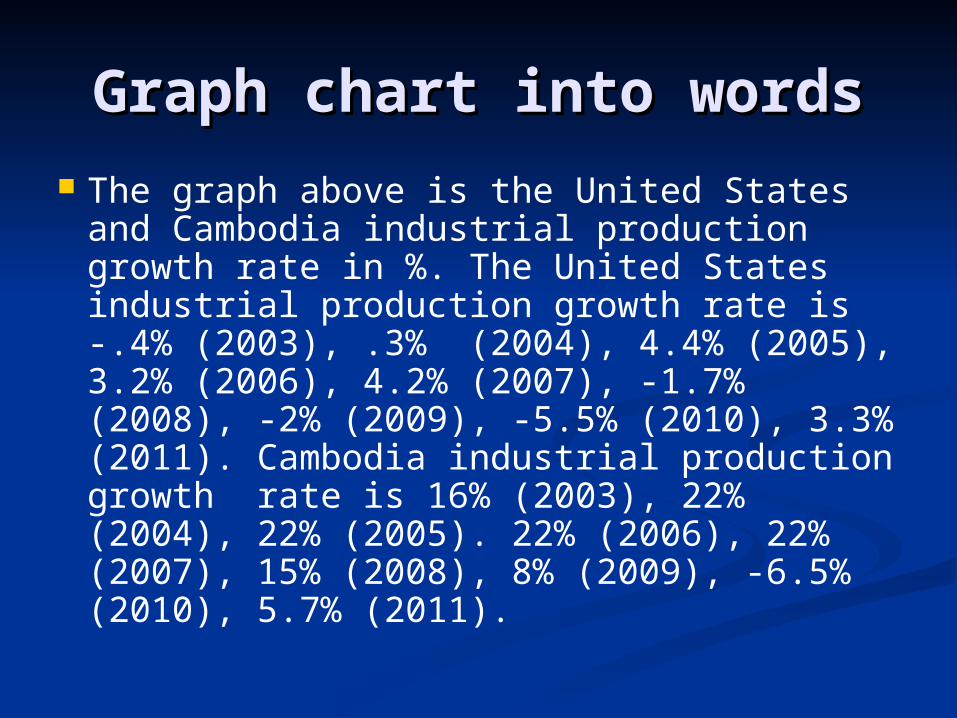
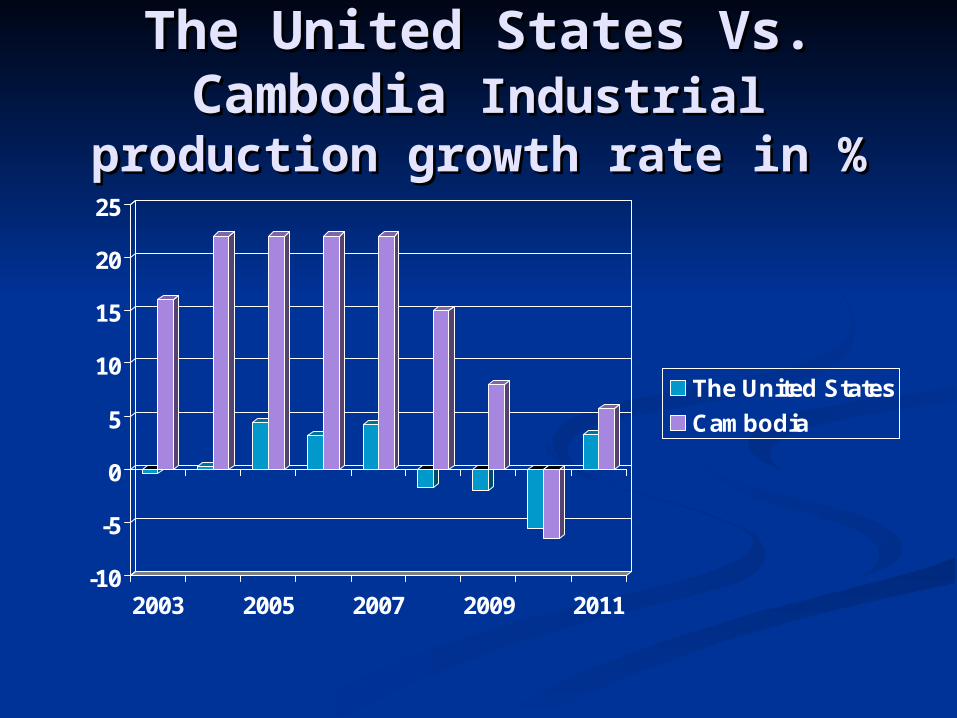
Graph chart into wordsGraph chart into words The graph above is the United States and
Cambodia industrial production growth rate in %. The United States industrial production growth rate is -.4% (2003), .3% (2004), 4.4% (2005), 3.2% (2006), 4.2% (2007), -1.7% (2008), -2% (2009), -5.5% (2010), 3.3% (2011). Cambodia industrial production growth rate is 16% (2003), 22% (2004), 22% (2005). 22% (2006), 22% (2007), 15% (2008), 8% (2009), -6.5% (2010), 5.7% (2011).
SourceSource
The United States Industrial The United States Industrial production source: (production source: (http://www.indexmundi.com/united_http://www.indexmundi.com/united_states/industrial_production_growth_states/industrial_production_growth_rate.htmlrate.html))
Cambodia Industrial production Cambodia Industrial production source: (source: (http://www.indexmundi.com/cambodhttp://www.indexmundi.com/cambodia/industrial_production_growth_rateia/industrial_production_growth_rate.html.html))
The United States Vs. The United States Vs. CambodiaCambodia
Imports (Billion $)Imports (Billion $)
0
500
1000
1500
2000
2500
2000 2002 2004 2006 2008
The United States
Cambodia
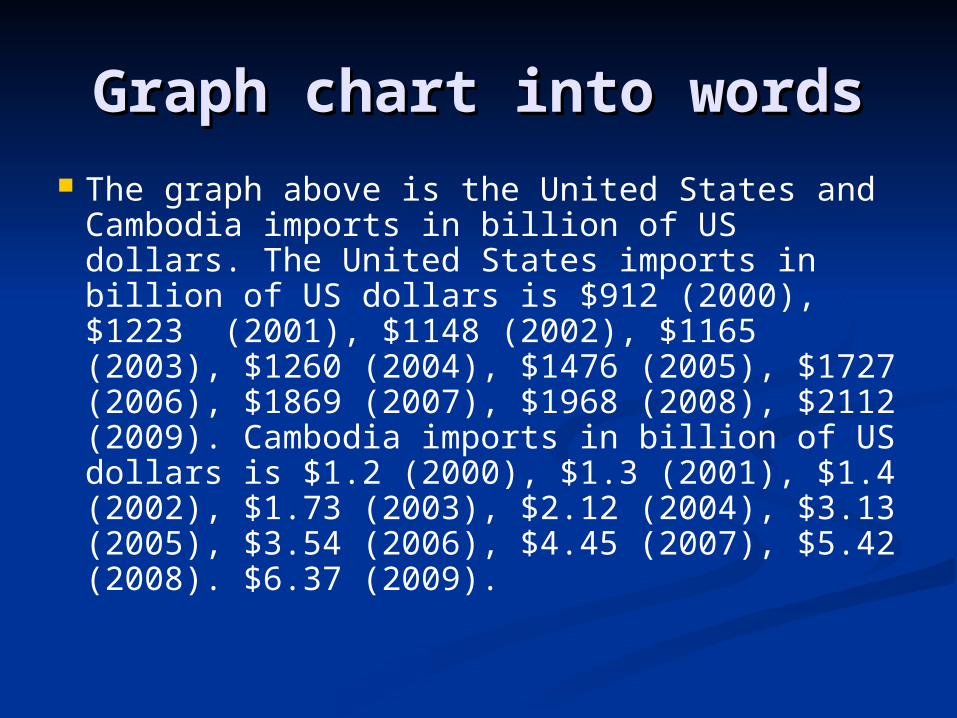
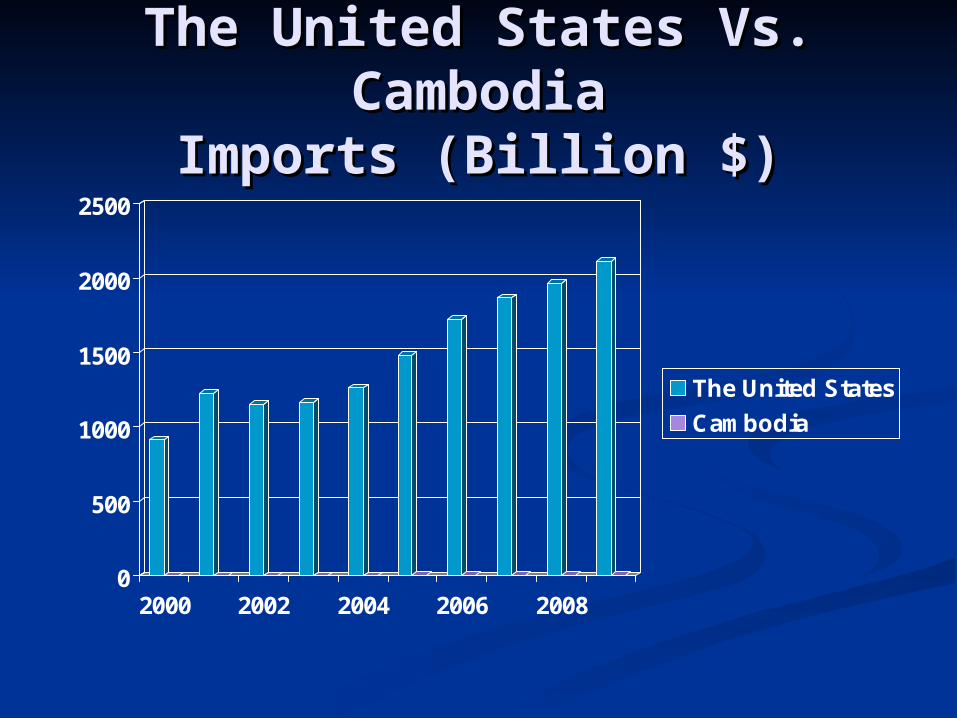
Graph chart into wordsGraph chart into words The graph above is the United States and
Cambodia imports in billion of US dollars. The United States imports in billion of US dollars is $912 (2000), $1223 (2001), $1148 (2002), $1165 (2003), $1260 (2004), $1476 (2005), $1727 (2006), $1869 (2007), $1968 (2008), $2112 (2009). Cambodia imports in billion of US dollars is $1.2 (2000), $1.3 (2001), $1.4 (2002), $1.73 (2003), $2.12 (2004), $3.13 (2005), $3.54 (2006), $4.45 (2007), $5.42 (2008). $6.37 (2009).
SourceSource
The United States import source: (The United States import source: (http://http://www.indexmundi.com/g/g.aspx?vwww.indexmundi.com/g/g.aspx?v=89&c==89&c=us&lus&l=en=en))
Cambodia import source: (Cambodia import source: (http://http://www.indexmundi.com/g/g.aspx?vwww.indexmundi.com/g/g.aspx?v=89&c==89&c=cb&lcb&l=en=en))
The United States Vs. The United States Vs. CambodiaCambodia
Exports (Billion $)Exports (Billion $)
0
200
400
600
800
1000
1200
1400
2000 2002 2004 2006 2008
The United States
Cambodia
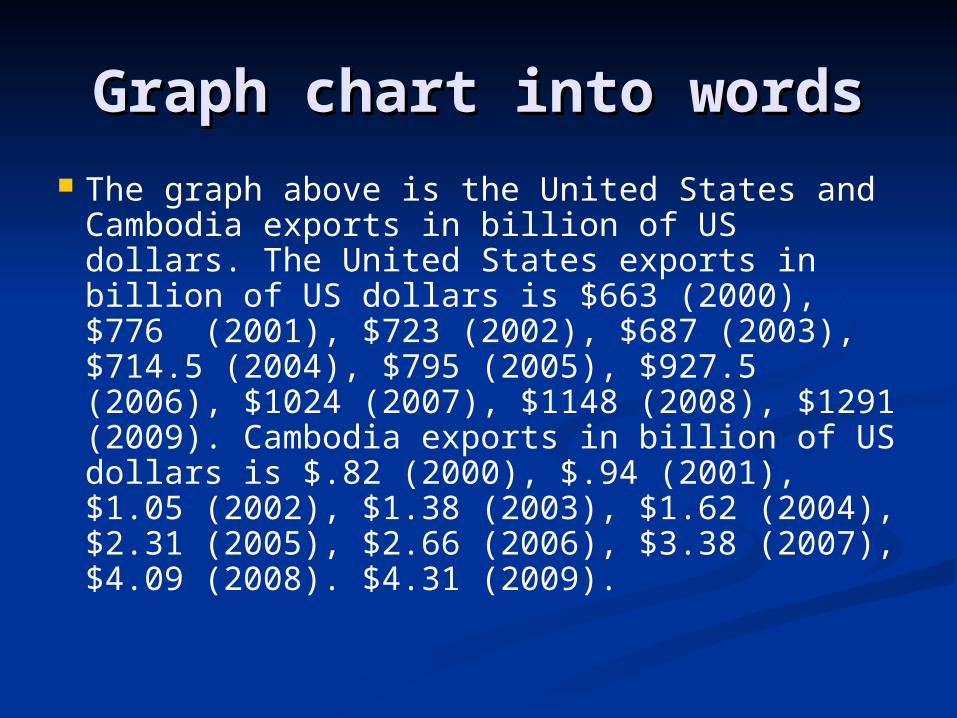
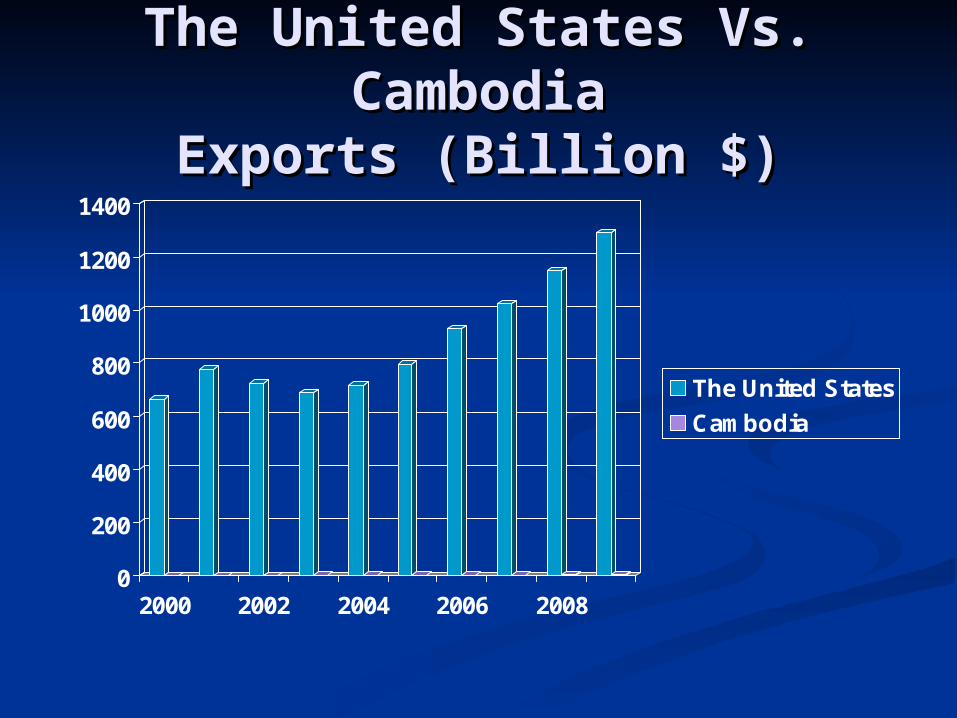
Graph chart into wordsGraph chart into words The graph above is the United States and
Cambodia exports in billion of US dollars. The United States exports in billion of US dollars is $663 (2000), $776 (2001), $723 (2002), $687 (2003), $714.5 (2004), $795 (2005), $927.5 (2006), $1024 (2007), $1148 (2008), $1291 (2009). Cambodia exports in billion of US dollars is $.82 (2000), $.94 (2001), $1.05 (2002), $1.38 (2003), $1.62 (2004), $2.31 (2005), $2.66 (2006), $3.38 (2007), $4.09 (2008). $4.31 (2009).
SourceSource
The United States export source: (The United States export source: (http://http://www.indexmundi.com/g/g.aspx?vwww.indexmundi.com/g/g.aspx?v=85&c==85&c=us&lus&l=en=en))
Cambodia export source: (Cambodia export source: (http://http://www.indexmundi.com/g/g.aspx?vwww.indexmundi.com/g/g.aspx?v=85&c==85&c=cb&lcb&l=en=en))
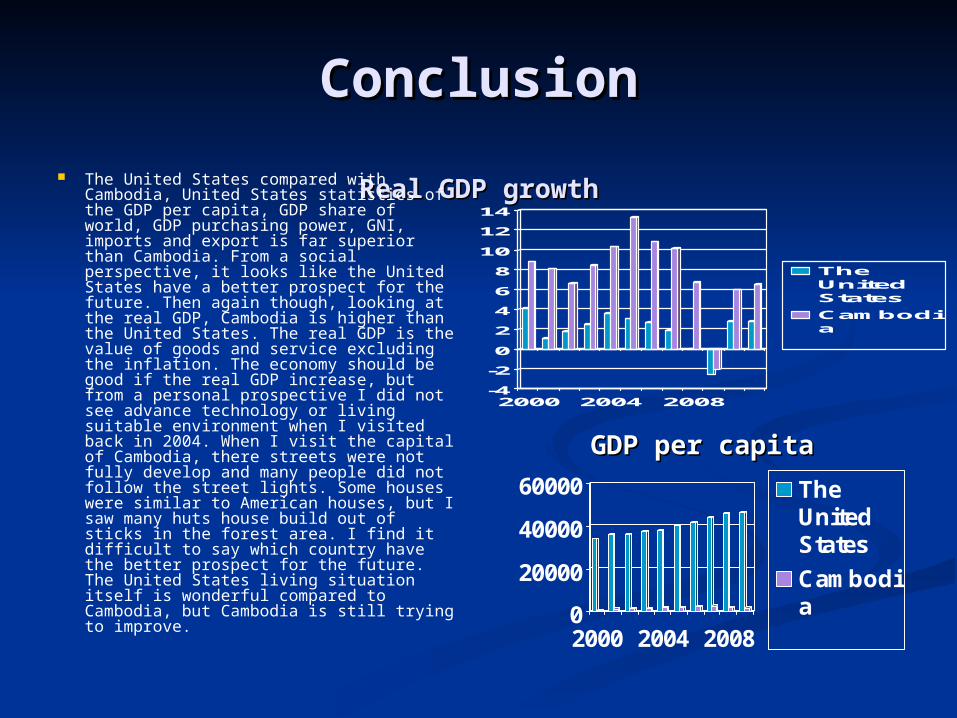
ConclusionConclusion Real GDP growthReal GDP growth The United States compared with
Cambodia, United States statistics of the GDP per capita, GDP share of world, GDP purchasing power, GNI, imports and export is far superior than Cambodia. From a social perspective, it looks like the United States have a better prospect for the future. Then again though, looking at the real GDP, Cambodia is higher than the United States. The real GDP is the value of goods and service excluding the inflation. The economy should be good if the real GDP increase, but from a personal prospective I did not see advance technology or living suitable environment when I visited back in 2004. When I visit the capital of Cambodia, there streets were not fully develop and many people did not follow the street lights. Some houses were similar to American houses, but I saw many huts house build out of sticks in the forest area. I find it difficult to say which country have the better prospect for the future. The United States living situation itself is wonderful compared to Cambodia, but Cambodia is still trying to improve.
-4
-2
0
2
4
6
8
10
12
14
2000 2004 2008
TheUnitedStates
Cambodia
0
20000
40000
60000
2000 2004 2008
TheUnitedStates
Cambodia
GDP per capitaGDP per capita
Works CitedWorks Cited Goodwin, Neva R., Julie A. Nelson, and Jonathan Harris.
Macroeconomics in Context. Armonk, NY: M.E. Sharpe, 2009. Print.
https://www.cia.gov/library/publications/the-world-factbook/geos/us.html
https://www.cia.gov/library/publications/the-world-factbook/geos/cb.html
http://www.gfmag.com/gdp-data-country-reports/151-the-united-shttp://www.gfmag.com/gdp-data-country-reports/151-the-united-states-gdp-country-report.html#axzz1QXDMaLzwtates-gdp-country-report.html#axzz1QXDMaLzw
http://www.gfmag.com/gdp-data-country-reports/306-cambodia-ghttp://www.gfmag.com/gdp-data-country-reports/306-cambodia-gdp-country-report.html#axzz1Psh9z1Qidp-country-report.html#axzz1Psh9z1Qi
http://www.gfmag.com/gdp-data-country-reports/151-the-united-http://www.gfmag.com/gdp-data-country-reports/151-the-united-states-gdp-country-report.html#axzz1QXDMaLzwstates-gdp-country-report.html#axzz1QXDMaLzw
http://www.gfmag.com/gdp-data-country-reports/306-cambodia-http://www.gfmag.com/gdp-data-country-reports/306-cambodia-gdp-country-report.html#axzz1Psh9z1Qigdp-country-report.html#axzz1Psh9z1Qi
http://http://www.indexmundi.com/g/g.aspx?cwww.indexmundi.com/g/g.aspx?c==us&vus&v=67=67 http://http://www.indexmundi.com/g/g.aspx?cwww.indexmundi.com/g/g.aspx?c==cb&vcb&v=67=67 http://http://www.indexmundi.com/g/g.aspx?vwww.indexmundi.com/g/g.aspx?v=65&c==65&c=us&lus&l=en=en http://http://www.indexmundi.com/g/g.aspx?vwww.indexmundi.com/g/g.aspx?v=65&c==65&c=cb&lcb&l=en=en
Works CitedWorks Cited
http://www.tradingeconomics.com/united-states/gni-ppp-us-dollar-wb-http://www.tradingeconomics.com/united-states/gni-ppp-us-dollar-wb-data.htmldata.html
http://www.tradingeconomics.com/cambodia/gni-ppp-us-dollar-wb-http://www.tradingeconomics.com/cambodia/gni-ppp-us-dollar-wb-data.htmldata.html
http://www.infoplease.com/ipa/A0104719.htmlhttp://www.infoplease.com/ipa/A0104719.html http://www.indexmundi.com/g/g.aspx?c=cb&v=74http://www.indexmundi.com/g/g.aspx?c=cb&v=74 http://www.gfmag.com/gdp-data-country-reports/151-the-united-states-http://www.gfmag.com/gdp-data-country-reports/151-the-united-states-
gdp-country-report.html#axzz1QXDMaLzwgdp-country-report.html#axzz1QXDMaLzw http://www.gfmag.com/gdp-data-country-reports/306-cambodia-gdp-http://www.gfmag.com/gdp-data-country-reports/306-cambodia-gdp-
country-report.html#axzz1Psh9z1Qicountry-report.html#axzz1Psh9z1Qi http://www.indexmundi.com/united_states/http://www.indexmundi.com/united_states/
industrial_production_growth_rate.htmlindustrial_production_growth_rate.html http://www.indexmundi.com/cambodia/http://www.indexmundi.com/cambodia/
industrial_production_growth_rate.htmlindustrial_production_growth_rate.html http://www.indexmundi.com/g/g.aspx?v=89&c=us&l=enhttp://www.indexmundi.com/g/g.aspx?v=89&c=us&l=en http://www.indexmundi.com/g/g.aspx?v=89&c=cb&l=enhttp://www.indexmundi.com/g/g.aspx?v=89&c=cb&l=en http://www.indexmundi.com/g/g.aspx?v=85&c=us&l=enhttp://www.indexmundi.com/g/g.aspx?v=85&c=us&l=en http://www.indexmundi.com/g/g.aspx?v=85&c=cb&l=enhttp://www.indexmundi.com/g/g.aspx?v=85&c=cb&l=en