intro r commander
DESCRIPTION
pengenalan program RTRANSCRIPT

Working with R commander
Load the R Commander
> library(Rcmdr)
Load the Data set
Hsb data set
Get from https://sites.google.com/site/biostatinfocore/introduction-to-r/hsb2.csv
The High School and Beyond Project was a longitudinal study of students in the U.S. carried out in 1980 by the National Center for Education Statistics. Data were collected from 58,270 high school students (28,240 seniors and 30,030 sophomores) and 1,015 secondary schools. The HSB data frame is sample of 600 observations, of unknown characteristics, originally taken from Tatsuoka (1988).
Tatsuoka, M. M. (1988). Multivariate Analysis: Techniques for Educational and Psychological Research (2nd ed.). New York: Macmillan, Appendix F, 430-442.
female :
0: male
1: female
race :
1: hispanic
2: asian
3: african-amer
4: white
ses :
1: low
2: middle

3: high
schtyp : type of school
1: public
2: private
prog : type of program
1: general
2: academic
3: vocation
read : reading score
write : writing score
math : math score
science : science score
socst : social studies score

Command Line:
hsb <- data.frame(read.csv(file="C:\\Users\\Administrator\\Documents\\Teaching i3l\\biostatistics\\hsb2.csv"))
Menu in Rcmdr

Statistical Graphs and Plotting
Graph


T test


Input Data Directly to Rcmdr
Obstetrics Data
A clinical trial is conducted at the gynecology unit of a major hospital to determine the effectiveness of drug A in preventing premature birth. In the trial, 30 pregnant women are to be studied, 15 in a treatment group to receive drug A and 15 in a control group to receive a placebo. The patients are to take a fixed dose of each drug on a one-time-only basis between the 24th and 28th weeks of pregnancy. The patients are assigned to groups based on computer-generated random numbers, where for every two patients eligible for the study, one is assigned randomly to the treatment group and the other to the control group. The weights of the babies are those given below.


One sample T test

Two Independent Sample T test

Result:
Two Dependent Sample T test
Case: Renal Disease Ten patients with advanced diabetic nephropathy (kidney complications of diabetes) were treated with captopril over an 8-week period [10]. Urinary protein was measured before and after drug therapy, with results listed in the table below in both the raw and ln scale.


One-Way ANOVA
You can first recode the variables (optional)

-10 -8 -6 -4 -2 0 2
vocational - general
vocational - academic
general - academic (
(
(
)
)
)
95% family-wise confidence level
Linear Function

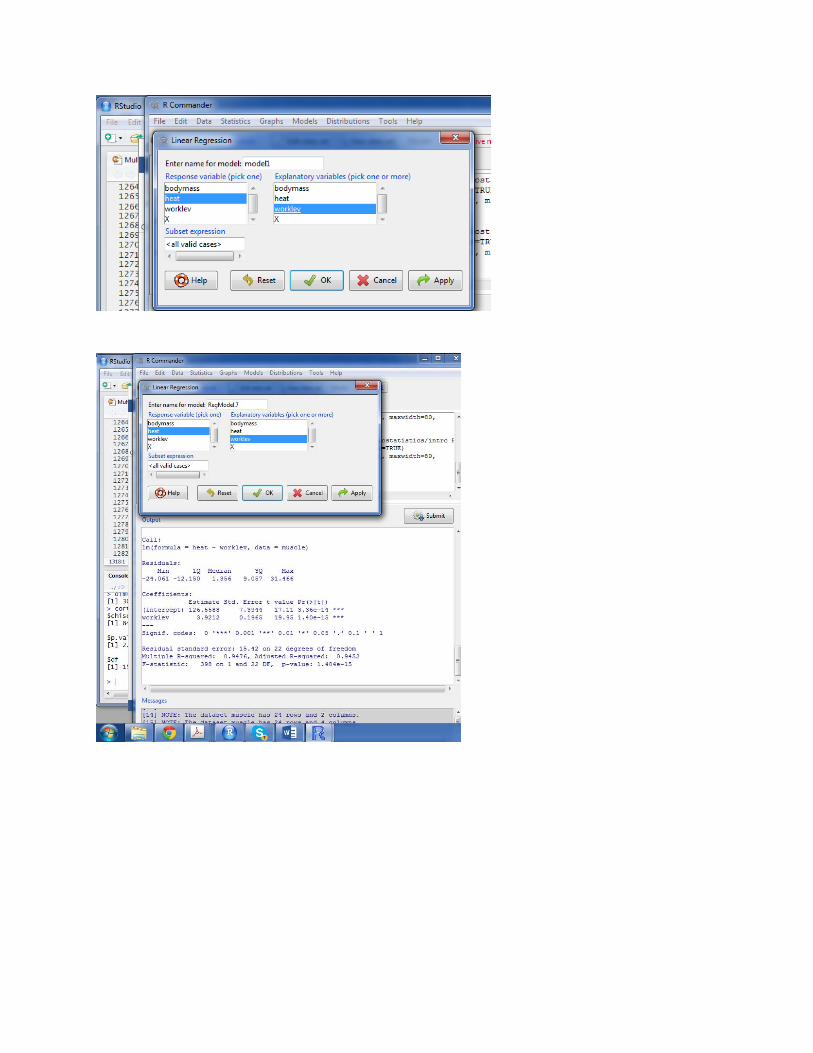
Linear Regression
Dataset: muscle1.dat Source: M. Greenwood (1918). "On the Efficiency of Muscular Work," Proceedings of the Royal Society of London, Series B, Containing Papers of a Biological Character, Vol.90, #627, pp.199-214 (Originally from Glazebrook and Dye, vol.87, p.96 (1914)) Description: Measurements of Heat Production (calories) at various Body Masses (kgs) and Work levels (Calories/hour) on a stationary bike.
Load the data
Regression Analysis
Heat = a +b * worklevel

Heat = a + b1*worklevel + b2*bodymass
You can also use MS Excel to perform Linear Regression:
http://www.clemson.edu/ces/phoenix/tutorials/excel/regression.html

Save your workspace: