introducing gs sustain - amazon s3s3.amazonaws.com/zanran_storage/ the firm may have a conflict of...
TRANSCRIPT

Sarah Forrest Goldman Sachs International 44-20-7552-9368 [email protected] Howard Goldman Sachs International 44-20-7552-5987 [email protected] Fox Goldman Sachs International 44-20-7552-5967 [email protected] [email protected] Du Goldman Sachs International 44-20-7552-5703 [email protected]
Introducing GS SUSTAIN
September 2007
The Goldman Sachs Group, Inc. does and seeks to do business with companies covered in its research reports. As a result, investors should be aware that the firm may have a conflict of interest that could affect the objectivity of this report. Investors should consider this report as only a single factor in making their investment decision.
Customers of The Goldman Sachs Group, Inc. in the United States can receive independent, third-party research on the company or companies covered in this report, at no cost to them, where such research is available. Customers can access this independent research at http://www.independentresearch.gs.com or can call 1-866-727-7000 to request a copy of this research.
For Reg AC certification, see page 16. For other important disclosures, see page 18, go to http://www.gs.com/research/hedge.html, or contact your investment representative.
Analysts employed by non-US affiliates are not required to take the NASD/NYSE analyst exam.
The Goldman Sachs Group, Inc.

Goldman Sachs Global Investment Research 2
Overview: Introducing GS SUSTAIN
• Our winners outperformed MSCI World by 25% with a 72% success rate versus their sector peers since Aug 2005 (see performance table on following slide)
• The world is changing, industry structures are changing
• Valuation isn’t changing: cash return spreads drive valuation and performance; market rewards sustained competitive advantage
• GS SUSTAIN brings together ESG, industry themes and cash returns valuation to pick stocks and emerging industries
• No evidence that ESG/SRI alone adds value
• Emerging industries offer 3x higher growth than average for GS coverage universe
• GS SUSTAIN focus list: 21 mature industry leaders and 23 attractively valued emerging industry players

Goldman Sachs Global Investment Research 3
Our winners outperformed MSCI World by 25% with a 72% success rate since Aug 05
95
100
105
110
115
120
125
130
08/05 09/05 10/05 11/05 12/05 01/06 02/06 03/06 04/06 05/06 06/06 07/06 08/06 09/06 10/06 11/06 12/06 01/07 02/07 03/07 04/07 05/07
GS SUSTAIN focus list performance relative to MSCI World
Energy ESG framework published 24 August 2005;
sustainable investing leaders include BG, BP, ExxonMobil,
Petrobras, Statoil, TOTAL
Media ESG framework published 21 Feb 2006;
sustainable investing leaders include BSkyB, Reuters, WPP, and Yell
Mining & Steel ESG framework published 18 Jul 2006;
sustainable investing leaders include BHP Billiton, Xstrata,
Posco and Voestalpine
Enhanced Energy ESGframework published 9 Oct 2006;
sustainable investing leaders updated to BG, BHP Billiton,
Petrobras, RDShell and Statoil
Food & Beverages ESGframework published 8 Feb 2007;
sustainable investing leaders include Danone, Diageo, Kellogg,
Nestle, and PepsiCo
Pharmaceuticals ESG framework published 29 May 2007;
sustainable investing leaders include Bristol-Myers Squibb,
Merck, Novo Nordisk and Roche
6 stocks
10 stocks
14 stocks
12 stocks
17 stocks
21 stocks
Absolute
performanceMSCI World
(Level 1 Sector)Success rate (vs. sector)
Pharmaceuticals HealthcareBristol-Myers Squibb 29 May 2007 3.7% -2.5% N/MMerck 29 May 2007 -5.9% -2.5% N/MNovo Nordisk 29 May 2007 -2.1% -2.5% N/MRoche 29 May 2007 -5.0% -2.5% N/M
Food & Beverages Consumer StaplesDanone 08 Feb 2007 3.6% 6.2% 0Diageo 08 Feb 2007 10.0% 6.2% 1Kellogg 08 Feb 2007 6.7% 6.2% 1Nestle 08 Feb 2007 1.6% 6.2% 0PepsiCo 08 Feb 2007 3.6% 6.2% 0
Energy EnergyBG Group 09 Oct 2006 31.2% 29.3% 1BHP Billiton 18 Jul 2006 57.9% 29.3% 1Petrobras 09 Oct 2006 51.8% 29.3% 1Royal Dutch Shell 09 Oct 2006 25.5% 29.3% 0Statoil 09 Oct 2006 35.0% 29.3% 1
Mining & Steel MaterialsBHP Billiton 18 Jul 2006 57.9% 46.9% 1Posco 18 Jul 2006 120.6% 46.9% 1Voestalpine 18 Jul 2006 136.2% 46.9% 1Xstrata 18 Jul 2006 87.7% 46.9% 1
European Media Consumer DiscretionaryBSkyB 21 Feb 2006 45.8% 25.7% 1Reuters 21 Feb 2006 65.5% 25.7% 1WPP 21 Feb 2006 33.9% 25.7% 1Yell 21 Feb 2006 3.1% 25.7% 0
Pharmaceuticals -2.3% -2.5% N/MFood & Beverages 5.1% 6.2% 40%Energy 40.3% 29.3% 80%Mining & Steel 97.6% 46.9% 100%European Media 37.1% 25.7% 75%ESG framework success rate 72%
ESG framework performance since publication
ESG publication dateGS ESG framework
Source: Datastream, MSCI, Goldman Sachs Research Source: Datastream, MSCI, Goldman Sachs Research
Goldman Sachs Global Investment Research 4
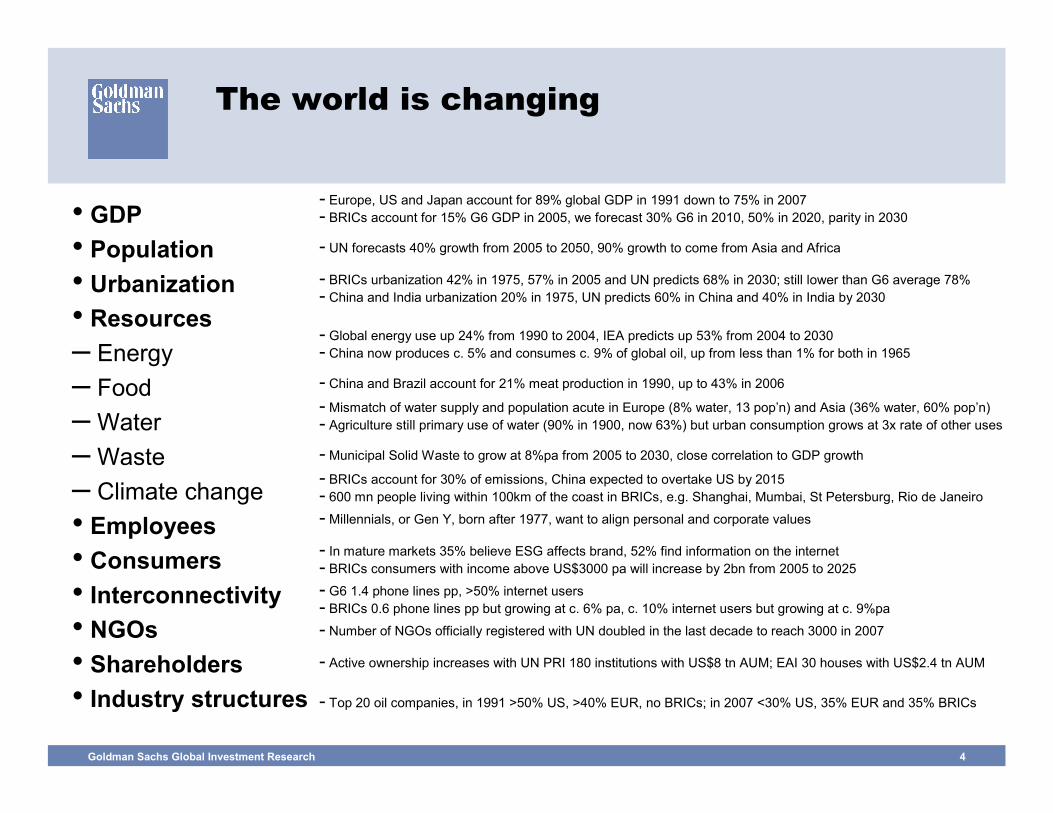
The world is changing
• GDP• Population • Urbanization• Resources– Energy– Food– Water– Waste– Climate change• Employees• Consumers• Interconnectivity• NGOs• Shareholders• Industry structures
- Europe, US and Japan account for 89% global GDP in 1991 down to 75% in 2007- BRICs account for 15% G6 GDP in 2005, we forecast 30% G6 in 2010, 50% in 2020, parity in 2030
- UN forecasts 40% growth from 2005 to 2050, 90% growth to come from Asia and Africa
- BRICs urbanization 42% in 1975, 57% in 2005 and UN predicts 68% in 2030; still lower than G6 average 78%- China and India urbanization 20% in 1975, UN predicts 60% in China and 40% in India by 2030
- Global energy use up 24% from 1990 to 2004, IEA predicts up 53% from 2004 to 2030- China now produces c. 5% and consumes c. 9% of global oil, up from less than 1% for both in 1965
- China and Brazil account for 21% meat production in 1990, up to 43% in 2006
- Mismatch of water supply and population acute in Europe (8% water, 13 pop’n) and Asia (36% water, 60% pop’n)- Agriculture still primary use of water (90% in 1900, now 63%) but urban consumption grows at 3x rate of other uses
- Municipal Solid Waste to grow at 8%pa from 2005 to 2030, close correlation to GDP growth
- BRICs account for 30% of emissions, China expected to overtake US by 2015- 600 mn people living within 100km of the coast in BRICs, e.g. Shanghai, Mumbai, St Petersburg, Rio de Janeiro
- Millennials, or Gen Y, born after 1977, want to align personal and corporate values
- In mature markets 35% believe ESG affects brand, 52% find information on the internet- BRICs consumers with income above US$3000 pa will increase by 2bn from 2005 to 2025
- G6 1.4 phone lines pp, >50% internet users- BRICs 0.6 phone lines pp but growing at c. 6% pa, c. 10% internet users but growing at c. 9%pa
- Number of NGOs officially registered with UN doubled in the last decade to reach 3000 in 2007
- Active ownership increases with UN PRI 180 institutions with US$8 tn AUM; EAI 30 houses with US$2.4 tn AUM
- Top 20 oil companies, in 1991 >50% US, >40% EUR, no BRICs; in 2007 <30% US, 35% EUR and 35% BRICs

Goldman Sachs Global Investment Research 5
Industry structures are changing and trends will only intensify
Europe
EuropeEurope Europe
Europe
Europe
Europe
Europe
EuropeEurope
Europe
Europe
USA
USA
USAUSA
USA
USA
USA
USA
USA
USA
USA
USA
RoW
RoW
RoW
RoW RoWRoW
RoW RoW RoW RoW
BRICs
BRICs
RoWRoW
BRICs
BRICs BRICs
0%
10%
20%
30%
40%
50%
60%
70%
80%
90%
100%
1991 2007 1991 2007 1991 2007 1991 2007 1991 2007 1991 2007
% o
f Top
20
by m
arke
t cap
(US$
bn)
Europe USA RoW BRICs
Energy Mining FoodBeverages PharmaceuticalsInsurance
Rank Company Country Market cap (US$ bn)
Market cap(as % Top 30) Rank Company Country Market cap
(US$ bn)Market cap
(as % Top 30)1 Exxon US 75.7 17.8% 1 Exxon Mobil US 466.5 14.5%2 Royal Dutch / Shell UK / Netherlands 75.4 17.7% 2 PetroChina China 263.3 8.2%3 BP UK 29.4 6.9% 3 Royal Dutch Shell UK / Netherlands 258.2 8.0%4 Mobil US 27.0 6.4% 4 Gazprom Russian Federation 243.8 7.6%5 Amoco US 24.4 5.7% 5 BP UK 221.8 6.9%6 Chevron US 24.1 5.7% 6 TOTAL France 190.3 5.9%7 British Gas UK 21.1 5.0% 7 Chevron US 174.0 5.4%8 Elf Aquitaine France 18.6 4.4% 8 ENI Italy 144.9 4.5%9 Arco US 16.8 4.0% 9 ConocoPhillips US 127.8 4.0%10 Texaco US 15.8 3.7% 10 Petrobras Brazil 126.5 3.9%11 PetroFina Belgium 8.8 2.1% 11 Sinopec China 97.8 3.0%12 Repsol Spain 8.1 1.9% 12 Rosneft Russian Federation 84.8 2.6%13 TOTAL France 7.8 1.8% 13 Lukoil Russian Federation 67.8 2.1%14 Imperial Oil Canada 7.4 1.7% 14 Statoil Norway 64.8 2.0%15 Marathon US 6.7 1.6% 15 BG Group UK 54.0 1.7%16 Phillips Petroleum US 6.3 1.5% 16 EnCana Canada 49.4 1.5%17 Unocal US 6.2 1.5% 17 CNOOC China 50.6 1.6%18 Occidental US 5.5 1.3% 18 Hydro Norway 48.7 1.5%19 Hydro Norway 5.3 1.3% 19 ONGC India 48.1 1.5%20 Burlington US 4.7 1.1% 20 Occidental US 47.6 1.5%21 Amerada Hess US 3.9 0.9% 21 Repsol YPF Spain 47.3 1.5%22 Sasol South Africa 3.8 0.9% 22 Imperial Oil Canada 44.0 1.4%23 Enterprise Oil UK 3.7 0.9% 23 Marathon US 42.4 1.3%24 Cosmo Oil Japan 3.6 0.9% 24 Surgutneftegas Russian Federation 41.2 1.3%25 Sunoco US 3.2 0.8% 25 Valero US 41.1 1.3%26 Lasmo UK 3.1 0.7% 26 Suncor Canada 41.1 1.3%27 EnCana Canada 2.6 0.6% 27 Husky En. Canada 36.5 1.1%28 CEPSA Spain 2.2 0.5% 28 Canadian NR Canada 36.2 1.1%29 OMV Austria 2.1 0.5% 29 Devon Energy US 35.9 1.1%30 Woodside Australia 2.0 0.5% 30 Apache US 28.0 0.9%
Top 30 oil and gas 426 100.0% Top 30 oil and gas 3,225 100.0%US Market 2,046 US Market 13,934European Market 1,647 European Market 11,209
Top 30 by Market capitalisation in 2007 (as of 20 June 2007)Top 30 by Market capitalisation in 1991
0
0.2
0.4
0.6
0.8
1
1.2
North America Asia Ex Japan Japan Europe Brazil India China Russia
1997 2002 2007
Market cap of Top 20 companies, 1991 and 2007
Energy Top 30 companies by market cap
Market cap versus GDP, 1997 to 2007
Source: Datastream, Goldman Sachs Research
Source: Goldman Sachs Economic Research, GS BRICs Model Projections

Goldman Sachs Global Investment Research 6
Valuation isn’t changing: cash return spreads drive valuation and performance
0%
5%
10%
15%
20%
25%
30%
35%
40%
45%
50%
EV/EBITDA vs. EBITDAgrowth
Dividend yield vs. DPSgrowth
PE vs. EPS growth EV/GCI vs CROCI/WACC
Valuation Methodology
Perc
enta
ge o
f var
iatio
n ex
plai
ned
Lower correlations for multiple- and growth-based metrics
0.00
0.10
0.20
0.30
0.40
0.50
0.60
0.70
0.80
0.90
1.00
1992-2005 1996-2005 1992-2006 1997-2006
Energy Mining Food & Beverages Pharmaceuticals
R2
P/E vs. EPS growthEV/EBITDA vs. EBITDA growthDividend yield vs. DPS growthEV/DACF vs. CFPS growthEV/GCI vs. CROCI/WACC
Cash return spreads explain valuation more than multiple- and growth-based metrics
Cash return spreads explain valuation in global energy, mining, food and beverages and pharma
Source: Goldman Sachs Research Source: Company data, Goldman Sachs Research estimates, Quantum database

Goldman Sachs Global Investment Research 7
Valuation isn’t changing: market rewards sustained competitive advantage
1.8 - 2 0% 14% 16% -11% 3% -4% 11%1.6 - 1.8 23% 3% 12% -13% 6% 22% 7%1.4 - 1.6 2% 4% 14% 6% 19% 14% 11%1.2 - 1.4 2% 3% 11% -3% 4% 9% 7%1.0 - 1.2 7% 9% 1% 5% 6% 4% 7%0.8 - 1 5% 4% -7% -1% 4% -1% -4%0.6 - 0.8 6% -5% -2% -10% -8% -8% -3%0.4 - 0.6 -7% -5% -3% -1% -11% -8% -4%0.2 - 0.4 -28% 11% -13% 10% -14% -5% -8%0.0 - 0.2 -4% -20% -29% -29% -42% -6% -7%
2003 2004 2005 2006Sector-relative CROCI
2000 2001 2002
-20.0%
-15.0%
-10.0%
-5.0%
0.0%
5.0%
10.0%
15.0%
20.0%
25.0%
30.0%
1 2 3 4 5 6 7
Number of consecutive years in the first quartile
Valu
atio
n Pr
emiu
m /
Dis
coun
t*
5
10
18
17
27
19
55
*Valuation calculated as the average EV/GCI to CROCI/WACC ratio relative to the sector during the period spent in the first quartile.
Number of Companies
3 years of sustainability is the key. There is a valuation premium for companies with a top-quartile CROCI longer than 3 years, and a discount for companies unable to sustain it for that l
Sustained competitive advantage reflected in valuation premium
Sector-relative CROCI and outperformance
Source: Company data, Goldman Sachs Research estimates, Quantum databaseSource: Company data, Goldman Sachs Research estimates, Quantum database

Goldman Sachs Global Investment Research 8
Sector by sector ESG framework
Social: employees
Environment
Social: stakeholders
Social: leadership
Corporate Governance
Transparency of audit and
stock options
Independence of board and
leadership
Minority shareholders’rights
Environmental and social reporting and assurance
Leadership responsibility for and compensation links to environmental and
social performance
Compensation
Sector-specific industry drivers of competitive advantage
Cash return spreads
Stock market performance
Economy
Society
Industry
Environment
Industry Themes and Company Valuation
Gender diversity
CEO compensation
Health and safetyProductivity
Consumers Suppliers Communities Governments and regulators Investors
Energy use and carbon emissions
Management of water, waste, recycling Suppliers and sourcing Biodiversity and
land use
Source: Goldman Sachs Research

Goldman Sachs Global Investment Research 9
Universal patterns emerge: the more you pay employees the more you get
Xstrata
Voestalpine
Vedanta
USSteel
ThyssenKrupp
Salzgitter
Rio Tinto
Outokumpu
Lonmin
Anglo American
Alcoa
Wyeth
UCB
Sanofi-aventis
Roche
Novo Nordisk
Novartis
Merck KGaA
GSKAstraZeneca
TOTAL
Statoil
Repsol
RDShell
OMV
Norsk Hydro
Marathon
ExxonMobil
ENI
ChevronBP
BHP Billiton
BG
Unilever
Tate & Lyle
Suedzucker
Scottish & Newcastle
SABMiller
Pernod Ricard
Numico
Nestle
InBev
Hershey
Heineken
General Mills
Diageo
Danone
Danisco
Coca-Cola HBC
Coca-Cola Enterprises
Coca-Cola
Carlsberg
Cadbury Schweppes
Associated British Foods
Anheuser-Busch
10,000
100,000
1,000,000
- 25,000 50,000 75,000 100,000 125,000
Payroll per employee (US$) - linear scale
Deb
t adj
uste
d ca
sh fl
ow p
er e
mpl
oyee
(US$
) - lo
g sc
ale
All US, European companies except media
Source: Company data, Goldman Sachs Research

Goldman Sachs Global Investment Research 10
No evidence that ESG/SRI alone adds value
80
85
90
95
100
105
110
06/00 06/01 06/02 06/03 06/04 06/05 06/06 06/07
Rel
ativ
e pe
rform
ance
FTSE4Good Global Index vs. FTSE All-World Developed Index DJ Sustainability World Index vs. DJ World Total Market Index
Takeda
Shionogi
Ono
Eisai
Chugai China Steel
Posco
Impala Plat
AngloPlat
Lukoil
Gazprom
Teva
Sinopec PetroChina
CNOOC
CVRD
Petrobras
Roche
Novartis Nestle
AcerinoxRepsol
Telecinco
Antena3
Statoil
Norsk Hydro
RDShell
Wolters Kluwer
UnileverNumico
HeinekenENI
Mediaset
Coca-Cola HBC
ThyssenKrupp
Merck-Serono
SuedzuckerSanofi-aventis
TOTAL Vivendi Universal
TF1
Publicis
M6 - Metropole TelevisionLagardere
JCDecaux
Havas
Pernod Ricard
Danone
Outokumpu
Sanoma WSOY
Novo Nordisk
Danisco
Carlsberg
UCB
InBev
Voestalpine
OMV
US Steel
Alcoa
Wyeth
Schering-Plough
Pfizer
Merck & Co.
Forest Eli Lilly
Bristol-Myers Squibb
Barr Allergan
Occidental
Murphy
Marathon
Hess
ExxonMobilConocoPhillips
Chevron
Wrigley PepsiCoPepsi Bottling GroupMolson Coors
KraftKellogg
HersheyGeneral MillsConstellation Brands
Coca-Cola EnterprisesCoca-Cola
Campbell Soup
Anheuser-Busch
Xstrata
Vedanta
Rio Tinto
Lonmin
BHP BillitonAnglo American
Shire
GlaxoSmithKlineAstraZeneca
BP
BG
Yell GroupWPP Group plc
United Business Media Reuters Group Plc
Pearson
ITV plcEMAPBSkyB
Tate & Lyle
Scottish & Newcastle
SABMiller
DiageoCadbury SchweppesAssociated British Foods
Teck Cominco
Alcan
-50
0
50
100
150
200
250
300
350
400
450
500
550
30% 40% 50% 60% 70% 80% 90%
ESG
3 ye
ar p
rice
perf
orm
ance
R2 ESG vs. Three-year price performance
Pharmaceuticals 0.00Food & Beverages 0.02Energy 0.11Mining & Steel 0.04European Media 0.01
Relative performance of FTSE4Good and Dow Jones Sustainability Index vs global benchmarks
No correlation between ESG performance and 3-year price performance across sectors or within sectors (inset)
Source: Datastream, FTSE4Good, Dow Jones Sustainability Indices Source: Company data, Goldman Sachs Research estimates, Quantum database

Goldman Sachs Global Investment Research 11
GS SUSTAIN brings together ESG, industry themes and cash returns valuation to pick stocks and emerging industries
Cash returns
ESG Industry themes
ESG - quantitative, objective analysis of corporate governance, social and environmental performance
SRI out of industry context= historic underperformance
Sustainability themes –emerging growth industries
Industry themes – such as energy industry’s upstream growth strategy
… with key drivers of sector …Integrating ESG…
… and sustained competitive advantage
2004
1998
1999
1997
2008E
2003
2002
2006E
2005
2007E
2000 2001
R2 = 0.82
1.0x
1.5x
2.0x
2.5x
3.0x
3.5x
4.0x
4.5x
5.0x
5.5x
6.0x
6.5x
7.0x
7.5x
1.0x 1.5x 2.0x 2.5x 3.0x 3.5x 4.0x 4.5x
CROCI / WACC
EV /
GCI
• Alternative energy• Environmental technologies• Biotechnology
Cash returns drive valuation and share price performance
Sustainable leaders
Sakhalin 1
GirassolGreater Plutonio
Kizomba A, B, C, DBenguela Belize (BBLT)
Sakhalin 2
GraneKristin Tyrihans
Snohvit
Buzzard
Ormen Lange
Elgin Franklin
Kovykta
Tangguh
Bayu Undan
Greater Gorgon
Ourhoud
Elephant
Sincor
Albacora Leste
Marlim South
Barracuda Caratinga
Peng Lai
TengizKashaganKarachaganak
Shah Deniz ACG
Azadegan
Bonga SW AparoErhaBonga
Agbami
EA
AkpoAmenam Kpono
Thunder HorseAtlantis
Mad Dog
St MaloTahiti
Kikeh
Dolphin
South Pars 2-3,4-5,6-8
Browse LNG
Perdido
Evans Shoal
CorocoroChad-Cameroon
Golfinho 1Jubarte Cachalote
Salym
Blocks 31 NE & SE
UsanYoho
Xihu troughDarkhovin
Pearl GTL
AthabascaHorizon
Syncrude 3
AngosturaYucal Placer
Surmont
HamacaCerro Negro
PetrozuataAlba
Roncador2
Dalia
Simian-SiennaScarab-Saffron
Rosetta
West Med
QasrOryx GTL
Qatar Exxon GTL
Gumusut
Greater Mangala
Shwe
Long Lake
In SalahIn Amenas
Frade
Bibiyana
19 projects in Asia - Pacific
49 projects in Asia/Middle East
10 projects in Europe
26 projects in North America
21 projects in South America
45 projects in Africa
Wafa Bahr Essalam
Kearl Lake Sunrise
Northern LightsFort Hills Joslyn
Voyageur Upgrade
Holstein
Shenzi
Mariscal Sucre
Mexilhao
Camisea 2
Shtokman
Tombua Landana
Moho BilondoM’Boundi
Gassi Touil
MukhaiznaYemen LNG
Ichthys
Pluto LNG
GendaloRanggas Gehem
KebabanganJDA
Sulige South
Bosi
Egina D6
Alaska Gas
Bovanenko
Cuu Long
PeregrinoEspadarte Sul
Al Khaleej Ph 1 & 2
Foster Creek & Christina Lake
Yuzhno-Russkoye
RasGas
Angola LNG
Changbei
Hebron
Guntong Hub
Knotty Head Qatargas
Skarv
Statfjord Late Life
VankorPrirazlom
Natuna
PNG Gas Project
Jack
TalakanUvat
Verkhnechonsk
Cepu
Plataforma Deltana 2& 3
Block 32
Jackfish
Puguang
Block 17 CLOVBlock 18 WestPazflor
Brass LNGOK LNG
Pars LNG
Wamsutter
Clair Ridge
Angel
NC 186
Rospan
Al Shaheen
Bolshekhet
Gjoa
Social: employees
Environment
Social: stakeholders
Social: leadership
Corporate Governance
Transparency of audit and
stock options
Independence of board and
leadership
Minority shareholders’rights
Environmental and social reporting and assurance
Leadership responsibility for and compensation links to environmental and
social performance
Compensation
Sector-specific industry drivers of competitive advantage
Cash return spreads
Stock market performance
Economy
Society
Industry
Environment
Industry Themes and Company Valuation
Gender diversity
CEO compensation
Health and safetyProductivity
Consumers Suppliers Communities Governments and regulators
Investors
Energy use and carbon emissions
Management of water, waste, recycling Suppliers and sourcing Biodiversity and
land use
Cash returns
ESG Industry themes
ESG - quantitative, objective analysis of corporate governance, social and environmental performance
SRI out of industry context= historic underperformance
Sustainability themes –emerging growth industries
Industry themes – such as energy industry’s upstream growth strategy
… with key drivers of sector …Integrating ESG…
… and sustained competitive advantage
2004
1998
1999
1997
2008E
2003
2002
2006E
2005
2007E
2000 2001
R2 = 0.82
1.0x
1.5x
2.0x
2.5x
3.0x
3.5x
4.0x
4.5x
5.0x
5.5x
6.0x
6.5x
7.0x
7.5x
1.0x 1.5x 2.0x 2.5x 3.0x 3.5x 4.0x 4.5x
CROCI / WACC
EV /
GCI
• Alternative energy• Environmental technologies• Biotechnology
Cash returns drive valuation and share price performance
Sustainable leaders
Sustainable leaders
Sakhalin 1
GirassolGreater Plutonio
Kizomba A, B, C, DBenguela Belize (BBLT)
Sakhalin 2
GraneKristin Tyrihans
Snohvit
Buzzard
Ormen Lange
Elgin Franklin
Kovykta
Tangguh
Bayu Undan
Greater Gorgon
Ourhoud
Elephant
Sincor
Albacora Leste
Marlim South
Barracuda Caratinga
Peng Lai
TengizKashaganKarachaganak
Shah Deniz ACG
Azadegan
Bonga SW AparoErhaBonga
Agbami
EA
AkpoAmenam Kpono
Thunder HorseAtlantis
Mad Dog
St MaloTahiti
Kikeh
Dolphin
South Pars 2-3,4-5,6-8
Browse LNG
Perdido
Evans Shoal
CorocoroChad-Cameroon
Golfinho 1Jubarte Cachalote
Salym
Blocks 31 NE & SE
UsanYoho
Xihu troughDarkhovin
Pearl GTL
AthabascaHorizon
Syncrude 3
AngosturaYucal Placer
Surmont
HamacaCerro Negro
PetrozuataAlba
Roncador2
Dalia
Simian-SiennaScarab-Saffron
Rosetta
West Med
QasrOryx GTL
Qatar Exxon GTL
Gumusut
Greater Mangala
Shwe
Long Lake
In SalahIn Amenas
Frade
Bibiyana
19 projects in Asia - Pacific
49 projects in Asia/Middle East
10 projects in Europe
26 projects in North America
21 projects in South America
45 projects in Africa
Wafa Bahr Essalam
Kearl Lake Sunrise
Northern LightsFort Hills Joslyn
Voyageur Upgrade
Holstein
Shenzi
Mariscal Sucre
Mexilhao
Camisea 2
Shtokman
Tombua Landana
Moho BilondoM’Boundi
Gassi Touil
MukhaiznaYemen LNG
Ichthys
Pluto LNG
GendaloRanggas Gehem
KebabanganJDA
Sulige South
Bosi
Egina D6
Alaska Gas
Bovanenko
Cuu Long
PeregrinoEspadarte Sul
Al Khaleej Ph 1 & 2
Foster Creek & Christina Lake
Yuzhno-Russkoye
RasGas
Angola LNG
Changbei
Hebron
Guntong Hub
Knotty Head Qatargas
Skarv
Statfjord Late Life
VankorPrirazlom
Natuna
PNG Gas Project
Jack
TalakanUvat
Verkhnechonsk
Cepu
Plataforma Deltana 2& 3
Block 32
Jackfish
Puguang
Block 17 CLOVBlock 18 WestPazflor
Brass LNGOK LNG
Pars LNG
Wamsutter
Clair Ridge
Angel
NC 186
Rospan
Al Shaheen
Bolshekhet
Gjoa
Social: employees
Environment
Social: stakeholders
Social: leadership
Corporate Governance
Transparency of audit and
stock options
Independence of board and
leadership
Minority shareholders’rights
Environmental and social reporting and assurance
Leadership responsibility for and compensation links to environmental and
social performance
Compensation
Sector-specific industry drivers of competitive advantage
Cash return spreads
Stock market performance
Economy
Society
Industry
Environment
Industry Themes and Company Valuation
Gender diversity
CEO compensation
Health and safetyProductivity
Consumers Suppliers Communities Governments and regulators
Investors
Energy use and carbon emissions
Management of water, waste, recycling Suppliers and sourcing Biodiversity and
land use
Source: Goldman Sachs Research

Goldman Sachs Global Investment Research 12
Mature industry winners must perform well on ESG, industry themes and returns
Food & BeveragesMining & Steel Media
Cash returns
ESG Industry themes
Sustainable leaders
Sustainable leaders
Cash returns
ESG Industry themes
Sustainable leaders
Sustainable leaders
Cash returns
ESG Industry themes
Sustainable leaders
Sustainable leaders
Cash returns
ESG Industry themes
Sustainable leaders
Sustainable leaders
Cash returns
ESG Industry themes
Sustainable leaders
Sustainable leaders
Industrythemes
Cash returns
• Patent expiry risk• Innovation of drug pipeline• Barriers to entry
• New product innovation• New markets driving growth• Margins drive returns
• New legacy assets – T170 • Mining – product mix, production efficiency and risk• Steel – size, production efficiency and margins
• Obesity, diabetes epidemic prompting response from gov’ts
• Health innovation is key to brand and M&A strategy
• Innovation, market share and margin expansion
• New markets: BRICs driving beverage volume
• China’s urbanization is driving metals demand
• Expansion projects driving returns, but at higher political risk
• Skilled laborshortage
• Consolidation
• New competitors
• Disruptive technology
• Audience fragmentation
• New advertising markets
• Investment in human and intellectual capital
• Governance and acquisitions
• Premium for content
• BRICs exposure• Audience fragmentation• Internet & global brands
Bristol-Myers Squibb, Merck & Co., Novo Nordisk, Roche
Danone, Diageo,Kellogg, Nestle, PepsiCo
BG, ENI, Petrobras, Statoil
BHP Billiton, Posco, Rio Tinto, Voestalpine
BSkyB, Reed Elsevier, Vivendi, WPP
GS SUSTAIN LEADERS
• CROCI (cash return on cash invested) above peer group indicates sustained competitive advantage
Alternative Energy
Environmental Technology
Biotechnology
Emerging industries
Environmental and social themes point to emergence of growth
industries
Soci
al
Leadership
Employees
Stakeholders
Corporate governance
Environment
Energy
• More complex projects
• Higher political risk
• Skilled laborshortage
• Climate change
• New competitors
• Low exploration success rate
• Alternative energy
21%
7%
25%
18%
29%
Pharmaceuticals
• Higher R&D spend
• Shift in disease focus
• Tougher regulatory environment
• Generics industry grows
• BRICs potential
• M&A, LBO
28%
8%
20%
20%
24%
29%
10%
19%
29%
14%
33%
13%
14%
23%
17%
20%
15%
20%
10%
35%
Source: Goldman Sachs Research

Goldman Sachs Global Investment Research 13
Emerging industries offer 3x higher growth than average for GS coverage universe
Multi-industryBrokers Banks
Media
Pharmaceuticals
Metals & Mining
Food
Water
Biofuels
SemiconductersSoftw areMedical products
Solar
Wind
Energy: Oil
Biotechnology
0%
20%
40%
60%
80%
100%
0 20,000 40,000 60,000 80,000 100,000 120,000 140,000
Enterprise Value, US$ mn
EP
S gr
owth
, 200
9
Average
Multi-industryBrokers Banks
Media
Pharmaceuticals
Metals & Mining
Food
Water
Biofuels
SemiconductersSoftw areMedical products
Solar
Wind
Energy: Oil
Biotechnology
0%
20%
40%
60%
80%
100%
0 20,000 40,000 60,000 80,000 100,000 120,000 140,000
Enterprise Value, US$ mn
EP
S gr
owth
, 200
9
Average
Source: Company data, Goldman Sachs Research estimates Quantum database

Goldman Sachs Global Investment Research 14
GS SUSTAIN focus list: 21 mature industry leaders and 23 attractively valued emerging industry players (prices as of close of June 20, 2007)
2007E 2008E 2009E 04-06 07-09E
Mature industriesEnergy
BG Group United Kingdom BG.L 55,320$ Jonathan Waghorn Sell 799p 14.8x 14.2x 13.9x 1 Top 170 winner; 177% materiality 20% 20%ENI Italy ENI.MI 133,349$ Michele della Vigna, CFA Buy €26.97 10.2x 10.0x 9.9x 2 Top 170 near-term winner, 117% materiality 15% 14%Petroleo Brasileiro S.A. (ADR) Brazil PBR 98,406$ Brian Singer, CFA $120.83 1 Top 170 winner, 69% materialityStatoil Norway STL.OL 63,659$ Michele della Vigna, CFA Not Rated Nkr177.25 11.1x 10.1x 9.4x 1 Top 170 winner; 116% materiality 12% 14%
Mining & SteelBHP Billiton Plc United Kingdom BLT.L 174,252$ Peter Mallin-Jones Buy 1384p 10.9x 9.9x 11.5x 1 1st Q; 70% BRICs exposure 21% 25%POSCO South Korea 005490.KS 44,416$ Rajeev Das Neutral W472500.00 11.7x 8.9x 2 2nd Q; 30.5 Mt pa; high-quality; close to markets 14% 13%Rio Tinto plc United Kingdom RIO.L 106,239$ Peter Mallin-Jones Neutral 3838p 12.3x 10.6x 11.8x 1 2nd Q; 58% BRICs exposure 15% 19%Voestalpine Austria VOES.VI 13,209$ Peter Mallin-Jones Neutral €62.62 10.4x 10.9x 12.9x 2 2nd Q; 6.4 Mt pa; niche; close to markets 11% 11%
European MediaBritish Sky Broadcasting United Kingdom BSY.L 24,244$ Laurie Davison Neutral 644p 22.5x 18.3x 14.6x 2 Disruptive technology; 1/3 UK TV homes 46% 37%Reed Elsevier (UK) United Kingdom REL.L 16,238$ Veronika Pechlaner, CFA Neutral 644p 18.0x 16.4x 14.8x 1 Print to online; 30-35% sales online 14% 14%WPP Group plc United Kingdom WPP.L 18,098$ Jean-Michel Bonamy Not Rated 732p 16.4x 14.3x 12.5x 1 Emerging markets; 21% BRICs exposure 9% 11%Vivendi France VIV.PA 49,312$ Jean-Michel Bonamy Buy €31.80 14.1x 13.1x 12.0x 2 Convergence; Music, TV/Film, Telecom 6% 10%
Food & BeveragesDanone France DANO.PA 39,056$ Mark Lynch Buy €58.06 20.7x 18.3x 16.3x 1 Innovation and +51 bps margin expansion 13% 17%Diageo United Kingdom DGE.L 58,954$ Mike Gibbs Neutral 1073p 18.3x 16.6x 15.2x 1 Volume growth, emerging markets 17% 17%Kellogg Company United States K 20,661$ Steven T. Kron, CFA Buy $51.60 18.6x 16.9x 15.3x 2 Innovation and +176 bps margin expansion 14% 17%Nestle Switzerland NESN.VX 144,617$ Mark Lynch Neutral SFr460.75 17.8x 16.1x 14.6x 1 Innovation and +103 bps margin expansion 12% 13%PepsiCo, Inc. United States PEP 109,615$ Judy E. Hong Buy $65.52 20.1x 17.9x 16.0x 2 Innovation and +44 bps margin expansion 21% 21%
PharmaceuticalsBristol-Myers Squibb Company United States BMY 61,429$ James Kelly Neutral $31.23 21.0x 19.3x 16.8x 1 2nd Q; growth; chronic disease focus 18% 22%Merck & Co., Inc. United States MRK 107,196$ James Kelly Neutral $49.26 16.6x 16.6x 14.2x 1 2nd Q; innovation; vaccines focus 21% 22%Novo Nordisk Denmark NOVOb.CO 32,393$ John Murphy Sell Dkr565.00 19.1x 20.2x 18.2x 2 2nd Q; growth; diabetes focus 22% 24%Roche Switzerland ROG.VX 154,262$ John Murphy Buy SFr216.40 18.4x 15.7x 13.6x 2 1st Q; innovation; growth; oncology focus 17% 25%
2007E 2008E 2009E 2008E 2009E
Emerging industriesAlternative energy
Centrosolar Germany C3OG.DE 181$ Jason Channell Buy €10.14 12.3x 9.3x 7.9x Alternative Energy: Solar Niche player focused on residential installations 33% 17%D1 Oils United Kingdom DOO.L 150$ Mariano Alarco Buy 239p 15.2x Alternative Energy: Biofuels Differentiated strategy using non-food crops 74% 410%Ersol Solar Energy AG Germany ES6G.DE 785$ Jason Channell Neutral €59.70 37.1x 13.4x 8.8x Alternative Energy: Solar Integrated solar cell and wafer manufacturer 176% 52%Ormat Technologies, Inc. United States ORA 1,302$ Michael Lapides Neutral $36.56 37.3x 22.6x 19.4x Alternative Energy: Geothermal Geothermal technology pure play 65% 16%Phoenix Solar AG Germany PS4G.DE 158$ Jason Channell Buy €19.40 17.2x 13.0x 9.7x Alternative Energy: Solar Large scale solar power project developer 33% 33%Solar Millennium Germany S2MG.DE 519$ Jason Channell Neutral €38.99 23.9x 20.7x 18.0x Alternative Energy: Solar Leading solar thermal project developer 15% 15%SunPower Corp. United States SPWR 4,383$ Chris Hussey Neutral $59.45 63.3x 25.6x Alternative Energy: Solar Low-cost, high-efficiency producer 147%Suntech Power China STP 4,928$ Cheryl Tang Neutral $33.14 31.1x 21.9x 17.0x Alternative Energy: Solar Established track record of execution 42% 29%Sunways AG Germany SWWG.DE 135$ Jason Channell Buy €9.23 51.3x 15.6x 11.0x Alternative Energy: Solar Niche solar products for buildings/windows 230% 41%Vestas Wind Systems Denmark VWS.CO 12,902$ Jason Channell Buy Dkr386.50 39.2x 22.0x 17.5x Alternative Energy: Wind World's largest wind turbine manufacturer (~30%) 78% 26%
Environmental technologyFP Japan 7947.OS 708$ Yasuo Kono Buy ¥4010.00 16.5x 14.1x 12.6x Environmental technology: Recycling Niche focus on recycled food containers 17% 11%LKQ Corp. United States LKQX 1,284$ Chris Hussey Buy $24.08 23.6x 18.3x 15.3x Environmental technology: Recycling Niche focus on recycling autoparts 29% 20%Pentair, Inc. United States PNR 3,760$ Deane M. Dray, CFA Neutral $37.99 19.2x 17.3x 15.2x Environmental technology: Water 75% water revenus, new management focus 11% 14%Shanks Group United Kingdom SKS.L 1,256$ Jenny Ping Buy 268p 20.3x 17.1x 14.9x Environmental technology: Waste UK growth opportunity in waste services 19% 14%Sinomem Technology Singapore SINO.SI 385$ Christina Hee, CFA Buy S$1.28 19.4x 14.6x 12.4x Environmental technology: Water Desalination technology leaders 33% 18%Tomra Systems Norway TOM.OL 1,392$ Jonathan Rodgers, CFA Neutral Nkr53.90 27.9x 22.8x 18.9x Environmental technology: Recycling Recycles beverage cans through RVM 23% 20%
BiotechnologyActelion Switzerland ATLN.S 5,825$ Stephen McGarry Buy SFr58.85 20.5x 16.8x 14.3x Biotechnology Pulmonary arterial hypertension (PAH) 22% 18%Amylin Pharmaceuticals, Inc. United States AMLN 5,379$ Meg Malloy, CFA Buy $41.30 103.3x Biotechnology Obesity and diabetes 71% 183%Elan Corporation (ADR) Ireland ELN 9,379$ Stephen McGarry Buy $21.13 92.8x Biotechnology Neurology and Alzheimer's 58% 182%Intercell Austria ICEL.VI 1,257$ Stephen McGarry Neutral €23.70 95.7x 38.2x Biotechnology Vaccines for infectious diseases 237% 150%Genentech Inc. United States DNA 79,472$ May-Kin Ho, Ph.D. Buy $75.40 29.0x 23.6x 19.7x Biotechnology Biotherapeutics for cancer and other conditions 23% 20%Genmab Denmark GEN.CO 3,002$ Stephen McGarry Buy Dkr379.00 156.9x 37.0x Biotechnology Antibodies, oncology 137% 324%Gilead Sciences Inc. United States GILD 36,755$ Meg Malloy, CFA Buy $79.10 27.3x 23.6x 20.0x Biotechnology HIV/AIDS, infectious diseases 15% 18%
CountryGS SUSTAIN focus list ESG (quartile) Industry structure (quartile)Mkt cap US$ mn PriceTicker RatingGS analyst
Description EPS growthTickerCountry GS analyst RatingMkt cap US$ mn Price
P/ETheme
P/E CROCI
Source: Company data, Goldman Sachs Research estimates, Quantum database

Goldman Sachs Global Investment Research 15
..
Alternative energy- Jason Channell (solar, wind, biofuels)- Stephen Benson (solar, wind, biofuels)- Mariano Alarco (biofuels)
Environmental technology- Jenny Ping (water, waste)- Jonathan Rodgers (waste)
Biotechnology- Steve McGarry- Linden Townsen
Alternative energy- Arjun Murti (biofuels)- Chris Hussey (solar, fuel cells, clean coal)- Michael Molnar (solar, fuel cells, clean coal)- Michael Lapides (geothermal)
Environmental technology- Deane Dray (water)- Chris Hussey (waste)- Michael Molnar (waste)
Biotechnology- May-Kin Ho- Meg Malloy
Economics- Jim O’Neill (Global Head)- Dirk Schumacher (Euroland, Germany)- Kevin Daly (Euroland, UK, Sweden)
Tactical Research Group- Richard Manley- Liz Hampson- Eloise Goulder
Economics- Sandra Lawson (Global)- Chuck Berwick (Washington research)
Portfolio strategy- Abby Joseph Cohen- Michael Moran (portfolio strategy / accounting)
Sing
le s
tock
cov
erag
eM
acro
them
es
and
quan
t
Quantitative research, GS JBWere- Andrew Gray (Australia)
Portfolio strategy- Kathy Matsui
Alternative energy, Asia ex-Japan- Cheryl Tang (solar)- Patrick Tiah (biofuels plantations)
Environmental technology, Asia ex-Japan- Franklin Chow (water)- Christina Hee (water)
Alternative energy, Japan- Daiki Takayama (solar)- Takashi Watanabe (solar)
Environmental technology, Japan- Yasuo Kono (waste)- Akinori Kanemoto (waste)
Global GS SUSTAIN- Anthony Ling (Global CIO)- Sarah Forrest- Marc Fox- Stephan Feilhauer
GS SUSTAIN network

Goldman Sachs Global Investment Research 16
Reg AC
We, Anthony Ling, Sarah Forrest and Marc Fox, hereby certify that all of the views expressed in this report accurately reflect our personal views about the subject company or companies and its or their securities. We also certify that no part of our compensation was, is or will be, directly or indirectly, related to the specific recommendations or views expressed in this report.

DisclosuresJuly 2, 2007

Goldman Sachs Global Investment Research 18
Disclosures
Financial Advisory Disclosures
Goldman Sachs is acting as financial advisor to Norsk Hydro Asa in an announced strategic transaction.Goldman Sachs is acting as financial advisor to WPP Group Plc in an announced strategic transaction. Goldman Sachs is acting as financial advisor to Devon Energy Corporation in an announced strategic transaction. Goldman Sachs is acting as financial advisor to another party in an announced strategic transaction which may be material to Danisco A/S.Goldman Sachs is acting as financial advisor to Cadbury Schweppes Public Limited Company in an announced strategic transaction. Goldman Sachs is acting as financial advisor to Alcoa Inc. in an announced strategic transaction. Goldman Sachs is acting as financial advisor to Gestevision Telecinco Sa, Mediaset Spa in an announced strategic transaction.Goldman Sachs is acting as financial advisor to Schering-Plough Corporation in an announced strategic transaction.

Goldman Sachs Global Investment Research 19
Disclosures
Distribution of ratings/investment banking relationships
Price target and rating history chart(s)
Compendium report: please see disclosures at http://www.gs.com/research.hedge.html
Goldman Sachs Investment Research global coverage universeRating Distribution
Buy Hold Sell
28% 59% 13%
Investment Banking Relationships
Buy Hold Sell
41% 34% 31%Global
As of April 1, 2007, Goldman Sachs Global Investment Research had investment ratings on 2,590 equity securities. Prior toJune 26, 2006, Goldman Sachs utilized a relative rating system of Outperform, In-Line and Underperform, which, for thepurposes of the above disclosure required by NASD/NYSE rules, equated to Buy, Hold and Sell. As of June 26, 2006,Goldman Sachs assigns stocks as Buys and Sells on various regional Investment Lists; stocks not so assigned are deemedNeutral. Such assignments equate to Buy, Hold and Sell for the purposes of the above disclosure. See 'Ratings, Coveragegroups and views and related definitions' below.

Goldman Sachs Global Investment Research 20
Disclosures
Regulatory disclosures
Disclosures required by United States laws and regulationsSee company-specific regulatory disclosures above for any of the following disclosures required as to companies referred to in this report: manager or co-manager in a pending transaction; 1% or other ownership; compensation for certain services; types of client relationships; managed/co-managed public offerings in prior periods; directorships; marketmaking and/or specialist role.
The following are additional required disclosures: Ownership and material conflicts of interest: Goldman Sachs policy prohibits its analysts, professionals reporting to analysts and members of their households from owning securities of any company in the analyst's area of coverage. Analyst compensation: Analysts are paid in part based on the profitability of Goldman Sachs, which includes investment banking revenues. Analyst as officer or director: Goldman Sachs policy prohibits its analysts, persons reporting to analysts or members of their households from serving as an officer, director, advisory board member or employee of any company in the analyst's area of coverage. Distribution of ratings: See the distribution of ratings disclosure above. Price chart: See the price chart, with changes of ratings and price targets in prior periods, above, or, if electronic format or if with respect to multiple companies which are the subject of this report, on the Goldman Sachs website at http://www.gs.com/research/hedge.html.
Additional disclosures required under the laws and regulations of jurisdictions other than the United StatesThe following disclosures are those required by the jurisdiction indicated, except to the extent already made above pursuant to United States laws and regulations. Australia: This research, and any access to it, is intended only for "wholesale clients" within the meaning of the Australian Corporations Act. Canada: Goldman Sachs Canada Inc. has approved of, and agreed to take responsibility for, this research in Canada if and to the extent it relates to equity securities of Canadian issuers. Analysts may conduct site visits but are prohibited from accepting payment or reimbursement by the company of travel expenses for such visits. Hong Kong: Further information on the securities of covered companies referred to in this research may be obtained on request from Goldman Sachs (Asia) L.L.C. India: Further information on the subject company or companies referred to in this research may be obtained from Goldman Sachs (India) Securities Private Limited. Japan: See company-specific disclosures as to any applicable disclosures required by Japanese stock exchanges, the Japanese Securities Dealers Association or the Japanese Securities Finance Company. Korea: Further information on the subject company or companies referred to in this research may be obtained from Goldman Sachs (Asia) L.L.C., Seoul Branch. Russia: Research reports distributed in the Russian Federation are not advertising as defined in Russian law, but are information and analysis not having product promotion as their main purpose and do not provide appraisal within the meaning of the Russian Law on Appraisal. Singapore: Further information on the covered companies referred to in this research may be obtained from Goldman Sachs (Singapore) Pte. (Company Number: 198602165W). United Kingdom: Persons who would be categorized as private customers in the United Kingdom, as such term is defined in the rules of the Financial Services Authority, should read this research in conjunction with prior Goldman Sachs research on the covered companies referred to herein and should refer to the risk warnings that have been sent to them by Goldman Sachs International. A copy of these risks warnings, and a glossary of certain financial terms used in this report, are available from Goldman Sachs International on request.
European Union: Disclosure information in relation to Article 4 (1) (d) and Article 6 (2) of the European Commission Directive 2003/126/EC is available at http://www.gs.com/client_services/global_investment_research/europeanpolicy.html
Goldman Sachs Global Investment Research 21
Disclosures
Ratings, coverage groups and views and related definitionsBuy (B), Neutral (N), Sell (S) – Analysts recommend stocks as Buys or Sells for inclusion on various regional Investment Lists. Being assigned a Buy or Sell on an Investment List is determined by a stock’s return potential relative to its coverage group as described below. Any stock not assigned as a Buy or a Sell on an Investment List is deemed Neutral. Each regional Investment Review Committee manages various regional Investment Lists to a global guideline of 25%-35% of stocks as Buy and 10%-15% of stocks as Sell; however, the distribution of Buys and Sells in any particular coverage group may vary as determined by the regional Investment Review Committee. Regional Conviction Buy and Sell lists represent investment recommendations focused on either the size of the potential return or the likelihood of the realization of the return.
Return potential represents the price differential between the current share price and the price target expected during the time horizon associated with the price target. Price targets are required for all covered stocks. The return potential, price target and associated time horizon are stated in each report adding or reiterating an Investment List membership.
Coverage groups and views: A list of all stocks in each coverage group is available by primary analyst, stock and coverage group at http://www.gs.com/research/hedge.html. The analyst assigns one of the following coverage views which represents the analyst’s investment outlook on the coverage group relative to the group’s historical fundamentals and/or valuation. Attractive (A). The investment outlook over the following 12 months is favorable relative to the coverage group's historical fundamentals and/or valuation. Neutral (N). The investment outlook over the following 12 months is neutral relative to the coverage group's historical fundamentals and/or valuation. Cautious (C). The investment outlook over the following 12 months is unfavorable relative to the coverage group's historical fundamentals and/or valuation.
Not Rated (NR). The investment rating and target price, if any, have been removed pursuant to Goldman Sachs policy when Goldman Sachs is acting in an advisory capacity in a merger or strategic transaction involving this company and in certain other circumstances. Rating Suspended (RS). Goldman Sachs Research has suspended the investment rating and price target, if any, for this stock, because there is not a sufficient fundamental basis for determining an investment rating or target. The previous investment rating and price target, if any, are no longer in effect for this stock and should not be relied upon. Coverage Suspended (CS). Goldman Sachs has suspended coverage of this company. Not Covered (NC).Goldman Sachs does not cover this company. Not Available or Not Applicable (NA). The information is not available for display or is not applicable. Not Meaningful (NM). The information is not meaningful and is therefore excluded.
Ratings, coverage views and related definitions prior to June 26, 2006Our rating system requires that analysts rank order the stocks in their coverage groups and assign one of three investment ratings (see definitions below) within a ratings distribution guideline of no more than 25% of the stocks should be rated Outperform and no fewer than 10% rated Underperform. The analyst assigns one of three coverage views (see definitions below), which represents the analyst’s investment outlook on the coverage group relative to the group’s historical fundamentals and valuation. Each coverage group, listing all stocks covered in that group, is available by primary analyst, stock and coverage group at http://www.gs.com/research/hedge.html.
DefinitionsOutperform (OP). We expect this stock to outperform the median total return for the analyst's coverage universe over the next 12 months. In-Line (IL). We expect this stock to perform in line with the median total return for the analyst's coverage universe over the next 12 months. Underperform (U). We expect this stock to underperform the median total return for the analyst's coverage universe over the next 12 months
Coverage views: Attractive (A). The investment outlook over the following 12 months is favorable relative to the coverage group's historical fundamentals and/or valuation. Neutral (N). The investment outlook over the following 12 months is neutral relative to the coverage group's historical fundamentals and/or valuation. Cautious (C). The investment outlook over the following 12 months is unfavorable relative to the coverage group's historical fundamentals and/or valuation.
Current Investment List (CIL). We expect stocks on this list to provide an absolute total return of approximately 15%-20% over the next 12 months. We only assign this designation to stocks rated Outperform. We require a 12-month price target for stocks with this designation. Each stock on the CIL will automatically come off the list after 90 days unless renewed by the covering analyst and the relevant Regional Investment Review Committee.

Goldman Sachs Global Investment Research 22
Disclosures
Global product; distributing entitiesThe Global Investment Research Division of Goldman Sachs produces and distributes research products for clients of Goldman Sachs, and pursuant to certain contractual arrangements, on a global basis. Analysts based in Goldman Sachs offices around the world produce equity research on industries and companies, and research on macroeconomics, currencies, commodities and portfolio strategy.
This research is disseminated in Australia by Goldman Sachs JBWere Pty Ltd (ABN 21 006 797 897) on behalf of Goldman Sachs; in Canada by Goldman Sachs Canada Inc. regarding Canadian equities and by Goldman Sachs & Co. (all other research); in Germany by Goldman Sachs & Co. oHG; in Hong Kong by Goldman Sachs (Asia) L.L.C.; in India by Goldman Sachs (India) Securities Private Ltd.; in Japan by Goldman Sachs Japan Co., Ltd; in the Republic of Korea by Goldman Sachs (Asia) L.L.C., Seoul Branch; in New Zealand by Goldman Sachs JBWere (NZ) Limited on behalf of Goldman Sachs; in Singapore by Goldman Sachs (Singapore) Pte. (Company Number: 198602165W); and in the United States of America by Goldman, Sachs & Co. Goldman Sachs International has approved this research in connection with its distribution in the United Kingdom and European Union.
European Union: Goldman Sachs International, authorised and regulated by the Financial Services Authority, has approved this research in connection with its distribution in the European Union and United Kingdom; Goldman, Sachs & Co. oHG, regulated by the Bundesanstalt für Finanzdienstleistungsaufsicht, may also be distributing research in Germany
General disclosures in addition to specific disclosures required by certain jurisdictionsThis research is for our clients only. Other than disclosures relating to Goldman Sachs, this research is based on current public information that we consider reliable, but we do not represent it is accurate or complete, and it should not be relied on as such. We seek to update our research as appropriate, but various regulations may prevent us from doing so. Other than some industry reports published on a periodic basis, the large majority of reports are published at irregular intervals as appropriate in the analyst’s judgment.
Goldman Sachs conducts a global full-service, integrated investment banking, investment management, and brokerage business. We have investment banking and other business relationships with a substantial percentage of the companies covered by our Global Investment Research Division.
Our salespeople, traders, and other professionals may provide oral or written market commentary or trading strategies to our clients and our proprietary trading desks that reflect opinions that are contrary to the opinions expressed in this research. Our asset management area, our proprietary trading desks and investing businesses may make investment decisions that are inconsistent with the recommendations or views expressed in this research.
We and our affiliates, officers, directors, and employees, excluding equity analysts, will from time to time have long or short positions in, act as principal in, and buy or sell, the securities or derivatives (including options and warrants) thereof of covered companies referred to in this research.
This research is not an offer to sell or the solicitation of an offer to buy any security in any jurisdiction where such an offer or solicitation would be illegal. It does not constitute a personal recommendation or take into account the particular investment objectives, financial situations, or needs of individual clients. Clients should consider whether any advice or recommendation in this research is suitable for their particular circumstances and, if appropriate, seek professional advice, including tax advice. The price and value of the investments referred to in this research and the income from them may fluctuate. Past performance is not a guide to future performance, future returns are not guaranteed, and a loss of original capital may occur. Certain transactions, including those involving futures, options, and other derivatives, give rise to substantial risk and are not suitable for all investors. Current options disclosure documents are available from Goldman Sachs sales representatives or at http://theocc.com/publications/risks/riskstoc.pdf. Fluctuations in exchange rates could have adverse effects on the value or price of, or income derived from, certain investments.
Our research is disseminated primarily electronically, and, in some cases, in printed form. Electronic research is simultaneously available to all clients.
Disclosure information is also available at http://www.gs.com/research/hedge.html or from Research Compliance, One New York Plaza, New York, NY 10004.
Copyright 2007 The Goldman Sachs Group, Inc.
No part of this material may be (i) copied, photocopied or duplicated in any form by any means or (ii) redistributed without the prior written consent of The Goldman Sachs Group, Inc.