introducing statistical research to undergraduate ... · introducing statistical research to...
TRANSCRIPT
Journal of Statistics Education, Volume 19, Number 3(2011)
1
Introducing Statistical Research to Undergraduate
Mathematical Statistics Students using the Guitar Hero Video
Game Series
Ivan P. Ramler
St. Lawrence University
Jessica L. Chapman
St. Lawrence University
Journal of Statistics Education Volume 19, Number 3(2011),
www.amstat.org/publications/jse/v19n3/ramler.pdf
Copyright © 2011 by Ivan P. Ramler and Jessica L. Chapman all rights reserved. This text may
be freely shared among individuals, but it may not be republished in any medium without
express written consent from the authors and advance notification of the editor.
Key Words: Active Learning; Bootstrap Methods; Permutation Tests; Resampling Methods;
Course Project; Simulation.
Abstract
In this article we describe a semester-long project, based on the popular video game series Guitar
Hero, designed to introduce upper-level undergraduate statistics students to statistical research.
Some of the goals of this project are to help students develop statistical thinking that allows them
to approach and answer open-ended research questions, improve statistical programming skills,
and investigate computational statistical methods, such as resampling methods and power
simulations. We outline the steps of the project, including developing a method to address the
research question ("Are missed notes grouped together in parts of a song?"), statistical
programming (implemented in R), collecting data, estimation, and hypothesis testing - including
statistical power. The project, as described in this article, was intended as a semester-long project
for Mathematical Statistics students, but would work equally well as a capstone project. We
discuss modifications to make this project appropriate for different courses, including graduate-
level courses. The appendix includes the handouts provided to the students, several songs
recorded by our class, some of the methods created by the students, and R code for implementing
various aspects of the project.
Journal of Statistics Education, Volume 19, Number 3(2011)
2
1. Introduction
The use of games to illustrate concepts in statistics is fairly common (see for example Feldman
and Morgan (2003), Morrell and Auer (2007), Stephenson, Richardson, Gabrosek and
Reischman (2009), and Wilson, Lawman, Murphy and Nelson (2011)). However, most game-
based activities are designed to be short in length and are often used as an in-class exercise or for
homework assignments. In this paper, an introductory-level research project that is based on the
Guitar Hero video game series is described. This project was designed for an upper-level
undergraduate Mathematical Statistics course, but could be used equally well in a capstone
course or modified for use in other undergraduate, or even graduate, statistics courses. The
learning goals for this project included development of statistical thinking for approaching and
answering open-ended research questions, improvement of statistical programming skills,
familiarization with computational statistical methods such as resampling methods and power
simulations, and improvement of written and oral communication of statistical ideas. This paper
will provide general background about Guitar Hero, outline the project, give recommendations
for administering it, and discuss some modifications of the project. Handouts for each step of the
project (Appendix A), example songs (Appendix B), and student-created methods with R code
(Appendix C) are available in the appendices and supplementary materials.
2. Background on Guitar Hero
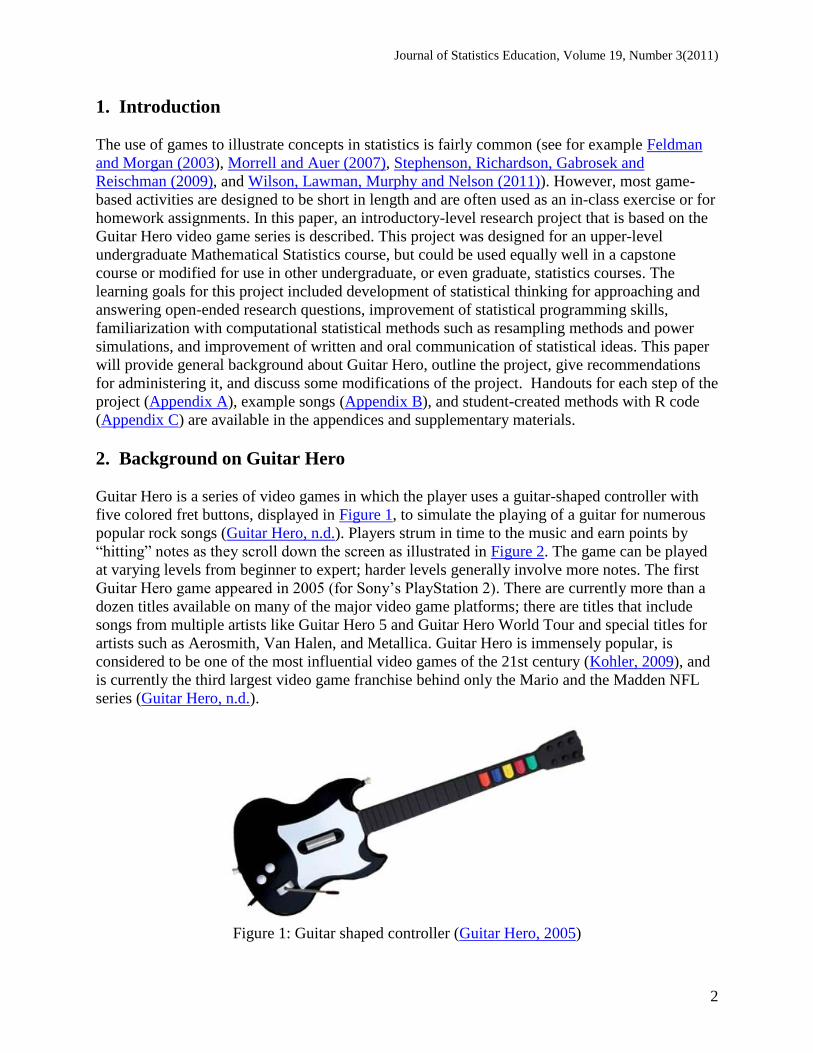
Guitar Hero is a series of video games in which the player uses a guitar-shaped controller with
five colored fret buttons, displayed in Figure 1, to simulate the playing of a guitar for numerous
popular rock songs (Guitar Hero, n.d.). Players strum in time to the music and earn points by
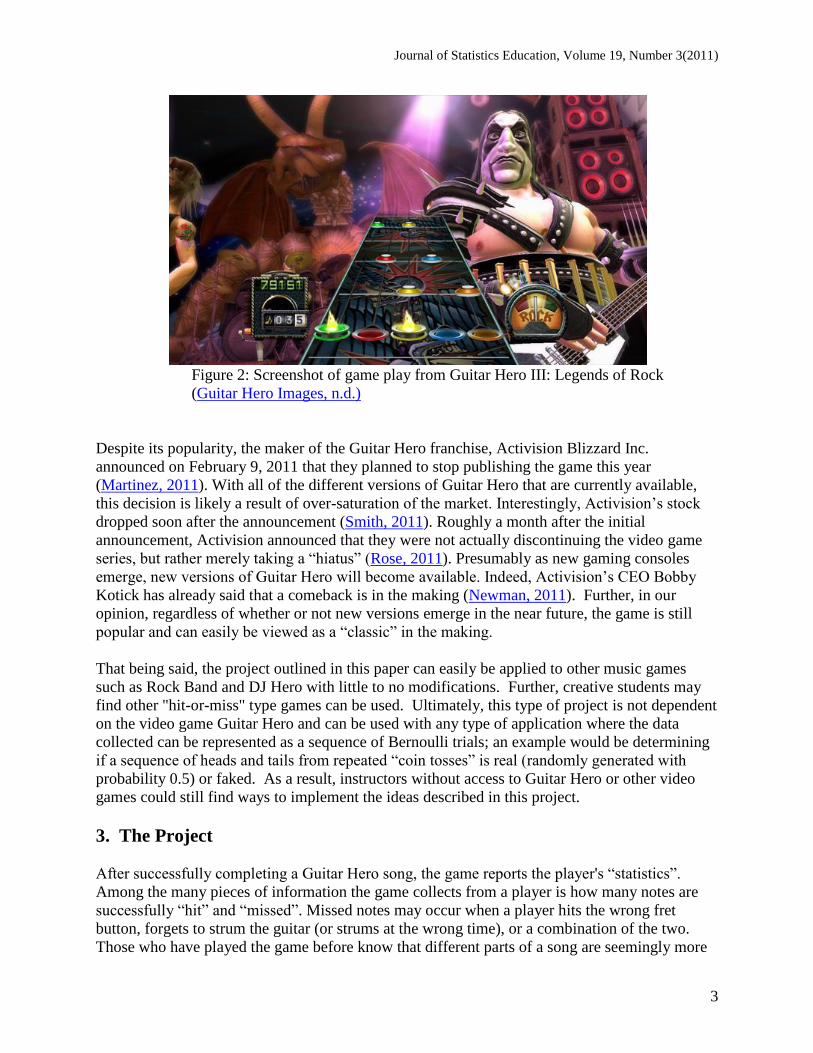
“hitting” notes as they scroll down the screen as illustrated in Figure 2. The game can be played
at varying levels from beginner to expert; harder levels generally involve more notes. The first
Guitar Hero game appeared in 2005 (for Sony‟s PlayStation 2). There are currently more than a
dozen titles available on many of the major video game platforms; there are titles that include
songs from multiple artists like Guitar Hero 5 and Guitar Hero World Tour and special titles for
artists such as Aerosmith, Van Halen, and Metallica. Guitar Hero is immensely popular, is
considered to be one of the most influential video games of the 21st century (Kohler, 2009), and
is currently the third largest video game franchise behind only the Mario and the Madden NFL
series (Guitar Hero, n.d.).
Figure 1: Guitar shaped controller (Guitar Hero, 2005)
Journal of Statistics Education, Volume 19, Number 3(2011)
3
Figure 2: Screenshot of game play from Guitar Hero III: Legends of Rock
(Guitar Hero Images, n.d.)
Despite its popularity, the maker of the Guitar Hero franchise, Activision Blizzard Inc.
announced on February 9, 2011 that they planned to stop publishing the game this year
(Martinez, 2011). With all of the different versions of Guitar Hero that are currently available,
this decision is likely a result of over-saturation of the market. Interestingly, Activision‟s stock
dropped soon after the announcement (Smith, 2011). Roughly a month after the initial
announcement, Activision announced that they were not actually discontinuing the video game
series, but rather merely taking a “hiatus” (Rose, 2011). Presumably as new gaming consoles
emerge, new versions of Guitar Hero will become available. Indeed, Activision‟s CEO Bobby
Kotick has already said that a comeback is in the making (Newman, 2011). Further, in our
opinion, regardless of whether or not new versions emerge in the near future, the game is still
popular and can easily be viewed as a “classic” in the making.
That being said, the project outlined in this paper can easily be applied to other music games
such as Rock Band and DJ Hero with little to no modifications. Further, creative students may
find other "hit-or-miss" type games can be used. Ultimately, this type of project is not dependent
on the video game Guitar Hero and can be used with any type of application where the data
collected can be represented as a sequence of Bernoulli trials; an example would be determining
if a sequence of heads and tails from repeated “coin tosses” is real (randomly generated with
probability 0.5) or faked. As a result, instructors without access to Guitar Hero or other video
games could still find ways to implement the ideas described in this project.
3. The Project
After successfully completing a Guitar Hero song, the game reports the player's “statistics”.
Among the many pieces of information the game collects from a player is how many notes are
successfully “hit” and “missed”. Missed notes may occur when a player hits the wrong fret
button, forgets to strum the guitar (or strums at the wrong time), or a combination of the two.
Those who have played the game before know that different parts of a song are seemingly more
Journal of Statistics Education, Volume 19, Number 3(2011)
4
difficult than other parts. However, one may pose the question as to whether or not the difficult
parts of a song actually result in a higher proportion of misses than the other parts (as these
difficult areas also tend to have more notes to play) and whether there is some connection
between missing notes and the difficulty of sections of a song.
To this end, the project challenges students to devise a way to answer, with statistical
justification, the research question “Are misses occurring completely at random throughout the
song or are they grouped in specific regions?” While this may not be the best, and is certainly not
the only, research question pertaining to the video game, it provides a starting point that students
can intuitively grasp. The project consists of several parts administered throughout the semester
and is outlined in the following subsections. Each subsection corresponds to a separate assigned
piece of the course project; the actual assignment sheets distributed to the class are available in
the supplementary materials/appendix. Students should be required to work with a partner or in
small groups so that they may discuss ideas with others to foster a collaborative learning
environment. In our experience, having a member that has some experience with programming
(in R or any other language) in each group will be beneficial during the sections of the project
that are more computationally intensive (such as the parts described in Sections 3.2 and 3.5).
Students working in larger groups (3 or more students) should be required to submit more than
one method for addressing the research question, and all groups should be encouraged to submit
more than one method as this allows for an interesting comparison of their methods at the later
stages of the project. We note that when referring to misses in a song being "completely at
random", we are considering these misses to be a sequence of i.i.d. Bernoulli trials with a
constant probability of missing each note (p). For simplicity, songs that have misses that do not
occur completely at random are referred to as "grouped" or "patterned" misses.
3.1 Developing Methodology to Identify Patterns of Missed Notes
This first step of the project should be assigned towards the beginning of the semester or shortly
after students are introduced to the concepts of statistical estimation. We ask the students to think
of a song as a sequence of 0‟s and 1‟s, where the 1‟s represent notes that are missed. The
students‟ task is to devise at least one way of quantitatively measuring the degree to which
missed notes in a song are not missed completely at random based on this sequence of 0‟s and
1‟s. (It is important to note that the information provided at the end of the song does not include
a note-by-note breakdown of hits and misses like this but simply reports the number of hits.)
As there are potentially many different ways to approach this problem, students need to
effectively communicate why they believe their methods will be useful. At this stage the focus
should be on brainstorming intuitive procedures and not necessarily on methods that have good
statistical properties. The students should test their methods on a few short simulated “practice
songs” such as those provided in Table 1. Ideally, they should devise methods that give values
that indicate more grouping for Song B and less in Song A. These practice songs were chosen to
have differing lengths to emphasize to students that their methods should not rely on all songs
having the same length (and certainly “real” songs will have more than 20 notes).
Journal of Statistics Education, Volume 19, Number 3(2011)
5
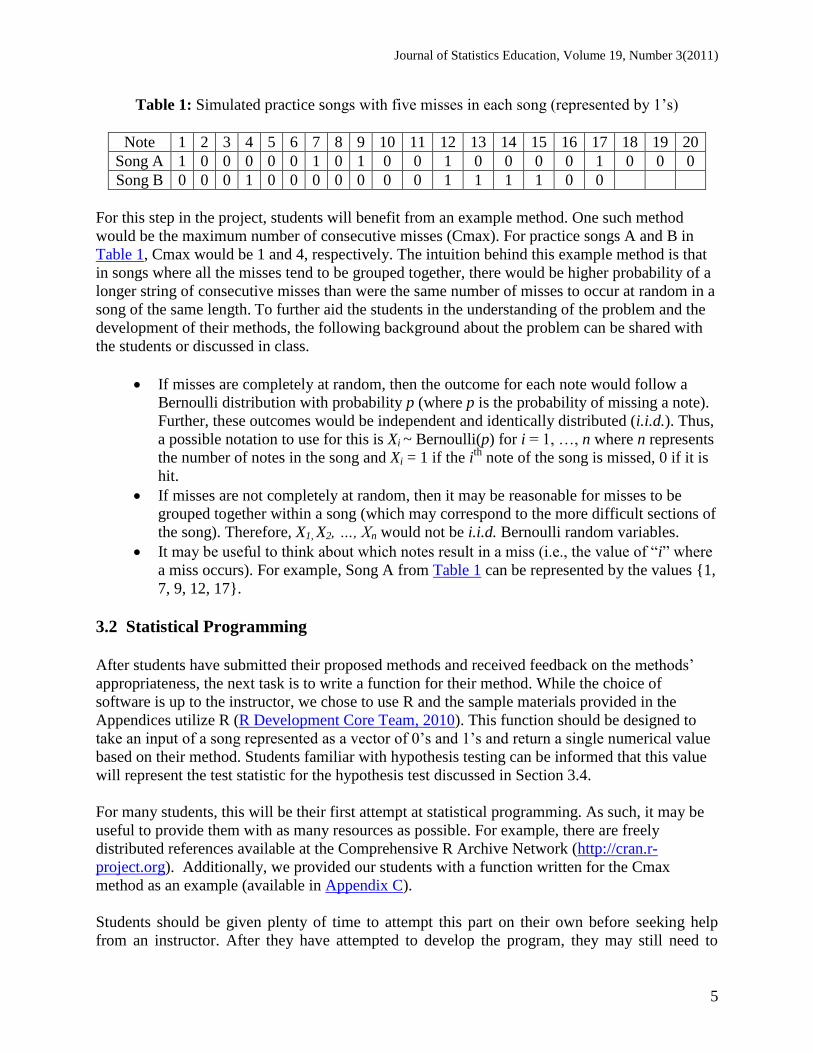
Table 1: Simulated practice songs with five misses in each song (represented by 1‟s)
Note 1 2 3 4 5 6 7 8 9 10 11 12 13 14 15 16 17 18 19 20
Song A 1 0 0 0 0 0 1 0 1 0 0 1 0 0 0 0 1 0 0 0
Song B 0 0 0 1 0 0 0 0 0 0 0 1 1 1 1 0 0
For this step in the project, students will benefit from an example method. One such method
would be the maximum number of consecutive misses (Cmax). For practice songs A and B in
Table 1, Cmax would be 1 and 4, respectively. The intuition behind this example method is that
in songs where all the misses tend to be grouped together, there would be higher probability of a
longer string of consecutive misses than were the same number of misses to occur at random in a
song of the same length. To further aid the students in the understanding of the problem and the
development of their methods, the following background about the problem can be shared with
the students or discussed in class.
If misses are completely at random, then the outcome for each note would follow a
Bernoulli distribution with probability p (where p is the probability of missing a note).
Further, these outcomes would be independent and identically distributed (i.i.d.). Thus,
a possible notation to use for this is Xi ~ Bernoulli(p) for i = 1, …, n where n represents
the number of notes in the song and Xi = 1 if the ith
note of the song is missed, 0 if it is
hit.
If misses are not completely at random, then it may be reasonable for misses to be
grouped together within a song (which may correspond to the more difficult sections of
the song). Therefore, X1, X2, …, Xn would not be i.i.d. Bernoulli random variables.
It may be useful to think about which notes result in a miss (i.e., the value of “i” where
a miss occurs). For example, Song A from Table 1 can be represented by the values {1,
7, 9, 12, 17}.
3.2 Statistical Programming
After students have submitted their proposed methods and received feedback on the methods‟
appropriateness, the next task is to write a function for their method. While the choice of
software is up to the instructor, we chose to use R and the sample materials provided in the
Appendices utilize R (R Development Core Team, 2010). This function should be designed to
take an input of a song represented as a vector of 0‟s and 1‟s and return a single numerical value
based on their method. Students familiar with hypothesis testing can be informed that this value
will represent the test statistic for the hypothesis test discussed in Section 3.4.
For many students, this will be their first attempt at statistical programming. As such, it may be
useful to provide them with as many resources as possible. For example, there are freely
distributed references available at the Comprehensive R Archive Network (http://cran.r-
project.org). Additionally, we provided our students with a function written for the Cmax
method as an example (available in Appendix C).
Students should be given plenty of time to attempt this part on their own before seeking help
from an instructor. After they have attempted to develop the program, they may still need to
Journal of Statistics Education, Volume 19, Number 3(2011)
6
schedule a meeting with the instructor to fix any errors and solve any remaining issues.
However, to ensure that students give an honest attempt to solve the problem, it is suggested that
they provide their attempted code (electronically) in advance of meeting with the instructor to
demonstrate that they have attempted the program.
3.3 Collecting Data (Optional)
Having students attempt to collect data from their own experiences with Guitar Hero can be
beneficial in teaching them the difficulties of collecting accurate data and the importance of
being able to simulate a problem. Playing together as a class also gives students who have never
played Guitar Hero the opportunity to better understand the research question. If the data are
collected together as a class, instructors will need access to a video game console, a game and
controller from the Guitar Hero series, and a television monitor or projector screen that can be
used to display the game. Further, as the students will presumably be unable to keep up with the
pace of the song if they attempt to record the results by hand, some type of recording device
(such as a webcam) will be needed to help accurately collect the data. Because it may be
infeasible for some classes to collect their own data, we have provided data from several songs in
Appendix B as well as a short video clip illustrating the typical type of information students have
available to them for recording the note-by-note data. In our experience, it is not necessary to do
this during a class period as many students are still willing to help collect data if a time outside
of class is used to play. However, to continue developing a sense of collaborative learning, it is
worthwhile scheduling a common time for students (and instructors) to meet when doing this.
After the song has been recorded, students can go back and replay the recording at a slower
speed to record whether each note is a hit or a miss. Instructors can take this opportunity to start
a discussion with the students about how it is often the case that collecting large amounts of
accurate data can be a very difficult task and thus how simulating data from a reasonable model
can be extremely useful when developing methods to analyze data. One potential goal at this
stage is to have students better understand the need for simulated data and its connection to real
world problems. In addition to recording the series of hits and misses for the song, students may
wish to record the name and artist of the song, name of the player, and the skill level the song is
played at. This additional information may help students begin to develop additional research
questions towards the end of the project. For example, students may suspect that there may be a
relationship between the skill level of the player and the pattern (or lack thereof) of missed notes.
Having already collected this additional information for the song may help students begin to
answer this question.
3.4 Resampling-Based Hypothesis Testing
At this point students will have access to data collected from actual songs and an R program that
will return a value representing the numerical measure of randomness of misses associated with
their method. They next proceed to the hypothesis test of
H0: Notes are missed completely at random (i.e., misses follow a sequence of i.i.d.
Bernoulli trials)
HA: Notes are not missed completely at random.

Journal of Statistics Education, Volume 19, Number 3(2011)
7
As most of the students‟ methods will probably be designed such that the sampling distribution
of their test statistic is unknown, they will need to use a permutation test (Fisher, 1937) or
statistical bootstrap method (Efron and Tibshirani, 1993) to test the hypotheses for each song that
was collected in Section 3.3 (or those provided in Appendix B). Although different methods are
available, for many students this may be the first time they use such methods and should focus
on one of the more basic methods. In particular, we suggest at least one of the following three:
resampling without replacement from the original song (permutation test), resampling with
replacement from the original song (nonparametric bootstrap), or generating a sequence of i.i.d.
Bernoulli trials where the probability of a miss is equal to that observed in the song being tested
(parametric bootstrap). There are subtle, yet important, differences among these procedures. For
example, the permutation test will ensure that each generated sample has the same number of
missed notes as the original song and will place them at random throughout the song. The
nonparametric bootstrap and the i.i.d. Bernoulli trials will not ensure the same number of missed
notes as the original song. A variation of this project described in Section 4 discusses how the
project can be modified so that students can explore these differences in more depth.
In addition to learning the mechanics of the chosen method(s), students should understand how
to extend their R functions to
1. Generate a sample consistent with the null hypothesis.
2. Collect and store the value of the test statistic for the generated sample.
3. Repeat steps 1 and 2 a total of B times (where B represents the total number of samples
generated). Generally, the value of B will be fairly large, such as 1,000 or 5,000.
4. Compare the actual test statistic (resulting from the song) to the resulting sampling
distribution and obtain a p-value.
5. Use their p-value to make an appropriate conclusion about the null and alternative
hypotheses within the context of the problem.
After students have completed these steps, have them share with the class their conclusions for
each song. Given the wide array of methods they have developed, it is likely that different
methods will have conflicting conclusions for the same songs. This should be used to start a
discussion about how to evaluate which method(s) may be the better and more reliable
technique(s) to use. This will lead to conducting a power study in the next step of the project.
3.5 Evaluating Method using a Simulation-Based Power Study
In this step, students will conduct a small-scale simulation-based power study to evaluate their
proposed methods and learn how to describe the strengths and weaknesses of their approaches.
This task will involve learning how to use results from multiple simulated datasets under several
different scenarios of patterned missed notes to provide Monte Carlo approximations to the
statistical power using their testing method. This can be done by using simulation to generate
Journal of Statistics Education, Volume 19, Number 3(2011)
8
multiple datasets from each scenario, obtaining the p-value for each using their method (similar
to Section 3.4), and (for a specified level of ) determining the approximate power by
calculating the proportion of obtained p-values less than .
Most Mathematical Statistics textbooks demonstrate statistical power through specific examples
involving the common distributions such as the Normal distribution (see for example Hogg and
Tanis, 2010; Rice, 2007; Wackerly, Mendenhall, and Scheaffer, 2008). Students should be taught
how to extend the basic definition of power to the probability of rejecting the null hypothesis
given a specific alternative scenario. This allows students to shift their understanding of power
from always concerning specific parameter values (as it is often introduced) to the more basic
mechanism that produces the data. As a result, regardless of the techniques students use in the
class, they can all make valid comparisons to other methods based on the same set of alternative
conditions.
While there are presumably many ways in which patterned misses can occur, a limited set of
scenarios should be considered for this project. For our class, we generated misses according to
the following scenarios:
1. Sections with Differing Amounts of Difficulty
o Create songs with sections that will differ in their difficulty and specify the
probability of missing a note in that section.
o For example, the probability of missing a note might be p = 0.01 in “easy” sections,
but would be higher in the “medium,” “hard,” and “very hard” sections.
o The misses in one or more sections could be uncorrelated or correlated.
2. Autoregressive model of order one – AR(1)
o Correlation between note i and j for i,j = 1, …, N is |i-j|
. For example, suppose =
0.5, then the correlation between notes 1 and 2 is 0.5, between notes 1 and 3 is 0.52 =
0.25 and so on.
3. Negative Pairwise correlations
o Correlation between note i and i+1 for i = 1, …, N-1 is
o should be chosen to be a low to moderate value such as -0.3.
We note that in Scenarios 2 and 3 the overall probability of missing a note remains the same
throughout the “song”, while the probability of missing a note in Scenario 1 depends upon the
section of the song. After choosing the alternative scenarios, a discussion can be started with the
students as to how each scenario relates back to the game (i.e., How would something like this
happen in the game?). For example, Scenario 1 most closely resembles our intuition about the
game and the motivation for this project. The model described in Scenario 2 represents a
situation in which the current note impacts all other notes, but to a lesser degree as the notes
become further separated (i.e., if you miss the current note then you might miss subsequent notes
because you are in “catch-up mode”). In Scenario 3, the current note is directly correlated with
only the next note; specifically, if the ith
note is hit, the i+1th
note is more likely to be missed.
Scenario 3 is likely the least intuitive of these three types of non-randomness. This scenario
could model a situation in which the player‟s hand is in the correct position to hit one note (i.e.,
green fret button) but out of position for another note (i.e., orange fret button). Sample code for
simulating data under these three scenarios can be found in Appendix D. Alternatively, one could
Journal of Statistics Education, Volume 19, Number 3(2011)
9
try to estimate for each song tested in Section 3.3 and generate data similar to what was
actually collected.
In addition to the above scenarios that are consistent with the alternative hypothesis (misses do
not occur completely at random), students should evaluate their method with data generated
under the null hypothesis (misses occur completely at random). This is because many students
will produce methods when using the simple bootstrap techniques that have a larger type I error
rate than is expected. Inflated type I error rates are a common feature for the percentile based
bootstrap methods that are typically first introduced to students (Schenker, 1985). This issue
provides an interesting twist to students trying to determine which method is better (as these
methods tend to have much higher power for the patterned misses scenarios as well). Students
will need to make a decision as to how to balance inflated type I error rates with high power to
determine what they feel is the best method.
As generating the data for Scenarios 2 and 3 can potentially require advanced statistical theory, it
may be too difficult for some students (in particular, undergraduate students). We suggest that
instructors generate the test datasets for these scenarios themselves and provide the test datasets
and sample code to the students to obtain measures of their methods‟ power. This will help
ensure that the students can focus on what the study is supposed to investigate instead of being
bogged down by computational issues. It is more realistic for students to write a program to
generate data from Scenario 1 without incurring an excessive amount of extra work and to
generate data consistent with the null hypothesis. Simulating datasets consistent with the null and
alternative hypotheses is an important component of the power simulation process. Undertaking
this process should help students develop a better understanding of power and power
simulations.
The example code in Appendix D is designed in this fashion.
3.6 Dissemination
As students near completion of the project, they will need to disseminate their findings to an
appropriate audience. This can be done in the form of a written report and/or a presentation (oral
or poster). For the written report, students can be encouraged to use LaTeX to write their report
to gain experience in using mathematical typesetting languages. They should be informed that
the intended audience for the report is someone who has a Mathematical Statistics background,
but would not be familiar with the specifics of the project. Additionally, there are several
potential venues for presenting their work, including in-class presentations, campus- or college-
wide undergraduate research symposiums, or undergraduate mathematics conferences.
The written report should be formatted like a scholarly article. The introduction should consist of
a brief description of the research question and the goals of the project. Students should also
introduce the dataset(s) and provide a brief outline of the remainder of the report. The
methodology section is likely the most important section of the written report as this is where the
students describe the methods they created and why those methods should work. The section
describing the power study should summarize their results (in a table) and provide a description
of their findings, including a comparison of the different methods that they devised. In the
Journal of Statistics Education, Volume 19, Number 3(2011)
10
application section, they discuss application of their methods to the actual songs and provide the
appropriate statistical conclusions for each song. Major findings and conclusions are summarized
in the discussion, including under which scenarios each method performs best, which method is
the overall “best”, and any ideas they have for extending or modifying the project. All of their R
code, with appropriate comments, could be included in an appendix. A sample student written
report (http://www.amstat.org/publications/jse/v19n3/ramler/StudentPaper.docx.) is available as an
example.
An additional (or alternative) oral or poster presentation may be used to provide another method
for students to disseminate their work. If students work in smaller groups or don‟t have many
methods to discuss, combining groups together would allow them to present necessary
background information common to each group and to provide a larger collection of methods to
evaluate as the “best”. While we did not make this an actual step of our project, we had several
students who wanted to present their work at a local undergraduate mathematics conference and
our own university‟s campus-wide research symposium. These students felt that the presentation
helped them to better understand the project and how the different components of the project fit
together. In grading the final projects, we tended to agree with them. A sample student created
poster (http://www.amstat.org/publications/jse/v19n3/ramler/StudentPoster.pdf.) is available as an
example.
3.7 Notes on Assessment and Time Frame
Since most students are just being introduced to the concepts involved in statistical research,
many of their methods may not perform well (i.e., have high statistical power) for the scenarios
we describe. Considering that there are many different types of scenarios possible, it could be
that the method the students created would work well for something they didn‟t specifically
investigate. Thus, this project should not be graded on how well the students‟ methodologies
perform for the actual songs and scenarios used in the power study. Instead, the focus on grading
should be on how well students communicate their ideas, including a detailed description about
the intuitive reasoning as to why their method should work, and whether they are following the
research process. This should ensure that students make an honest attempt at each stage of the
project, but reduces the pressure and apprehension commonly associated with open-ended style
problems.
With the exception of explaining each phase of the project when distributing the assignment
sheets, we spent very little time in class on the project. An instructor interested in implementing
this project could follow our model or devote more class time to the project, as they feel is
appropriate. We note, however, that in our class we devote a lecture or two introducing
randomization and bootstrap methods. Instructors who do not currently cover these materials
may want to provide more background on these methods before assigning the part described in
Section 3.4.
In our implementation of the project, students were given roughly two weeks to develop their
method (outside of class). As this is likely the most difficult aspect of the project, a longer
timeframe would be reasonable. Towards the end of this time frame, we met outside of class to
collect data. This gave students the opportunity to discuss their ideas while watching the game
Journal of Statistics Education, Volume 19, Number 3(2011)
11
being played, possibly allowing them to generate new ideas. After the students‟ had their
methods approved by the instructor, they were given a month to work on their R programs. For
the first two weeks, they were required to work on their programs themselves, and in the
following two weeks, each group scheduled a meeting with the instructor to receive assistance.
We gave students only a week to complete the hypothesis test portion, as once the function has
been written, using it is straightforward. The students were given roughly two weeks to complete
their power study. Students can begin working on the written component of the project as soon
as the power simulation is completed (if not earlier). Our students submitted their written reports
on the last day of the semester and had two weeks between the completion of the power
simulation and the deadline for the report. We note that while the project lasted the whole
semester, students were not actively working on the project the entire time. Because there were
periods of down-time between some components of the project, interested instructors could
streamline the project to fit in the final month(s) of the semester. An advantage to our timeline is
that students were working on the various components soon after they were covered in the
course, allowing them to immediately see the connections between the course material and a
research project.
4. Modifications and Shortcuts
As presented above, this project was designed as a semester long project for an upper-level
undergraduate mathematical statistics course. However, there are several ways in which the
project could be modified to allow for a shorter timeline or to make it appropriate for other
undergraduate, or even graduate, statistics courses. We describe a few of these alternatives in this
section.
One of the hardest components of this project is methodology development. In our experience, it
often takes students some time to understand the project well enough to develop a method for
numerically summarizing the “non-randomness” of missed notes in a song. This step of the
project, and the frustration associated with it, could be avoided by providing students with a list
of potential methods (see Appendix C) and letting them choose one or more of those methods to
investigate. Alternatively, students could review literature for existing methods that could be
used or easily adapted, such as the Runs test (Wald and Wolfowitz, 1940), for this type of
problem. These methods could then either be used directly or could allow for a basis of
comparison for their proposed methods. Depending upon what is most appropriate for the
course, students could still write the R functions for the hypothesis test. A modification of this
nature would be useful for teaching resampling techniques and power simulations. Alternatively,
this modification could be treated as an in-class activity for illustrating computational statistical
methods.
Again, as methodology development is likely the hardest component of the project, students
could investigate the differences between the three possible resampling techniques described in
Section 3.4 (randomization, non-parametric bootstrap, and parametric bootstrap) rather than
compare the performance of multiple methods. This modification would remove some of the
pressure of developing methods but help students develop a better understanding of the different
randomization techniques. As with the previous modification, this could be used either as a
project or an in-class example.
Journal of Statistics Education, Volume 19, Number 3(2011)
12
Aspects of this project could also make a great exercise for a statistical computing course. We
found that a number of our students had some programming experience in languages other than
R. These students were comfortable thinking algorithmically and would generally have no
problem writing a function that calculated their test statistic. However, most of the functions did
not make use of many built-in R functions and used loops rather than R‟s vectorization
capabilities. Students in a statistical computing course could be given the methodology
description (possibly along with “clunky” R code) and learn how to use R functions to program
those same methods more efficiently.
There are also many ways that ideas from this project could be incorporated into graduate-level
statistics courses. Writing functions for the methods or to generate correlated data could be
useful exercises in a statistical computing course. The resampling methods and power
simulations could be appropriate for many different graduate-level courses, including statistical
computing courses, mathematical statistics courses, and other applied courses. Additionally,
young graduate students can benefit from seeing a relatively small-scale research project before
undertaking their own research.
5. Conclusion
By the end of the project, students may begin to recognize additional questions that can be raised
from this study. For example, some will suspect that the amount of non-randomness in the
pattern of misses may also be related to the skill level of the player. Additionally, students may
recognize that the conclusions they make from their project don‟t actually answer the original
(broad) research question “Are notes missed completely at random?”, but rather only pertain to a
certain song played by a specific individual. These concepts (and many others that the students
may wish to explore) would make a great extension of the project for students wishing to
continue through independent studies. This project can be modified to fit different timelines and
other undergraduate, or even graduate-level, statistics courses. Although the project outlined here
is specifically designed for the Guitar Hero video game series, the general steps outlined in
Section 3 can be applied to any number of projects in which students learn about the statistical
research process as well as how to develop and evaluate their own methodology.
While we did not formally survey the students on their opinions on the project, we did receive a
few comments on the end-of-semester course evaluations about the project. Some students
commented that undergoing the project helped to “tie together” the material covered in the
course. Others stated that the project added “an element of fun” to the course. Of course, not all
students loved the project. For instance, one student commented that the project was “overkill”
as they already had enough practice with programming skills in class and on homework
assignments. Another student expressed concern about groups of four students being too large
(“it was really hard to find a time where all four of us could get together”). Our impression is
that, overall, students enjoyed the project and appreciated the challenges that it presented. This
is perhaps best illustrated by our favorite student quote: “This course was the first stat course that
let me think like a statistician.”
Journal of Statistics Education, Volume 19, Number 3(2011)
13
Appendix A
Handouts for Each Phase of the Project
Part 1: Development of Methodology
(http://www.amstat.org/publications/jse/v19n3/ramler/Part1_MethodAssignment.docx)
Part 2: R Functions
(http://www.amstat.org/publications/jse/v19n3/ramler/Part2_RFunction.docx)
Part 3: Hypothesis Tests
(http://www.amstat.org/publications/jse/v19n3/ramler/Part3_HypothesisTest.docx)
Part 4: Power Simulation
(http://www.amstat.org/publications/jse/v19n3/ramler/Part4_PowerSimulation.docx)
Part 5: Final Paper
(http://www.amstat.org/publications/jse/v19n3/ramler/Part5_FinalReport.docx)
Journal of Statistics Education, Volume 19, Number 3(2011)
14
Appendix B
Songs
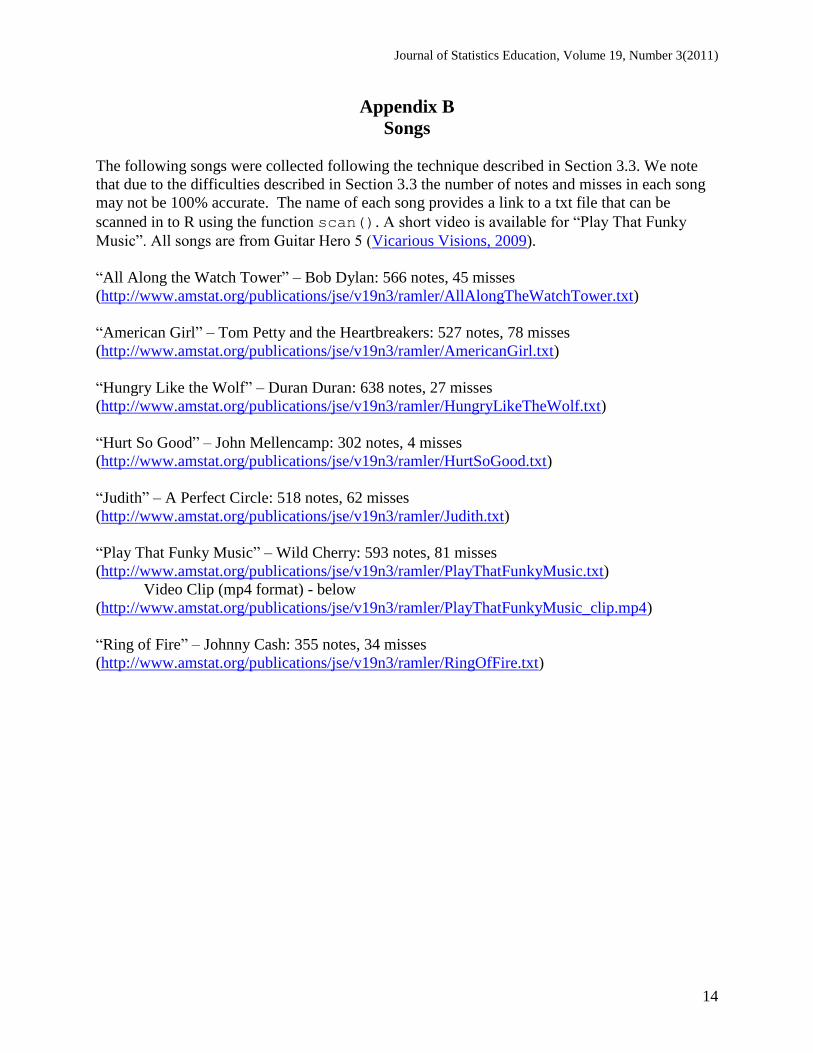
The following songs were collected following the technique described in Section 3.3. We note
that due to the difficulties described in Section 3.3 the number of notes and misses in each song
may not be 100% accurate. The name of each song provides a link to a txt file that can be
scanned in to R using the function scan(). A short video is available for “Play That Funky
Music”. All songs are from Guitar Hero 5 (Vicarious Visions, 2009).
“All Along the Watch Tower” – Bob Dylan: 566 notes, 45 misses
(http://www.amstat.org/publications/jse/v19n3/ramler/AllAlongTheWatchTower.txt)
“American Girl” – Tom Petty and the Heartbreakers: 527 notes, 78 misses
(http://www.amstat.org/publications/jse/v19n3/ramler/AmericanGirl.txt)
“Hungry Like the Wolf” – Duran Duran: 638 notes, 27 misses
(http://www.amstat.org/publications/jse/v19n3/ramler/HungryLikeTheWolf.txt)
“Hurt So Good” – John Mellencamp: 302 notes, 4 misses
(http://www.amstat.org/publications/jse/v19n3/ramler/HurtSoGood.txt)
“Judith” – A Perfect Circle: 518 notes, 62 misses
(http://www.amstat.org/publications/jse/v19n3/ramler/Judith.txt)
“Play That Funky Music” – Wild Cherry: 593 notes, 81 misses
(http://www.amstat.org/publications/jse/v19n3/ramler/PlayThatFunkyMusic.txt)
Video Clip (mp4 format) - below
(http://www.amstat.org/publications/jse/v19n3/ramler/PlayThatFunkyMusic_clip.mp4)
“Ring of Fire” – Johnny Cash: 355 notes, 34 misses
(http://www.amstat.org/publications/jse/v19n3/ramler/RingOfFire.txt)
Journal of Statistics Education, Volume 19, Number 3(2011)
15
Appendix C
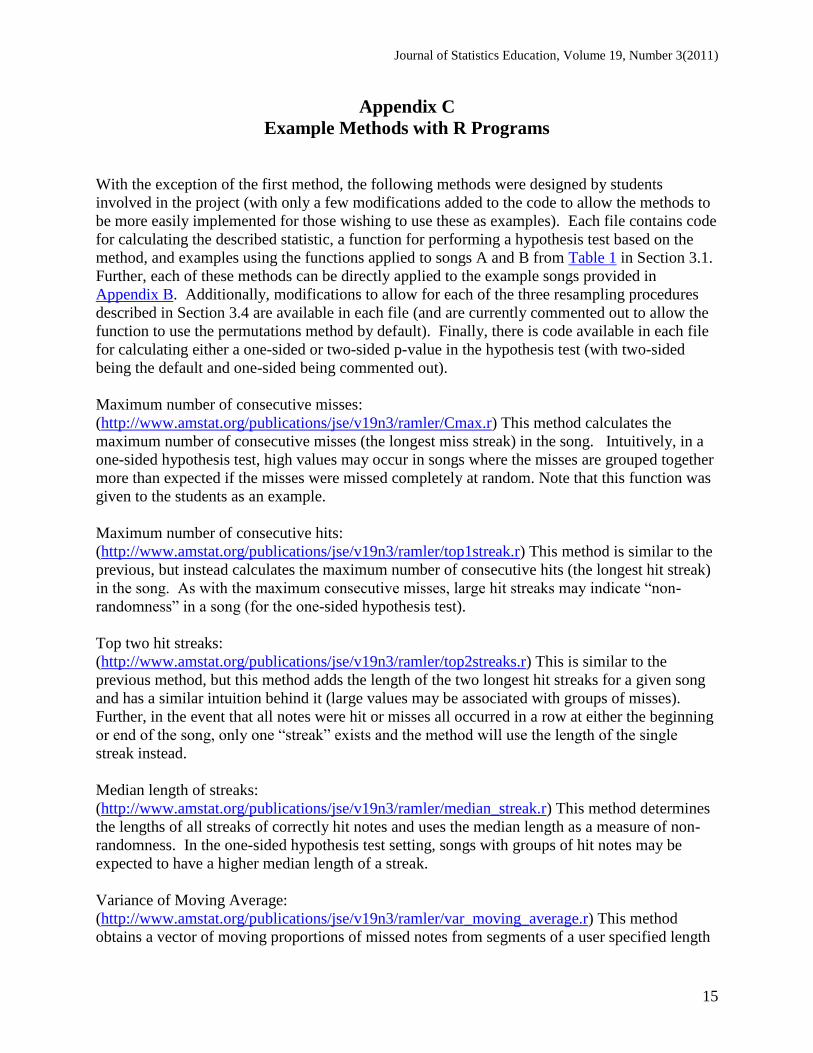
Example Methods with R Programs
With the exception of the first method, the following methods were designed by students
involved in the project (with only a few modifications added to the code to allow the methods to
be more easily implemented for those wishing to use these as examples). Each file contains code
for calculating the described statistic, a function for performing a hypothesis test based on the
method, and examples using the functions applied to songs A and B from Table 1 in Section 3.1.
Further, each of these methods can be directly applied to the example songs provided in
Appendix B. Additionally, modifications to allow for each of the three resampling procedures
described in Section 3.4 are available in each file (and are currently commented out to allow the
function to use the permutations method by default). Finally, there is code available in each file
for calculating either a one-sided or two-sided p-value in the hypothesis test (with two-sided
being the default and one-sided being commented out).
Maximum number of consecutive misses:
(http://www.amstat.org/publications/jse/v19n3/ramler/Cmax.r) This method calculates the
maximum number of consecutive misses (the longest miss streak) in the song. Intuitively, in a
one-sided hypothesis test, high values may occur in songs where the misses are grouped together
more than expected if the misses were missed completely at random. Note that this function was
given to the students as an example.
Maximum number of consecutive hits:
(http://www.amstat.org/publications/jse/v19n3/ramler/top1streak.r) This method is similar to the
previous, but instead calculates the maximum number of consecutive hits (the longest hit streak)
in the song. As with the maximum consecutive misses, large hit streaks may indicate “non-
randomness” in a song (for the one-sided hypothesis test).
Top two hit streaks:
(http://www.amstat.org/publications/jse/v19n3/ramler/top2streaks.r) This is similar to the
previous method, but this method adds the length of the two longest hit streaks for a given song
and has a similar intuition behind it (large values may be associated with groups of misses).
Further, in the event that all notes were hit or misses all occurred in a row at either the beginning
or end of the song, only one “streak” exists and the method will use the length of the single
streak instead.
Median length of streaks:
(http://www.amstat.org/publications/jse/v19n3/ramler/median_streak.r) This method determines
the lengths of all streaks of correctly hit notes and uses the median length as a measure of non-
randomness. In the one-sided hypothesis test setting, songs with groups of hit notes may be
expected to have a higher median length of a streak.
Variance of Moving Average:
(http://www.amstat.org/publications/jse/v19n3/ramler/var_moving_average.r) This method
obtains a vector of moving proportions of missed notes from segments of a user specified length
Journal of Statistics Education, Volume 19, Number 3(2011)
16
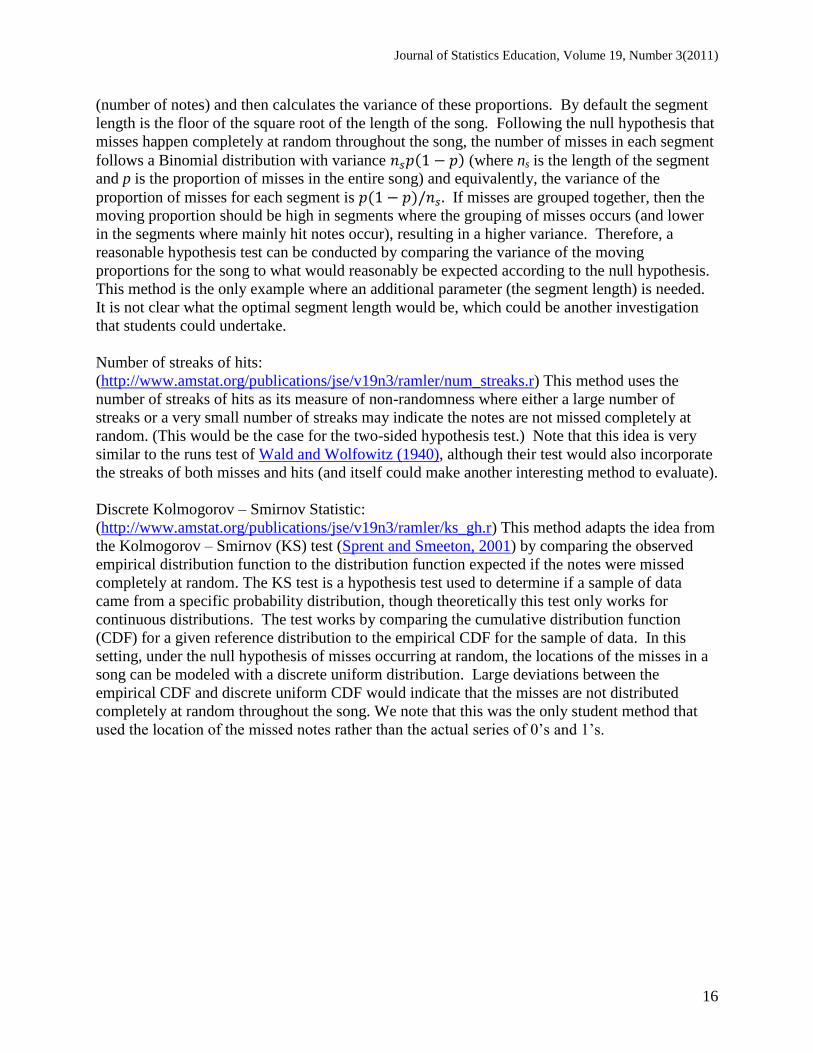
(number of notes) and then calculates the variance of these proportions. By default the segment
length is the floor of the square root of the length of the song. Following the null hypothesis that
misses happen completely at random throughout the song, the number of misses in each segment
follows a Binomial distribution with variance ( ) (where ns is the length of the segment
and p is the proportion of misses in the entire song) and equivalently, the variance of the
proportion of misses for each segment is ( ) If misses are grouped together, then the
moving proportion should be high in segments where the grouping of misses occurs (and lower
in the segments where mainly hit notes occur), resulting in a higher variance. Therefore, a
reasonable hypothesis test can be conducted by comparing the variance of the moving
proportions for the song to what would reasonably be expected according to the null hypothesis.
This method is the only example where an additional parameter (the segment length) is needed.
It is not clear what the optimal segment length would be, which could be another investigation
that students could undertake.
Number of streaks of hits:
(http://www.amstat.org/publications/jse/v19n3/ramler/num_streaks.r) This method uses the
number of streaks of hits as its measure of non-randomness where either a large number of
streaks or a very small number of streaks may indicate the notes are not missed completely at
random. (This would be the case for the two-sided hypothesis test.) Note that this idea is very
similar to the runs test of Wald and Wolfowitz (1940), although their test would also incorporate
the streaks of both misses and hits (and itself could make another interesting method to evaluate).
Discrete Kolmogorov – Smirnov Statistic:
(http://www.amstat.org/publications/jse/v19n3/ramler/ks_gh.r) This method adapts the idea from
the Kolmogorov – Smirnov (KS) test (Sprent and Smeeton, 2001) by comparing the observed
empirical distribution function to the distribution function expected if the notes were missed
completely at random. The KS test is a hypothesis test used to determine if a sample of data
came from a specific probability distribution, though theoretically this test only works for
continuous distributions. The test works by comparing the cumulative distribution function
(CDF) for a given reference distribution to the empirical CDF for the sample of data. In this
setting, under the null hypothesis of misses occurring at random, the locations of the misses in a
song can be modeled with a discrete uniform distribution. Large deviations between the
empirical CDF and discrete uniform CDF would indicate that the misses are not distributed
completely at random throughout the song. We note that this was the only student method that
used the location of the missed notes rather than the actual series of 0‟s and 1‟s.
Journal of Statistics Education, Volume 19, Number 3(2011)
17
Appendix D
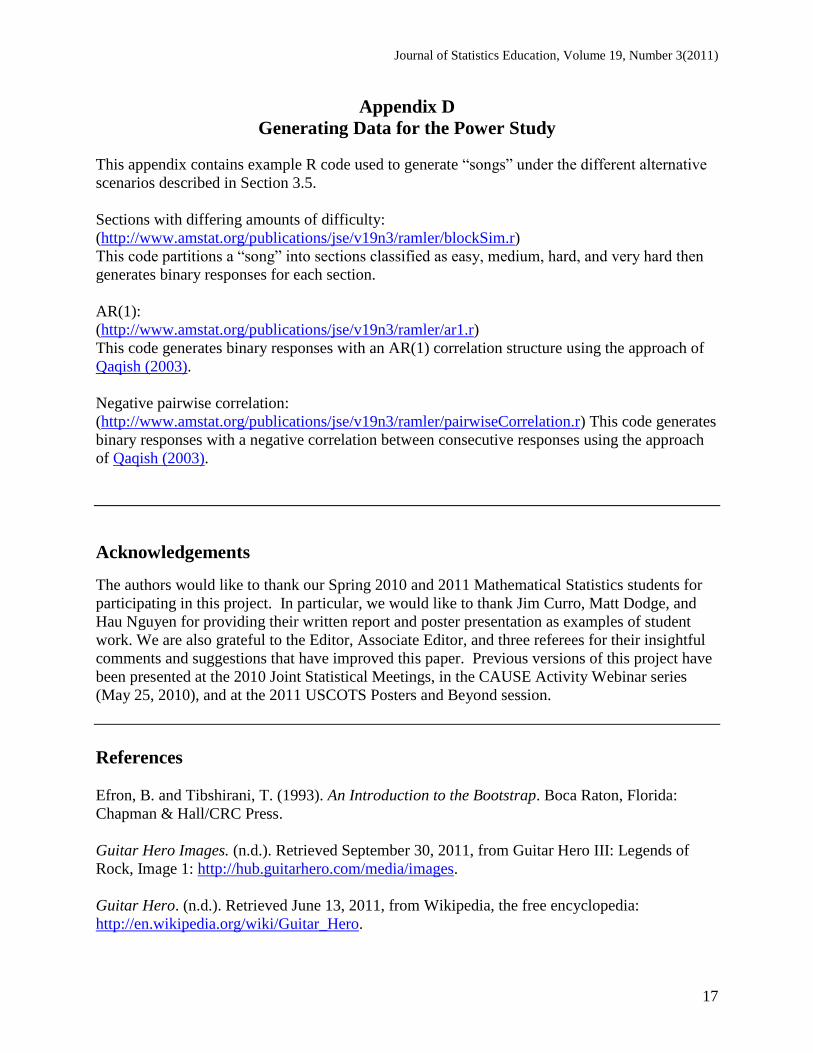
Generating Data for the Power Study
This appendix contains example R code used to generate “songs” under the different alternative
scenarios described in Section 3.5.
Sections with differing amounts of difficulty:
(http://www.amstat.org/publications/jse/v19n3/ramler/blockSim.r)
This code partitions a “song” into sections classified as easy, medium, hard, and very hard then
generates binary responses for each section.
AR(1):
(http://www.amstat.org/publications/jse/v19n3/ramler/ar1.r)
This code generates binary responses with an AR(1) correlation structure using the approach of
Qaqish (2003).
Negative pairwise correlation:
(http://www.amstat.org/publications/jse/v19n3/ramler/pairwiseCorrelation.r) This code generates
binary responses with a negative correlation between consecutive responses using the approach
of Qaqish (2003).
Acknowledgements
The authors would like to thank our Spring 2010 and 2011 Mathematical Statistics students for
participating in this project. In particular, we would like to thank Jim Curro, Matt Dodge, and
Hau Nguyen for providing their written report and poster presentation as examples of student
work. We are also grateful to the Editor, Associate Editor, and three referees for their insightful
comments and suggestions that have improved this paper. Previous versions of this project have
been presented at the 2010 Joint Statistical Meetings, in the CAUSE Activity Webinar series
(May 25, 2010), and at the 2011 USCOTS Posters and Beyond session.
References
Efron, B. and Tibshirani, T. (1993). An Introduction to the Bootstrap. Boca Raton, Florida:
Chapman & Hall/CRC Press.
Guitar Hero Images. (n.d.). Retrieved September 30, 2011, from Guitar Hero III: Legends of
Rock, Image 1: http://hub.guitarhero.com/media/images.
Guitar Hero. (n.d.). Retrieved June 13, 2011, from Wikipedia, the free encyclopedia:
http://en.wikipedia.org/wiki/Guitar_Hero.
Journal of Statistics Education, Volume 19, Number 3(2011)
18
Guitar Hero (Nov. 2, 2005). Retrieved September 30, 2011, from IGN:
http://ps2.ign.com/articles/663/663674p1.html.
Feldman, L. and Morgan, F. (2003). The pedagogy and probability of the dice game HOG.
Journal of Statistics Education, 11(2).
Fisher, R. A. (1937). The Design of Experiments. New York: Hafner.
Hogg, R. V. and Tanis, E. A., (2010). Probability and Statistical Inference (8th ed.). Upper
Saddle River, New Jersey: Pearson Prentice Hall.
Kohler, Chris (2009, December 24). The 15 most influential games of the decade. Wired.
Retrieved June 13, 2011 from http://www.wired.com/gamelife/2009/12/the-15-most-influential-
games-of-the-decade/.
Martinez, M. (2011, February 9). The music dies for once popular „Guitar Hero‟ video game.
CNN. Retrieved June 13, 2011 from http://articles.cnn.com/2011-02-
09/us/guitar.hero.gone_1_music-genre-air-guitar-guitar-center?_s=PM:US.
Morrell, C. H. and Auer, R. E., (2007). Trashball: a logistic regression classroom activity.
Journal of Statistics Education, 15(1). http://
http://www.amstat.org/publications/jse/v15n1/morrell.html
Newman, J. (2011, July 21). Guitar Hero Will Make a Comeback. Technologizer. Retrieved
October 7, 2011 from http://technologizer.com/2011/07/21/guitar-hero-will-make-a-comeback/.
Qaqish, B.F. (2003). A family of multivariate binary distributions for simulating correlated
binary variables with specified marginal means and correlations. Biometrika, 90, 455-463.
R Development Core Team (2010). R: A language and environment for statistical computing. R
Foundation for Statistical Computing, Vienna, Austria. ISBN 3-900051-07-0, URL
http://www.R-project.org.
Rice, J. H. (2007). Mathematical Statistics and Data Analysis (3rd ed.). Belmont, California:
Duxbury.
Rose, M. (2011, April 12). Activision: Guitar Hero not finished, „On Hiatus‟ for now.
Gamasutra. Retrieved June 13, 2011 from
http://www.gamasutra.com/view/news/34060/Activision_Guitar_Hero_Not_Finished_On_Hiatus
_For_Now.php.
Schenker, N. (1985). Qualms about bootstrap confidence intervals. Journal of the American
Statistical Association. 80(390), pp. 360-361.
Journal of Statistics Education, Volume 19, Number 3(2011)
19
Smith, A. (2011, February 10). Guitar Hero gets axed; Activision shares dip 10%. CNN.
Retrieved June 13, 2011 from
http://money.cnn.com/2011/02/10/technology/guitar_hero_activision/index.htm.
Sprent, P. and Smeeton, N.C. (2001). Applied Nonparametric Statistical Methods (3rd ed.). Boca
Raton, Florida: Chapman & Hall/CRC.
Stephenson, P., Richardson, M., Gabrosek, J., and Reischman, D. (2009). How LO can you GO?
Using the dice-based golf game GOLO to illustrate inferences on proportions and discrete
probability distributions. Journal of Statistics Education, 17(2).
http://www.amstat.org/publications/jse/v17n2/stephenson.html
Vicarious Visions (2009). Guitar Hero 5. Ninento Wii. Activision and Red Octane.
Wackerly, D., Mendenhall III, W., and Scheaffer, R. (2008). Mathematical Statistics with
Applications (7th
ed.). Belmont, California: Duxbury.
Wald, A. and Wolfowitz, J. (1940). On a test whether two samples are from the same population,
Annals of Mathematical Statistics 11, 147-162.
Wilson, J., Lawman, J., Murphy, R., and Nelson M. (2011). A comprehensive probability project
for the upper division one-semester probability course using Yahtzee. Journal of Statistics
Education, 19(1). http://www.amstat.org/publications/jse/v19n1/wilson.pdf
Ivan Ramler
St. Lawrence University
Department of Mathematics, Computer Science and Statistics
23 Romoda Dr.
Canton, NY 13617
Phone: (315) 229-5792
Fax: (315) 229-7413
Jessica Chapman
St. Lawrence University
Department of Mathematics, Computer Science and Statistics
23 Romoda Dr.
Canton, NY 13617
Phone: (315) 229-5471

Journal of Statistics Education, Volume 19, Number 3(2011)
20
Volume 19 (2011) | Archive | Index | Data Archive | Resources | Editorial Board | Guidelines for
Authors | Guidelines for Data Contributors | Guidelines for Readers/Data Users | Home Page |
Contact JSE | ASA Publications