introducing the resilience into the state transportation ... · introducing the resilience into the...
TRANSCRIPT

Introducing the Resilience into the State Transportation Network
January 2018 A Research Report from the National Center for Sustainable Transportation
Xiaolong Wu, California State University, Long Beach
About the National Center for Sustainable Transportation
The National Center for Sustainable Transportation is a consortium of leading universities committed to advancing an environmentally sustainable transportation system through cutting-edge research, direct policy engagement, and education of our future leaders. Consortium members include: University of California, Davis; University of California, Riverside; University of Southern California; California State University, Long Beach; Georgia Institute of Technology; and University of Vermont. More information can be found at: ncst.ucdavis.edu.
Disclaimer
The contents of this report reflect the views of the authors, who are responsible for the facts and the accuracy of the information presented herein. This document is disseminated under the sponsorship of the United States Department of Transportation’s University Transportation Centers program, in the interest of information exchange. The U.S. Government and the State of California assumes no liability for the contents or use thereof. Nor does the content necessarily reflect the official views or policies of the U.S. Government and the State of California. This report does not constitute a standard, specification, or regulation. This report does not constitute an endorsement by the California Department of Transportation (Caltrans) of any product described herein.
Acknowledgments
This study was funded by a grant from the National Center for Sustainable Transportation (NCST), supported by USDOT and Caltrans through the University Transportation Centers program. The authors would like to thank the NCST, USDOT, and Caltrans for their support of university-based research in transportation, and especially for the funding provided in support of this project. The author would also like to thank Mr. Veera Venkata Gopi Sai Krishna Tadikamalla (Computer Science graduate student), who participated in this project by gathering data and performing computer simulations!

Introducing the Resilience into the State Transportation Network
A National Center for Sustainable Transportation Research Report
January 2018
Xiaolong Wu, Department of Computer Engineering and Computer Science, California State University, Long Beach

[page left intentionally blank]
i
TABLE OF CONTENTS
EXECUTIVE SUMMARY .....................................................................................................................ii
Introduction .................................................................................................................................... 1
Literature Survey ............................................................................................................................. 2
The California Transportation Network and Its Description........................................................... 5
Model Development and Implementation ..................................................................................... 7
Characteristics of Reliable Routes .............................................................................................. 7
Constructing the Transportation Network Model ...................................................................... 7
Path Betweenness Centrality Index of the Transportation Network Model ............................ 10
Simulation Results ......................................................................................................................... 12
Defining the Network Model Reliability ................................................................................... 12
Describing the Different Paths Failure Strategies ..................................................................... 12
Analysis of the Transportation Network of Northern and Southern California ....................... 13
Conclusion ..................................................................................................................................... 16
References .................................................................................................................................... 17
List of Figures
Figure 1. Adjacency Matrix Graph of Road Model.......................................................................... 8
Figure 2. Network Graph of Road Model ........................................................................................ 9
Figure 3. Path Betweenness Centrality Index of Transportation Network................................... 11
Figure 4. Network Graph with One Path Failure .......................................................................... 13
Figure 5. Network Graph with Two Paths Failure ......................................................................... 14
Figure 6. Network Graph with All Paths Failure ........................................................................... 15
Figure 7. Reliability of Road Model under Different Paths Failure Strategies .............................. 16

ii
Introducing the Resilience into the State Transportation Network
EXECUTIVE SUMMARY
California has been a leader in adopting policies to reduce greenhouse gas emissions. Meanwhile, for too long, businesses have been warning of key routes that are stretched to the breaking point. In many places across California, it takes only a single incident to cause chaos – for instance, a car accident across the intersection of I-5, I-10, and I-101. Fast-paced California businesses demand a transport network that can better cope with accidents, severe weather, not to mention ubiquitous earthquake threats. Therefore, the state is required to provide and maintain an acceptable level of service in the face of faults and any challenges to normal operations. Sacramento should be tasked to immediately identify all of the places where the road and rail networks need urgent attention in their state-wide long-range transportation plans. The transportation network is a key component to providing a better transport service for both people and goods. Reliability, vulnerability and robustness are the major characteristics that can be used to analyze a transport network. The reliability of a transport network is defined as the possibility of moving people or goods from one place to another successfully. Exploring the reliability of a road network has attracted significant attention due to the increase in natural disasters. Such natural disasters not only damage roadway connections, but also paralyze the transportation system for a remarkable period of time. To overcome this disadvantage, the reliability of a transport network can be maintained by closely monitoring and ensuring the safety of critical paths in the network so that the users can always have a reliable route for their commute. Critical paths of a transportation network are the most dependable and used paths of that network. Failure of certain paths or sub-networks, which is caused by car accidents, road maintenance, or serious road congestion, has a severe impact on the reliability of the transportation network. Several methods exist to analyze the reliability of the transport network such as the concept of connection reliability, a network reliability technique to monitor the current traffic status. In this study, a network model is developed to calculate reliability by considering the critical paths of a transportation network using the UCINET simulation tool. The implementation of this network model used two path failure strategies (selective and random) using the Betweenness Centrality as a metric. Our preliminary results show that the UCINET tool can be used to successfully estimate the reliability and to further identify the critical paths of a highway transportation network in California.
1
Introduction
The transportation system is a network system normally composed of three parts: road, railway, and bridge. This system is a critical lifeline for land transport, evacuations, sending disaster fighters and disaster engines, and matter transport. If any earthquake occurred, the bridge and road would suffer different degrees of damage, which will be a negative influence on its service function and would threaten people’s lives. For example, the great Tang San Earthquake in China in 1976, the San Fernando Earthquake in American in 1971, and the Earthquake in Japan in 1995 all caused great damages to their transportation system. These damages included complete blockage of the freeways, bridge collapse and cracks in the road. Since the 1970s, studies of lifeline earthquake engineering systems have been developed to investigate network system damage, function destructiveness analysis, and reduction disaster policy analysis. Therefore, it is important to analyze the reliability of our transportation system at California. For the past four decades, network reliability prediction has been explored extensively. Numerous prediction models and algorithms have been proposed and applied by researchers. With modern technology developments, reliability analysis has become most popular in the research area due to its essential role in the Intelligent Transportation Systems (ITS). As one of the most fundamental inputs in the ITS, critical path information in the recent future is crucial for both 1) the travelers, so that they can make a trip decision, and 2) the traffic management center that develops strategies for operation control. Therefore, a critical path calculation model is needed to analyze reliability of a network. The existing reliability measures are useful for assessing different factors related to the performance of the transportation network. However, none of the existing measures addresses the issue of adequacy of network capacity to accommodate demand. That is, whether the available network capacity relative to the required demand is sufficient. This measure provides important information for efficient flow control, capacity expansion, and other relevant works to enhance the reliability of a road network. It may also have the potential to provide a tool to design road networks that are resistant to traffic disturbances. Only recently was capacity reliability introduced as a new performance measure to evaluate the performance of a degradable road network. It is defined as the probability that the network can accommodate a certain traffic demand at a required service level, while accounting for drivers' route choice behavior. Travel time reliability can also be obtained as a side-product while evaluating the capacity reliability. However, a comprehensive analysis of the capacity reliability was not provided. It can be observed from the past that most of the research primarily focuses on the safety issues of transportation systems. Literature emphasizing transportation reliability is scarce. Since no paper is directly dealing with reliability issues, this project is an effort towards providing an operational reliability assessment model for road transportation system. The scope of this paper is limited to the assessment of the route reliability from the source to the destination.
2
The activities and the major factors affecting the operations since departure of a vehicle from source to destination have been considered. Network system safety is also one of the issues of concern that is considered in the analysis. The whole transportation system is composed of several sub and sub-sub systems; as a result, the complexity of the entire system is at a high dimension level. The major challenge is how to model the decision variables and assess the operational reliability of the transportation system in the domain of the scope as mentioned. The problem can be tackled in case statistical data or information could be obtained about the relevant variables. Availability of statistical data is a primary hindrance here as well, as always in any large-scale system. However, the complexity of the problem magnifies due to the lack of statistical data or the availability of imprecise or vague data. Hence, the fundamental thought of this paper is based on modeling vague or ambiguous information and evaluation of subjective operational reliability. The model proposed in this project, since it depends on expert opinions or their judgment in the form of linguistic terms, is titled as an efficient approach for reliability analysis based on path failure strategies. Overall, this study aims to introduce a successful technique for calculating critical paths of the proposed California transport network by analyzing the reliability of the network, creating a high-level design of the software, utilizing tools and technologies, and describing the modular implementation of the software, testing, and experimentation. More specifically, this work aims to achieve accurate real-time calculation of a betweenness centrality index with a unique combination of reliability analysis and path failure strategies to predict critical paths of a transport network.
Literature Survey
Road network reliability [1], which evaluates the size of the road network endurance in daily and occasional incidents, is used as an evaluation index described by the access probability from one node to another. However, it has only been two decades since the concept of reliability really began to be applied into the traffic system, and its research content has continuously improved as associated with the changes of traffic technology and modes. Connectivity was first proposed by H. Main et al. [1], which reflects the probability to maintain connectivity between nodes in transport networks. Y. Asakura et al. [2], puts forward the concept of travel time reliability in 1991, which is another measure method of network reliability that fully takes into account the travel needs of the road network and traveler behavior. In 1994, A. J. Nicholson et al. [3], defined the recession reliability of the traffic flow, namely the probability for the decline of the Origin-Destination (OD) pair or the traffic flow in the network not exceeding a certain value, and pointed out that one or more road network OD pairs will be directly affected when recession occurs in one road section. W. Lam et al., proposed the conception of demanding satisfaction reliability in 2000, which reflects the ability of providing the potential travel demand for road network, and describes the probability for the
3
travel demand satisfaction rate not less than a particular value [4]. In 2002, M. Bell et al., expanded the travel time reliability to the travel cost reliability [5], including travel time, travel distance, vehicle charges, and public transport costs; if the cost for completing a trip is less than a given threshold value, the corresponding road section is believed to be reliable. In China, based on the growth rules of the simulating tree, Zhu et al., proposed the channel generation method [6], of which all channels are efficient and suitable for large-scale network, discussed the effective channels, sensitivity of road sections and the reliability. For the fallibility factors of the road traffic network, J. Jin explored the reliability of the evaluation system of urban road traffic networks and researched the redundancy and the economy of time and space of the road transport network from the viewpoint of dynamic degeneration [7]. In 2005, H. Lin et al., studied the reliability of transport networks in emergencies and provided the three probability problems usually considered in unexpected situations: the destruction of properties of nodes and sections, repair characteristics of nodes and sections, and the connectivity reliability in emergencies [8]. H. Fan et al., provided the evaluation indexes of network reliability and the calculating model of reliability based on the network topology [9], and determined the arc, path, node, and the calculation method of reliability of the network structure. P. Yuan et al., considered the state of uncertainty of the transportation network under realistic traffic conditions [10], and proposed the change of choice of behavior from uncertain to a deterministic network state and the route choice of the model based on travel time reliability. The traditional connect reliability evaluation method is mainly based on the analysis of the transportation network graph theory; but the transportation network of high density and large scale not only requires a tremendous amount of calculation, it also presents an insensitive reflection of the real situation. Different links of the transportation network have various degrees of influence and possibilities for the function of the whole network. The most influential links with the most possibilities to be destroyed was vital for connect reliability of the transportation network. Hence, to facilitate the connect reliability of the whole network, the improvement of the key links should be put on top of the agenda. The evaluation methods for connect reliability based on the above ideas are put forward by some scholars. A. J. Nicholson et al., have defined two key points about vulnerability concept: using the method of sensitivity analysis and reliability analysis with the identification of the key unit of transportation network, and provides the reliability of network system by improving the key unit [3]. G. D’Este et al., proposed a reliability evaluation method for the key point of a transportation network whose small portion was disastrous [11]. P. Hossain et al., referred to the Birnhaum probability importance and defined the route importance based on the index of consumers’ surplus reliability with which he used to improve network performance through heuristic algorithm as well, but still an enormous calculation for a large-scale network [12]. According to B. Sanso et al., the most important system state should be prioritized to evaluate the reliability of transportation network [13]. It is of vital importance to find out the key link to facilitate the network and optimize the performance with the consideration of random accidents. The so-called critical link refers to those roads with an enormous impact on network performance once they close, especially under the conditions of natural disasters. S. Sanchez et al., defined accessibility index node as the objective of network performance optimization [14]; but the
4
accessibility index cannot reflect the change of demand elasticity. In 2006, L. Haixu et al., based on the key links, raised transportation network optimization theory holding that the key link for the probability of being selected is bigger than a predetermined threshold section [15]. L. Haixu built a transportation network reliability improvement model based on key links using the heuristic method which can identify key links proposed by Taylor, and the improved model is established based on the key links of the transportation network reliability without measure methods on critical link. G. Yong et al., combined the city basic traffic data and started from the actual operation, putting forward a kind of connect reliability evaluation method based on key links and managed to avoid too much computation, but this method did not analyze the influencing factors, which caused the result [16]. It is a kind of afterward result to experience improvement to certain extent, but not for prediction of transportation network performance. H. Liwen et al., considered direct measurement of the relative importance was not feasible, and then he figured out the solution to finding key links based on connect reliability [17]. But the computation of network connect reliability is difficult. Connect reliability analysis method based on the key point is a new way for researching connect reliability, but the key point identification method is not yet mature and is still in the earlier stage of research. In recent years, the rise and development of complex network science provided the theoretical support for varieties of networks’ existence and also provided a way for the study of the transportation network reliability. To distinguish it from general networks, transportation network is a weighted network. That is, the network may have the same structure but the traffic volume is different, thus the important degree obviously varies. We can make use of the dual graph theory to identify the key link with the identification of the key point. Through the analysis of the literature, we can see that the study of reliability of road network has transformed from only considering the physical structure of the road network to that of consideration of loading traffic flow and the mutual influence between travel demand and the capacity of road network, as well as the travel behavior of road users. The corresponding reliability indexes are connectivity reliability and travel time reliability. During this period, some scholars have proposed demand satisfaction reliability, the weak point reliability, performance index reliability, and suffered reliability. In China, research is conducted on the basis of foreign studies, and is the supplement or continuation of foreign study results; there is no significant breakthrough in the road network reliability indexes, and most of the research is on connectivity reliability and travel time reliability. But domestic research has explored the connectivity reliability and travel time reliability from different perspectives and conditions, which widen the thoughts and provide a foundation for further study on this area. Accurate calculation of critical links of a transportation network under various traffic conditions would help us to make better decisions and respond to the trip requirements under adverse traffic condition. This research would focus on two parts: one is to develop an accurate and reliable model for finding critical paths of a transportation network, and the other is to analyze the reliability of a transportation network during natural disasters using path failure strategies.
5
The California Transportation Network and Its Description
The California State Transportation Agency (CalSTA) is solely responsible for the state’s transportation and its related departments. It's a large organized system which is composed of the world's best highways, yet its transportation network is slightly confusing as well as vigorous. The State of California has a large number of interstates and streets in the process of subdivision. The densely populated areas of the state are found with few metros, worker rail, and light rail. Apart from the highly developed roadways, it also has water transportation called Marine Transportation, transportation through air is called as the aerial communication, and finally, rail transport which is a boon to the middle-class people. The creation of the transportation network is not an easy task in the State of California due to its large and dense population and its wide range of available transportation systems. The intercommunication between the critical links plays a vital role in assessing the information of the entire network. The California transport agencies handle the cargo shipments at the Pacific Rim and beyond to transport the goods. Apart from the ground and maritime transportation, the state’s freight transport is also composed of air transportation with a large number of terminals. Both the smaller terminals and the global terminals help to connect with the international airports such as Los Angeles and the San Francisco airports. Additionally, the State of California is known for its lavish lifestyle and the cars are the biggest craze in it. The number of vehicles owned by the registered owners is higher than the registered license holders (driving). This situation makes California traffic the world's most congested and thus California possesses the worst roads in the United States. Unauthorized vehicle possession by California residents has increased traffic to an unimaginable level and this situation throws an additional challenge to the researchers who maintain the network transportation. The extensive number of highways, expressways, freeways and the vast terrains are all maintained by the California Department of Transportation (Caltrans) and are patrolled by the California Highway Patrol (CHP). California leadership came together in 1990 to support Propositions 108 and 111 which created the Transportation Blueprint for the last decade of the 20th Century. Proposition 111 increased the gas tax from 9 to 18 cents, and Proposition 108 provided bonding for transit development and expansion. The first effort was to help pass the Transportation Blueprint in 1990, which was the first significant attempt to address the new demands on the transportation infrastructure in California since Governor Pat Brown’s administration. As ambitious as those measures were, however, no one could have anticipated the improvements in fuel efficiency that have decreased the effectiveness of the gas tax, nor could anyone have anticipated the current economic and population boom that’s putting enormous pressure on the system, and consequently on people and those who supply them with goods and services. These pressures were particularly clear by the mid-1990s when the Northridge Earthquake shook up the funding mix. Caltrans had to use virtually all the money going into the highway fund for earthquake retrofit in Northern and Southern California, thus canceling or delaying projects approved in the 1990 plan.
6
Transportation California, a transportation advocacy group, mobilized to lead the fight for Proposition 192 for earthquake retrofitting. By creating separate funding for earthquake retrofitting, funds once again flowed into the State Highway Account for improvement and maintenance. In 1998, the state passed Proposition 2, a measure designed to protect the dollars in the state highway fund from diversion. This was approved by 75% of California voters. Now the state’s politicians are not able to access the gas tax funds as they did during the 1990s, when they diverted more than $1.2 billion in badly needed transportation dollars to non-transportation purposes. In 1999, the focus was project delivery, an emphasis that resulted from a big backlog of highway improvements that had been approved and funded, but not started. This year-long effort also was successful. On October 10, 1999, Governor Davis signed into law AB 1012, the project delivery bill that would help expedite transportation projects. The legislation also created a loan program to draw down the huge balance in the State Highway Account. It also includes a “use it or lose it” provision for certain federal transportation funds. In 2000, the coalition supported Proposition 35 which reversed the limiting trend and specifically allowed government agencies to contract out necessary design services. In March 2002, Transportation California took the lead on Proposition 42, a measure that would permanently dedicate the gasoline sales tax for transportation purposes only. The measure’s passage would boost transportation funding by $1.2 to $1.5 billion annually – as much as $30 billion over the next 20 years. And in 2005, Transportation California was asked to spearhead the Fund Proposition 42 coalitions, mounting a statewide awareness campaign and working with the Administration to reverse its proposal to suspend Proposition 42, and ultimately to achieve full funding for the proposition at $1.2 billion. In 2006, Transportation California joined with the California Alliance for Jobs, Governor Schwarzenegger and Senate President pro Tempore Don Perata in the successful drive to enact and win voter approval of a comprehensive infrastructure bond package–Propositions 1A-1E. Most important to Transportation California were Proposition 1A to provide additional constitutional protections for transportation funds and Proposition 1B, which authorized $19.3 billion for vital transportation infrastructure projects. As California confronted a series of severe fiscal crises in the first decade of the 21st Century, Transportation California led industry and labor efforts to make the case to the Governor and Legislature for full funding of transportation programs, which are vital to the state’s economy. While State spending has undergone significant retrenchment in the past decade, existing transportation programs have more than held their own, yet they still face massive shortfalls resulting from decades of underinvestment. Now Transportation California is tackling the job of developing significant new revenue streams that are needed to make sure the transportation system meets the needs of California’s economy and its people.

7
Model Development and Implementation
Based on the literature review, this section proposes a novel way of calculating critical paths across a given transport network. The characteristics of reliable routes are discussed in the first section, which is followed by the strategies to calculate the centrality index of all the nodes in the given transport network. The strategy specifies the working methodology and the steps used to find the betweenness centrality index of each node. The strategy discussed here has two modules, constructing the transportation network model and calculating the path betweenness centrality index of the transportation network model using the concept of Adjacency matrix, which are essential steps in predicting network reliability. The results of this module are further used in the identification criteria.
Characteristics of Reliable Routes
Some of the elements that the analyses in the previous section should take explicitly into account in order to incorporate considerations of reliability are:
• The probability of non-failure of a given project, given various external circumstances (i.e., the reliability)
• The probability of external circumstances not occurring (i.e., probability of no threat)
• The robustness of the system (i.e., the probability that the system will continue to function even if a threat eventuates at a vulnerable point)
• How long it will take (and how expensive it will be) to repair the system if the threat occurs and the system fails at its vulnerable point
• What the costs are to the general economy of such a failure (i.e., goods and passengers not getting to their destinations or getting there late, transportation carriers being forced to use expensive detours, etc.)
• The contribution of a given project to improving the robustness (and hence reliability) of the system (or possibly the costs of a project in reducing robustness if a project involves taking an existing piece of the transportation system out of service, e.g., replacing a bus system with a subway)
• The degree of risk aversion that should be applied in deciding what weight to place on the risk (i.e., level of threat times vulnerability) that has been identified
Constructing the Transportation Network Model
The concept of adjacency matrix is used to model the transportation network. An adjacency matrix is a (0, 1) square matrix used to represent a finite graph. The elements of the matrix indicate whether pairs of vertices are connected or not in the graph. The value zero indicates no connection and the value one indicates direct connection. After collecting the network routes data, the next step is to convert the data collected into the adjacency matrix.

8
Figure 1. Adjacency Matrix Graph of Road Model
9
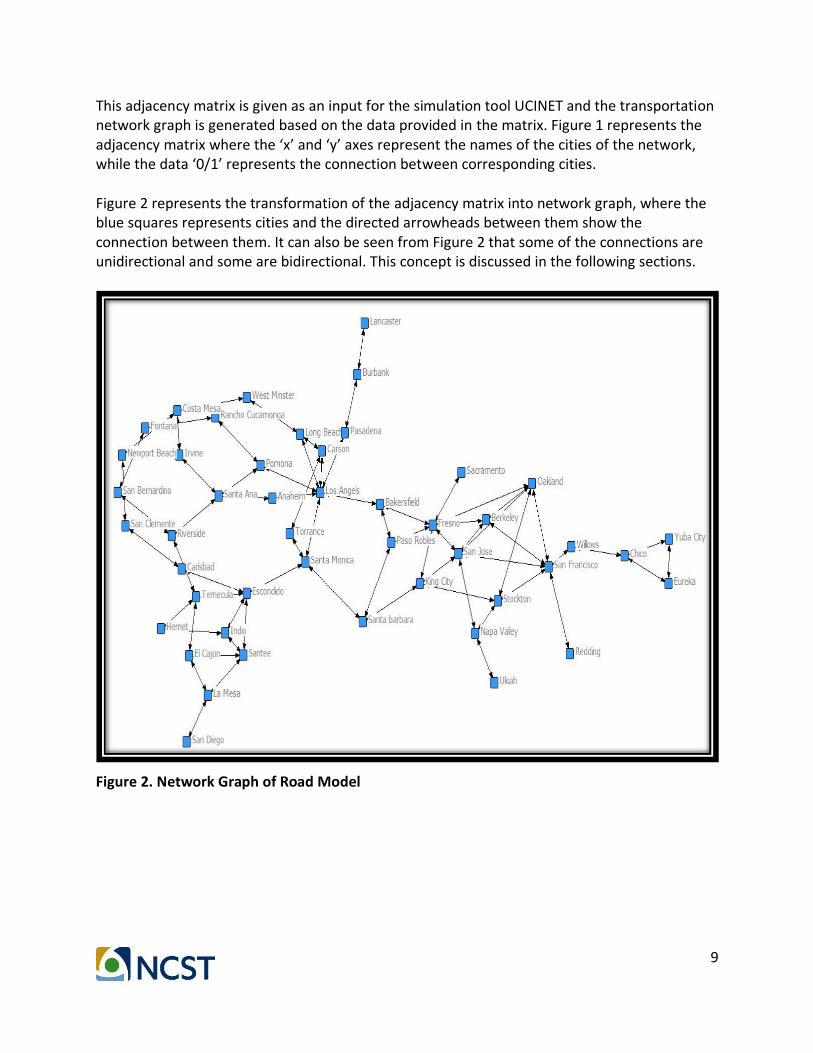
This adjacency matrix is given as an input for the simulation tool UCINET and the transportation network graph is generated based on the data provided in the matrix. Figure 1 represents the adjacency matrix where the ‘x’ and ‘y’ axes represent the names of the cities of the network, while the data ‘0/1’ represents the connection between corresponding cities. Figure 2 represents the transformation of the adjacency matrix into network graph, where the blue squares represents cities and the directed arrowheads between them show the connection between them. It can also be seen from Figure 2 that some of the connections are unidirectional and some are bidirectional. This concept is discussed in the following sections.
Figure 2. Network Graph of Road Model

10
Path Betweenness Centrality Index of the Transportation Network Model
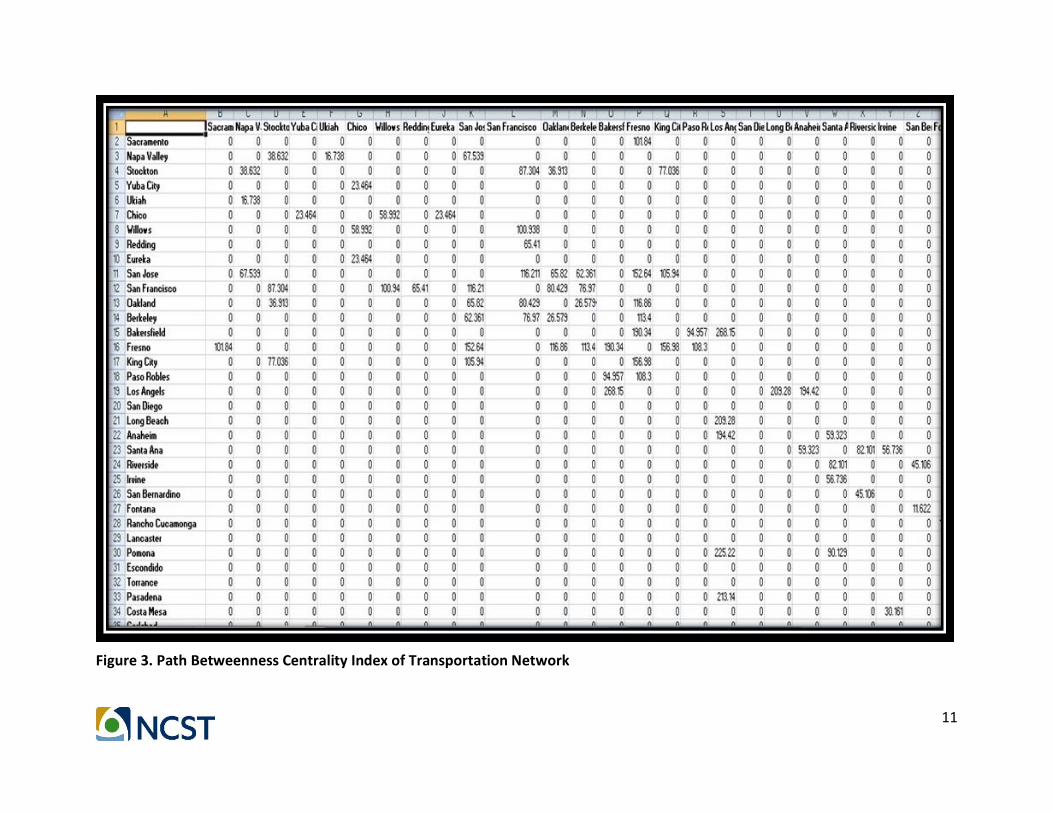
Path Betweenness Centrality Index of the highway and transportation network model means the time that the path belongs to one shortest route of any double nodes [7]. The index can tell us that one path has the control superiority for the connectivity shortcut of the whole network. With the UCINET program, the Path Betweenness Centrality Index of each path of the network model can be calculated as shown in Figure 3. The statistics can be elicited if all the path Betweenness Centrality Indexes are arranged in order. It can be seen that the Betweenness Centrality Index of the path (Bakersfield, Los Angles) is evidently larger than others. This means that the number of shortcuts of each pair of nodes passing the path is more and many shortcuts will change if the path is interrupted for some reason. Therefore, the path (Bakersfield, Los Angles) is very important in the Road model. Whereas the Betweenness Centrality Index of the path (Ukiah, Napa Valley) is the smallest (the value is 16.738), meaning that the number of shortcuts of each pair of nodes passing the path is smallest. It can be seen in Figure 2 that city of Ukiah lies on the edge of the network model, so the path (Ukiah, Napa Valley) is of lesser importance to the connectivity of the network model.
11
Figure 3. Path Betweenness Centrality Index of Transportation Network
12
Simulation Results
In this section, the numerical results are presented using the reliability evaluation procedure, which is further discussed later in the section. The procedure is applied to a network graph representing the California state transport network. The network represents forty-seven cities and the major freeways connecting them.
Defining the Network Model Reliability
At present, there is not an acknowledged definition of highway and transportation network reliability in academia. There are some definitions in current researches, however, in this research, the reliability study is defined as the probability of connecting the points in the network, namely, researching in the point of view of the topology structure and the traffic organization. The reliability index formula is described in equation 8:
𝑅 = 1 −𝑉
𝑁(𝑁−1)/2 (1)
In the formula,
• R = Reliability index
• V = Number of nodes pair which are not joined by any path
• N = Size of the model
Describing the Different Paths Failure Strategies
There are two paths failure strategies. The first is the Selective Paths Failure strategy which can be described as choosing one path among all the paths selectively and letting the path fail. The second is the Random Paths Failure strategy which can be described as choosing one path among all the paths randomly and letting the path fail.
Describing the Model Reliability Simulation Algorithm in Different Paths Failure
Strategies
The first model reliability algorithm with the Selective Paths Failure strategy:
• Step 1: Choose two paths whose Path Betweenness Centrality Index degree are maximal, and remove them.
• Step 2: Calculate the reliability index of the new model.
• Step 3: Repeat until all paths fail.
• Step 4: Calculate the mean value of the reliability index every time both of the two paths fail.
The second model reliability algorithm with the Random Paths Failure strategy:
• Step 1: Choose two paths randomly from all the paths, and remove them.
• Step 2: Calculate the reliability index of the new model.
13
• Step 3: Choose two paths randomly from all the paths, and remove them.
• Step 4: Calculate the mean value of the reliability index every time both of the two paths fail.
Analysis of the Transportation Network of Northern and Southern California
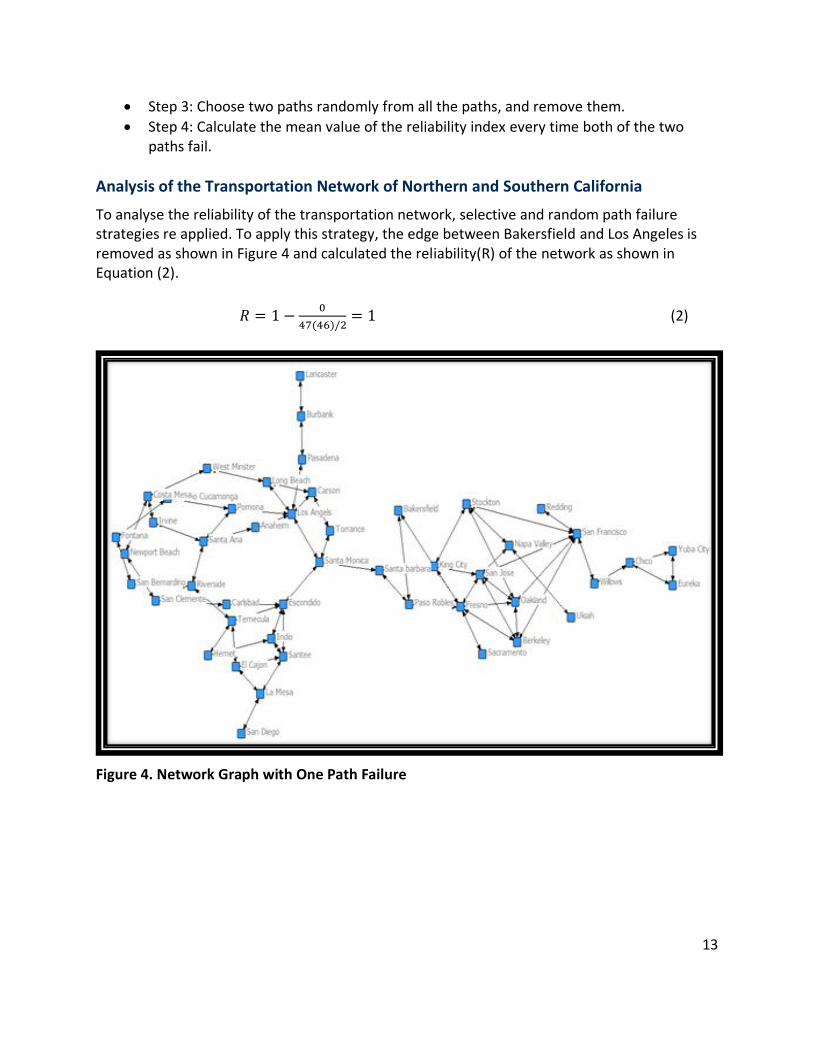
To analyse the reliability of the transportation network, selective and random path failure strategies re applied. To apply this strategy, the edge between Bakersfield and Los Angeles is removed as shown in Figure 4 and calculated the reliability(R) of the network as shown in Equation (2).
𝑅 = 1 −0
47(46)/2= 1 (2)
Figure 4. Network Graph with One Path Failure

14
Next, the edge between Willows and Chico is marked as failed and is removed from the graph, as shown in Figure 5, and the reliability of the network is calculated as shown in Equation (3). This makes the graph disconnected and reduces the network reliability.
𝑅 = 1 −44∗347(46)
2
= 0.88 (3)
Figure 5. Network Graph with Two Paths Failure
15
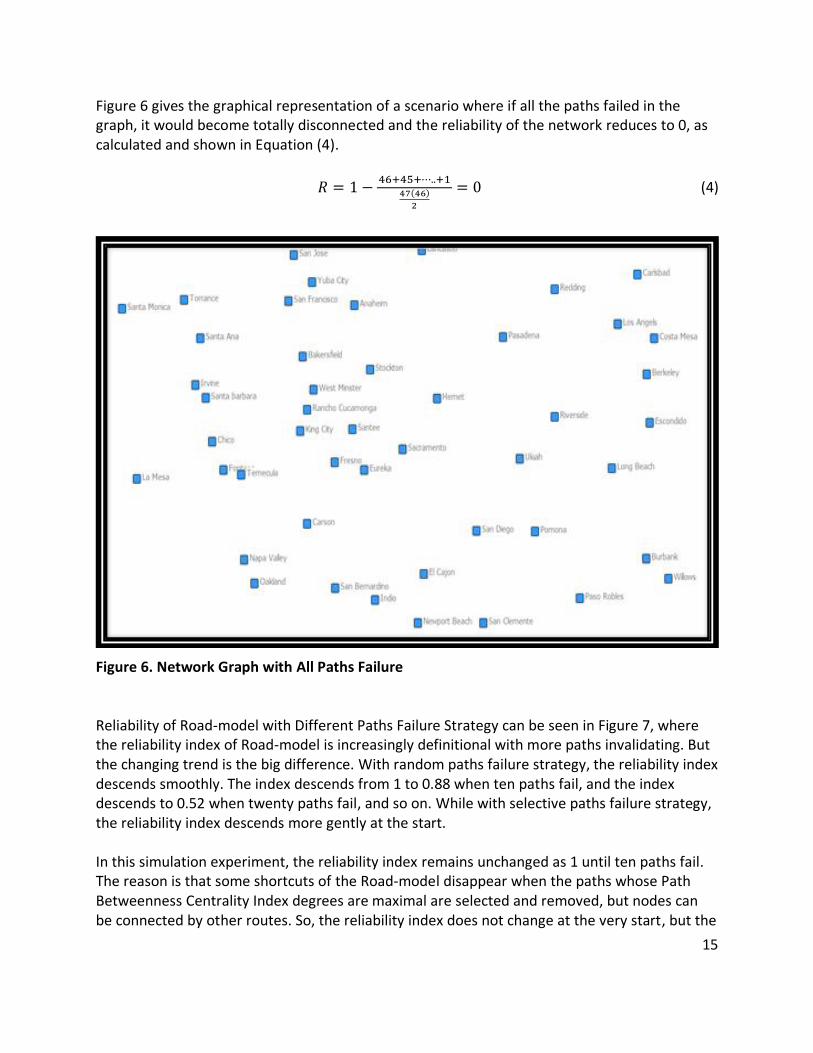
Figure 6 gives the graphical representation of a scenario where if all the paths failed in the graph, it would become totally disconnected and the reliability of the network reduces to 0, as calculated and shown in Equation (4).
𝑅 = 1 −46+45+⋯..+1
47(46)
2
= 0 (4)
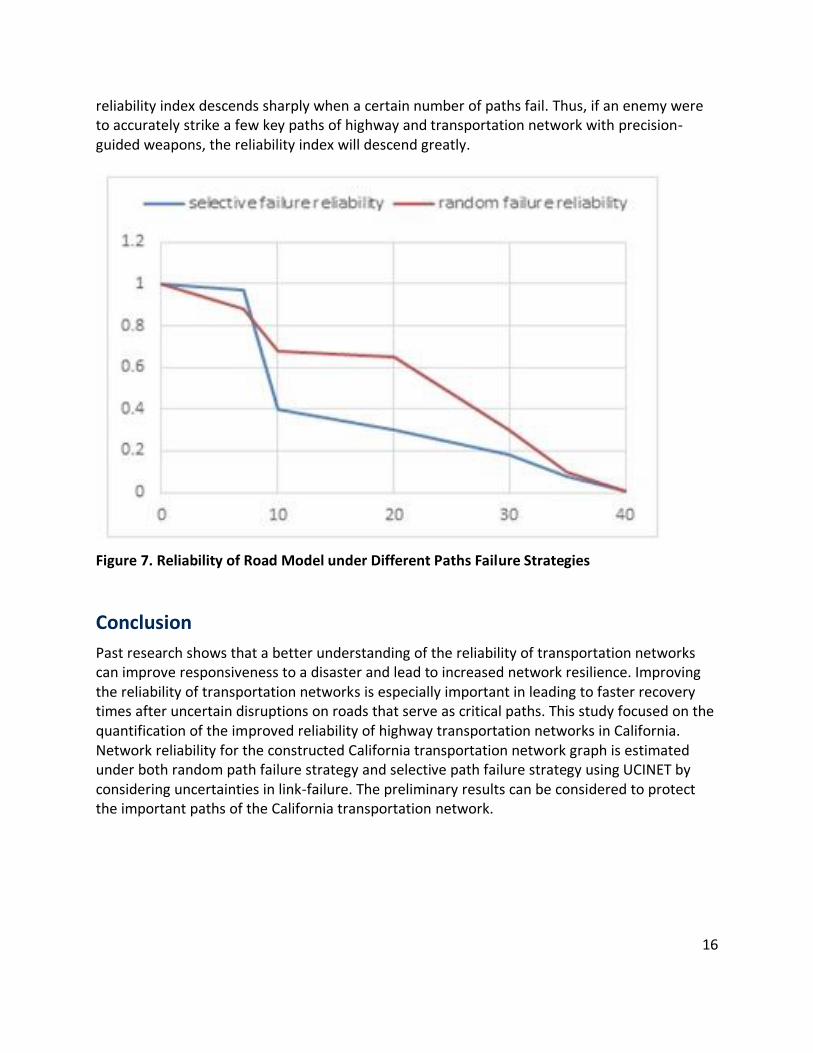
Figure 6. Network Graph with All Paths Failure Reliability of Road-model with Different Paths Failure Strategy can be seen in Figure 7, where the reliability index of Road-model is increasingly definitional with more paths invalidating. But the changing trend is the big difference. With random paths failure strategy, the reliability index descends smoothly. The index descends from 1 to 0.88 when ten paths fail, and the index descends to 0.52 when twenty paths fail, and so on. While with selective paths failure strategy, the reliability index descends more gently at the start. In this simulation experiment, the reliability index remains unchanged as 1 until ten paths fail. The reason is that some shortcuts of the Road-model disappear when the paths whose Path Betweenness Centrality Index degrees are maximal are selected and removed, but nodes can be connected by other routes. So, the reliability index does not change at the very start, but the
16
reliability index descends sharply when a certain number of paths fail. Thus, if an enemy were to accurately strike a few key paths of highway and transportation network with precision-guided weapons, the reliability index will descend greatly.
Figure 7. Reliability of Road Model under Different Paths Failure Strategies
Conclusion
Past research shows that a better understanding of the reliability of transportation networks can improve responsiveness to a disaster and lead to increased network resilience. Improving the reliability of transportation networks is especially important in leading to faster recovery times after uncertain disruptions on roads that serve as critical paths. This study focused on the quantification of the improved reliability of highway transportation networks in California. Network reliability for the constructed California transportation network graph is estimated under both random path failure strategy and selective path failure strategy using UCINET by considering uncertainties in link-failure. The preliminary results can be considered to protect the important paths of the California transportation network.

17
References
[1] Main H. and H. Kawai. Mathematics for Reliability Analysis. Asakura-Shoten, pp. 12–14, 1982.
[2] Y. Asakura and Y. & M. Kashiwadani. Road Network Reliability Caused by Daily Fluctuation of Traffic Flow. In Proc. Of the 19th PTRC Summer Annual Meeting, University of Sussex, Brighton, UK, 1991.
[3] A. J. Nicholson and Z. P. Du. Improving Transportation System Reliability: a Framework. in Proc. of the 17th Australian Road Research Board Conference (ARRB '94), pp. 1–17, August 1994.
[4] W. Lam and N. Zhang. A New Concept of Travel Demand Satisfaction Reliability for Assessing Road Network Performance. In Proc. Of the Matsuyama Workshop on Transport Network Analysis, No. 8, pp. 165–178, Matsuyama, Japan, 2000.
[5] M. G. H. Bell and J.-D. Schmoker. Public Transport Network Reliability Topological Effects. in Proc. the 3rd International Conference on Transportation and Traffic Studies, Guanxi People's Press, Guilin, China, 2002.
[6] S. Y. Zhu, W. Wang, W. Deng, Y. Tang, and B. Wang. Research on Traffic Network Reliability and Access Road Algorithm. China Journal of Highway and Transport, Vol. 13, No. 1, pp. 91-94.
[7] J. Jin. Reliability Discussion on Urban Road Network. Journal of Transportation Systems Engineering and Information Technology, Vol. 2, 2004.
[8] H. Lin, C. Y. Wang, and L. Li. Study on Network Travel Time Reliability Under Contingent Events. Journal of Engineering College of Armed Police Force, Vol. 21, 2005.
[9] H. Y. Fan, Z. Z. Wu, and X. G. Yang. Research on the Reliability of the Topological Structure for Road Transportation Networks. Journal of China University of Mining and Technology, Vol. 34, no. 4, pp. 482-485, 2005.
[10] P. C. Yuan, Y. Han, and W. D. Ma. Stochastic Transportation Network Equilibrium Model Based on Travel-Time Reliability. Journal of University of Shanghai for Science and Technology, Vol. 30, No. 4, pp. 352–356, 2008.
[11] G. M. D’Este and M. A. P. Taylor. Modeling Network Vulnerability at the Level of the National Strategic Transport Network, Journal of Eastern Asia Society for Transportation Studies, Vol. 4, No. 2, pp. 1-14, 2001.
[12] P. Hossain and N. S. B. Sayed. Network Performance Improvement under Stochastic Events with Long-Term Effects, Transportation, Vol. 32, pp. 65-85, 2005.
[13] B. Sanso and L. Milot. Performability of a Congested Urban Transportation Network When Accident Information is Available. Transportation Science, Vol. 33, No. 1, pp. 68-79, 1999.
[14] S. M. Sanchez and L. G. Danielsm. A transport Network Reliability Model for the Efficient Assignment of Resources. Transportation Research Part B, Vol. 39, pp. 47-63.
[15] L. Haixu and P. Yun. Improvement of Road Network Reliability Based on Critical Links. Journal of Southwest Jiaotong University, Vol. 41, No. 5, pp. 645-648, 2006.

18
[16] G. Yong, W. Huimin, G. Jifu, and L. Xuejie. Evaluation Method of Road Network Connectivity Reliability Based on Key Segments. The Fourth China Annual conference on ITS, pp. 575-579, 2008.
[17] H. Li-wen and J. Fu. Study on the Relative Importance of Links in Urban Roads Network, Systems Engineering-Theory Methodology Applications, Vol. 13, No. 4, pp. 425-428, 2004.