introducti on objectiv e experimenta l section results and discussion conclusio ns
TRANSCRIPT

Ultra Fast Liquid Chromatography Coupled With Graphene-Modified
Electrode For Simultaneous Determination Of Sulfonamides
Present ByMiss Nupattaranee Thammasoontaree
Faculty Of Science Chulalongkorn University
1

OUTLINE
IntroductionObjective
Experimental section
Results and discussion Conclusi
ons2

INTRODUCTIONWhat Is Antibiotic?
● A Drug that kills or slows the growth of bacteria
● One class of "antimicrobials"
● Can be used to treat infection
3

Sulfonamide
Antibacterial drugs
Sulfonamides are drugs with bacteriostatic
activity
used asfeed
additives and treating
infections 4
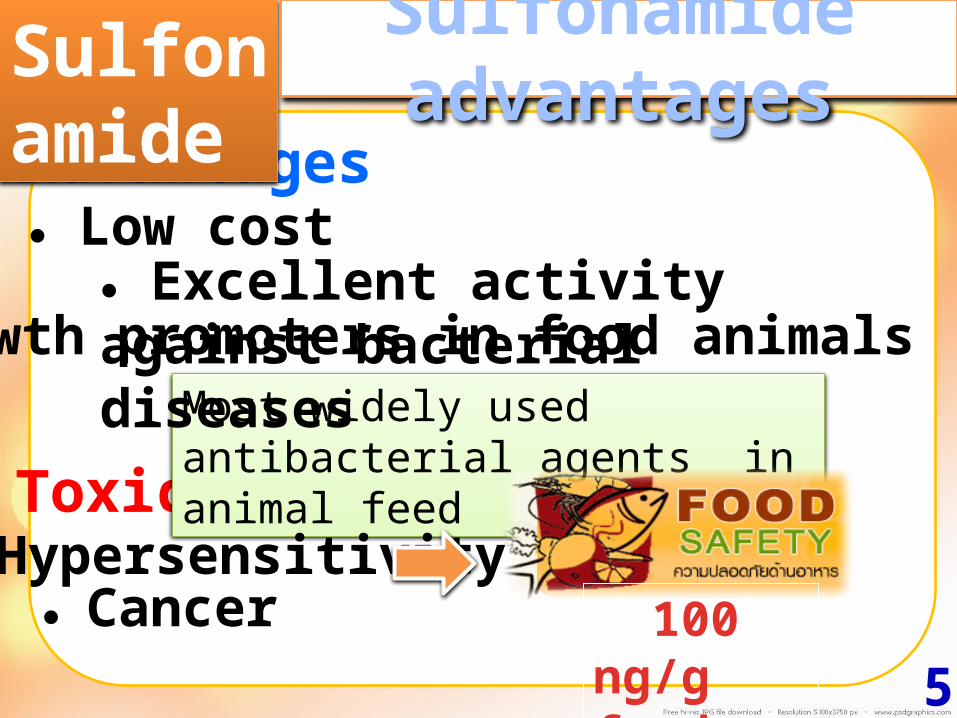
Toxicology
Advantages
Most widely used antibacterial agents in animal feed
● Low cost● Excellent activity against bacterial diseases ● Growth promoters in food animals
100 ng/g food
● Cancer ● Hypersensitivity
Sulfonamide
Sulfonamide advantages
5

N S
H
HN
O
O
H
R
Sulfamonomethoxine(SMM)
Sulfadoxin(SDX)
Sulfamethoxazole(SMX)
Sulfamethazine(SMZ)
Sulfonamide
The basic structure of sulfonamides
Sulfadimethoxin(SDM)
Sulfaquanidine(SG)
Sulfadiazine(SDZ)
Sulfisoxazole(SSZ)
6
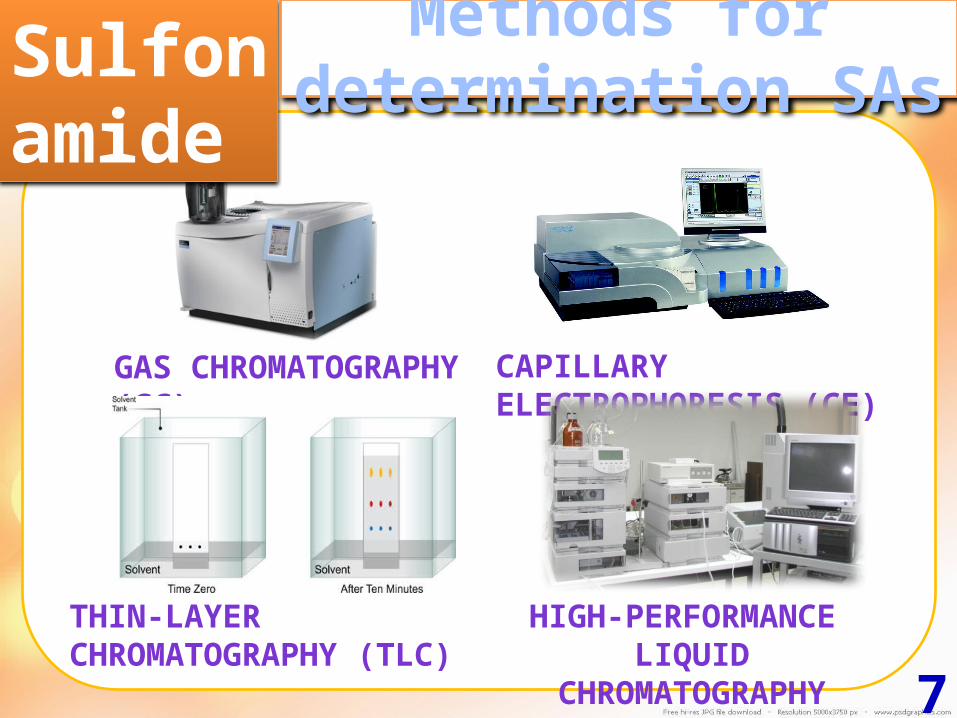
GAS CHROMATOGRAPHY (GC)
THIN-LAYER CHROMATOGRAPHY (TLC)
CAPILLARY ELECTROPHORESIS (CE)
HIGH-PERFORMANCE LIQUID
CHROMATOGRAPHY (HPLC)
Sulfonamide
Methods for determination
SAs
7

Ultra Fast Performance Liquid Chromatographic
SystemsSwitch From HPLC to UFLC
Sulfonamide
Methods for determination SAs
● A new class of separation science● Improved resolution, Speed, and sensitivity ● Suitable for chromatographic applications in general 8
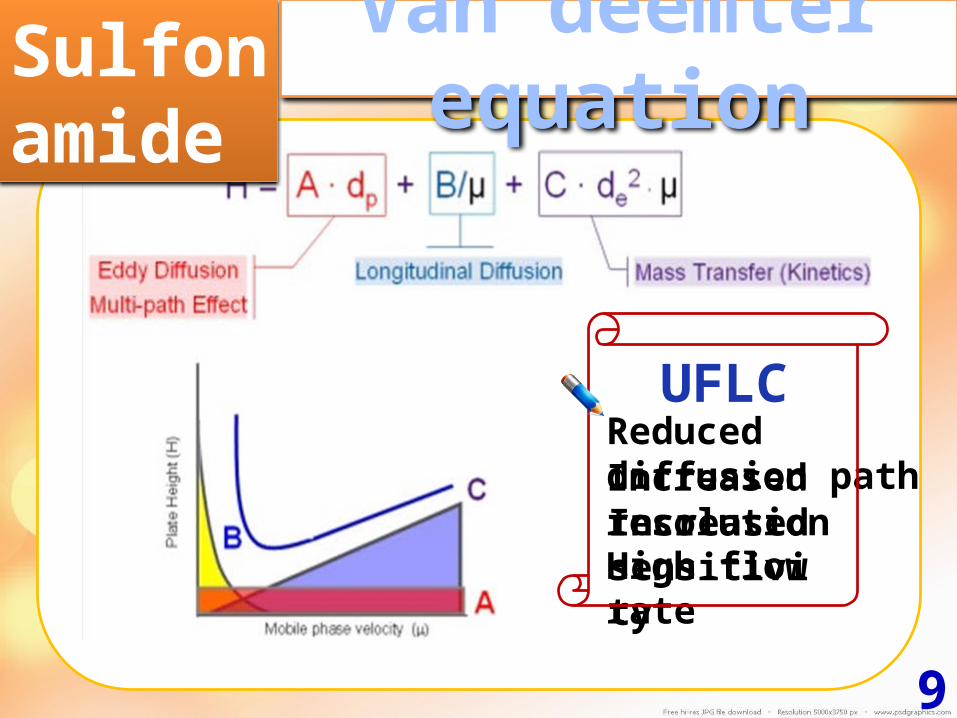
UFLC
Increased resolutionIncreased sensitivity
Reduced diffusion path
High flow rate
Sulfonamide
Van deemter equation
9

Electrochemical detection
Easily measurable signalExtreme sensitivityFast detectionHigh selectivity
Why ECD?
Electrochemical detection (ECD) for HPLC or
UFLC is an extremely selective and sensitive
detection technique
10

Glassy carbon
Sulfonamide
Conventional working
electrodes
Boron-doped diamond
Multi-wall carbon nanotubesSingle-wall carbon nanotubes
11

Sulfonamide
The new working electrode
Graphene (G) – a two dimensional sheet of sp2 carbon atom
an attractive materials in electrochemistry
High electrical conductivity
High mechanical strength
Low manufacturing cost
12

OUTLINE
IntroductionObjective
Experimental
Results and discussion Conclusi
ons13

OBJECTIVETO APPLY A GRAPHENE-MODIFIED
SCREEN-PRINTED CARBON ELECTRODE AS THE WORKING
ELECTRODE FOR THE DETERMINATION OF
SULFONAMIDES BY ULTRA FAST LIQUID CHROMATOGRAPHY
COUPLED WITH ELECTROCHEMICAL DETECTION
14

OUTLINE
IntroductionObjective
Experimental section
Results and discussion Conclusi
ons15
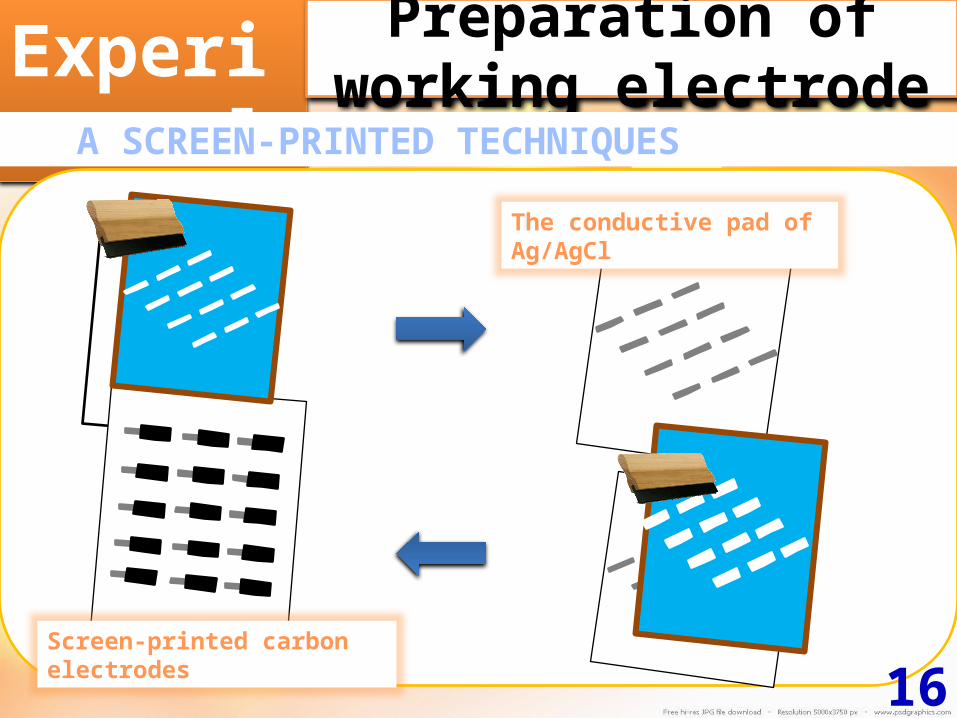
Experimental
Preparation of working electrode
PVC
A SCREEN-PRINTED TECHNIQUES
The conductive pad of Ag/AgCl
Screen-printed carbon electrodes
16

GRAPHENE-MODIFIED SCREEN-PRINTED CARBON ELECTRODES
Graphene/PANI Solution
spraying
high voltage
Graphene-modified electrode
Experimental
Preparation of working electrode
17

Experimental
Batch experiment
Cyclic Voltammetric investigation
Potential range : 0.7-1.5 V
Reference Electrode : Ag/AgCl
Counter Electrode : Pt wire
SA Concentration : 50 ppm
Electrolyte : PBS (pH 3)
Scan rate : 0.05 V/sec
Characterization of graphene-modified screen-printed carbon electrode
Batch Condition
18

Experimental
Chromatographic experiment
Inertsil C4 column 150mm X 4.6 nm i.d; partical size, 5 µm
Optimal potential of amperometry
Optimal condition of UFLC-ECD
Analytical performance &
Validation 19

OUTLINE
IntroductionObjective
Experimental
Results and discussion Conclusi
ons20

Cyclic voltammograms of [Fe(CN)6]3-/4- 1 mM for (---) Graphene-modified carbon
electrode and (---) Bare carbon electrode vs. Ag/AgCl with scan rate 100 mV/s
Results
Characterization Of Electrode
21

Results
Characterization Of The Electrodes
Fig. SEM images of G/PANI (1:1) nanocomposites, condition, No. needle; No.24 ( 0.45), voltage; 10 kV, time; 5 min
22

Cyclic voltammograms of SAs in 0.1 M phosphate solution pH 3.0 at (---)
Graphene-modified screen-printed carbon electrode and (---) Bare carbon electrode.
SMM
SDM
SG
Results
Cyclic voltammetric investigation
SDX
SMX
SSZ
23
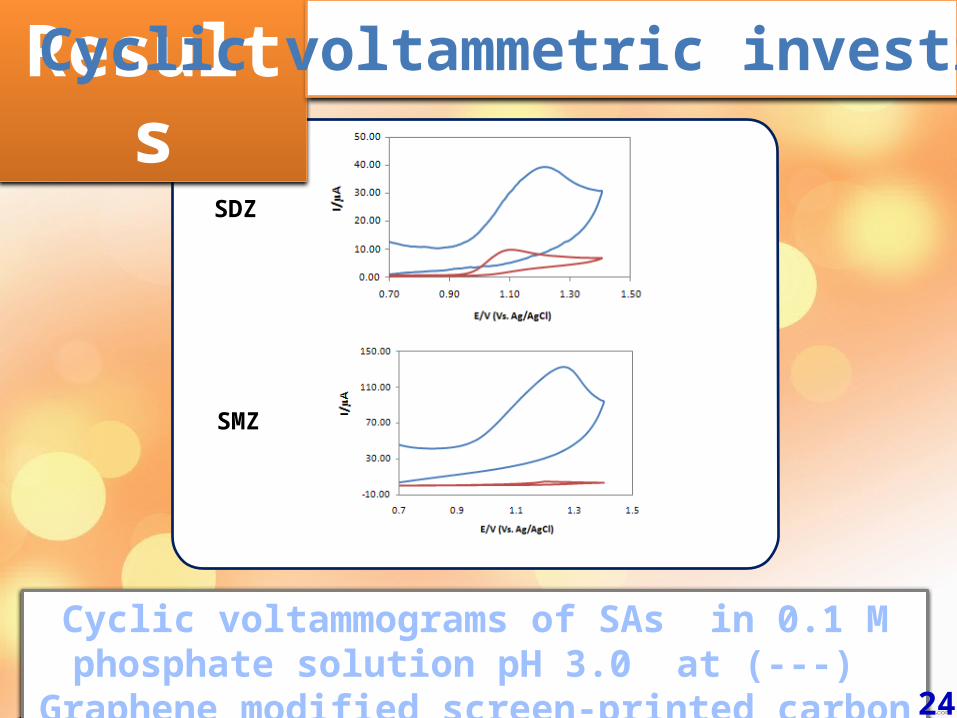
Cyclic voltammograms of SAs in 0.1 M phosphate solution pH 3.0 at (---)
Graphene modified screen-printed carbon electrode and (---) Bare carbon electrode.
SDZ
SMZ
Results
Cyclic voltammetric investigation
24

Results
Optimal potential of amperometry
Hydrodynamic voltammetric results
1 1.1 1.2 1.3 1.4 1.5 1.60
0.0200000000000001
0.0400000000000001
0.0600000000000002
0.0800000000000002
0.1
12345678
Potential (V)
Curr
ent (
µA)
The graph of 10 ppm mixture eight standard SAs at a flow rate of 1.5 mL min-1. The detection potential at 1.3 – 1.5 V vs. Ag/AgCl using a graphene-modified screen-printed carbon electrode.
SGSDZSMZSMMSDXSMXSSZSDM
25

Results
Optimal condition of UPLC-ECD
Chromatogram of eight SAs 10 ppm in potassium hydrogen phosphate solution pH 3
Chromatogram of eight SAs 10 ppm in potassium hydrogen phosphate solution pH 4
Chromatogram of eight SAs 10 ppm in potassium hydrogen phosphate solution pH 5
26

Results
Optimal condition of UPLC-ECD
Chromatogram of eight SAs 10 ppm in potassium hydrogen phosphate solution pH 6
Chromatogram of eight SAs 10 ppm in potassium hydrogen phosphate solution pH 7
Chromatogram of eight SAs 10 ppm in potassium hydrogen phosphate solution pH 3
27

Results
Optimal condition of UFLC-ECD
PARAMETERS OPTIMAL CONDITIONS
Column Inertsil C4 (150 x 4.6 mm) Mobile phase Phosphate buffer(pH3): ACN: EtOH
Flow rate 1.5 mL/minInjection Volume 30 µL
Temperature 25 ºCDetector Amperometric detection at 1.4 V
UPLC-EC chromatogram of mixture eight SAs at 10 µg mL-1
SG SDZ
SMZ SMM
SDX SMXSSZ
SDM
28

Results
Analytical performance &
Validation
0 2 4 6 8 10 120
200400600800
1000
f(x) = 71.9109141103393 x + 71.7833557025641R² = 0.993374193014272
SG
Concentration (ppm)
Curr
ent (
nA)
0 2 4 6 8 10 120
100200300400500
f(x) = 38.9702821845309 x + 34.6030830514827R² = 0.991338678928408
SDZ
Concentration (ppm)
Curr
ent (
nA)
0 2 4 6 8 10 120
50100150200250300350
f(x) = 29.6141006826013 x + 15.3195841969671R² = 0.992155433799811
SMZ
Concentration (ppm)
Curr
ent (
nA)
0 2 4 6 8 10 120
100
200
300
400
500
f(x) = 42.0514985874679 x − 3.19580099054062R² = 0.991469517791657
SMM
Concentration (ppm)Cu
rren
t (nA
)
Linearity of eight standard SAs by UFLC-ECD using graphene-modified screen-printed carbon electrode.
y = 29.236x + 28.891R2 = 0.9954
29
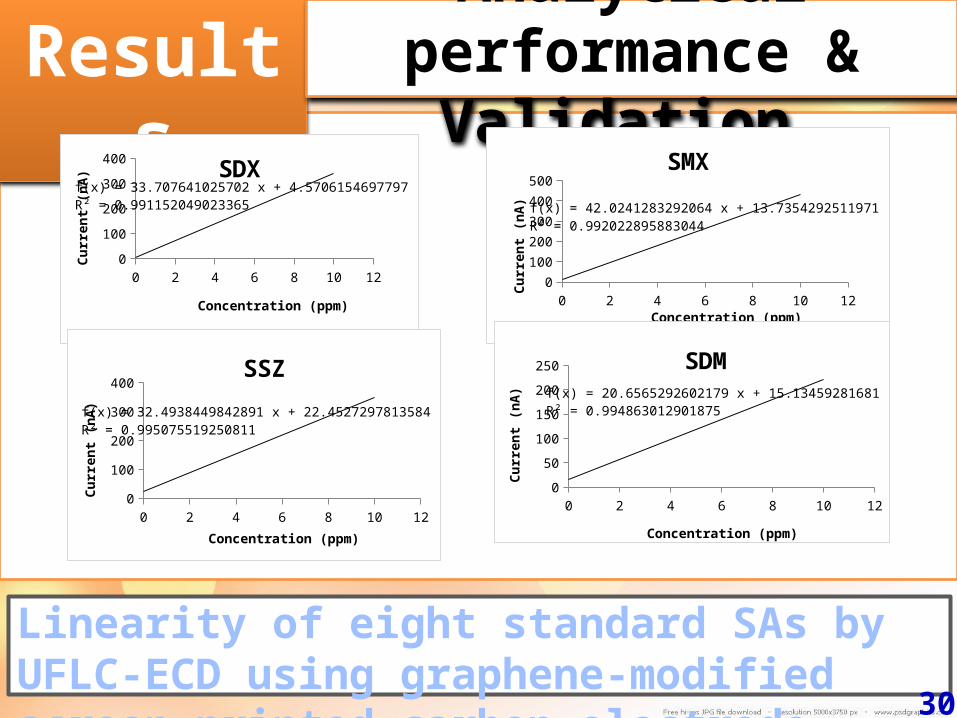
Results
Analytical performance &
Validation
0 2 4 6 8 10 120
100
200
300
400
f(x) = 33.7076410257022 x + 4.57061546977971R² = 0.991152049023365
SDX
Concentration (ppm)
Curr
ent (
nA)
0 2 4 6 8 10 120
100
200
300
400
500
f(x) = 42.0241283292064 x + 13.7354292511971R² = 0.992022895883044
SMX
Concentration (ppm)
Curr
ent (
nA)
0 2 4 6 8 10 120
50100150200250300350400
f(x) = 32.4938449842891 x + 22.4527297813584R² = 0.995075519250811
SSZ
Concentration (ppm)
Curr
ent (
nA)
0 2 4 6 8 10 120
50
100
150
200
250
f(x) = 20.6565292602179 x + 15.13459281681R² = 0.994863012901876
SDM
Concentration (ppm)Cu
rren
t (nA
)
Linearity of eight standard SAs by UFLC-ECD using graphene-modified screen-printed carbon electrode.
30

Results
Analytical performance &
Validation Analy
teLinearit
y (ppm)
R2 LOD (ppb
)
LOQ (ppb)
SG 0.01-10 0.9934 1.162 3.336
SDZ 0.01-10 0.9913 1.601 5.337
SMZ 0.01-10 0.9922 2.900 9.667
SMM 0.01-10 0.9954 2.467 8.224
SDX 0.01-10 0.9912 2.995 9.983
SMX 0.01-10 0.9920 2.513 8.376
SSZ 0.01-10 0.9951 3.287 10.957
SDM 0.01-10 0.9949 6.127 20.425The limits of detection (LOD) and limits of quantitation (LOQ) were calculated from 3Sbl/S and 10Sbl /S 31
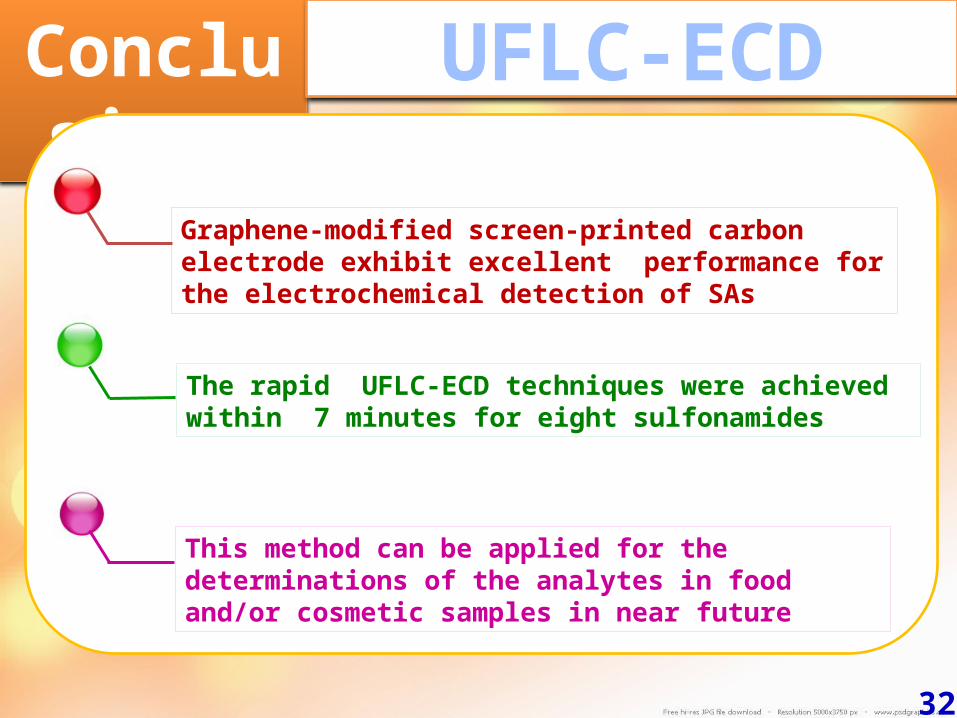
Conclusions
UFLC-ECD
This method can be applied for the determinations of the analytes in food and/or cosmetic samples in near future
Graphene-modified screen-printed carbon electrode exhibit excellent performance for the electrochemical detection of SAs
The rapid UFLC-ECD techniques were achieved within 7 minutes for eight sulfonamides
32

33

ACKNOWLEDGEMENT
34
Prof. Dr. Orawon Chailapakul
Dr. Nadnudda Rodthongkum
Electrochemistry and Optical Spectroscopy Research Unit
Chulalongkorn University’s Graduate Scholarship on the
Auspicious Occasion of His Majesty the King’s 72nd Anniversary
for Academic Year 2010

35