introduction · 2. gulch 16: five new 4m x lam plots were established and mapped at gulch 16....
TRANSCRIPT
INTRODUCTION
Extensive commercial harvesting of wild edible mushrooms continues to be prevalent throughout the forested areas of northern California and increased during the 1992 season because of the wet weather pattern However in 1993 commercial harvesting of wild edible mushrooms decreased due to the warm dry weather patter Foresters bioloEists and others interested in the vitality of the forests and wildlife of the Pacific Northwest including northern California are concerned about potential impacts of commercial harvesting of wild mushrooms (Bengston 1993 a b Molina et al 193)
Most of the fungi producing mushrooms that are targets of commercial and recreational pickers form complex relationships such as mycorrhizae with forest trees and plants The impact of different intensities and methods of mushroom picking on existing fungal populations is unknown If mushroom picking does have an effect on fungal populations will this effect result in a difference in the health and vigor of the trees that depend upon their mycorrhizal associations with the fungi Some small mammals and deer also eat the same mushrooms chosen by pickers will mushroom harvesting have an effect on their populations Some harvesting techniques may result in habitat degradation This may ultimately have an effect on species of plants and animals in the forest such as fish and birds that are not directly dependent on the mushrooms
Because of these concerns foresters biologists university researchers and mycological societies have cooperated on several projects in California and the Pacific Northwest that study the biology of target species and effect of commercial harvesting on wild edible mushrooms
1 The Oregon Mycological Society began a biomass and population study of the yellow Chanterelle (Cantharellus cibarius) September 1986 in cooperation with USDA Forest Service This study supervised by Lorelei Norvell from the University of Washington utilizes permanent plots secured behind locked gates in the Mt Hood region in Oregon (Norvell 1992)
2 Two research projects that involve biomass productivity of the matsutake (Armillaria ponderosa) and environmental correlation began in Fall 1993 These projects supervised by the Forestry Sciences Laboratory in Corvallis are situated in Winema National Forest and Siskiyou N1tional Forest both in Oregon (Fischer et aI 1993)
3 A research project involving biomass productivity and environntefITal correlation of Armillaria ponderosa began in Fall 1993 This project located in Klamath National Forest in northern California involves Humboldt State University and is supervised by Max Creasy Uknonom Ranger DistriCt Klamath National Forest (Millar et aI 1993)
4 A research project involving population and biomass studies of Armillaria ponderosa began in 1991 in Six Rivers National Forest in northern California This project supervised by David Largent Humboldt State University (HSU) utilizes permanent plots and is based upon protocols developed during earlier studies funded by the California Department of Forestry and Fire Protection (CDFF)
5 The research projects discussed in this report underway since Fall 1990 in three locations in northern California Jackson Demonstration State Forest (Fort Bragg) Patricks Point State Park (Trinidad) and Lanphere-Christensen Dunes Preserve (Arcata) These projects are supported by CDFF supervised by David Largent and involve the Humboldt Bay Mycological Society These projects focus on weather conditions population biomass and phenology of six target species depending on site location
Jackson Demonstration State Forest Armillaria ponderosa Boletus eduis Cantharellus cibarius Craterellus sp Hydnum repandum Leccinum manzanitae
Lanphere-Christensen Dunes Preserve Armillaria ponderosa Boletus eduis Cantharellus cibarius Leccinum manzanitae
Patricks Point State Park Boletus eduis Cantharellus cibarius r
All of these studies should provide information on how to best manage forest fungal resources and are extremely important because of reports of declining macrofungi in Europe (Cherfas 1993 Lizon 1993)
)
Location Jackson Demonstration State Forest (JDSF) near Fort Bragg California
BACKGROUND
This area is located on both sides of Highway 20 between Willits and Fort Bragg California As JDSF is a demonstration forest a variety of timber management strategies are utilized on the forest making it possible to study mushroom fruiting in different managed ecosystems The forest stretches from very near the Pacific coast to thirty-five miles inland with elevations ranging from sea level to about 2500 feet Long term rainfall data show that some regions of the forest can get more than 60 inches of rainfall per year More average rainfall in most areas is between 25 and 30 inches per year but the forest has been subject to Californias persistent drought of the last seven years
Timber species are primarily Redwood (Sequoia sempervirens) and Douglas-fir (Pseudotsuga menziesii) with other tree species including Pacific Madrone (Arbutus menziesii) and Tan Oak (Lithocarpus densiflorus) The area has many creeks and small streams and is bisected by the Noyo River that serves as the source of drinking water for the community of Fort Bragg A fish egg collecting station is located in the center of the forest on the Noyo During spawning season salmon make their way up many of the small shallow streams into pond areas
The forest is popular with recreational users There are several camping and day use areas including a group camp area near Camp One There are gravel and dirt roads throughout the forest that are passable to most vehicles in all but the wettest periods of the year and many popular hiking bicycle and horse trails Mushroom picking is a traditional outdoor hobby for ethnic European Asian and Native American groups that reside in the area The area has an active mycological society and is also well known to commercial buyers During mushroom season vehicles with signs offering to buy mushrooms can be seen all along Highway 20 and in the communities of Fort Bragg and Willits Anecdotal evidence shows that many former timber workers have turned to mushroom picking as a way to support their families as other jobs in the woods have disappeared Many areas closer to the San Francisco Bay area have been closed to mushroom picking of any kind so JDSF has become the closest area where mushroom collectingis allowed
In 1990 season the Forest Supervisor Forest Tilley set aside an area designated as a mushroom study region The research project began that year with a mushroom survey and sporocarp longevity study throughout the forest using a combination of plots and fixed transects in seven locations within and outside the designated study area Some sporocarps were lost to animals It was another drought year so mushroom productivity was poor Commercial and recreational pickers continued to pick in the study areas We learned that the size of the forest coupled with good vehicle accessibility to good mushroom sites and shortage of recreational patrol officers to police the designated ~Yudy area made it impossible to maintain permanent plots unless they were very well hidden
In 1991 season Forest Supervisor Tilley requested that we attempt to confine our sites to the designated area in an effort to control access by pickers Efforts during this season focused on locating plot areas that would be accessible for monitoring on weekly visits (JDSF is a seven-hour round trip from HSU) that had a good variety of target mushrooms and timber species and that were hidden or inconvenient enough to be uninviting to pickers A suitable plot was located near Camp One and intensively mapped for all vegetation during the 1991 season Two other sites were identified near Bear Gulch and Gulch 16 All three sites were sampled during site visits for numbers of target species The 1991 season was another drought year with reduced mushroom productivity As was the case during the 1990 season there was frequent evidence of commercial picking (although not in the mapped plot) piles of discards and trimmings near the road edge areas of raking trampling digging and other disturbance and encounters with groups of pickers carrying pails and bags of mushrooms
STUDY PERIOD SEASON OF 1992
JDSF generally remained dry and warm until the end of October when rains began This season was the first to experience a normal amount of rainfall after seven years of drought conditions in northern California Mushroom fruiting was prolific in comparison to last year for both target and non-target species Fruiting was not observed for any target species until the first week in November when all the mushrooms began to fruit simultaneously Fruiting of many species other than the target mushrooms was heavy at times it was impossible to walk within the plots without stepping on mushrooms Fruiting persisted in some sheltered spots through January
Three study areas were used in the designated mushroom research area north of Highway 20 during this season Gulch 16 a site in the eastern portion of the forest off Chamberlajn Road Bear Gulch a site located near the central portion of the forest between Camp One and Parlin Fork Camp and Camp One a site also located in the central portion of the forest -The Camp One site mapped during 1991 season is uphill from a locked gate on an unused road Bear Gulch is also controlled by a locked gate but is subject to vehicular use by authorized persons The Gulch 16 site is near the old target shooting range adjacent to a heavily used road open to the general public All of the sites are accessible by foot or bicycle hikers and
4
mushroom collectors were frequently encountered during site visits particularly in the Gulch 16 and Bear Gulch areas
1 Bear Gulch From the months of January through May twenty new lam x lam plots were established and mapped at Bear Gulch All vegetation was mapped on each of these plots and accurately located on each map All corners of the subplots were indicated by flags and stakes purchased with funds available for this study The total number of worker hours involved was approximately 250 Unfortunately sometime between late May and late July this site was vandalized all stakes and flags were removed and thrown away Therefore these plots have been eliminat~d estimated cost to the project of $350000 shy
2 Gulch 16 Five new 4m x lam plots were established and mapped at Gulch 16 Unfortunately vandalism is quite prevalent at this site with the signs posting the area as Closed to mushroom picking as well as plot tags removed by someone during the period between November 12 to November 20 This area continues to show evidence of visits by commercial pickers It is very close to a well-traveled road and also near a target-shooting range Plots were not re-established during this season and a decision has been made to discontinue this site in the future
3 Camp One Site study plot is an intensively mapped area of 484 square meters Separate subplot maps for each four square meters were reproduced and used during each site visit to locate species under study as well as potential indicator species The Camp One site is a Douglas-fir and Tan Oak habitat
Field workers on sampling visits during this season collected data to define relationships if any between target species of mushrooms and existing trees and shrubs Locations of target species sporocarps were mapped to follow season to season changes in the intensively mapped plot at the Camp One site
During 25 sampling visits the following numbers of sporocarps were observed and noted on subplot maps of the three sites (Table 2) Data from 1990 and 1991 seasons are shown for comparison for Bear Gulch and Gulch 16
Table 2 Numbers of sporocarps at three study sites JDSF Camp One Bear Gulch Gulch 16
1992 1990 1991 1992 199 1991 1992 C cibarius 23 a a 29 a a 10 B eduis 3 a a 12 0 a a L manzanitae a a a 2 -amp-=--3 a A ponderosa a a a a a a a H repandum 17 a a 41 a 25 7 Craterellus sp 52 a a 23 a a 4
The data presented in this table reflects differences in numbers of target species sporocarps for the two previous drought years as compared to the wet 1992 season However the true number of sporocarps was probably more than recorded because of the heavy incidence of mushroom harvesting in these areas
Generally there were more mushrooms from target species this year than in previous years The sporocarps were very large in some cases with one specimen of Cantharellus cibarius measuring 28 cm across the top (Other aspects of this study suggest sporocarp size is important for estimates of total biomass and for estimates of total spore number see below) Sporocarps of other than target species were also very plentiful and fruiting in general was much more prolific than during previous years Without exception all sporocarps encountered in previous years of this study were small less than 4 cm at largest diameter across the top for young Hydnum repandum Small size and general absence of target species are thought to be because of the extended drought conditions A brief period of heavy rain in January 1992 may have encouraged the large flush of H repandum
COMMON VASCULAR PLANT ASSOCIA nONS FOR THE TARGET SPECIES
Information from the subplot maps still needs to be entered into a mapping program for a full statistical analysis but a preliminary review of the map data indicates that Cantharellus cibarius is most commonly associated with Douglas-fir less than five inches in diameter C cibarius was also found close to Tan Oaks In all but one instance the Douglas-fir or Tan Oak was close to huckleberry (Vaccinium ovatum)
Boletus edulis tended to be located in spots where the canopy was open wjthno clear preference for any particular species of tree or shrub The total number of B edulis was rather small (as was Leccinum manzanitae) this year clearer associations may be demonstrated by more prolific fruiting of these species
Hydnum repandum was as likely to be found near true firs and Douglas-firs as it was near Tan Oaks frequently groups of fruiting bodies of this species were found under fern fronds Craterellus fruited most often near Madrone and small (diameter less than five inches) Tan Oaks that were in close proximity to rotting logs
5
STUDY PERIOD SEASON OF 1993
This is the fourth year of study at this site Because of difficultiesin maintaining pennanently marked plots this year the project staff Sally Hewitt and Cindy Willis used random transects within large areas delimited by relatively penn anent humanshymade or natural structures Monitoring took place in two plots of approximately fivehectares each Both plots are located in the Bear Gulch area Each plot was divided into six subplots during September A random 50 meter transect in each subplot was traversed weekly making 12transects per visit In addition fourteen collections ofmycorrhizae below fruiting bodies of Canthllrellus cibariuswere made and described ~
When target species were encountered on the transects age of the sporocarp was noted (button mature over-mature) and the species of the nearest tree or shrub DBH was also noted for the nearest tree or shrub Results are presented in Table 3
Discussion
There were very few mushrooms of any species during most ofthis season at JDSF We believe this is due to a period of warm dry winds that persisted for several weeks during October Sporocarps of target and other species had abortive growth and were dried up in the button stage The 1993season was also another drought year for California what rain there was came too little and too late Visits to JDSF during January and February following the late rains revealed some very late season mushrooms but none of the target species
The study pattern oflarge unflagged plots with random transects did serve to alleviate the problems caused by vandalism in the past We intend to continue to use this study pattern in the next year and add more large plots at different locations on the Forest including some in areas picked intensively by commercial and recreational pickers
~
6
Table 3 Summary of data gathered in JDSF during Fall of 1993 Plot and Date Target Species Age of Sporocarp Species tree shrub DBH of Tree
Inches lA 10993 None NA NA NA lA 101693 None NA NA NA lA 102394 None NA NA NA lA 103093 None NA NA NA lA 11693 None NA NA NA lA 112093 None NA NA NA lA 1112793 None NA NA NA lA 121493 None NA NA NA lA 1212193 None NA NA NA lA 1211893 None NA NA NA IB 10993 None NA NA NA IB 101693 None NA NA NA IB 102394 None NA NA NA lB 103093 None NA NA NA lB 111693 None NA NA NA IB 1112093 None NA NA NA IB 1112793 2 C subalbidus 1 mat 1 overmat LiDe Tan Oak 8 IB 12493 None NA NA NA IB 12112193 1 Ccibarius overmat PsMe Douglas-fir 17 IB 121893 None NA NA NA lC 10993 None NA NA NA lC 101693 None NA NA NA lC 102394 None NA NA NA lC 103093 None NA NA NA lC 11693 None NA NA NA lC 112093 None NA NA NA lC 112793 None NA NA NA lC 12493 None NA NA NA lC 1211293 None NA NA lC 121893 None NA NA NA ID 10993 None NA NA NA ID 101693 None NA NA NA ID 102394 None NA NA NA ID 103093 None NA NA NA ID 11693 4 C cibarius 1 mat 3 overmat LiDe Tan Oak 3 ID 1112093 None NA NA NA ID 1112793 11C cibarius 7 mat 4 overmat LiDe Tan Oak 247 ID 12493 None NA NA NA ID 1211293 None NA NA NA ID 1211893 None NA NA NA IE 10993 None NA NA NA IE 101693 None NA NA NA IE 102394 None NA NA NA IE 103093 5 C subalbidus 5 overmat LiDe Tan Oak 24 IE 11693 IE 112093
1 C cibarius None
overmat NA
Vac Huckleberry NA
lt 1 NA
IE 112793 None NA NA NA IE 121493 None NA NA NA IE 12112193 None NA NA NA IE 1211893 None NA NA NA IF 10993 None NA NA NA IF 101693 None NA NA NA
7
Plot and Date Target Species Age of Sporocarp Species treeshrub DBB of Tree Inches
IF 102394 None NA NA NA IF 103093 None NA NA NA IF 11693 5 C cibarius 5 overmat LiDe Tan Oak 24
(2) IF 112093 None NA NA NA IF 112793 None NA NA NA IF 12493 None NA NA NA IF 121293 None NA NA NA IF 121893 None NA NA NA 2A 10993 None NA NA NA 2A 101693 None NA NA NA 2A 102394 None NA NA NA 2A 103093 None NA NA NA 2A 111693 None NA NA NA 2A 112093 None NA NA NA 2A 112793 None NA NA NA 2A 12493 None NA NA NA 2A 121293 None NA NA NA 2A 121893 None NA NA NA 2B 10993 None NA NA NA 2B 101693 None NA NA NA 2B 102394 None NA NA NA 2B 103093 None NA NA NA 2B 111693 1 C cibarius overmat PsMe Douglas-fir 14 2B 1112093 None NA NA NA 2B 1112793 None NA NA NA 2B 12493 None NA NA NA 2B 121293 None NA NA NA 2B 121893 None NA NA 2C 10993 None NA NA NA 2C 101693 None NA NA NA 2C 102394 None NA NA NA 2C 103093 None NA NA NA 2C 11693 None NA NA NA 2C 112093 None NA NA NA 2C 1112793 None NA NA NA 2C 12493 None NA NA NA 2C 121293 None NA NA NA 2C 121893 None NA NA NA 2D 10993 None NA NA NA 2D 101693 None NA NA NA 2D 102394 None NA NA NA 2D 103093 None NA NA NA 2D 111693 None NA NA NA 2D 1112093 None NA NA NA 2D 112793 None NA NA NA 2D 12493 None NA NA NA 2D 121293 None NA NA NA 2D 121893 None NA NA NA 2E 10993 None NA NA NA 2E 101693 None NA NA NA
- 2E 102394 None NA NA NA 2E 103093 None NA -NA NA
8
Plot and Date Target Species Age of Sporocarp Species treeshrub DBH of Tree Inches
2E 11693 None NA NA NA 2E 112093 None NA NA NA 2E 1112793 None NA NA NA 2E 121493 None NA NA NA 2E 12112193 None NA NA NA 2E 1211893 None NA NA NA 2F 10993 None NA NA NA 2F 101693 None NA NA NA 2F 102394 None NA NA NA 2F 103093 None NA NA NA 2F 11693 None NA NA NA 2F 1112093 None NA NA NA 2F 1112793 None NA NA NA 2F 121493 None NA NA NA 2F 1212193 None NA NA NA 2F 1211893 None NA NA NA
--
-
9
Location Lanphere Dunes located 5 miles west of Humboldt State University Arcata California
BACKGROUND
The Lanphere-Christensen Dunes Preserve is a fenced and protected preserve located on the Pacific coast near the northern reaches of Humboldt Bay Because of location Lanphere recei ves moisture from rain and heavy coastal fog and has moderate temperatures maximum temperatures average 13 degrees with occasional rises to 20 degrees in the Fall months relative humidity averages 70 does not fall below 60 and has periods of several days above 80 (from data collected during 1991 season) Soil temperatures remain above freezing year round air temperatures may fall below freezing during winter months particularly during late December and early January (from data collected during 1990 and 1991 seasons) Coastal Lodgepole pines (Pinus contorta var contorta) predominate at this site
Because the Preserve is a protected area that has been set aside for preservation of several endangered plant species any research has to exist within certain restrictions setting up and surveying of plots must use existing trails the visual impact of plots to other visitors to the Preserve must be minimized and no trampling of existing vegetation is permitted Since the Preserve is located close to the HSU campus frequent monitoring visits to the site are possible making this a valuable location for biological studies of the target species
Investigation of the Lanphere-Christensen Dunes mycoflora essentially began in 1979 and 1980 with research conducted by Sue Van Hook for her Masters degree Van Hook used scattered circular plots of two meter diameter located at trail edge throughout the Preserve She focused on the concept of indicator species and tried to determine if any particular species reliably heralded or accompanied fruiting of any other species
Current research at the Lanphere-Christensen Dunes Preserve emphasizes an understanding of the reproductive biology of four local edible mushrooms indicated in the introduction In 1990 this project using plot protocols developed by van Hook set up fifty semi-permanent plots and four weather stations in the Preserve Each weather station has four rain cans and a maximum-minimum thermometer two stations are under forest canopy and two are in the open These stations are visited every time sampling occurs or when rainfall accumulates Relative humidity is measured with a portable hygrometer soil temperature with a standard soil thermometer placed at a depth of 7-9 cm Plots are marked with a wooden stake at the center and are circular with a diameter of two meters Each plot is numbered and a map of the preserve with plot locations indicated has been generated Additional plots have been added in each project year
In order to accurately evaluate the life strategies of these fungi thefollowing studies have been accomplished recording the individual life span of each mushroom the duration and pattern of spore release the period of time during the season that each type of mushroom fruits the pertinent environmental data throughout the season and the identification of other macromycete species that indicate the onset of fruiting of the edible mushrooms
The concept of indicator species was considered by Sue van Hook in 1980 and in 1992-1993 attempts were made to continue to establish which mushrooms if any fruited approximately two weeks prior to the study fungi A catalog of mushroom species and their respective times of fruiting was kept Information of this sort is particularly valuable to the forest land managers as indicator mushrooms will enable them to patrol more efficiently
A more exact method of locating sporocarps within a plot was developed in 1992 and was continued in 1993 The process is a simple one with a meter stick or a tape originating at the plot center orient it toward the mushroom and measure the distance to the center of the mushroom With a compass attached to the stick and oriented in the same direction take the compass reading In this fashion the field worker generates a numeric name for each mushroom The orientation is listed first followed by the distance in centimeters An example name might be 145-51
Sporulation studies are done by placing microscope slides in metal holders (spore traps) below the fruiting bodies These slides are collected and replaced with fresh slides every 24 hours Soil temperature and relative humidity are recorded for each plot during a sampling visit
STUDY PERIOD SEASON OF 1992
Thirty-two monitoring visits were made to 74 2-meter diameter plots between August 29 and January 4 Twelve visits consisted of obtaining data on rainfall from the four weather stations Twenty monitoring sessions consisted of life-span data observations on three of the four target fungi Armillaria ponderosa Leccinum manzanitae and Boetus eduis Locations of target fungi within plot relative humidity pH soil temperature and moisture were recorded for these life-span studies
Among the four target species studied there was a distinct pattern of fruiting only among two of the target fungi Boletus eduis and Leccinum manzanitae retained similar fructification patterns as in previous years while the patterns for Armillaria ponderosa and Canthareus cibarius were quite different from previous years (See Fig 1 and discussion below)
10
I
SPOROCARP STUDIES LIFE SPAN AND FRUITING SEASON
Fruiting seasonEdible Macromycetes II av(oseason Lanphere Dunes 1990-1993
A vanderosaArmillaria der 1990 dec 17 dec 28 11 4
Feb 9 1991 jan 1 jan 11 10 5 1992 nov 12 dec 11 29 14 1993 nov 25 dec 8 13
1 Jan 8I 1990 nov 19
Boletus edulis
dec 12 15 8 Dee7 1991 nov 20 dec 14 22 17
1r-
Tr
1 1
I I r
Nov5
1992 1992 1993
oct 22
nov 22 oct 29
nov 1
dec 8 nov 18
10 26
20
5 123
Leccinum manzanita Oct4 1990 nov9 dec 14 35 22
1991 nov 30 dec 31 31 15
1992 oct 22 nov 1 10 5 Sep2 1993 nov5 nov 29 24 138
Cantharellus dbarius
90 91 92 93 90 91 92 92 93 90 91 92 93 90 91 92 93 Aug 1 1990
1991
dec31
oct 30
154 92
Armillaria Boletus leccinum Cantharellus 1992 sep 29 61 1993 nov2 63
Figure 1
Cantharellus cibarius
Life span of Individual Sporocarps (numbers in boxes= number of days) 1992 As of 6 June 1992 several sporocarps
were detected in plots however all were too old for life span qr sporulation data A similar phenomenon was noted on 14 August
and 21 September as the few sporocarps bJn ~n-D 8 encountcrc-d-had no estimable initiation date
0 D U U G 0 I 6 IDec3 as they were too old and dry From the 21 September until early January the rest of sampling season no other sporocarp of was
B 1 S Ef b B Nov5 sighted in the study area thus the fruiting season for this fungus ended nearly 30 days earlier than in 1991 and over 3 months
234 5 6 1 2 2 3 Oct 2 earlier than in 1990 (see Fig 1 and Table 1)
Arminariapo1Iderosa BolausaMis Lemum mananitlaquo This kind of phenological behavior seems to Figure2
correlate well with the data from Oregon obtained by Norvell (1992)
Armillaria ponderosa
In 1992 the fruiting season for Armillaria ponderosa was nearly 4 weeks earlier than in 1990 and five weeks earlier than in 1991 (see Fig 1) A review of the rainfall data indicates that at least 8 cm of rain is required for initiation of fruiting in this species (see Fig 3) In 1992 the fruiting season lasted 29 days much longer than either in 1990 and 1991 and terminated as in the previous years with the onset of freezing temperatures (Table 1)
Complete life span data was obtained for 6 sporocarps of Armillaria ponderosa with the shortest being 18 days and the longest being 28 days (see Fig 2) All sporocarps were frozen solid in mid-December and thus these life span periods are not as long as is typical for the species
Boletus edulis
Sporocarps of Boletus edulis were first observed in mid-October of the 19~)2season whereas in 1990 and in 1991 sporocarp initiation was observed in late November (see Fig 1) The accumulated rainfall in mid-October 1992was about 5 cm that corresponds nicely with the data obtained in 1991but is about 15 cm more than was observed in 1990 Sporocarp initiation in this species is dictated by a minimum amount of moisture about 35-43 cm when the average maximum temperature is below 18 degrees and the average minimum temperature is just above freezing (see Fig 5) However with warmer t~mperatures more
11
moisture is required for sporocarps to begin to form An interesting anomaly previously not observed occurred this season in that this species had two fruiting periods one in mid-October and a second in mid-November the latter period corresponds exactly with onset of fruiting in 1990 and 1991
Complete life span data was obtained for only two sporocarps of Boletus edulis (See Fig 2)
Leccinum manzanitae
In 1992 initiation of fruiting in mid-October by Leccinum manzanitae occurred about 1 month earlier than in 1990 and nearly a month and half earlier than in 1991 (see Fig 1) In each of these seasons sporocarp initiation began when cumulative rainfall was over 5 em and just before a very heavy rainfall thus temperature did not seem to have an effect on sporocarp initiation in this species
Complete life span data was obtained for 3 sporocarps The life span varied between 10 and 16 days that corresponds well with data obtained in 1990 and 1991 (see Fig 2)
INDICATOR SPECIES
The use of Chroogomphus vinicolor as the indicator for Boletus and Leccinum as suggested following the 1990 and 1991 seasons will have to be re-evaluated as this species did not fruit this season until several weeks after the boletes started to fruit however C vinicolor was the indicator species for the second flush of Boletus edulis sporocarps Another candidate for an indicator species is Hygrophoropsis aurantiacus which fruited about one week prior to sporocarp production by the boletes
SOIL MOISTURE pH SOIL TEMPERATURE AND RELATIVE HUMIDITY STUDIES
Soil moisture pH soil temperature and relative humidity were recorded for each plot that had sporocarps of the target species No trend could be determined for the sporulation studies However sporocarp formation in Boletus and Leccinum favored areas with a pH of between 63 and 66 as well as a soil moisture level of between 20 and 25 In Armillaria ponderosa sporocarps favored sites with a pH near or more typically above 66 and with soil moisture content that begins at 28 and quickly drops to between 10 and 20
SPOROCARP NUMBERS
Because of poor data collection valid sporocarp numbers for LanRhere Dunes were not obtained for the 1992 mushroom season -
r
Annillaria ponderosa (Figure 3)
1991
1990 0 C em
0 35 35 C em
35 3035
30
30 30 25 25
25 25 20
begin end 20
20 - pegin end 20 shy
15 15 1515
10 10 10 10
5 -5 -5 -5
-10 -10 0 -10 ~ ~ ~ m ~ ~ m m ~ ~ ~ m 00 ~ ~ J2 J3 J 51 ~ 01 02 03 ~ N1 N2 N3 ~ 01 02 00 ~ JI J2 J3 J
1992 1993
0 0
C em C em
35 35 35 35
-rain 30 30 30 30
min temp 25 25 25 25
Pegin 20 20
- max temp 2020 end begin
15 d
15 15 ---~ - - -15
10 10 10 10
-5 -5 5 -5
-10 ~-10 10 -10 ~ ~ ~ m ~ ~ m m ~ ~ ~ 00~JIJ2J3J4 51 ~ 01 02 03 ~ NI N2
Cantharellus dbarius (Figure 4) ~
1991
1990 0 C em
0 35 35 C em
35 35 30 30
30 30 25 25
25 25
20 20 20 20
15 15 15 15
10 10 10 10
-5 -5 5 -5
10 -10 -10 -10 ~ ~ ~ m ~ ~ m m ~ ~ ~ m 00 ~ ~ J2 J3 J4 51 ~ 01 02 03 ~ NI N2 N3 ~ 01 02 00 ~ JI J2 J3 J
1992 1993
0 0 C em C em
35 35 35 35
-rain
30 30 30 30
min temp 25 25 25 25
end end - - maL temp 20 20 20 20
15 15 15 IS - T-~ 10 10 10 10
5 I
5 5 5 -5
10 ~
~ ~ m ~
~ m m ~ ~ ~ m 00 ~ ~ n n
10 J4
-10 51 54
01 02 03 ~
NI
N2
T N3
~ ~ 01
~ 02
~ 00 ~ JI J2 J3 J4
- 10
- --
1991
1990 C em
35 35 C em
35 35 30 30
30 30 25 25
25 25 20
beg end 20
~ 20 --- beg81 end 20 - 15 15
15 ---- --15 - - - - - - -
10 - - 10 10 10
- shy
5 -5 5 -5
-10 -10 0 10 $1 54 0 02 03 04 NI N2 N3 N4 D1 D2 D3 D4 J1 J2 J3 J4 ~ 54 ~ ~ 00 04 ~ N2 m N4 ~ 00 D3 D4 n n n J4
1992 1993 C em C em
35 35 35 35 -ran
30 30 30 30
ninotemp 25 25 25 25
beg811 end 1 begin 2 - - -maxtemp 20 --
20 20 begn
20
15 5 15 15--~_ -
0 -l j 10 10 10
I
5 5 5 -5
10 -- -10 -10 10 ~ 54 ~ ~ 00 04 ~ N2 m N4 D2 D3 D4 JI J2 J3 J4 $1 54 01 02 03 04 N1 N2 N3 N4 DI D2 D3 D4 JI J2 J3 J4
Leccinum mpoundlnzanitae (Figure 6) -
1991
1990
C em 35 35
C em 35 35
30 30
30 30 25 25
25 25beg81 end
20 20
- - begn end20 20
5 1515 15
10 010 10
- -shyshy
5 5 5 5
-to ~ -to 10 to $1 54 01 02 03 04 NI N2 N3 N4 D1 D2 D3 D4 JI J2 J3 J4 51 54 01 02 03 04 NI N2 N3 N4 DI D2 D3 D4 JI J2 J3 J4
1992 1993 C em C em
35 35 35 35 -ran
30 30 30 30
nin temp25 25 25 25
beg81 end begn end - - maxtemp 20 20 20 20- - 15 15 15 15
------r---lt~ -10 10 10 10
5 -5 5 5
10 -10 - 10 ~ 54 ~ ~ 00 04 ~ N2 m N4 ~ 00 D3 D4 n n n J4 -1degS - 54 01 02 03 04 N2 N3 N4 DI D2 00 0 JI n J3 J4
14
SPORULA nON STUDIES
Complete sporulation data for the entire life span was obtained for six Armillaria ponderosa sporocarps and one Boletus edulis sporocarp No studies were conducted on Cantharelus cibarius nor was complete life span sporulation data obtained for Leccinum manzanitae
Spores were gathered by placing a spore trap under the hymenium of a viable sporocarp and leaving it in place for a 24 hour period Once a sporocarp collapsed it was considered dead and spore collection ceased The sporulation pattern (Figs 78) for Armillaria was different when compared to past studies Four of six sporocarps studied produced most of their spores~during a single period during their life span 1 (B) of these produced spores at the beginning of the life span as was previous observed in 1990 and 1991 and the remaining 3 (A D E) produced spores near the end Each of the remaining sporocarps
produced spores during two periods during their life span C at the beginning as well as the end and F at the beginning and the middle No correlation with any
spores Armillaria ponderosa environmental factor could be 18E7 determined
80ES In every instance observed 116E7 during this season as well as in the
- 14E7 - - last two seasons sporocarps of 60ESI Armillaria ponderosa did not 112E7
produce spores over their entire 110E7 life span Moreover a majority of - -
40ESI
180E6 the sporocarps produces an abundance of their spores
160E6 immediately after expanding from
20ESIshy 140E6
a button Thus the spore load of this species could be dramatically
120E6 affected by harvesting sporocarps in the button stage
0 dec13 dec1S dec18 dec20 dec2S dec28 jan2 jan6 jan9 jan12
990-6 days 99-10 days ~
Figure 7
number of spores
1SE8
1IIIIIIII ~days
v-gtl ~8 days 10E8
f~j ~8days
SOE7 l~ ~Sdays - ~8 days
k1 ~9 days nav 12 nav 19 nov30 dec 1 dec 2 dec 3 dec6 dec11 dec16
1992
Figure8 -
0
15
Boipoundtus edulisso
f8 In Boletus eduis sporulation occurred steadily as ea the fungus developed (see Figs 9 10) Eventually 8 sporulation decreased and even ceased as the sporocarp 1E8 aged As in previous seasons sporocarps of this species ~os produced large numbers of spores over their entire life
span with the majority of spore being produced in the f8
middle of the life span Although no sporulation 8 lIE
studies were completed for Leccinum manzanitae 4 lIE previous studies indicate the pattern is similar to that of
0023oa2S4 010 oa23 p8 M 0 oa23 0028 4 oa23 0028
Boletus eduis (see Fig 11) oa25 oa25 13 125 010 0
18 21 18Fig 9
Boletus edulis
1m po Leccinum manzanirae po
---Be8 81E8lIE
2E8
63E8
50e8 4 lIE4E8
4SE8
SEa
1E8 25e8
~ noy 22 noy 27 nov30 doc 13 28 - laquo4 do d _n - _8 0laquo1 0lt13 21 900- 16
Fg0 -1--
STUDY PERIOD SEASON OF 1993
The mushroom research at Lanphere Dunes Preserve was performed on a semiweekly basis from September 10 1993to January 9 1994 Seventy-nine 2-meter diameter plots were monitored on Tuesday and Friday of each week for appearance of any of the four target species Leccinum manzanitae Cantharellus cibarius Armillaria ponderosa (Tricholoma magnivelare) and Boletus eduis
When a sporocarp was detected in a plot it was monitored twice weeklythroughout its entire lifespan Monitoring consisted of measuring and recording soil pH and moisture content using a Kelway soil tester soil
temperature at a depth of7 to 9 cm using an Ertco soil thermometer and relative humidity and air temperature using a VWR digital humidity and temperature meter Each semiweekly visit induded monitoring four weather stations in different locations in the Preserve Each station was equipped with a rain gauge and a Taylor maximumminimum thermometer
WEATHER (see Figures 12-17)
In 1993rainfall during the monitoring period totaled 1273cm which makes it the second driest season since this studybegan in 1990 The 1993season was dry and warm with the total accumulated rainfall pattern and the maximum temperaturepattern being similar to those of the 1991season The average minimum temperature pattern on the other hand was unique
The 1990season was cold and wet the 1992season was wet and warm and the 1991and 1993seasons were dry and warm
-
16
Cumulative Rainfall (Figure 12) ~ Trend (Figure 13)
em 35
iz 30 I
28 I I 23j34
25
2~J 20 I
I 15 1P21421
1U I 1231~3 - 105w1I2
10 W~
51 54 01 02 03 04 N1 N2 N3 N4 01 02 03 D4 J1 J2 J3 J4
Minimum Air Temperature (Figure 14)0C
25
20
15
10
~lt-- ~-~- - --~v--- ~- gt
-- -5
0 51 54 01 02 03 N1 N2 N3 N4 01 02 03 D4 J1 J2 J3 J4
Maximum Air Temperature (Figure 16)
0 C
25
20
15
10
I
51 54 01 02 03 N1 N2 N3 N4 Of 02 00 D4 J1 J2 J3 J4
om 35
30
shy25 -
- 20
f5
1993 10 shy
- 1992
1991
1990 ~ 54 ~ ~ ~ ~ ~ ~ ~ ~ ~ ~ 00 D4 n J2 J3 J4
~ Trend (Figure 15)
c
25
20 --- -- shy
- - - - - -
--
- -- -
10 shy
1993[ 1 L --- lt
-s -1
-10 0 51 S4 01 02 03 N1 N N3 N4 01 02 03 04 JI J2 J3 J4
~ Trend (Figure 17)
0 C
25
- - --20 - 15
10
~ ~~~L~t~-~--~ c ~~ -~- -~-~~
051 54 01 02 03 N1 N2 N3 N4 01 D2 D3 D4 J1 J2 J3 J4
17
LIFE SPAN AND FRUITING SEASON
Among the four target species studied there was a distinct pattern of fruiting among all four of the target species
Cantharellusdbarius (Figures 14 Table 1)
Cantharellus dbarius began fruiting before our study started and continued fruiting until day 63 of the study Fifteensporocarps from seven different plots were recorded The average lifespan for a Cantharellusdbarius fruiting body was 1425 days
The fruiting season of sporocarps was 63 days the longest of all the target species and began during the summer when the rainfall was below a centimeter similar to the season found in Patricks Point State Pink The season ended when rainfall began to increase a pattern similar to that in Patricks Point State Park The 1993 season was similar in length and in pattern to that of 1991
The four environmental factors recorded at initial sporocarp observation averaged as follows
Average soil temperature 149degCAverage soil pH 698Average soil moisture 946Average relative humidity 728
At Cantharellus dbarius fruiting body death the averages of the environmental factors recorded were
Average soil temperature 124degCAverage soil pH 697Average soil moisture 51Average relative humidity 672
Armillariaponderosa (Figures 1 3 Table 1)
Armillariaponderosa(=Tricholomamagnivelare)was observed in two plots with a total of two sporocarps recorded Fruiting season for this species was the shortest of those studied beginning on November 25th and ending on December 8th
The life span was 13days and as in previous years the fruiting season was abruptly terminated by freezing temperatures Fruiting was initiated when the average maximum temperature dropped below 15degC and the average minimum temperature was near freezing A distinct correlation existsbetween the beginning of the fruiting season and the differencebetween average maximum temperature and average minimum temperature fruiting seems to begin when the temperature difference is at least 15 degC a pattern which appears each season over the last 4 years -
At the beginning of button stage for this species the environmental factors aver~
Average soil temperature 94 degCAverage soil pH 615Average soil moisture 1000Average relative humidity 8145
At fruiting body death the observed averages for environmental factors were
Average soil temperature 108degCAverage soil pH 61Average soil moisture 425Average relative humidity 8955
Boletus edulis (Figures 15 Table 1)
Boletuseduliswas not observed in any of the designated plots but was found at different locations in the Preserve Sporocarp-related data was not recorded for Boletusedulissince it did not appear in marked plots however beginning and end of fruiting season was noted The fruiting season for this species went from October 29 to November 18
Sporocarps of Boletusedulishad a fruitingseason of 20 days similar to in length to that found during the 1991and 1992 seasons and similar in length to that of Leccinwnmanzanitae
A pattern has developed over the past 4 years with the fruiting season beginning when the rainfall reaches at least 275 em in dry years 1991and 1993and when the rainfall reaches 5 em in wet years 1990and 1992
Fruiting ended when rainfall abruptly increased and the average minimum temperature dropped This pattern was similar to that found in previous years and suggests that the combination of increased soil moisture and spil temperature cause the termination of fruiting and the minimum temperature dropped near or below freezing
lecctnwn manzanltae (Figures 16 Table 1)
Lecdnum manzanitae was observed in four plots and seven sporocarps were recorded Fruiting season began on November 5th and continued until November 29th The average lifespan of a Lecdnum sporocarp was 138 daysshy
18
------
The fruiting season lasted 24 days similar to that of Boletusedulis Fruiting is initiated in dry years when the rainfall nears 3-5cm and in wet years when the rainfall nears 5 cm As in Boletus
edulisfruiting is terminated when the rainfall increases and the average minimum temperature drops to near 0 degc
The average environmental factors calculated for when fruiting began for Lecdnum manzanitae were
Average soil temperature 64 degC Average soil pH 643 Average soil moisture 15 Average relative humidity 825
When Lecdnum manzanitae fruiting body death occurred the observed averages were
Average soil temperature 90 degCAverage soil pH 646Average soil moisture 252Average relative humidity 761
-
- --- -
19 Location Patricks Point State Park near Trinidad California
BACKGROUND
Patricks Point State Park is located about 20 miles north of Humboldt State University on the Pacific coast near Trinidad California The study area is dominated by Pacific Hemlock (Tsuga heteropylla) and Sitka Spruce (Picea sitchensis) This site was added to the project in the 1992 season through the cooperation of the North Coast Red woods District of the California Parks and Recreation Department This is a popular and easily accessible park and a favorite site for mushroom pickers Picking mushrooms is prohibited in the park but proximity to good roads and uncontrolled accesses through unfenced boundaries make it easy for pickers to get in and out quickly
STUDY PERIOD SEASON OF 1992
During the summer of 1992 a permanent plot of 1024 square meters was established in Patricks Point State Park This plot was divided into 256 subplots of four square meters each The location of all trees and vegetation within each subplot was surveyed and noted accurately on individual maps (See Figure 7 for a sketch map of the entire plot) Monitoring of the subplots began on August 24 1992 however sporocarps of Cantharellus cibarius were observed in mid-June before the permanent plot was established Each monitoring visit involved the following once it was established a target species was fruiting in a subplot the sporocarp was assigned an identification number the date and developmental stage were noted (ie button or mature) and the subplot number recorded In addition relative humidity soil temperature soil pH and soil moisture content were recorded for each subplot in which sporocarps were observed Furthermore sporocarps of other epigeous fungi were noted which will provide information on indicator species
Sampling occurred from late August 1992 through March 1993 Ten individuals from the Humboldt Bay Mycological Society (HBMS) volunteered their time for the entire sampling period with their supervision conducted by David Sime from the Humboldt State University mycology laboratory Two individuals were used during each of the twice weekly sampling periods that lasted from 4-6 hours therefore this project involved approximately 450 volunteer hours of assistance
In addition life span and sporulation data were obtained twice weekly for Cantharellus cibarius by placing microscope slides under the hymenium of the sporocarps in the morninglt and leaving in place for 24 hours Volunteers were not used for this aspect of the study
Sampling methods for Boletus edulis were different from methods for Cantharellus cibarius Thirty 2x2 meter plots were established in Abalone campground during nine samplIng -dates during November and December Each plot was located around a group of sporocarps deemed fruiting from the same mycelium Relative humidity soil temperature soil pH and soil moisture content were recorded for each of the plots Life span and sporulation data were also obtained Volunteers were not used for the studies on Boletus edulis
Vandalism by recreational and commercial mushroom pickers was reduced in the permanent plot by posting easily visible iridescent signs and painting the sporocarps to indicate their potential uselessness for harvesting purposes However all of the sporocarps located outside the permanent plot were either harvested by recreational or commercial mushroom pickers or were eaten by various mammals
Overall observations for 364 sporocarps of Cantharellus cibarius were recorded with a majority of the sporocarps located in the southeastern quarter of the permanent plot (see Fig 18) Because of mammal predation and commercial or recreational mushroom harvesting 232 sporocarps were lost thus complete life span and environmental data were obtained for 132 sporocarps Furthermore 163 microscope slides for spore collections were placed and collected from 12 different sporocarps of Cantharellus cibarius over their complete life span
Observations on 30 different Boletus edulis sporocarps yielded only two complete life cycles however all Boletus edulis sporocarps were lost from intense commercial or recreational mushroom harvesting
Weather data from May until the projects inception on 24 August was provided by Virginia Waters (HBMS) after August 24 weather data was recorded in the permanent plot on a continuing basis
SPOROCARP STUDIES LIFE SPANS SEASON AND SPOROCARP LONGEVITY
Cantharellus cibarius
As early as June 7 a few scattered sporocarps were observed in Patrick5 Point State Park however all of these were outside the permanent plot Initiation of a large number of new sporocarps began in the plot on August 24 most probably the result of accumulation of moisture from fog drip that was retained in the woody debris and correlated with gentle drop in the air temperature From the August 24 until October 21 new sporocarps were produced in a series of flushes a phenomenon similar to that found in the Oregon studies (Norvell 1992) The stimulus for each flush seems to be a rise in both the average maximum and
average minimum air temperatures The largest numbers of new sporocarps were produced during the month of September when only 025 cm of rain occurred and the average maximum temperature was above 15 degrees and the average minimum temperature did not drop below 10 degrees (Fig 1921) As the minimum temperature dropped below 15 degrees there was an abrupt reduction of sporocarp initiation particularly in the months of November and December (Fig 20 21)
As a general trend the number of new sporocarps produced as well as the total number of sporocarps decreased steadily as the accumulated rainfall rose and both the maximum and minimum temperatures dropped (see Fig 192021)
numblaquo fnow -
35 35
30 29 30t I 11
2S 25 yen
2020
I15 15 i
10shyr ~
11 ~ ~ ~ 0 0
Au24SltoltI 457911 19 24 0lt12 911 19 30 11 Doc2 Au24 $opt 1 4 5 7 9 11 19 24 0lt12 9 11 19 30 11 Doc2 29 3 14 20 29 4 14 21 Nov10 1929 3 14 20 29 4 14 21 Nov10 19
TrendNumber of New Sporocarps
Figure 19 (Canthpoundzrellusdbarius)
numbolt d 0C8Ip$
100 100 =~ 90 90 90 -so70 -70 so ~
6O~ so soF 40 40 30 3020 20 10
tor -~ 0
9124 11i 211 0
91 ICY1 11 t19 9124 91 101
111 121 11 119
do
Total Number of New Sporocarps Trend
Figure 20 (Canthpoundzrellusdbaius)
nlnn m C
15 40 15
r 36 i 10 - 31 - - 28 I ( ---_ t51 - _J 1 --
I 10
- -~-~-- ~10 to to - ~
t1 mootomp
- - mtom
~ j f - ~~~~ 0 (t)C5) no 11 01 oS n12 ntO0130 dt to J~ ~ ~ ~ ~ ~ ~ ~ ~ ~ r~l~ to If15Jnot o n15 n11n15 dtl dt () c 01 0 11 01 19 n5 oil 0 013 0 05
II=mOltII 3 9 nl n15 n22 n25 12 112 119 0 21 102101 1014)10251 nl 14
Trend Rainfall Maximum and Minimum Temperatures
Figure 21 (Canthpoundzrellusdbarius)
21
The mid-point for the fruiting season was around October 1 with the maximum number of sporocarps being found from the first week of September through the second week of October (see Fig 20) The total number of sporocarps reached zero in January when minimum temperatures dropped below 33 degrees Thus the fruiting season for Cantharellus dominated stands in Patricks Point State Park lasted 152 days within the permanent plot (see Fig 24) and approximately 227 days within the entire park When rainfall reached nearly 20 cm in December new sporocarp production ceased (Fig 1921)
Complete life span data was obtained for 132 sporocarps of Ca1Jtharellus cibarius with the shortest being 10 days the longest 92 days the average life span was 44 days The largest number of sporocarps had a life span of 58 or 40 or 21 days (see Fig 22)
On the average sporocarp longevity per number of sporocarps produced for Cantharellus cibarius increased each month beginning in September and ending in December (Fig 23) However September had the longest lived sporocarps with seven sporocarps living up to or past 80 days Analysis of the data on rainfall and air temperature did not readily provide an explanation and thus this characteristic could possibly be genetically controlled or related to host intervention
nu- _0000 HI_n in 11 numbo 1 doyo
100
10 90 - -- - -- - - -- - -- - - - -
1[tJ 90 -- -
1111 so 5 - -4-
1IiI 10
92 90 84 78 74 68 84 62 eo sa sa 54 52 SO48 46 44 42 40 38 35 31 29 26 24 21 16 10 1 Sopt 30 gtOc13 N 1 91 95 80 77 72 66 63 61 58 57 55 53 51 49 47 45 43 41 39 38 33 30 28 25 23 18 5 00lt1
to n in dyo
Number of Sporocarps and their life span Life Span of Individual Sporocarps related to the beginning of furiting
Figure 22 Figure 23
PH SOIL MOISTURE SOIL TEMPERATURE RELATIVE HUMIDITY
Cantharellus cibarius
In Cantharellus cibarius sporocarp initiation within most of the subplots is related to a decided rise in soil moisture after a period of relative dryness and in most instances with an accompanying rise in soil temperature in almost all instances the relative humidity is less than 100 The death of the sporocarp seems to be correlated with a distinct drop in soil moisture after a prolonged period of rather wet soil The pH of the soil seems to have no bearing on sporocarp initiation or cessation Generally sporocarps of Cantharellus seem to be found in econiches that have pH above 65
-
22
J20
Boletus eduis
Initiation of Boletus eduis sporocarps began the third week in November and lasted about three weeks (Fig 24) Apparently an accumulation of at least 10 cm of rain was necessary for sporocarps to begin to form Sporocarps of Boletus also seem to prefer sites with a pH of between 60 and 65 (Fig 25)
-
Ian ~ ~JJ1J ~ ~
7 I
I I r--- III I
II ~
D I I ~ t I I r_14
II i ~~~ I~gt (~ o~ 0-2 50 I I
~ - ~J J 0
-Cd2 ~
--shyrP63 Sop
Aug25 50 ~m
cn1lM 80
pH Relative Humbidity Soil Temperature Soil Moisture
Fruiting Season 1992 4 plots partical life span for Boletus eduis
Figure 24 Figure 25
SPORULATION STUDIES
During the four months when sporocarps were observed data was gathered on the duration and time of sporulation for each of the two target species Spores were obtained by placing microscope slides in metal holders (spore traps) under the hymenium of a viable fruiting body Once Deuteromycetes overtook the sporocarp or the hymenophore collapsed the fruiting body was considered dead Spore traps were left out for a period of 24 hours and were collected twice a week Spores were counted on thirty 1 micron grids for 163 micro slides for a total of 4890 spore measurements
Micro slides were collected twice weekly over the entire life spari~of 12 different sporocarps of Cantharelus cibarius Distinctly different patterns of sporulation were observed (see Fig 26) In general sporocarps of Cantharelus cibarius produce far less spores per day than any other of the edible mushrooms studied with 10 of 12 sporocarps having less than 1000000 spores per square centimeter of hymenophore produced per 24-hour period Maximum spore production during the life span of a sporocarp of Cantharelus is dependent on a rise in soil moisture accompanied by a distinct rise to near or at 100 relative humidity and these conditions must be preceded by a period in which the soil moisture and the relative humidity had dropped
4E6
4E64E6
3E6
2E6
2E6
2E6
1E6
5E5 r
14 days 50 days 50 days 66 days 58 days 48 days30 days 14 days 50 days 28 days 40 days 38 days
Spore production for 12 different sporocarps of Cantharellus cibarius
Figure 26
0
23
BIOMASS STUDIES OF CANTHARELLUS CIBARIUS
Pileus diameters and diameters of the stipe apex were recorded for 81 sporocarps of Cantharellus cibarius over a ten-week period Thirty-one of the sporocarps were located within the permanent plots and 50 were located outside the plot All of the sporocarps outside the plot were harvested in the same manner and fresh and dry weight recorded for each Age classifications were established for all 81 sporocarps
Preliminary Results
Of the 31 sporocarps studied within the plots 20 were lost due to some type of vandalism Complete data was recorded for the remaining 11 sporocarps over their entire life span Thus correlation of biomass with life span and with environmental data should be possible
Results indicate that biomass increases in direct proportion to the pileus diameter as well as to the stipe diameter It would appear that it may be possible to determine biomass from measuring sporocarp diameter However the data has to be analyzed
INDICATOR SPECIES
Observations of the fungal flora indicate that Chroogomphus tomentosus may be the indicator species for sporocarp initiation of Cantharellus cibarius in late-October and Tricholoma inamoenum may be the indicator species for initiation of fruiting of Boletus eduis
COMPARISON BETWEEN LANPHERE DUNES AND PATRICKS POINT STATE PARK
Lanphere Dunes is located approximately 20 miles south of Patricks Point State Park and is a sandshydune ecosystem All of the plots are located in a Lodgepole-pine dominated ecosystem with Huckleberry and Dwarf Manzanita being the dominant understory shrubs The Preserve is dominated by various completely open areas in which sandy soils are densely covered with mosses and lichens that retain moisture and thus prevent desiccation
The permanent plots established in Patricks Point State Park are dominated by large conifers in a closed canopy stand with the dominant conifer being Sitka Spruce Very little understory exists in the plot and the deep needle dominated humus is filled with woody debris that fUrtlttionsto keep the soil moisture high the closed canopy prevents desiccation
Cantharellus cibarius and Boletus eduis occur in both areas (see Fig 27 for comparison of fruiting seasons) For Cantharellus cibarius the length of the fruiting season is not as long in Lanphere Dunes as it is in Patricks Point State Park In 1992 Cantharellus cibarius dominated the fungal flora in the Park but was conspicuously reduced and almost absent in the Dunes in both areas the environmental conditions were the same
Boletus edulis began to fruit approximately 1 month later in Patricks Point State Park than in Lanphere Dunes In each case the lengths of life span of sporocarps were similar and the number of spores produced by each sporocarp was equally large
Leccinum manzanitae and Armillaria ponderosa occur in Lanphere Dunes the former species is rather rare in the Park while the latter species apparently does not occur at all
Jon8 Jon 13
DcI
I I I I Lanph8ltDune
Doc 14
- _14
I
I
I
I 0lt130 Del
i Sp30 i Sop
Aug30
990 99 Lshy
992 99 _udolis
Dune 992
PoInda PI
I I I
990 99 Cmuh=1las abarius
99
l Polnda PI
Au
Aug1 -
Comparinson of Fruiting Season of Target Species
Patricks Point State Park and Lanphere Dunes
Figure 27
24
FRUITING SEASON OF 1993
During the summer of 1993 two new permanent plots 2 and 3 were established in Patricks Point State Park with the intent of studying sporocarps of Boetusedulis Plot 2 is located southwest of Plot 1 which was established in 1992 It is 1024 m2 and is divided into 256 subplots each subplot is 4 m2 Plot 3 is located approximately 50 yards north of Plot 1 and is composed of324 m2plot 3 is divided in 81 subplots each subplot is 4 m2 The location of all trees and vegetation within each subplot has been surveyed and noted accurately on individual maps The subplots associated vegetation and mushroom sporocarps have been entered into a computer and maps are presently being analyzed and printed during the summer of 1994 Although fruiting of Canthareuscibariuswas noted in mid-May monitoring did not begin until July 25th when the first flush of a nine sporocarps were observed in Plot 1 Monitoring continued until November 7th when nearly all sporocarps were deemed absent from the plots The monitoring protocol was identical to that established during the 1992 season
Sampling occurred from July 25th through November 7th on a weekly basis Eleven individuals from the local community oriented Humboldt Bay Mycological Society volunteered their time once a week during the entire sampling period with their supervision conducted by David Sime from the Humboldt State University mycology laboratory Two individuals from the Mycological Society would sample 4 hours per week and these individuals sampled for 16 weeks In addition two senior students from the Humboldt State University Department of Biological Sciences completed their senior thesis by sampling Plot 1 each of these students sampled 12 of the plot two times a week for 20 weeks Each sampling period lasted 4 hours Therefore this project involved approximately 260 volunteer hours of assistance
In addition the maximum and minimum air temperature and the amount of rainfall was sampled once a week for 52 weeks Finally sporulation studies on Canthareluscibariuswere conducted twice weekly from July 25th until October 24th and prepared slides on which spores were deposited were obtained during the entire life span of 56 sporocarps A total of 3477 slides were obtained during this period and the data is still being analyzed
SPOROCARP STUDIES LIFE SPANS FRUITING SEASON AND SPOROCARP LONGEVITY
Cantharelus cibarius
Observations were obtained on 529 individual sporocarps of Canthareluscibarius In plot 1 observations were made over the entire life span of 335 sporocarps mammal predation accounted for a loss of 73 sporocarps while vandalism claimed 60 In Plot 2 data was obtained over the entire life span of 47 sporocarps only 9 were lost to mammals and 5 to vandals No sporocarps were observed in Plot 3
-
Fruiting Season
The fruiting season of Ccibariusbegan on 24 May 1993 and lasted until 1 Dec 1993 Fruiting was not abundant however until the 27 of June 1993 Of the micrometeorological factors which may affect the beginning of the fruiting season the average minimum air temperature and the amount of rainfall are most important
As the mean minimum air temperature at the soil surface (hereafter indicated by T min) in Plots 1 and 2 increased from 55 in April to 9 degC in June sporocarp production began and thus the fruiting season was initiated The fruiting season continued until the mean minimum air temperature dropped below 9 degC (see Fig 28) Initially the T min climbed in May 1993 from 9 degC to 102-11 degC in August At this time (29 July-II August) only 55 new sporocarps were initiated As the T min dropped to 93 C 214 new sporocarps were observed during the month of September Once the T min began to rise again in mid-September to above 10degC there was a decrease in new Ccibariusprimordia to only 53 produced As such it appears that the mean T min must rise for sporocarp initiation to occur and must reach a critical level of 10 degC for the mycelium to activate large numbers of primordia
The cumulative rainfall for the three months preceding the initiation of the fruiting season was a minimum of 23 cm and a substantial amount ofrain occurred in the month preceding the initiation of fruiting (Fig 29) Rainfall during peak production was less than a centimeter (see Fig 28 31) The fruiting season is initiated during the driest part of the year and sporocarp production occurs when it is not raining heavily An analysis of the data soil moisture (SM) soil temperature (ST)and soil pH did not readily provide an explanation as to any influence on the phenology of Ccibaius However at Relative Humidity of 60 for sporocarps to form and if the Relative Humidity rises to above 90 sporocarp production decreases and eventually ceases (Fig 32)
-r
25
oC
26
24 - - - - - - - - - - - - - - - - - - - - - - - - - - - - - - - - -
22 - - - - - - - - - - - - - ~- - - - 202
20 - - - - - - - - - - - - - - - - - - - - - - shy
2 - - - - - - - - - - - - - - - - - - - - - - - - _ - - - - - - - - - - - avg max
0 temp May July Sept Nov Jan93 Mar May July Sept Nov Jan94 Mar May
Jun Aug Oct Dee Feb Apr June Aug Oct Dee Feb Apr
Figure 28
monthly rain (em) yearly rain (em)
150shy -I -
75 - - yearly rainfall
~ ~ ~ ~ ~- i - ~ -- -y~ ~ ~-- -~- - ~- - -~- ~ -~- -- -- --- ~ ~ 60 - monthly~
--- -- - - _t - 45 rainfall
~ ~~~) ~j ~(t ~ V- ~~~ tLtJt- J~= Y ~~ 30
- - - - 15
0
(Figure 2829 Cantharellus dbarius)
Total Population
As in the 1992 the total number of sporocarps found during the entire fruiting season rose dramatically during the first two months of the season and in 1993 the highest number of sporocarps present at one time reached a peak of 270 sporocarpsfrom October4ththroughthe7th (Fig30)Rain in the amount of 16 cm which occurred on July 23rd appears to be the stimulus to increase the population from 9 sporocarps on July 23rd to 70 sporocarps on August 16th Another 15 cm ofrain which occurred on Aug 16th is the stimulus to increase the number ofsporocarps to 270 on October 4th As in 1992 the majority of sporocarps of Cantharellusdbarius are produced by only 3 cm of rain As the rainfall
26
increased 50 mm (50 cm) the total number ofsporocarps began to decline Therefore as in 1992 an increase of rain after a dry period is the stimulus to start a decline in the total number ofsporocarps (Figure 31)
In 1993 the total number ofsporocarps in Plots 1 and 2 dropped by 97 abruptly after the average maximum air temperature rose to nearly 20degC and remained at this temperature for over one week Between 23-26 October the Relative Humidity dropped more than 50 the Soil Moisture fell over 40 while the average maximum air temperature rose to + 19 degC in the study Plots (Fig 31 32) Once average minimum air temperatures were below 7degC sporocarp formation ceased
number of sporoearpo 300 20
25O~
J15 ~r
200~ 1 ~ ~ ~ ~ ~ 1 ~ t )~~TTgtHlt ~
150 ~ ~ ~ ~ ~ ~j ~ ~ ~ ~ ~ ~ ~ ~ ~ ~ ~ ~ ~ ~
10
~ ~ ~ ~ ~ ~ ~ ~ ~ ~ ~ ~ ~ ~ ~ ~ ~1 ~ ~ 100
plot 2
i plot 1 - tot31] ~-~-n-~Hr-nFH--N~ jun 7 j21 oU9 1 016 330 s6 13 20 oct 1 07 010 01lt 017 021 025 nov 1 n8
j13 jul23 36 326 sep 3 010 017 27 0lt 08 011 015 018 022 029 n5
Figure 30
0 OJm rain (mm) C
70 25 a 65 shy
lt --120 ~
- lt5 i L 1 shy
lt0
35 F--Ut - ~~
~ i ~10 inmm - ~ 1 - ~ j ~ ~ j j j (= ~ ~ ~ ~ j r r~ t ~ ovg m~ 09- max
~ - - - 5 - - - -
jun 7 i21 3U91 316 330 06 013 020 od 1 07 010 01lt 017 021 025 nov 1 n9j13 jul23 06 326 sep 3 010 17 527 0lt 06 011 015 018 022 029 n5
Figure 31
New Sporocarp Production
Throughout the fruiting season new sporocarps are produced in flushes or peaks (Figs 32 33) Relative Humidity seems to affect the number of sporocarps produced during each peak the largest number of new sporocarps produced per flush occurwhenthe relative humidity isbetween60 and 80 Once the relative humidity rises to 90 the number of sporocarps per flush decreases and eventually the number of flushes cease when the relative humidity reaches 100
27
A distinct correlation exists between the production of new flushes and soil moisture and soil temperature New flushes seem to be initiated when the soil moisture rise to or above 30 and the soil temperature rises to near or above 12 dc Each new flush seems to terminate when the soil moisture drops below 30 and the soil temperature drops below 12 dc (Fig 33)
Flushes seen to occur in clusters and each cluster is influenced by the amount of daily rainfall (Fig 33) Rainfall on July 23 influenced the clusters produced up to September 2nd Rainfall on August 26 influenced the clusters produced during the entire month of September
_m ~
----shy
10
rJv J ~Hi~~ y~ f U
30 1 -=1 - rn
- cA - ~ ~ ~ m1 A1lJA 1 -MO
- Oct-Figure33
Life Span
Life span data has to be interpreted carefully since the entire fruiting season ended with the dramatic rise in maximum air temperature during the last week of October During this period the longest life span was 84 days produced by a sporocarp formed in early August and The shortest life span was 11 days produG~d by a sporocarp formed in mid-October the average life span was 465 days
Of the micrometeorological factors affecting length of individuallifespans it was found that as Relative Humidity decreased and Soil Moisture decreased longevity also decreased Contrary to 1992 longest life spans were produced by sporocarps formed early in the fruiting seasons and as the fruiting season progressed the average life span decreased (Fig 3435)
However each month produced long and short life spans July sporocarps lived an average of525 days August 612 days and September 41 days The data on soil pH T soil did not appear to influence longevity
pa0
onde Plot 1 pan n de 0 Plot 2
0 0
10 10
0
0
0
0
20
10
I October rNovember I lt-firstof month last of n1Ofitgt-gt
T 0
w
0
0011
oS 022 0
010015
T
Figure 34 e bo Figure35
-
28
Boletus edulis
Observations on 6 sporocarps were madeS formed in Plot 2 and 1 formed in Plot 3 The fruiting season began on September 2nd about one month earlier than in 1992 However all of the sporocarps were vandalized by commercial or private mushroom pickers Therefore data on the end of fruiting season life span of individual sporocarps and sporulation studies were not available Information on rainfall average maximum air temperature and average minimum air temperature at the time of sporocarp formation is found in Figure 36 Information on Relative Humidity Soil Temperature Soil Moisture and pH for each of the 6 sporocarps observed is found in Table 4
Table 4
date plot mushroom ill Relative Humidity Soil Temperatur Soil Moisture p sep 1 2
sep 15 2 sep 13 2 sep 25 2 oct 28 2
62 55 81 49 81
83 78 62 75 60
14 14 14 12 13
32 30 30 37 5
6 6 6 6 7
oct 29 3 55 81 14 30 6
0 C
25 -- -- ~i~(~m)
20 j ~~ (~-gt-1 ~~ ~~ ~ ~ ~ pound ~ ~) ~lt -- --~~ -- ~
YiHjH~)+PfWHHiH~- 1- -- -- -- -- ---- -- -- -- -- 16 = ------ -- ---- -- -- -- -- -- 8 - - - ~
ISJ mm 1 0 maxtemp 0 m om june 7 j21 july 5 j19 aug 1 a16 a30 6 14 oct 7 014 021 n16 n30
j14 j29 j12 j23 a7 a25 sept 2 10 17 010 017 nov 14 n23
Figure 36
SPORULATION STUDIES
During the four months when sporocarps were found in Plots 1 and 2 data was gathered once a week on the duration and quantity ofbasidiospores discharged in a 24 hour period slides were placed under sporocarps in the morning of one day and gathered at the same time the next day Sporulation data was gathered from a total of 62 sporocarps of Cantharellusdbarius Of these data was obtained for the entire life cycle of 42 sporocarps from Plot 1 and 5 from Plot 2 The remaining 20 sporocarps were consumed by mammals at some point in their development Therefore a total of nearly 700 slides were obtained during this study
Out of 42 life cycles the mean life span was 56 days with sporulation first observed on a mean day of 44 The fungi that received spore measurements started sporulating with a mean Rh of 943 T soil of 136 C and a SM of3094 All fungi had a maximum spore discharge per square centimeter ofhymenophore (gt100000000) at mean Rh of 788 T soil of 144 C and SM of 32 A higher spore load and warmer soil temperatures appear to be correlated
For all 42 sporocarps studied at least 6 different patterns existed during which spores were produced as follows
I number of sporocarps [ when majority of spores are produced during the life span 20 near the end 2 from the middle to the end r 5 at the beginning 7 in the middle 2 from the beginning to the middle 5 over entire life cycle
29
Sporulation for each mushroom will be found in the unfinished graphs located in Appendix A
Some fruiting bodies produced their spores in two to three flushes some all at once while others did not produce more than 500000 spores per square em In a mycorrhizal fungus such as C dbatius basidiospore production may be genetically controlled
Sporulation data is still being analyzed as of this date During the next few months an attempt will be made to determine if sporocarp clustering has an effect on sporulation However the maps on which all sporocarp and vegetation will be located have to be completed
Comparison between 1992 and 1993 Fruiting Seasons
Comparisons of the data collected in 1992 with that of 1993 indicate distinct differences between the two years The fruiting seasons in each year began roughly at the same time however 1992 was a bit later than 1993
Cantharellus dbarius
The fruiting season in 1992 lasted nearly two months longer than in 1993 In 1992 freezing temperature terminated the life span near January 20th whereas in 1993the season was terminated on November 12th due to the week long period ofwarrn weather The initiation of the fruiting season were similar with the season observed to begin on June 7th in 1992 and the season observed to begin near June first in 1993 (see Figure 37) In each year the fruiting season began during a period of dry weather which was preceded by wet weather In each year new sporocarps were formed as long as the cumulative rainfall was kept below 5 em and the largest number ofsporocarps were produced during a time when no to very little rain occurred The termination of the fruiting season began when the relative humidity increased and new rain occurred Therefore it appears that sporocarp formation in Cantharellusdbatius responses to very little rain The stimulus for the initiation of the fruiting season seems to be a low relative humidity near 60 average minimum air temperatures rising from 5 to 9 dc In each year sporocarp formation was more restricted to the southeastern quadrant of plot 1 which has a large amount of buried wood Therefore sporocarp formation seems to respond to moisture found in this woody debris a phenomenon which correlates with the studies of Norvell
- Length of Fruiting Season
8oIlaquou edu
F r-
Jon
Doc
- D Nov2
Cd2
- 5
1992Con_ 993 1992Bou 3 1~3
Figure 37
The highest number of sporocarps found in plot 1 in 1992 was about 105 whereas in 1993the highest number was 267 The patterns of the highest number of sporocarps present at anyone time were similar in 1992 as in 1993 however the abrupt disappearance ofsporocarps in 1993 was caused by the warm weather (see Figure 38) The temperatures in 1993 were warmer and the rainfall less than in 1992 Therefore an increase in sPorocarp numbers during drier weather seems to correlate well with information provided by Norvell (1992) (See Figure 41)
New sporocarps were produced in flushes in both 1992 and 1993 However the number of flushes were about 3
times more in 1993 than in 1992 Interesting the highest number of new sporocarps produced per flush were equal in 1992 asin 1993(see Figure 39)
The pattern oflife spans were very different in 1992than in 1993 (See Fig 40) In 1992 the longest life spans were produced towards the middle and the end of the fruiting season however all parts of the fruiting season produced sporocarps with different lengths oflife span In 1993 the longest life spans were produced in the beginning of the fruiting
30
season and the average life span length was reduced as the fruiting season progressed However the longest life span shortest life span and average life spans were nearly identical in 1992 as in 1993 (see Table 5)
lifespan of individual sporocarps total number of highestnumber of sporocarps sporocarpsat anyone
longest shortest average observedin plot 1 time in v10t1 1992 92 I 10 I 44 364 105 1993 84 I 11 I 465 454 267
Sporulation patterns for the two years did correlate with maximum spore output for Relative Humidity Soil Moisture and Soil Temperature In 1992the Relative Humidity was 90 the Soil Moisture was 316 and the Soil Temperature was 143 C In 1993 the Relative Humidity was 878 the Soil Moisture was 32 and the Soil Temperature was 144 C Sporocarps growing only in bryophytes and those growing in woody debris need to be compared for sporulation patterns
~ 20
num ps
100
20 90
80 70 so 60 50
30 20 a 10
o~812
911 1011 1111
dol
1211 111 111
--- ~-- wJ
1 0I 1 yen~ _NO
ca
--19931992
Firgure 38
numfnowpongtc35 ~ ~
30r 29 r
20 21
20
15 10
0 A2 -
28 3
1992 199J Figure 39
31
IIr benln
Ipanon 9
Plot 1
numpY100
80
90 7
80
7
50
30 -20 T
pC to3 -- - on gtOd3 _0 1
1992 1993
Figure 40
+Figure 41
~~(=I
1U c
55
OJ In em
55 25
~
20
t5 v
1
- t
1 r -
s JO
- ~
i
12 -
- - momb moxmp
---~
~ It l - (bX)
3 t5 oct 04 011 0 029 n2 n19 023 n29 6 d26 1
19 m (02) 08 (01)(25)nov1 n nt5 n22 n25 2 2 9 jan4 0
5r~T OJn
c 13 ~ocT7 i ~~ I-ro18 s s
-
1992 1993
-shyem
50 135 120 105 90 30
plOt2 1992-1993
-pIot1 1992- 993
shy ~
)un A ope oct
nov
Jen
reo m br may
-plot199
Comparison of rain fall plot 1 and plot 2
32
Literature Cited
Bengston D 1993a Letter to the California Native Plant Society expressing concerns about the Harvesting of Wild Mushrooms County of Mendocino Department of Agriculture Agricultural Commissioner
Bengston David 1993b Subject Commercial Mushroom Industry Informational Memo Memorandum dated 18 March 1993 sent the supervisors of the County of Mendocino County of Mendocino Department of Agriculture Agricultural Commissioner
Cherfas J 1991 Disappearing Mushrooms Another Mass Extinction Science 254 1458
Fischer C Molina R Amaranthus M Luoma D L and J Trappe 1993 Productivity and Ecological Habitat of Matsutake Mushroom in the Chemult Ranger District Winema National Forest and the Illinois Valley Ranger District Siskiyou National Forest Research plan circulated to the various ranger districts in northern California and the pacific Northwest
Largent David L 1991 General Research Plan for the study of Armillaria ponderosa Submitted to and accepted by The Six Rivers National Forest Orleans District
Lizon Pavel 1993 Decline of Macrofungi in Europe An Overview Contributed paper presented to the 14th Annual Mid-Atlantic States Mycology Conference Duke University Durham NC April 17 1993
Millar C Cheng S Creasy M Largent D L and R Richards 1993 Environmental and Social Impact Analysis of Mushroom Harvesting Assessing the Sustainability of the Matsutake Mushroom on the Klamath National Forest Research Proposal submitted to the Klamath National Forest
Molina R ODell T Luoma D Amaranthus M Castellano M and K Russell 1993 Biology Ecology and Social Aspects of Wild Edible Mushrooms in the ForestS of the Pacific Northwest A Preface to Managing Commercial Harvest VSDA Gen Tech Report PNW-GTR-309 ~~
Norvell Lorelei 1992 The Oregon Cantharellus Study Project Mushroom harvesting and chanterelle productivity in Oregonua preliminary report
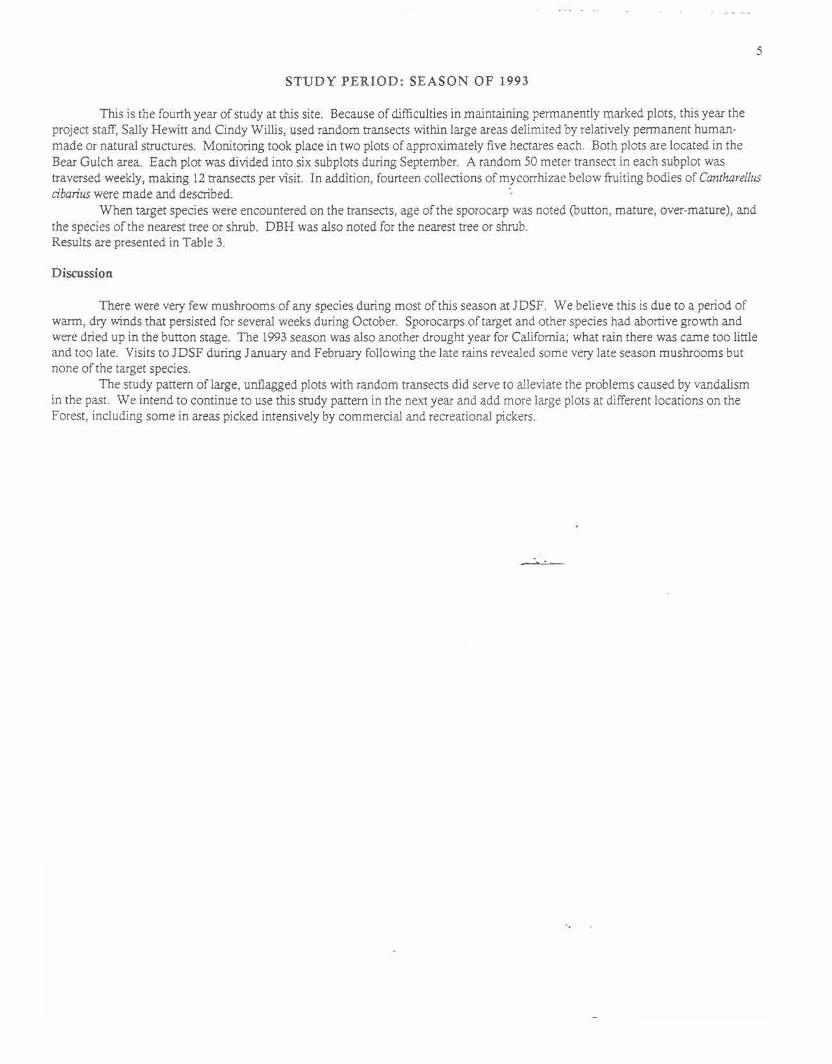
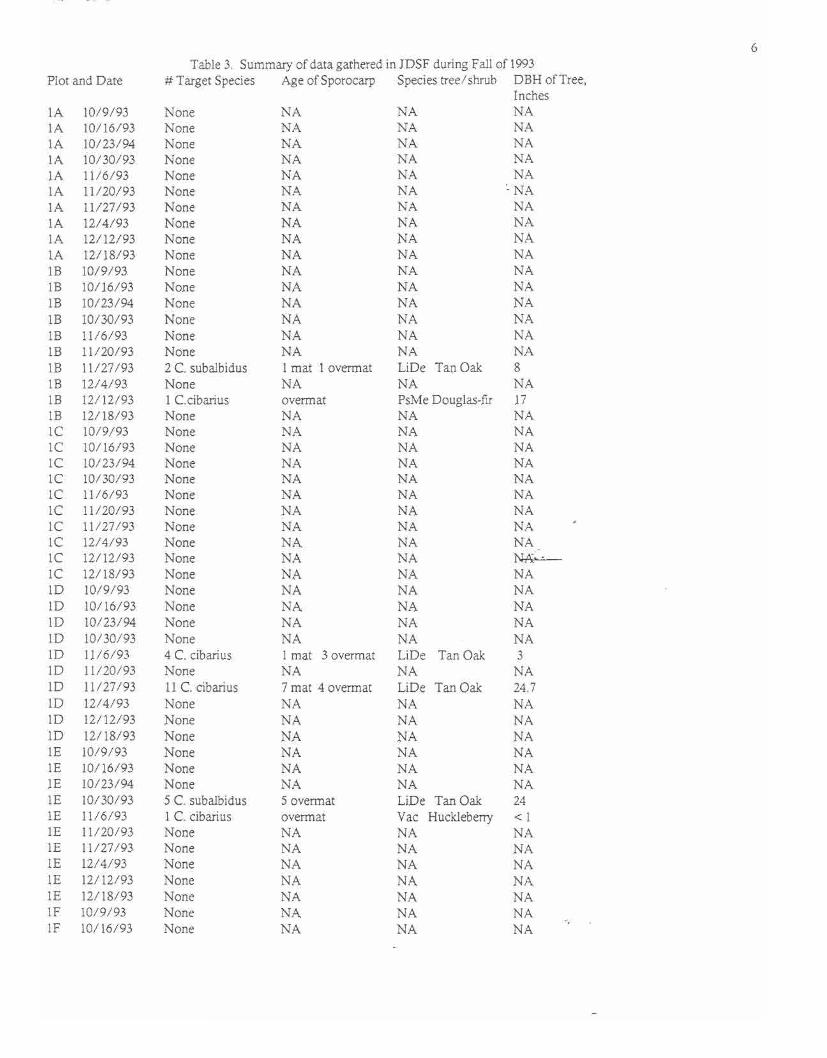
7
Plot and Date Target Species Age of Sporocarp Species treeshrub DBB of Tree Inches
IF 102394 None NA NA NA IF 103093 None NA NA NA IF 11693 5 C cibarius 5 overmat LiDe Tan Oak 24
(2) IF 112093 None NA NA NA IF 112793 None NA NA NA IF 12493 None NA NA NA IF 121293 None NA NA NA IF 121893 None NA NA NA 2A 10993 None NA NA NA 2A 101693 None NA NA NA 2A 102394 None NA NA NA 2A 103093 None NA NA NA 2A 111693 None NA NA NA 2A 112093 None NA NA NA 2A 112793 None NA NA NA 2A 12493 None NA NA NA 2A 121293 None NA NA NA 2A 121893 None NA NA NA 2B 10993 None NA NA NA 2B 101693 None NA NA NA 2B 102394 None NA NA NA 2B 103093 None NA NA NA 2B 111693 1 C cibarius overmat PsMe Douglas-fir 14 2B 1112093 None NA NA NA 2B 1112793 None NA NA NA 2B 12493 None NA NA NA 2B 121293 None NA NA NA 2B 121893 None NA NA 2C 10993 None NA NA NA 2C 101693 None NA NA NA 2C 102394 None NA NA NA 2C 103093 None NA NA NA 2C 11693 None NA NA NA 2C 112093 None NA NA NA 2C 1112793 None NA NA NA 2C 12493 None NA NA NA 2C 121293 None NA NA NA 2C 121893 None NA NA NA 2D 10993 None NA NA NA 2D 101693 None NA NA NA 2D 102394 None NA NA NA 2D 103093 None NA NA NA 2D 111693 None NA NA NA 2D 1112093 None NA NA NA 2D 112793 None NA NA NA 2D 12493 None NA NA NA 2D 121293 None NA NA NA 2D 121893 None NA NA NA 2E 10993 None NA NA NA 2E 101693 None NA NA NA
- 2E 102394 None NA NA NA 2E 103093 None NA -NA NA
8
Plot and Date Target Species Age of Sporocarp Species treeshrub DBH of Tree Inches
2E 11693 None NA NA NA 2E 112093 None NA NA NA 2E 1112793 None NA NA NA 2E 121493 None NA NA NA 2E 12112193 None NA NA NA 2E 1211893 None NA NA NA 2F 10993 None NA NA NA 2F 101693 None NA NA NA 2F 102394 None NA NA NA 2F 103093 None NA NA NA 2F 11693 None NA NA NA 2F 1112093 None NA NA NA 2F 1112793 None NA NA NA 2F 121493 None NA NA NA 2F 1212193 None NA NA NA 2F 1211893 None NA NA NA
--
-
9
Location Lanphere Dunes located 5 miles west of Humboldt State University Arcata California
BACKGROUND
The Lanphere-Christensen Dunes Preserve is a fenced and protected preserve located on the Pacific coast near the northern reaches of Humboldt Bay Because of location Lanphere recei ves moisture from rain and heavy coastal fog and has moderate temperatures maximum temperatures average 13 degrees with occasional rises to 20 degrees in the Fall months relative humidity averages 70 does not fall below 60 and has periods of several days above 80 (from data collected during 1991 season) Soil temperatures remain above freezing year round air temperatures may fall below freezing during winter months particularly during late December and early January (from data collected during 1990 and 1991 seasons) Coastal Lodgepole pines (Pinus contorta var contorta) predominate at this site
Because the Preserve is a protected area that has been set aside for preservation of several endangered plant species any research has to exist within certain restrictions setting up and surveying of plots must use existing trails the visual impact of plots to other visitors to the Preserve must be minimized and no trampling of existing vegetation is permitted Since the Preserve is located close to the HSU campus frequent monitoring visits to the site are possible making this a valuable location for biological studies of the target species
Investigation of the Lanphere-Christensen Dunes mycoflora essentially began in 1979 and 1980 with research conducted by Sue Van Hook for her Masters degree Van Hook used scattered circular plots of two meter diameter located at trail edge throughout the Preserve She focused on the concept of indicator species and tried to determine if any particular species reliably heralded or accompanied fruiting of any other species
Current research at the Lanphere-Christensen Dunes Preserve emphasizes an understanding of the reproductive biology of four local edible mushrooms indicated in the introduction In 1990 this project using plot protocols developed by van Hook set up fifty semi-permanent plots and four weather stations in the Preserve Each weather station has four rain cans and a maximum-minimum thermometer two stations are under forest canopy and two are in the open These stations are visited every time sampling occurs or when rainfall accumulates Relative humidity is measured with a portable hygrometer soil temperature with a standard soil thermometer placed at a depth of 7-9 cm Plots are marked with a wooden stake at the center and are circular with a diameter of two meters Each plot is numbered and a map of the preserve with plot locations indicated has been generated Additional plots have been added in each project year
In order to accurately evaluate the life strategies of these fungi thefollowing studies have been accomplished recording the individual life span of each mushroom the duration and pattern of spore release the period of time during the season that each type of mushroom fruits the pertinent environmental data throughout the season and the identification of other macromycete species that indicate the onset of fruiting of the edible mushrooms
The concept of indicator species was considered by Sue van Hook in 1980 and in 1992-1993 attempts were made to continue to establish which mushrooms if any fruited approximately two weeks prior to the study fungi A catalog of mushroom species and their respective times of fruiting was kept Information of this sort is particularly valuable to the forest land managers as indicator mushrooms will enable them to patrol more efficiently
A more exact method of locating sporocarps within a plot was developed in 1992 and was continued in 1993 The process is a simple one with a meter stick or a tape originating at the plot center orient it toward the mushroom and measure the distance to the center of the mushroom With a compass attached to the stick and oriented in the same direction take the compass reading In this fashion the field worker generates a numeric name for each mushroom The orientation is listed first followed by the distance in centimeters An example name might be 145-51
Sporulation studies are done by placing microscope slides in metal holders (spore traps) below the fruiting bodies These slides are collected and replaced with fresh slides every 24 hours Soil temperature and relative humidity are recorded for each plot during a sampling visit
STUDY PERIOD SEASON OF 1992
Thirty-two monitoring visits were made to 74 2-meter diameter plots between August 29 and January 4 Twelve visits consisted of obtaining data on rainfall from the four weather stations Twenty monitoring sessions consisted of life-span data observations on three of the four target fungi Armillaria ponderosa Leccinum manzanitae and Boetus eduis Locations of target fungi within plot relative humidity pH soil temperature and moisture were recorded for these life-span studies
Among the four target species studied there was a distinct pattern of fruiting only among two of the target fungi Boletus eduis and Leccinum manzanitae retained similar fructification patterns as in previous years while the patterns for Armillaria ponderosa and Canthareus cibarius were quite different from previous years (See Fig 1 and discussion below)
10
I
SPOROCARP STUDIES LIFE SPAN AND FRUITING SEASON
Fruiting seasonEdible Macromycetes II av(oseason Lanphere Dunes 1990-1993
A vanderosaArmillaria der 1990 dec 17 dec 28 11 4
Feb 9 1991 jan 1 jan 11 10 5 1992 nov 12 dec 11 29 14 1993 nov 25 dec 8 13
1 Jan 8I 1990 nov 19
Boletus edulis
dec 12 15 8 Dee7 1991 nov 20 dec 14 22 17
1r-
Tr
1 1
I I r
Nov5
1992 1992 1993
oct 22
nov 22 oct 29
nov 1
dec 8 nov 18
10 26
20
5 123
Leccinum manzanita Oct4 1990 nov9 dec 14 35 22
1991 nov 30 dec 31 31 15
1992 oct 22 nov 1 10 5 Sep2 1993 nov5 nov 29 24 138
Cantharellus dbarius
90 91 92 93 90 91 92 92 93 90 91 92 93 90 91 92 93 Aug 1 1990
1991
dec31
oct 30
154 92
Armillaria Boletus leccinum Cantharellus 1992 sep 29 61 1993 nov2 63
Figure 1
Cantharellus cibarius
Life span of Individual Sporocarps (numbers in boxes= number of days) 1992 As of 6 June 1992 several sporocarps
were detected in plots however all were too old for life span qr sporulation data A similar phenomenon was noted on 14 August
and 21 September as the few sporocarps bJn ~n-D 8 encountcrc-d-had no estimable initiation date
0 D U U G 0 I 6 IDec3 as they were too old and dry From the 21 September until early January the rest of sampling season no other sporocarp of was
B 1 S Ef b B Nov5 sighted in the study area thus the fruiting season for this fungus ended nearly 30 days earlier than in 1991 and over 3 months
234 5 6 1 2 2 3 Oct 2 earlier than in 1990 (see Fig 1 and Table 1)
Arminariapo1Iderosa BolausaMis Lemum mananitlaquo This kind of phenological behavior seems to Figure2
correlate well with the data from Oregon obtained by Norvell (1992)
Armillaria ponderosa
In 1992 the fruiting season for Armillaria ponderosa was nearly 4 weeks earlier than in 1990 and five weeks earlier than in 1991 (see Fig 1) A review of the rainfall data indicates that at least 8 cm of rain is required for initiation of fruiting in this species (see Fig 3) In 1992 the fruiting season lasted 29 days much longer than either in 1990 and 1991 and terminated as in the previous years with the onset of freezing temperatures (Table 1)
Complete life span data was obtained for 6 sporocarps of Armillaria ponderosa with the shortest being 18 days and the longest being 28 days (see Fig 2) All sporocarps were frozen solid in mid-December and thus these life span periods are not as long as is typical for the species
Boletus edulis
Sporocarps of Boletus edulis were first observed in mid-October of the 19~)2season whereas in 1990 and in 1991 sporocarp initiation was observed in late November (see Fig 1) The accumulated rainfall in mid-October 1992was about 5 cm that corresponds nicely with the data obtained in 1991but is about 15 cm more than was observed in 1990 Sporocarp initiation in this species is dictated by a minimum amount of moisture about 35-43 cm when the average maximum temperature is below 18 degrees and the average minimum temperature is just above freezing (see Fig 5) However with warmer t~mperatures more
11
moisture is required for sporocarps to begin to form An interesting anomaly previously not observed occurred this season in that this species had two fruiting periods one in mid-October and a second in mid-November the latter period corresponds exactly with onset of fruiting in 1990 and 1991
Complete life span data was obtained for only two sporocarps of Boletus edulis (See Fig 2)
Leccinum manzanitae
In 1992 initiation of fruiting in mid-October by Leccinum manzanitae occurred about 1 month earlier than in 1990 and nearly a month and half earlier than in 1991 (see Fig 1) In each of these seasons sporocarp initiation began when cumulative rainfall was over 5 em and just before a very heavy rainfall thus temperature did not seem to have an effect on sporocarp initiation in this species
Complete life span data was obtained for 3 sporocarps The life span varied between 10 and 16 days that corresponds well with data obtained in 1990 and 1991 (see Fig 2)
INDICATOR SPECIES
The use of Chroogomphus vinicolor as the indicator for Boletus and Leccinum as suggested following the 1990 and 1991 seasons will have to be re-evaluated as this species did not fruit this season until several weeks after the boletes started to fruit however C vinicolor was the indicator species for the second flush of Boletus edulis sporocarps Another candidate for an indicator species is Hygrophoropsis aurantiacus which fruited about one week prior to sporocarp production by the boletes
SOIL MOISTURE pH SOIL TEMPERATURE AND RELATIVE HUMIDITY STUDIES
Soil moisture pH soil temperature and relative humidity were recorded for each plot that had sporocarps of the target species No trend could be determined for the sporulation studies However sporocarp formation in Boletus and Leccinum favored areas with a pH of between 63 and 66 as well as a soil moisture level of between 20 and 25 In Armillaria ponderosa sporocarps favored sites with a pH near or more typically above 66 and with soil moisture content that begins at 28 and quickly drops to between 10 and 20
SPOROCARP NUMBERS
Because of poor data collection valid sporocarp numbers for LanRhere Dunes were not obtained for the 1992 mushroom season -
r
Annillaria ponderosa (Figure 3)
1991
1990 0 C em
0 35 35 C em
35 3035
30
30 30 25 25
25 25 20
begin end 20
20 - pegin end 20 shy
15 15 1515
10 10 10 10
5 -5 -5 -5
-10 -10 0 -10 ~ ~ ~ m ~ ~ m m ~ ~ ~ m 00 ~ ~ J2 J3 J 51 ~ 01 02 03 ~ N1 N2 N3 ~ 01 02 00 ~ JI J2 J3 J
1992 1993
0 0
C em C em
35 35 35 35
-rain 30 30 30 30
min temp 25 25 25 25
Pegin 20 20
- max temp 2020 end begin
15 d
15 15 ---~ - - -15
10 10 10 10
-5 -5 5 -5
-10 ~-10 10 -10 ~ ~ ~ m ~ ~ m m ~ ~ ~ 00~JIJ2J3J4 51 ~ 01 02 03 ~ NI N2
Cantharellus dbarius (Figure 4) ~
1991
1990 0 C em
0 35 35 C em
35 35 30 30
30 30 25 25
25 25
20 20 20 20
15 15 15 15
10 10 10 10
-5 -5 5 -5
10 -10 -10 -10 ~ ~ ~ m ~ ~ m m ~ ~ ~ m 00 ~ ~ J2 J3 J4 51 ~ 01 02 03 ~ NI N2 N3 ~ 01 02 00 ~ JI J2 J3 J
1992 1993
0 0 C em C em
35 35 35 35
-rain
30 30 30 30
min temp 25 25 25 25
end end - - maL temp 20 20 20 20
15 15 15 IS - T-~ 10 10 10 10
5 I
5 5 5 -5
10 ~
~ ~ m ~
~ m m ~ ~ ~ m 00 ~ ~ n n
10 J4
-10 51 54
01 02 03 ~
NI
N2
T N3
~ ~ 01
~ 02
~ 00 ~ JI J2 J3 J4
- 10
- --
1991
1990 C em
35 35 C em
35 35 30 30
30 30 25 25
25 25 20
beg end 20
~ 20 --- beg81 end 20 - 15 15
15 ---- --15 - - - - - - -
10 - - 10 10 10
- shy
5 -5 5 -5
-10 -10 0 10 $1 54 0 02 03 04 NI N2 N3 N4 D1 D2 D3 D4 J1 J2 J3 J4 ~ 54 ~ ~ 00 04 ~ N2 m N4 ~ 00 D3 D4 n n n J4
1992 1993 C em C em
35 35 35 35 -ran
30 30 30 30
ninotemp 25 25 25 25
beg811 end 1 begin 2 - - -maxtemp 20 --
20 20 begn
20
15 5 15 15--~_ -
0 -l j 10 10 10
I
5 5 5 -5
10 -- -10 -10 10 ~ 54 ~ ~ 00 04 ~ N2 m N4 D2 D3 D4 JI J2 J3 J4 $1 54 01 02 03 04 N1 N2 N3 N4 DI D2 D3 D4 JI J2 J3 J4
Leccinum mpoundlnzanitae (Figure 6) -
1991
1990
C em 35 35
C em 35 35
30 30
30 30 25 25
25 25beg81 end
20 20
- - begn end20 20
5 1515 15
10 010 10
- -shyshy
5 5 5 5
-to ~ -to 10 to $1 54 01 02 03 04 NI N2 N3 N4 D1 D2 D3 D4 JI J2 J3 J4 51 54 01 02 03 04 NI N2 N3 N4 DI D2 D3 D4 JI J2 J3 J4
1992 1993 C em C em
35 35 35 35 -ran
30 30 30 30
nin temp25 25 25 25
beg81 end begn end - - maxtemp 20 20 20 20- - 15 15 15 15
------r---lt~ -10 10 10 10
5 -5 5 5
10 -10 - 10 ~ 54 ~ ~ 00 04 ~ N2 m N4 ~ 00 D3 D4 n n n J4 -1degS - 54 01 02 03 04 N2 N3 N4 DI D2 00 0 JI n J3 J4
14
SPORULA nON STUDIES
Complete sporulation data for the entire life span was obtained for six Armillaria ponderosa sporocarps and one Boletus edulis sporocarp No studies were conducted on Cantharelus cibarius nor was complete life span sporulation data obtained for Leccinum manzanitae
Spores were gathered by placing a spore trap under the hymenium of a viable sporocarp and leaving it in place for a 24 hour period Once a sporocarp collapsed it was considered dead and spore collection ceased The sporulation pattern (Figs 78) for Armillaria was different when compared to past studies Four of six sporocarps studied produced most of their spores~during a single period during their life span 1 (B) of these produced spores at the beginning of the life span as was previous observed in 1990 and 1991 and the remaining 3 (A D E) produced spores near the end Each of the remaining sporocarps
produced spores during two periods during their life span C at the beginning as well as the end and F at the beginning and the middle No correlation with any
spores Armillaria ponderosa environmental factor could be 18E7 determined
80ES In every instance observed 116E7 during this season as well as in the
- 14E7 - - last two seasons sporocarps of 60ESI Armillaria ponderosa did not 112E7
produce spores over their entire 110E7 life span Moreover a majority of - -
40ESI
180E6 the sporocarps produces an abundance of their spores
160E6 immediately after expanding from
20ESIshy 140E6
a button Thus the spore load of this species could be dramatically
120E6 affected by harvesting sporocarps in the button stage
0 dec13 dec1S dec18 dec20 dec2S dec28 jan2 jan6 jan9 jan12
990-6 days 99-10 days ~
Figure 7
number of spores
1SE8
1IIIIIIII ~days
v-gtl ~8 days 10E8
f~j ~8days
SOE7 l~ ~Sdays - ~8 days
k1 ~9 days nav 12 nav 19 nov30 dec 1 dec 2 dec 3 dec6 dec11 dec16
1992
Figure8 -
0
15
Boipoundtus edulisso
f8 In Boletus eduis sporulation occurred steadily as ea the fungus developed (see Figs 9 10) Eventually 8 sporulation decreased and even ceased as the sporocarp 1E8 aged As in previous seasons sporocarps of this species ~os produced large numbers of spores over their entire life
span with the majority of spore being produced in the f8
middle of the life span Although no sporulation 8 lIE
studies were completed for Leccinum manzanitae 4 lIE previous studies indicate the pattern is similar to that of
0023oa2S4 010 oa23 p8 M 0 oa23 0028 4 oa23 0028
Boletus eduis (see Fig 11) oa25 oa25 13 125 010 0
18 21 18Fig 9
Boletus edulis
1m po Leccinum manzanirae po
---Be8 81E8lIE
2E8
63E8
50e8 4 lIE4E8
4SE8
SEa
1E8 25e8
~ noy 22 noy 27 nov30 doc 13 28 - laquo4 do d _n - _8 0laquo1 0lt13 21 900- 16
Fg0 -1--
STUDY PERIOD SEASON OF 1993
The mushroom research at Lanphere Dunes Preserve was performed on a semiweekly basis from September 10 1993to January 9 1994 Seventy-nine 2-meter diameter plots were monitored on Tuesday and Friday of each week for appearance of any of the four target species Leccinum manzanitae Cantharellus cibarius Armillaria ponderosa (Tricholoma magnivelare) and Boletus eduis
When a sporocarp was detected in a plot it was monitored twice weeklythroughout its entire lifespan Monitoring consisted of measuring and recording soil pH and moisture content using a Kelway soil tester soil
temperature at a depth of7 to 9 cm using an Ertco soil thermometer and relative humidity and air temperature using a VWR digital humidity and temperature meter Each semiweekly visit induded monitoring four weather stations in different locations in the Preserve Each station was equipped with a rain gauge and a Taylor maximumminimum thermometer
WEATHER (see Figures 12-17)
In 1993rainfall during the monitoring period totaled 1273cm which makes it the second driest season since this studybegan in 1990 The 1993season was dry and warm with the total accumulated rainfall pattern and the maximum temperaturepattern being similar to those of the 1991season The average minimum temperature pattern on the other hand was unique
The 1990season was cold and wet the 1992season was wet and warm and the 1991and 1993seasons were dry and warm
-
16
Cumulative Rainfall (Figure 12) ~ Trend (Figure 13)
em 35
iz 30 I
28 I I 23j34
25
2~J 20 I
I 15 1P21421
1U I 1231~3 - 105w1I2
10 W~
51 54 01 02 03 04 N1 N2 N3 N4 01 02 03 D4 J1 J2 J3 J4
Minimum Air Temperature (Figure 14)0C
25
20
15
10
~lt-- ~-~- - --~v--- ~- gt
-- -5
0 51 54 01 02 03 N1 N2 N3 N4 01 02 03 D4 J1 J2 J3 J4
Maximum Air Temperature (Figure 16)
0 C
25
20
15
10
I
51 54 01 02 03 N1 N2 N3 N4 Of 02 00 D4 J1 J2 J3 J4
om 35
30
shy25 -
- 20
f5
1993 10 shy
- 1992
1991
1990 ~ 54 ~ ~ ~ ~ ~ ~ ~ ~ ~ ~ 00 D4 n J2 J3 J4
~ Trend (Figure 15)
c
25
20 --- -- shy
- - - - - -
--
- -- -
10 shy
1993[ 1 L --- lt
-s -1
-10 0 51 S4 01 02 03 N1 N N3 N4 01 02 03 04 JI J2 J3 J4
~ Trend (Figure 17)
0 C
25
- - --20 - 15
10
~ ~~~L~t~-~--~ c ~~ -~- -~-~~
051 54 01 02 03 N1 N2 N3 N4 01 D2 D3 D4 J1 J2 J3 J4
17
LIFE SPAN AND FRUITING SEASON
Among the four target species studied there was a distinct pattern of fruiting among all four of the target species
Cantharellusdbarius (Figures 14 Table 1)
Cantharellus dbarius began fruiting before our study started and continued fruiting until day 63 of the study Fifteensporocarps from seven different plots were recorded The average lifespan for a Cantharellusdbarius fruiting body was 1425 days
The fruiting season of sporocarps was 63 days the longest of all the target species and began during the summer when the rainfall was below a centimeter similar to the season found in Patricks Point State Pink The season ended when rainfall began to increase a pattern similar to that in Patricks Point State Park The 1993 season was similar in length and in pattern to that of 1991
The four environmental factors recorded at initial sporocarp observation averaged as follows
Average soil temperature 149degCAverage soil pH 698Average soil moisture 946Average relative humidity 728
At Cantharellus dbarius fruiting body death the averages of the environmental factors recorded were
Average soil temperature 124degCAverage soil pH 697Average soil moisture 51Average relative humidity 672
Armillariaponderosa (Figures 1 3 Table 1)
Armillariaponderosa(=Tricholomamagnivelare)was observed in two plots with a total of two sporocarps recorded Fruiting season for this species was the shortest of those studied beginning on November 25th and ending on December 8th
The life span was 13days and as in previous years the fruiting season was abruptly terminated by freezing temperatures Fruiting was initiated when the average maximum temperature dropped below 15degC and the average minimum temperature was near freezing A distinct correlation existsbetween the beginning of the fruiting season and the differencebetween average maximum temperature and average minimum temperature fruiting seems to begin when the temperature difference is at least 15 degC a pattern which appears each season over the last 4 years -
At the beginning of button stage for this species the environmental factors aver~
Average soil temperature 94 degCAverage soil pH 615Average soil moisture 1000Average relative humidity 8145
At fruiting body death the observed averages for environmental factors were
Average soil temperature 108degCAverage soil pH 61Average soil moisture 425Average relative humidity 8955
Boletus edulis (Figures 15 Table 1)
Boletuseduliswas not observed in any of the designated plots but was found at different locations in the Preserve Sporocarp-related data was not recorded for Boletusedulissince it did not appear in marked plots however beginning and end of fruiting season was noted The fruiting season for this species went from October 29 to November 18
Sporocarps of Boletusedulishad a fruitingseason of 20 days similar to in length to that found during the 1991and 1992 seasons and similar in length to that of Leccinwnmanzanitae
A pattern has developed over the past 4 years with the fruiting season beginning when the rainfall reaches at least 275 em in dry years 1991and 1993and when the rainfall reaches 5 em in wet years 1990and 1992
Fruiting ended when rainfall abruptly increased and the average minimum temperature dropped This pattern was similar to that found in previous years and suggests that the combination of increased soil moisture and spil temperature cause the termination of fruiting and the minimum temperature dropped near or below freezing
lecctnwn manzanltae (Figures 16 Table 1)
Lecdnum manzanitae was observed in four plots and seven sporocarps were recorded Fruiting season began on November 5th and continued until November 29th The average lifespan of a Lecdnum sporocarp was 138 daysshy
18
------
The fruiting season lasted 24 days similar to that of Boletusedulis Fruiting is initiated in dry years when the rainfall nears 3-5cm and in wet years when the rainfall nears 5 cm As in Boletus
edulisfruiting is terminated when the rainfall increases and the average minimum temperature drops to near 0 degc
The average environmental factors calculated for when fruiting began for Lecdnum manzanitae were
Average soil temperature 64 degC Average soil pH 643 Average soil moisture 15 Average relative humidity 825
When Lecdnum manzanitae fruiting body death occurred the observed averages were
Average soil temperature 90 degCAverage soil pH 646Average soil moisture 252Average relative humidity 761
-
- --- -
19 Location Patricks Point State Park near Trinidad California
BACKGROUND
Patricks Point State Park is located about 20 miles north of Humboldt State University on the Pacific coast near Trinidad California The study area is dominated by Pacific Hemlock (Tsuga heteropylla) and Sitka Spruce (Picea sitchensis) This site was added to the project in the 1992 season through the cooperation of the North Coast Red woods District of the California Parks and Recreation Department This is a popular and easily accessible park and a favorite site for mushroom pickers Picking mushrooms is prohibited in the park but proximity to good roads and uncontrolled accesses through unfenced boundaries make it easy for pickers to get in and out quickly
STUDY PERIOD SEASON OF 1992
During the summer of 1992 a permanent plot of 1024 square meters was established in Patricks Point State Park This plot was divided into 256 subplots of four square meters each The location of all trees and vegetation within each subplot was surveyed and noted accurately on individual maps (See Figure 7 for a sketch map of the entire plot) Monitoring of the subplots began on August 24 1992 however sporocarps of Cantharellus cibarius were observed in mid-June before the permanent plot was established Each monitoring visit involved the following once it was established a target species was fruiting in a subplot the sporocarp was assigned an identification number the date and developmental stage were noted (ie button or mature) and the subplot number recorded In addition relative humidity soil temperature soil pH and soil moisture content were recorded for each subplot in which sporocarps were observed Furthermore sporocarps of other epigeous fungi were noted which will provide information on indicator species
Sampling occurred from late August 1992 through March 1993 Ten individuals from the Humboldt Bay Mycological Society (HBMS) volunteered their time for the entire sampling period with their supervision conducted by David Sime from the Humboldt State University mycology laboratory Two individuals were used during each of the twice weekly sampling periods that lasted from 4-6 hours therefore this project involved approximately 450 volunteer hours of assistance
In addition life span and sporulation data were obtained twice weekly for Cantharellus cibarius by placing microscope slides under the hymenium of the sporocarps in the morninglt and leaving in place for 24 hours Volunteers were not used for this aspect of the study
Sampling methods for Boletus edulis were different from methods for Cantharellus cibarius Thirty 2x2 meter plots were established in Abalone campground during nine samplIng -dates during November and December Each plot was located around a group of sporocarps deemed fruiting from the same mycelium Relative humidity soil temperature soil pH and soil moisture content were recorded for each of the plots Life span and sporulation data were also obtained Volunteers were not used for the studies on Boletus edulis
Vandalism by recreational and commercial mushroom pickers was reduced in the permanent plot by posting easily visible iridescent signs and painting the sporocarps to indicate their potential uselessness for harvesting purposes However all of the sporocarps located outside the permanent plot were either harvested by recreational or commercial mushroom pickers or were eaten by various mammals
Overall observations for 364 sporocarps of Cantharellus cibarius were recorded with a majority of the sporocarps located in the southeastern quarter of the permanent plot (see Fig 18) Because of mammal predation and commercial or recreational mushroom harvesting 232 sporocarps were lost thus complete life span and environmental data were obtained for 132 sporocarps Furthermore 163 microscope slides for spore collections were placed and collected from 12 different sporocarps of Cantharellus cibarius over their complete life span
Observations on 30 different Boletus edulis sporocarps yielded only two complete life cycles however all Boletus edulis sporocarps were lost from intense commercial or recreational mushroom harvesting
Weather data from May until the projects inception on 24 August was provided by Virginia Waters (HBMS) after August 24 weather data was recorded in the permanent plot on a continuing basis
SPOROCARP STUDIES LIFE SPANS SEASON AND SPOROCARP LONGEVITY
Cantharellus cibarius
As early as June 7 a few scattered sporocarps were observed in Patrick5 Point State Park however all of these were outside the permanent plot Initiation of a large number of new sporocarps began in the plot on August 24 most probably the result of accumulation of moisture from fog drip that was retained in the woody debris and correlated with gentle drop in the air temperature From the August 24 until October 21 new sporocarps were produced in a series of flushes a phenomenon similar to that found in the Oregon studies (Norvell 1992) The stimulus for each flush seems to be a rise in both the average maximum and
average minimum air temperatures The largest numbers of new sporocarps were produced during the month of September when only 025 cm of rain occurred and the average maximum temperature was above 15 degrees and the average minimum temperature did not drop below 10 degrees (Fig 1921) As the minimum temperature dropped below 15 degrees there was an abrupt reduction of sporocarp initiation particularly in the months of November and December (Fig 20 21)
As a general trend the number of new sporocarps produced as well as the total number of sporocarps decreased steadily as the accumulated rainfall rose and both the maximum and minimum temperatures dropped (see Fig 192021)
numblaquo fnow -
35 35
30 29 30t I 11
2S 25 yen
2020
I15 15 i
10shyr ~
11 ~ ~ ~ 0 0
Au24SltoltI 457911 19 24 0lt12 911 19 30 11 Doc2 Au24 $opt 1 4 5 7 9 11 19 24 0lt12 9 11 19 30 11 Doc2 29 3 14 20 29 4 14 21 Nov10 1929 3 14 20 29 4 14 21 Nov10 19
TrendNumber of New Sporocarps
Figure 19 (Canthpoundzrellusdbarius)
numbolt d 0C8Ip$
100 100 =~ 90 90 90 -so70 -70 so ~
6O~ so soF 40 40 30 3020 20 10
tor -~ 0
9124 11i 211 0
91 ICY1 11 t19 9124 91 101
111 121 11 119
do
Total Number of New Sporocarps Trend
Figure 20 (Canthpoundzrellusdbaius)
nlnn m C
15 40 15
r 36 i 10 - 31 - - 28 I ( ---_ t51 - _J 1 --
I 10
- -~-~-- ~10 to to - ~
t1 mootomp
- - mtom
~ j f - ~~~~ 0 (t)C5) no 11 01 oS n12 ntO0130 dt to J~ ~ ~ ~ ~ ~ ~ ~ ~ ~ r~l~ to If15Jnot o n15 n11n15 dtl dt () c 01 0 11 01 19 n5 oil 0 013 0 05
II=mOltII 3 9 nl n15 n22 n25 12 112 119 0 21 102101 1014)10251 nl 14
Trend Rainfall Maximum and Minimum Temperatures
Figure 21 (Canthpoundzrellusdbarius)
21
The mid-point for the fruiting season was around October 1 with the maximum number of sporocarps being found from the first week of September through the second week of October (see Fig 20) The total number of sporocarps reached zero in January when minimum temperatures dropped below 33 degrees Thus the fruiting season for Cantharellus dominated stands in Patricks Point State Park lasted 152 days within the permanent plot (see Fig 24) and approximately 227 days within the entire park When rainfall reached nearly 20 cm in December new sporocarp production ceased (Fig 1921)
Complete life span data was obtained for 132 sporocarps of Ca1Jtharellus cibarius with the shortest being 10 days the longest 92 days the average life span was 44 days The largest number of sporocarps had a life span of 58 or 40 or 21 days (see Fig 22)
On the average sporocarp longevity per number of sporocarps produced for Cantharellus cibarius increased each month beginning in September and ending in December (Fig 23) However September had the longest lived sporocarps with seven sporocarps living up to or past 80 days Analysis of the data on rainfall and air temperature did not readily provide an explanation and thus this characteristic could possibly be genetically controlled or related to host intervention
nu- _0000 HI_n in 11 numbo 1 doyo
100
10 90 - -- - -- - - -- - -- - - - -
1[tJ 90 -- -
1111 so 5 - -4-
1IiI 10
92 90 84 78 74 68 84 62 eo sa sa 54 52 SO48 46 44 42 40 38 35 31 29 26 24 21 16 10 1 Sopt 30 gtOc13 N 1 91 95 80 77 72 66 63 61 58 57 55 53 51 49 47 45 43 41 39 38 33 30 28 25 23 18 5 00lt1
to n in dyo
Number of Sporocarps and their life span Life Span of Individual Sporocarps related to the beginning of furiting
Figure 22 Figure 23
PH SOIL MOISTURE SOIL TEMPERATURE RELATIVE HUMIDITY
Cantharellus cibarius
In Cantharellus cibarius sporocarp initiation within most of the subplots is related to a decided rise in soil moisture after a period of relative dryness and in most instances with an accompanying rise in soil temperature in almost all instances the relative humidity is less than 100 The death of the sporocarp seems to be correlated with a distinct drop in soil moisture after a prolonged period of rather wet soil The pH of the soil seems to have no bearing on sporocarp initiation or cessation Generally sporocarps of Cantharellus seem to be found in econiches that have pH above 65
-
22
J20
Boletus eduis
Initiation of Boletus eduis sporocarps began the third week in November and lasted about three weeks (Fig 24) Apparently an accumulation of at least 10 cm of rain was necessary for sporocarps to begin to form Sporocarps of Boletus also seem to prefer sites with a pH of between 60 and 65 (Fig 25)
-
Ian ~ ~JJ1J ~ ~
7 I
I I r--- III I
II ~
D I I ~ t I I r_14
II i ~~~ I~gt (~ o~ 0-2 50 I I
~ - ~J J 0
-Cd2 ~
--shyrP63 Sop
Aug25 50 ~m
cn1lM 80
pH Relative Humbidity Soil Temperature Soil Moisture
Fruiting Season 1992 4 plots partical life span for Boletus eduis
Figure 24 Figure 25
SPORULATION STUDIES
During the four months when sporocarps were observed data was gathered on the duration and time of sporulation for each of the two target species Spores were obtained by placing microscope slides in metal holders (spore traps) under the hymenium of a viable fruiting body Once Deuteromycetes overtook the sporocarp or the hymenophore collapsed the fruiting body was considered dead Spore traps were left out for a period of 24 hours and were collected twice a week Spores were counted on thirty 1 micron grids for 163 micro slides for a total of 4890 spore measurements
Micro slides were collected twice weekly over the entire life spari~of 12 different sporocarps of Cantharelus cibarius Distinctly different patterns of sporulation were observed (see Fig 26) In general sporocarps of Cantharelus cibarius produce far less spores per day than any other of the edible mushrooms studied with 10 of 12 sporocarps having less than 1000000 spores per square centimeter of hymenophore produced per 24-hour period Maximum spore production during the life span of a sporocarp of Cantharelus is dependent on a rise in soil moisture accompanied by a distinct rise to near or at 100 relative humidity and these conditions must be preceded by a period in which the soil moisture and the relative humidity had dropped
4E6
4E64E6
3E6
2E6
2E6
2E6
1E6
5E5 r
14 days 50 days 50 days 66 days 58 days 48 days30 days 14 days 50 days 28 days 40 days 38 days
Spore production for 12 different sporocarps of Cantharellus cibarius
Figure 26
0
23
BIOMASS STUDIES OF CANTHARELLUS CIBARIUS
Pileus diameters and diameters of the stipe apex were recorded for 81 sporocarps of Cantharellus cibarius over a ten-week period Thirty-one of the sporocarps were located within the permanent plots and 50 were located outside the plot All of the sporocarps outside the plot were harvested in the same manner and fresh and dry weight recorded for each Age classifications were established for all 81 sporocarps
Preliminary Results
Of the 31 sporocarps studied within the plots 20 were lost due to some type of vandalism Complete data was recorded for the remaining 11 sporocarps over their entire life span Thus correlation of biomass with life span and with environmental data should be possible
Results indicate that biomass increases in direct proportion to the pileus diameter as well as to the stipe diameter It would appear that it may be possible to determine biomass from measuring sporocarp diameter However the data has to be analyzed
INDICATOR SPECIES
Observations of the fungal flora indicate that Chroogomphus tomentosus may be the indicator species for sporocarp initiation of Cantharellus cibarius in late-October and Tricholoma inamoenum may be the indicator species for initiation of fruiting of Boletus eduis
COMPARISON BETWEEN LANPHERE DUNES AND PATRICKS POINT STATE PARK
Lanphere Dunes is located approximately 20 miles south of Patricks Point State Park and is a sandshydune ecosystem All of the plots are located in a Lodgepole-pine dominated ecosystem with Huckleberry and Dwarf Manzanita being the dominant understory shrubs The Preserve is dominated by various completely open areas in which sandy soils are densely covered with mosses and lichens that retain moisture and thus prevent desiccation
The permanent plots established in Patricks Point State Park are dominated by large conifers in a closed canopy stand with the dominant conifer being Sitka Spruce Very little understory exists in the plot and the deep needle dominated humus is filled with woody debris that fUrtlttionsto keep the soil moisture high the closed canopy prevents desiccation
Cantharellus cibarius and Boletus eduis occur in both areas (see Fig 27 for comparison of fruiting seasons) For Cantharellus cibarius the length of the fruiting season is not as long in Lanphere Dunes as it is in Patricks Point State Park In 1992 Cantharellus cibarius dominated the fungal flora in the Park but was conspicuously reduced and almost absent in the Dunes in both areas the environmental conditions were the same
Boletus edulis began to fruit approximately 1 month later in Patricks Point State Park than in Lanphere Dunes In each case the lengths of life span of sporocarps were similar and the number of spores produced by each sporocarp was equally large
Leccinum manzanitae and Armillaria ponderosa occur in Lanphere Dunes the former species is rather rare in the Park while the latter species apparently does not occur at all
Jon8 Jon 13
DcI
I I I I Lanph8ltDune
Doc 14
- _14
I
I
I
I 0lt130 Del
i Sp30 i Sop
Aug30
990 99 Lshy
992 99 _udolis
Dune 992
PoInda PI
I I I
990 99 Cmuh=1las abarius
99
l Polnda PI
Au
Aug1 -
Comparinson of Fruiting Season of Target Species
Patricks Point State Park and Lanphere Dunes
Figure 27
24
FRUITING SEASON OF 1993
During the summer of 1993 two new permanent plots 2 and 3 were established in Patricks Point State Park with the intent of studying sporocarps of Boetusedulis Plot 2 is located southwest of Plot 1 which was established in 1992 It is 1024 m2 and is divided into 256 subplots each subplot is 4 m2 Plot 3 is located approximately 50 yards north of Plot 1 and is composed of324 m2plot 3 is divided in 81 subplots each subplot is 4 m2 The location of all trees and vegetation within each subplot has been surveyed and noted accurately on individual maps The subplots associated vegetation and mushroom sporocarps have been entered into a computer and maps are presently being analyzed and printed during the summer of 1994 Although fruiting of Canthareuscibariuswas noted in mid-May monitoring did not begin until July 25th when the first flush of a nine sporocarps were observed in Plot 1 Monitoring continued until November 7th when nearly all sporocarps were deemed absent from the plots The monitoring protocol was identical to that established during the 1992 season
Sampling occurred from July 25th through November 7th on a weekly basis Eleven individuals from the local community oriented Humboldt Bay Mycological Society volunteered their time once a week during the entire sampling period with their supervision conducted by David Sime from the Humboldt State University mycology laboratory Two individuals from the Mycological Society would sample 4 hours per week and these individuals sampled for 16 weeks In addition two senior students from the Humboldt State University Department of Biological Sciences completed their senior thesis by sampling Plot 1 each of these students sampled 12 of the plot two times a week for 20 weeks Each sampling period lasted 4 hours Therefore this project involved approximately 260 volunteer hours of assistance
In addition the maximum and minimum air temperature and the amount of rainfall was sampled once a week for 52 weeks Finally sporulation studies on Canthareluscibariuswere conducted twice weekly from July 25th until October 24th and prepared slides on which spores were deposited were obtained during the entire life span of 56 sporocarps A total of 3477 slides were obtained during this period and the data is still being analyzed
SPOROCARP STUDIES LIFE SPANS FRUITING SEASON AND SPOROCARP LONGEVITY
Cantharelus cibarius
Observations were obtained on 529 individual sporocarps of Canthareluscibarius In plot 1 observations were made over the entire life span of 335 sporocarps mammal predation accounted for a loss of 73 sporocarps while vandalism claimed 60 In Plot 2 data was obtained over the entire life span of 47 sporocarps only 9 were lost to mammals and 5 to vandals No sporocarps were observed in Plot 3
-
Fruiting Season
The fruiting season of Ccibariusbegan on 24 May 1993 and lasted until 1 Dec 1993 Fruiting was not abundant however until the 27 of June 1993 Of the micrometeorological factors which may affect the beginning of the fruiting season the average minimum air temperature and the amount of rainfall are most important
As the mean minimum air temperature at the soil surface (hereafter indicated by T min) in Plots 1 and 2 increased from 55 in April to 9 degC in June sporocarp production began and thus the fruiting season was initiated The fruiting season continued until the mean minimum air temperature dropped below 9 degC (see Fig 28) Initially the T min climbed in May 1993 from 9 degC to 102-11 degC in August At this time (29 July-II August) only 55 new sporocarps were initiated As the T min dropped to 93 C 214 new sporocarps were observed during the month of September Once the T min began to rise again in mid-September to above 10degC there was a decrease in new Ccibariusprimordia to only 53 produced As such it appears that the mean T min must rise for sporocarp initiation to occur and must reach a critical level of 10 degC for the mycelium to activate large numbers of primordia
The cumulative rainfall for the three months preceding the initiation of the fruiting season was a minimum of 23 cm and a substantial amount ofrain occurred in the month preceding the initiation of fruiting (Fig 29) Rainfall during peak production was less than a centimeter (see Fig 28 31) The fruiting season is initiated during the driest part of the year and sporocarp production occurs when it is not raining heavily An analysis of the data soil moisture (SM) soil temperature (ST)and soil pH did not readily provide an explanation as to any influence on the phenology of Ccibaius However at Relative Humidity of 60 for sporocarps to form and if the Relative Humidity rises to above 90 sporocarp production decreases and eventually ceases (Fig 32)
-r
25
oC
26
24 - - - - - - - - - - - - - - - - - - - - - - - - - - - - - - - - -
22 - - - - - - - - - - - - - ~- - - - 202
20 - - - - - - - - - - - - - - - - - - - - - - shy
2 - - - - - - - - - - - - - - - - - - - - - - - - _ - - - - - - - - - - - avg max
0 temp May July Sept Nov Jan93 Mar May July Sept Nov Jan94 Mar May
Jun Aug Oct Dee Feb Apr June Aug Oct Dee Feb Apr
Figure 28
monthly rain (em) yearly rain (em)
150shy -I -
75 - - yearly rainfall
~ ~ ~ ~ ~- i - ~ -- -y~ ~ ~-- -~- - ~- - -~- ~ -~- -- -- --- ~ ~ 60 - monthly~
--- -- - - _t - 45 rainfall
~ ~~~) ~j ~(t ~ V- ~~~ tLtJt- J~= Y ~~ 30
- - - - 15
0
(Figure 2829 Cantharellus dbarius)
Total Population
As in the 1992 the total number of sporocarps found during the entire fruiting season rose dramatically during the first two months of the season and in 1993 the highest number of sporocarps present at one time reached a peak of 270 sporocarpsfrom October4ththroughthe7th (Fig30)Rain in the amount of 16 cm which occurred on July 23rd appears to be the stimulus to increase the population from 9 sporocarps on July 23rd to 70 sporocarps on August 16th Another 15 cm ofrain which occurred on Aug 16th is the stimulus to increase the number ofsporocarps to 270 on October 4th As in 1992 the majority of sporocarps of Cantharellusdbarius are produced by only 3 cm of rain As the rainfall
26
increased 50 mm (50 cm) the total number ofsporocarps began to decline Therefore as in 1992 an increase of rain after a dry period is the stimulus to start a decline in the total number ofsporocarps (Figure 31)
In 1993 the total number ofsporocarps in Plots 1 and 2 dropped by 97 abruptly after the average maximum air temperature rose to nearly 20degC and remained at this temperature for over one week Between 23-26 October the Relative Humidity dropped more than 50 the Soil Moisture fell over 40 while the average maximum air temperature rose to + 19 degC in the study Plots (Fig 31 32) Once average minimum air temperatures were below 7degC sporocarp formation ceased
number of sporoearpo 300 20
25O~
J15 ~r
200~ 1 ~ ~ ~ ~ ~ 1 ~ t )~~TTgtHlt ~
150 ~ ~ ~ ~ ~ ~j ~ ~ ~ ~ ~ ~ ~ ~ ~ ~ ~ ~ ~ ~
10
~ ~ ~ ~ ~ ~ ~ ~ ~ ~ ~ ~ ~ ~ ~ ~ ~1 ~ ~ 100
plot 2
i plot 1 - tot31] ~-~-n-~Hr-nFH--N~ jun 7 j21 oU9 1 016 330 s6 13 20 oct 1 07 010 01lt 017 021 025 nov 1 n8
j13 jul23 36 326 sep 3 010 017 27 0lt 08 011 015 018 022 029 n5
Figure 30
0 OJm rain (mm) C
70 25 a 65 shy
lt --120 ~
- lt5 i L 1 shy
lt0
35 F--Ut - ~~
~ i ~10 inmm - ~ 1 - ~ j ~ ~ j j j (= ~ ~ ~ ~ j r r~ t ~ ovg m~ 09- max
~ - - - 5 - - - -
jun 7 i21 3U91 316 330 06 013 020 od 1 07 010 01lt 017 021 025 nov 1 n9j13 jul23 06 326 sep 3 010 17 527 0lt 06 011 015 018 022 029 n5
Figure 31
New Sporocarp Production
Throughout the fruiting season new sporocarps are produced in flushes or peaks (Figs 32 33) Relative Humidity seems to affect the number of sporocarps produced during each peak the largest number of new sporocarps produced per flush occurwhenthe relative humidity isbetween60 and 80 Once the relative humidity rises to 90 the number of sporocarps per flush decreases and eventually the number of flushes cease when the relative humidity reaches 100
27
A distinct correlation exists between the production of new flushes and soil moisture and soil temperature New flushes seem to be initiated when the soil moisture rise to or above 30 and the soil temperature rises to near or above 12 dc Each new flush seems to terminate when the soil moisture drops below 30 and the soil temperature drops below 12 dc (Fig 33)
Flushes seen to occur in clusters and each cluster is influenced by the amount of daily rainfall (Fig 33) Rainfall on July 23 influenced the clusters produced up to September 2nd Rainfall on August 26 influenced the clusters produced during the entire month of September
_m ~
----shy
10
rJv J ~Hi~~ y~ f U
30 1 -=1 - rn
- cA - ~ ~ ~ m1 A1lJA 1 -MO
- Oct-Figure33
Life Span
Life span data has to be interpreted carefully since the entire fruiting season ended with the dramatic rise in maximum air temperature during the last week of October During this period the longest life span was 84 days produced by a sporocarp formed in early August and The shortest life span was 11 days produG~d by a sporocarp formed in mid-October the average life span was 465 days
Of the micrometeorological factors affecting length of individuallifespans it was found that as Relative Humidity decreased and Soil Moisture decreased longevity also decreased Contrary to 1992 longest life spans were produced by sporocarps formed early in the fruiting seasons and as the fruiting season progressed the average life span decreased (Fig 3435)
However each month produced long and short life spans July sporocarps lived an average of525 days August 612 days and September 41 days The data on soil pH T soil did not appear to influence longevity
pa0
onde Plot 1 pan n de 0 Plot 2
0 0
10 10
0
0
0
0
20
10
I October rNovember I lt-firstof month last of n1Ofitgt-gt
T 0
w
0
0011
oS 022 0
010015
T
Figure 34 e bo Figure35
-
28
Boletus edulis
Observations on 6 sporocarps were madeS formed in Plot 2 and 1 formed in Plot 3 The fruiting season began on September 2nd about one month earlier than in 1992 However all of the sporocarps were vandalized by commercial or private mushroom pickers Therefore data on the end of fruiting season life span of individual sporocarps and sporulation studies were not available Information on rainfall average maximum air temperature and average minimum air temperature at the time of sporocarp formation is found in Figure 36 Information on Relative Humidity Soil Temperature Soil Moisture and pH for each of the 6 sporocarps observed is found in Table 4
Table 4
date plot mushroom ill Relative Humidity Soil Temperatur Soil Moisture p sep 1 2
sep 15 2 sep 13 2 sep 25 2 oct 28 2
62 55 81 49 81
83 78 62 75 60
14 14 14 12 13
32 30 30 37 5
6 6 6 6 7
oct 29 3 55 81 14 30 6
0 C
25 -- -- ~i~(~m)
20 j ~~ (~-gt-1 ~~ ~~ ~ ~ ~ pound ~ ~) ~lt -- --~~ -- ~
YiHjH~)+PfWHHiH~- 1- -- -- -- -- ---- -- -- -- -- 16 = ------ -- ---- -- -- -- -- -- 8 - - - ~
ISJ mm 1 0 maxtemp 0 m om june 7 j21 july 5 j19 aug 1 a16 a30 6 14 oct 7 014 021 n16 n30
j14 j29 j12 j23 a7 a25 sept 2 10 17 010 017 nov 14 n23
Figure 36
SPORULATION STUDIES
During the four months when sporocarps were found in Plots 1 and 2 data was gathered once a week on the duration and quantity ofbasidiospores discharged in a 24 hour period slides were placed under sporocarps in the morning of one day and gathered at the same time the next day Sporulation data was gathered from a total of 62 sporocarps of Cantharellusdbarius Of these data was obtained for the entire life cycle of 42 sporocarps from Plot 1 and 5 from Plot 2 The remaining 20 sporocarps were consumed by mammals at some point in their development Therefore a total of nearly 700 slides were obtained during this study
Out of 42 life cycles the mean life span was 56 days with sporulation first observed on a mean day of 44 The fungi that received spore measurements started sporulating with a mean Rh of 943 T soil of 136 C and a SM of3094 All fungi had a maximum spore discharge per square centimeter ofhymenophore (gt100000000) at mean Rh of 788 T soil of 144 C and SM of 32 A higher spore load and warmer soil temperatures appear to be correlated
For all 42 sporocarps studied at least 6 different patterns existed during which spores were produced as follows
I number of sporocarps [ when majority of spores are produced during the life span 20 near the end 2 from the middle to the end r 5 at the beginning 7 in the middle 2 from the beginning to the middle 5 over entire life cycle
29
Sporulation for each mushroom will be found in the unfinished graphs located in Appendix A
Some fruiting bodies produced their spores in two to three flushes some all at once while others did not produce more than 500000 spores per square em In a mycorrhizal fungus such as C dbatius basidiospore production may be genetically controlled
Sporulation data is still being analyzed as of this date During the next few months an attempt will be made to determine if sporocarp clustering has an effect on sporulation However the maps on which all sporocarp and vegetation will be located have to be completed
Comparison between 1992 and 1993 Fruiting Seasons
Comparisons of the data collected in 1992 with that of 1993 indicate distinct differences between the two years The fruiting seasons in each year began roughly at the same time however 1992 was a bit later than 1993
Cantharellus dbarius
The fruiting season in 1992 lasted nearly two months longer than in 1993 In 1992 freezing temperature terminated the life span near January 20th whereas in 1993the season was terminated on November 12th due to the week long period ofwarrn weather The initiation of the fruiting season were similar with the season observed to begin on June 7th in 1992 and the season observed to begin near June first in 1993 (see Figure 37) In each year the fruiting season began during a period of dry weather which was preceded by wet weather In each year new sporocarps were formed as long as the cumulative rainfall was kept below 5 em and the largest number ofsporocarps were produced during a time when no to very little rain occurred The termination of the fruiting season began when the relative humidity increased and new rain occurred Therefore it appears that sporocarp formation in Cantharellusdbatius responses to very little rain The stimulus for the initiation of the fruiting season seems to be a low relative humidity near 60 average minimum air temperatures rising from 5 to 9 dc In each year sporocarp formation was more restricted to the southeastern quadrant of plot 1 which has a large amount of buried wood Therefore sporocarp formation seems to respond to moisture found in this woody debris a phenomenon which correlates with the studies of Norvell
- Length of Fruiting Season
8oIlaquou edu
F r-
Jon
Doc
- D Nov2
Cd2
- 5
1992Con_ 993 1992Bou 3 1~3
Figure 37
The highest number of sporocarps found in plot 1 in 1992 was about 105 whereas in 1993the highest number was 267 The patterns of the highest number of sporocarps present at anyone time were similar in 1992 as in 1993 however the abrupt disappearance ofsporocarps in 1993 was caused by the warm weather (see Figure 38) The temperatures in 1993 were warmer and the rainfall less than in 1992 Therefore an increase in sPorocarp numbers during drier weather seems to correlate well with information provided by Norvell (1992) (See Figure 41)
New sporocarps were produced in flushes in both 1992 and 1993 However the number of flushes were about 3
times more in 1993 than in 1992 Interesting the highest number of new sporocarps produced per flush were equal in 1992 asin 1993(see Figure 39)
The pattern oflife spans were very different in 1992than in 1993 (See Fig 40) In 1992 the longest life spans were produced towards the middle and the end of the fruiting season however all parts of the fruiting season produced sporocarps with different lengths oflife span In 1993 the longest life spans were produced in the beginning of the fruiting
30
season and the average life span length was reduced as the fruiting season progressed However the longest life span shortest life span and average life spans were nearly identical in 1992 as in 1993 (see Table 5)
lifespan of individual sporocarps total number of highestnumber of sporocarps sporocarpsat anyone
longest shortest average observedin plot 1 time in v10t1 1992 92 I 10 I 44 364 105 1993 84 I 11 I 465 454 267
Sporulation patterns for the two years did correlate with maximum spore output for Relative Humidity Soil Moisture and Soil Temperature In 1992the Relative Humidity was 90 the Soil Moisture was 316 and the Soil Temperature was 143 C In 1993 the Relative Humidity was 878 the Soil Moisture was 32 and the Soil Temperature was 144 C Sporocarps growing only in bryophytes and those growing in woody debris need to be compared for sporulation patterns
~ 20
num ps
100
20 90
80 70 so 60 50
30 20 a 10
o~812
911 1011 1111
dol
1211 111 111
--- ~-- wJ
1 0I 1 yen~ _NO
ca
--19931992
Firgure 38
numfnowpongtc35 ~ ~
30r 29 r
20 21
20
15 10
0 A2 -
28 3
1992 199J Figure 39
31
IIr benln
Ipanon 9
Plot 1
numpY100
80
90 7
80
7
50
30 -20 T
pC to3 -- - on gtOd3 _0 1
1992 1993
Figure 40
+Figure 41
~~(=I
1U c
55
OJ In em
55 25
~
20
t5 v
1
- t
1 r -
s JO
- ~
i
12 -
- - momb moxmp
---~
~ It l - (bX)
3 t5 oct 04 011 0 029 n2 n19 023 n29 6 d26 1
19 m (02) 08 (01)(25)nov1 n nt5 n22 n25 2 2 9 jan4 0
5r~T OJn
c 13 ~ocT7 i ~~ I-ro18 s s
-
1992 1993
-shyem
50 135 120 105 90 30
plOt2 1992-1993
-pIot1 1992- 993
shy ~
)un A ope oct
nov
Jen
reo m br may
-plot199
Comparison of rain fall plot 1 and plot 2
32
Literature Cited
Bengston D 1993a Letter to the California Native Plant Society expressing concerns about the Harvesting of Wild Mushrooms County of Mendocino Department of Agriculture Agricultural Commissioner
Bengston David 1993b Subject Commercial Mushroom Industry Informational Memo Memorandum dated 18 March 1993 sent the supervisors of the County of Mendocino County of Mendocino Department of Agriculture Agricultural Commissioner
Cherfas J 1991 Disappearing Mushrooms Another Mass Extinction Science 254 1458
Fischer C Molina R Amaranthus M Luoma D L and J Trappe 1993 Productivity and Ecological Habitat of Matsutake Mushroom in the Chemult Ranger District Winema National Forest and the Illinois Valley Ranger District Siskiyou National Forest Research plan circulated to the various ranger districts in northern California and the pacific Northwest
Largent David L 1991 General Research Plan for the study of Armillaria ponderosa Submitted to and accepted by The Six Rivers National Forest Orleans District
Lizon Pavel 1993 Decline of Macrofungi in Europe An Overview Contributed paper presented to the 14th Annual Mid-Atlantic States Mycology Conference Duke University Durham NC April 17 1993
Millar C Cheng S Creasy M Largent D L and R Richards 1993 Environmental and Social Impact Analysis of Mushroom Harvesting Assessing the Sustainability of the Matsutake Mushroom on the Klamath National Forest Research Proposal submitted to the Klamath National Forest
Molina R ODell T Luoma D Amaranthus M Castellano M and K Russell 1993 Biology Ecology and Social Aspects of Wild Edible Mushrooms in the ForestS of the Pacific Northwest A Preface to Managing Commercial Harvest VSDA Gen Tech Report PNW-GTR-309 ~~
Norvell Lorelei 1992 The Oregon Cantharellus Study Project Mushroom harvesting and chanterelle productivity in Oregonua preliminary report
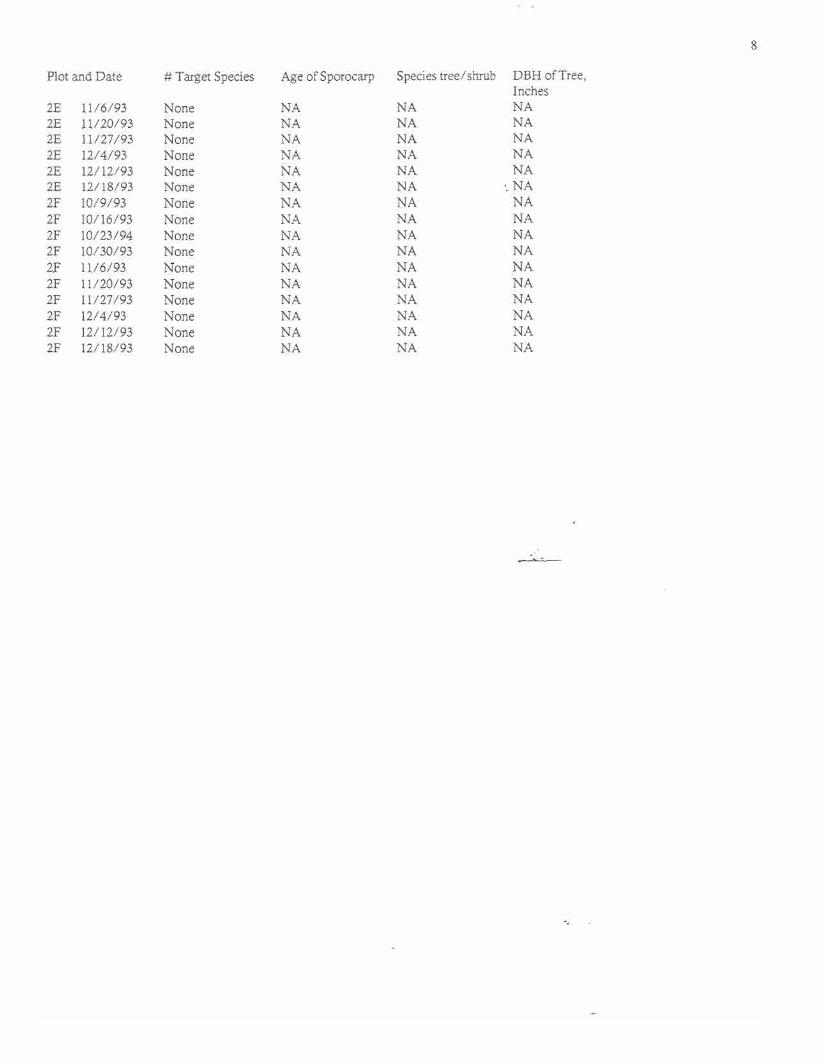

10
I
SPOROCARP STUDIES LIFE SPAN AND FRUITING SEASON
Fruiting seasonEdible Macromycetes II av(oseason Lanphere Dunes 1990-1993
A vanderosaArmillaria der 1990 dec 17 dec 28 11 4
Feb 9 1991 jan 1 jan 11 10 5 1992 nov 12 dec 11 29 14 1993 nov 25 dec 8 13
1 Jan 8I 1990 nov 19
Boletus edulis
dec 12 15 8 Dee7 1991 nov 20 dec 14 22 17
1r-
Tr
1 1
I I r
Nov5
1992 1992 1993
oct 22
nov 22 oct 29
nov 1
dec 8 nov 18
10 26
20
5 123
Leccinum manzanita Oct4 1990 nov9 dec 14 35 22
1991 nov 30 dec 31 31 15
1992 oct 22 nov 1 10 5 Sep2 1993 nov5 nov 29 24 138
Cantharellus dbarius
90 91 92 93 90 91 92 92 93 90 91 92 93 90 91 92 93 Aug 1 1990
1991
dec31
oct 30
154 92
Armillaria Boletus leccinum Cantharellus 1992 sep 29 61 1993 nov2 63
Figure 1
Cantharellus cibarius
Life span of Individual Sporocarps (numbers in boxes= number of days) 1992 As of 6 June 1992 several sporocarps
were detected in plots however all were too old for life span qr sporulation data A similar phenomenon was noted on 14 August
and 21 September as the few sporocarps bJn ~n-D 8 encountcrc-d-had no estimable initiation date
0 D U U G 0 I 6 IDec3 as they were too old and dry From the 21 September until early January the rest of sampling season no other sporocarp of was
B 1 S Ef b B Nov5 sighted in the study area thus the fruiting season for this fungus ended nearly 30 days earlier than in 1991 and over 3 months
234 5 6 1 2 2 3 Oct 2 earlier than in 1990 (see Fig 1 and Table 1)
Arminariapo1Iderosa BolausaMis Lemum mananitlaquo This kind of phenological behavior seems to Figure2
correlate well with the data from Oregon obtained by Norvell (1992)
Armillaria ponderosa
In 1992 the fruiting season for Armillaria ponderosa was nearly 4 weeks earlier than in 1990 and five weeks earlier than in 1991 (see Fig 1) A review of the rainfall data indicates that at least 8 cm of rain is required for initiation of fruiting in this species (see Fig 3) In 1992 the fruiting season lasted 29 days much longer than either in 1990 and 1991 and terminated as in the previous years with the onset of freezing temperatures (Table 1)
Complete life span data was obtained for 6 sporocarps of Armillaria ponderosa with the shortest being 18 days and the longest being 28 days (see Fig 2) All sporocarps were frozen solid in mid-December and thus these life span periods are not as long as is typical for the species
Boletus edulis
Sporocarps of Boletus edulis were first observed in mid-October of the 19~)2season whereas in 1990 and in 1991 sporocarp initiation was observed in late November (see Fig 1) The accumulated rainfall in mid-October 1992was about 5 cm that corresponds nicely with the data obtained in 1991but is about 15 cm more than was observed in 1990 Sporocarp initiation in this species is dictated by a minimum amount of moisture about 35-43 cm when the average maximum temperature is below 18 degrees and the average minimum temperature is just above freezing (see Fig 5) However with warmer t~mperatures more
11
moisture is required for sporocarps to begin to form An interesting anomaly previously not observed occurred this season in that this species had two fruiting periods one in mid-October and a second in mid-November the latter period corresponds exactly with onset of fruiting in 1990 and 1991
Complete life span data was obtained for only two sporocarps of Boletus edulis (See Fig 2)
Leccinum manzanitae
In 1992 initiation of fruiting in mid-October by Leccinum manzanitae occurred about 1 month earlier than in 1990 and nearly a month and half earlier than in 1991 (see Fig 1) In each of these seasons sporocarp initiation began when cumulative rainfall was over 5 em and just before a very heavy rainfall thus temperature did not seem to have an effect on sporocarp initiation in this species
Complete life span data was obtained for 3 sporocarps The life span varied between 10 and 16 days that corresponds well with data obtained in 1990 and 1991 (see Fig 2)
INDICATOR SPECIES
The use of Chroogomphus vinicolor as the indicator for Boletus and Leccinum as suggested following the 1990 and 1991 seasons will have to be re-evaluated as this species did not fruit this season until several weeks after the boletes started to fruit however C vinicolor was the indicator species for the second flush of Boletus edulis sporocarps Another candidate for an indicator species is Hygrophoropsis aurantiacus which fruited about one week prior to sporocarp production by the boletes
SOIL MOISTURE pH SOIL TEMPERATURE AND RELATIVE HUMIDITY STUDIES
Soil moisture pH soil temperature and relative humidity were recorded for each plot that had sporocarps of the target species No trend could be determined for the sporulation studies However sporocarp formation in Boletus and Leccinum favored areas with a pH of between 63 and 66 as well as a soil moisture level of between 20 and 25 In Armillaria ponderosa sporocarps favored sites with a pH near or more typically above 66 and with soil moisture content that begins at 28 and quickly drops to between 10 and 20
SPOROCARP NUMBERS
Because of poor data collection valid sporocarp numbers for LanRhere Dunes were not obtained for the 1992 mushroom season -
r
Annillaria ponderosa (Figure 3)
1991
1990 0 C em
0 35 35 C em
35 3035
30
30 30 25 25
25 25 20
begin end 20
20 - pegin end 20 shy
15 15 1515
10 10 10 10
5 -5 -5 -5
-10 -10 0 -10 ~ ~ ~ m ~ ~ m m ~ ~ ~ m 00 ~ ~ J2 J3 J 51 ~ 01 02 03 ~ N1 N2 N3 ~ 01 02 00 ~ JI J2 J3 J
1992 1993
0 0
C em C em
35 35 35 35
-rain 30 30 30 30
min temp 25 25 25 25
Pegin 20 20
- max temp 2020 end begin
15 d
15 15 ---~ - - -15
10 10 10 10
-5 -5 5 -5
-10 ~-10 10 -10 ~ ~ ~ m ~ ~ m m ~ ~ ~ 00~JIJ2J3J4 51 ~ 01 02 03 ~ NI N2
Cantharellus dbarius (Figure 4) ~
1991
1990 0 C em
0 35 35 C em
35 35 30 30
30 30 25 25
25 25
20 20 20 20
15 15 15 15
10 10 10 10
-5 -5 5 -5
10 -10 -10 -10 ~ ~ ~ m ~ ~ m m ~ ~ ~ m 00 ~ ~ J2 J3 J4 51 ~ 01 02 03 ~ NI N2 N3 ~ 01 02 00 ~ JI J2 J3 J
1992 1993
0 0 C em C em
35 35 35 35
-rain
30 30 30 30
min temp 25 25 25 25
end end - - maL temp 20 20 20 20
15 15 15 IS - T-~ 10 10 10 10
5 I
5 5 5 -5
10 ~
~ ~ m ~
~ m m ~ ~ ~ m 00 ~ ~ n n
10 J4
-10 51 54
01 02 03 ~
NI
N2
T N3
~ ~ 01
~ 02
~ 00 ~ JI J2 J3 J4
- 10
- --
1991
1990 C em
35 35 C em
35 35 30 30
30 30 25 25
25 25 20
beg end 20
~ 20 --- beg81 end 20 - 15 15
15 ---- --15 - - - - - - -
10 - - 10 10 10
- shy
5 -5 5 -5
-10 -10 0 10 $1 54 0 02 03 04 NI N2 N3 N4 D1 D2 D3 D4 J1 J2 J3 J4 ~ 54 ~ ~ 00 04 ~ N2 m N4 ~ 00 D3 D4 n n n J4
1992 1993 C em C em
35 35 35 35 -ran
30 30 30 30
ninotemp 25 25 25 25
beg811 end 1 begin 2 - - -maxtemp 20 --
20 20 begn
20
15 5 15 15--~_ -
0 -l j 10 10 10
I
5 5 5 -5
10 -- -10 -10 10 ~ 54 ~ ~ 00 04 ~ N2 m N4 D2 D3 D4 JI J2 J3 J4 $1 54 01 02 03 04 N1 N2 N3 N4 DI D2 D3 D4 JI J2 J3 J4
Leccinum mpoundlnzanitae (Figure 6) -
1991
1990
C em 35 35
C em 35 35
30 30
30 30 25 25
25 25beg81 end
20 20
- - begn end20 20
5 1515 15
10 010 10
- -shyshy
5 5 5 5
-to ~ -to 10 to $1 54 01 02 03 04 NI N2 N3 N4 D1 D2 D3 D4 JI J2 J3 J4 51 54 01 02 03 04 NI N2 N3 N4 DI D2 D3 D4 JI J2 J3 J4
1992 1993 C em C em
35 35 35 35 -ran
30 30 30 30
nin temp25 25 25 25
beg81 end begn end - - maxtemp 20 20 20 20- - 15 15 15 15
------r---lt~ -10 10 10 10
5 -5 5 5
10 -10 - 10 ~ 54 ~ ~ 00 04 ~ N2 m N4 ~ 00 D3 D4 n n n J4 -1degS - 54 01 02 03 04 N2 N3 N4 DI D2 00 0 JI n J3 J4
14
SPORULA nON STUDIES
Complete sporulation data for the entire life span was obtained for six Armillaria ponderosa sporocarps and one Boletus edulis sporocarp No studies were conducted on Cantharelus cibarius nor was complete life span sporulation data obtained for Leccinum manzanitae
Spores were gathered by placing a spore trap under the hymenium of a viable sporocarp and leaving it in place for a 24 hour period Once a sporocarp collapsed it was considered dead and spore collection ceased The sporulation pattern (Figs 78) for Armillaria was different when compared to past studies Four of six sporocarps studied produced most of their spores~during a single period during their life span 1 (B) of these produced spores at the beginning of the life span as was previous observed in 1990 and 1991 and the remaining 3 (A D E) produced spores near the end Each of the remaining sporocarps
produced spores during two periods during their life span C at the beginning as well as the end and F at the beginning and the middle No correlation with any
spores Armillaria ponderosa environmental factor could be 18E7 determined
80ES In every instance observed 116E7 during this season as well as in the
- 14E7 - - last two seasons sporocarps of 60ESI Armillaria ponderosa did not 112E7
produce spores over their entire 110E7 life span Moreover a majority of - -
40ESI
180E6 the sporocarps produces an abundance of their spores
160E6 immediately after expanding from
20ESIshy 140E6
a button Thus the spore load of this species could be dramatically
120E6 affected by harvesting sporocarps in the button stage
0 dec13 dec1S dec18 dec20 dec2S dec28 jan2 jan6 jan9 jan12
990-6 days 99-10 days ~
Figure 7
number of spores
1SE8
1IIIIIIII ~days
v-gtl ~8 days 10E8
f~j ~8days
SOE7 l~ ~Sdays - ~8 days
k1 ~9 days nav 12 nav 19 nov30 dec 1 dec 2 dec 3 dec6 dec11 dec16
1992
Figure8 -
0
15
Boipoundtus edulisso
f8 In Boletus eduis sporulation occurred steadily as ea the fungus developed (see Figs 9 10) Eventually 8 sporulation decreased and even ceased as the sporocarp 1E8 aged As in previous seasons sporocarps of this species ~os produced large numbers of spores over their entire life
span with the majority of spore being produced in the f8
middle of the life span Although no sporulation 8 lIE
studies were completed for Leccinum manzanitae 4 lIE previous studies indicate the pattern is similar to that of
0023oa2S4 010 oa23 p8 M 0 oa23 0028 4 oa23 0028
Boletus eduis (see Fig 11) oa25 oa25 13 125 010 0
18 21 18Fig 9
Boletus edulis
1m po Leccinum manzanirae po
---Be8 81E8lIE
2E8
63E8
50e8 4 lIE4E8
4SE8
SEa
1E8 25e8
~ noy 22 noy 27 nov30 doc 13 28 - laquo4 do d _n - _8 0laquo1 0lt13 21 900- 16
Fg0 -1--
STUDY PERIOD SEASON OF 1993
The mushroom research at Lanphere Dunes Preserve was performed on a semiweekly basis from September 10 1993to January 9 1994 Seventy-nine 2-meter diameter plots were monitored on Tuesday and Friday of each week for appearance of any of the four target species Leccinum manzanitae Cantharellus cibarius Armillaria ponderosa (Tricholoma magnivelare) and Boletus eduis
When a sporocarp was detected in a plot it was monitored twice weeklythroughout its entire lifespan Monitoring consisted of measuring and recording soil pH and moisture content using a Kelway soil tester soil
temperature at a depth of7 to 9 cm using an Ertco soil thermometer and relative humidity and air temperature using a VWR digital humidity and temperature meter Each semiweekly visit induded monitoring four weather stations in different locations in the Preserve Each station was equipped with a rain gauge and a Taylor maximumminimum thermometer
WEATHER (see Figures 12-17)
In 1993rainfall during the monitoring period totaled 1273cm which makes it the second driest season since this studybegan in 1990 The 1993season was dry and warm with the total accumulated rainfall pattern and the maximum temperaturepattern being similar to those of the 1991season The average minimum temperature pattern on the other hand was unique
The 1990season was cold and wet the 1992season was wet and warm and the 1991and 1993seasons were dry and warm
-
16
Cumulative Rainfall (Figure 12) ~ Trend (Figure 13)
em 35
iz 30 I
28 I I 23j34
25
2~J 20 I
I 15 1P21421
1U I 1231~3 - 105w1I2
10 W~
51 54 01 02 03 04 N1 N2 N3 N4 01 02 03 D4 J1 J2 J3 J4
Minimum Air Temperature (Figure 14)0C
25
20
15
10
~lt-- ~-~- - --~v--- ~- gt
-- -5
0 51 54 01 02 03 N1 N2 N3 N4 01 02 03 D4 J1 J2 J3 J4
Maximum Air Temperature (Figure 16)
0 C
25
20
15
10
I
51 54 01 02 03 N1 N2 N3 N4 Of 02 00 D4 J1 J2 J3 J4
om 35
30
shy25 -
- 20
f5
1993 10 shy
- 1992
1991
1990 ~ 54 ~ ~ ~ ~ ~ ~ ~ ~ ~ ~ 00 D4 n J2 J3 J4
~ Trend (Figure 15)
c
25
20 --- -- shy
- - - - - -
--
- -- -
10 shy
1993[ 1 L --- lt
-s -1
-10 0 51 S4 01 02 03 N1 N N3 N4 01 02 03 04 JI J2 J3 J4
~ Trend (Figure 17)
0 C
25
- - --20 - 15
10
~ ~~~L~t~-~--~ c ~~ -~- -~-~~
051 54 01 02 03 N1 N2 N3 N4 01 D2 D3 D4 J1 J2 J3 J4
17
LIFE SPAN AND FRUITING SEASON
Among the four target species studied there was a distinct pattern of fruiting among all four of the target species
Cantharellusdbarius (Figures 14 Table 1)
Cantharellus dbarius began fruiting before our study started and continued fruiting until day 63 of the study Fifteensporocarps from seven different plots were recorded The average lifespan for a Cantharellusdbarius fruiting body was 1425 days
The fruiting season of sporocarps was 63 days the longest of all the target species and began during the summer when the rainfall was below a centimeter similar to the season found in Patricks Point State Pink The season ended when rainfall began to increase a pattern similar to that in Patricks Point State Park The 1993 season was similar in length and in pattern to that of 1991
The four environmental factors recorded at initial sporocarp observation averaged as follows
Average soil temperature 149degCAverage soil pH 698Average soil moisture 946Average relative humidity 728
At Cantharellus dbarius fruiting body death the averages of the environmental factors recorded were
Average soil temperature 124degCAverage soil pH 697Average soil moisture 51Average relative humidity 672
Armillariaponderosa (Figures 1 3 Table 1)
Armillariaponderosa(=Tricholomamagnivelare)was observed in two plots with a total of two sporocarps recorded Fruiting season for this species was the shortest of those studied beginning on November 25th and ending on December 8th
The life span was 13days and as in previous years the fruiting season was abruptly terminated by freezing temperatures Fruiting was initiated when the average maximum temperature dropped below 15degC and the average minimum temperature was near freezing A distinct correlation existsbetween the beginning of the fruiting season and the differencebetween average maximum temperature and average minimum temperature fruiting seems to begin when the temperature difference is at least 15 degC a pattern which appears each season over the last 4 years -
At the beginning of button stage for this species the environmental factors aver~
Average soil temperature 94 degCAverage soil pH 615Average soil moisture 1000Average relative humidity 8145
At fruiting body death the observed averages for environmental factors were
Average soil temperature 108degCAverage soil pH 61Average soil moisture 425Average relative humidity 8955
Boletus edulis (Figures 15 Table 1)
Boletuseduliswas not observed in any of the designated plots but was found at different locations in the Preserve Sporocarp-related data was not recorded for Boletusedulissince it did not appear in marked plots however beginning and end of fruiting season was noted The fruiting season for this species went from October 29 to November 18
Sporocarps of Boletusedulishad a fruitingseason of 20 days similar to in length to that found during the 1991and 1992 seasons and similar in length to that of Leccinwnmanzanitae
A pattern has developed over the past 4 years with the fruiting season beginning when the rainfall reaches at least 275 em in dry years 1991and 1993and when the rainfall reaches 5 em in wet years 1990and 1992
Fruiting ended when rainfall abruptly increased and the average minimum temperature dropped This pattern was similar to that found in previous years and suggests that the combination of increased soil moisture and spil temperature cause the termination of fruiting and the minimum temperature dropped near or below freezing
lecctnwn manzanltae (Figures 16 Table 1)
Lecdnum manzanitae was observed in four plots and seven sporocarps were recorded Fruiting season began on November 5th and continued until November 29th The average lifespan of a Lecdnum sporocarp was 138 daysshy
18
------
The fruiting season lasted 24 days similar to that of Boletusedulis Fruiting is initiated in dry years when the rainfall nears 3-5cm and in wet years when the rainfall nears 5 cm As in Boletus
edulisfruiting is terminated when the rainfall increases and the average minimum temperature drops to near 0 degc
The average environmental factors calculated for when fruiting began for Lecdnum manzanitae were
Average soil temperature 64 degC Average soil pH 643 Average soil moisture 15 Average relative humidity 825
When Lecdnum manzanitae fruiting body death occurred the observed averages were
Average soil temperature 90 degCAverage soil pH 646Average soil moisture 252Average relative humidity 761
-
- --- -
19 Location Patricks Point State Park near Trinidad California
BACKGROUND
Patricks Point State Park is located about 20 miles north of Humboldt State University on the Pacific coast near Trinidad California The study area is dominated by Pacific Hemlock (Tsuga heteropylla) and Sitka Spruce (Picea sitchensis) This site was added to the project in the 1992 season through the cooperation of the North Coast Red woods District of the California Parks and Recreation Department This is a popular and easily accessible park and a favorite site for mushroom pickers Picking mushrooms is prohibited in the park but proximity to good roads and uncontrolled accesses through unfenced boundaries make it easy for pickers to get in and out quickly
STUDY PERIOD SEASON OF 1992
During the summer of 1992 a permanent plot of 1024 square meters was established in Patricks Point State Park This plot was divided into 256 subplots of four square meters each The location of all trees and vegetation within each subplot was surveyed and noted accurately on individual maps (See Figure 7 for a sketch map of the entire plot) Monitoring of the subplots began on August 24 1992 however sporocarps of Cantharellus cibarius were observed in mid-June before the permanent plot was established Each monitoring visit involved the following once it was established a target species was fruiting in a subplot the sporocarp was assigned an identification number the date and developmental stage were noted (ie button or mature) and the subplot number recorded In addition relative humidity soil temperature soil pH and soil moisture content were recorded for each subplot in which sporocarps were observed Furthermore sporocarps of other epigeous fungi were noted which will provide information on indicator species
Sampling occurred from late August 1992 through March 1993 Ten individuals from the Humboldt Bay Mycological Society (HBMS) volunteered their time for the entire sampling period with their supervision conducted by David Sime from the Humboldt State University mycology laboratory Two individuals were used during each of the twice weekly sampling periods that lasted from 4-6 hours therefore this project involved approximately 450 volunteer hours of assistance
In addition life span and sporulation data were obtained twice weekly for Cantharellus cibarius by placing microscope slides under the hymenium of the sporocarps in the morninglt and leaving in place for 24 hours Volunteers were not used for this aspect of the study
Sampling methods for Boletus edulis were different from methods for Cantharellus cibarius Thirty 2x2 meter plots were established in Abalone campground during nine samplIng -dates during November and December Each plot was located around a group of sporocarps deemed fruiting from the same mycelium Relative humidity soil temperature soil pH and soil moisture content were recorded for each of the plots Life span and sporulation data were also obtained Volunteers were not used for the studies on Boletus edulis
Vandalism by recreational and commercial mushroom pickers was reduced in the permanent plot by posting easily visible iridescent signs and painting the sporocarps to indicate their potential uselessness for harvesting purposes However all of the sporocarps located outside the permanent plot were either harvested by recreational or commercial mushroom pickers or were eaten by various mammals
Overall observations for 364 sporocarps of Cantharellus cibarius were recorded with a majority of the sporocarps located in the southeastern quarter of the permanent plot (see Fig 18) Because of mammal predation and commercial or recreational mushroom harvesting 232 sporocarps were lost thus complete life span and environmental data were obtained for 132 sporocarps Furthermore 163 microscope slides for spore collections were placed and collected from 12 different sporocarps of Cantharellus cibarius over their complete life span
Observations on 30 different Boletus edulis sporocarps yielded only two complete life cycles however all Boletus edulis sporocarps were lost from intense commercial or recreational mushroom harvesting
Weather data from May until the projects inception on 24 August was provided by Virginia Waters (HBMS) after August 24 weather data was recorded in the permanent plot on a continuing basis
SPOROCARP STUDIES LIFE SPANS SEASON AND SPOROCARP LONGEVITY
Cantharellus cibarius
As early as June 7 a few scattered sporocarps were observed in Patrick5 Point State Park however all of these were outside the permanent plot Initiation of a large number of new sporocarps began in the plot on August 24 most probably the result of accumulation of moisture from fog drip that was retained in the woody debris and correlated with gentle drop in the air temperature From the August 24 until October 21 new sporocarps were produced in a series of flushes a phenomenon similar to that found in the Oregon studies (Norvell 1992) The stimulus for each flush seems to be a rise in both the average maximum and
average minimum air temperatures The largest numbers of new sporocarps were produced during the month of September when only 025 cm of rain occurred and the average maximum temperature was above 15 degrees and the average minimum temperature did not drop below 10 degrees (Fig 1921) As the minimum temperature dropped below 15 degrees there was an abrupt reduction of sporocarp initiation particularly in the months of November and December (Fig 20 21)
As a general trend the number of new sporocarps produced as well as the total number of sporocarps decreased steadily as the accumulated rainfall rose and both the maximum and minimum temperatures dropped (see Fig 192021)
numblaquo fnow -
35 35
30 29 30t I 11
2S 25 yen
2020
I15 15 i
10shyr ~
11 ~ ~ ~ 0 0
Au24SltoltI 457911 19 24 0lt12 911 19 30 11 Doc2 Au24 $opt 1 4 5 7 9 11 19 24 0lt12 9 11 19 30 11 Doc2 29 3 14 20 29 4 14 21 Nov10 1929 3 14 20 29 4 14 21 Nov10 19
TrendNumber of New Sporocarps
Figure 19 (Canthpoundzrellusdbarius)
numbolt d 0C8Ip$
100 100 =~ 90 90 90 -so70 -70 so ~
6O~ so soF 40 40 30 3020 20 10
tor -~ 0
9124 11i 211 0
91 ICY1 11 t19 9124 91 101
111 121 11 119
do
Total Number of New Sporocarps Trend
Figure 20 (Canthpoundzrellusdbaius)
nlnn m C
15 40 15
r 36 i 10 - 31 - - 28 I ( ---_ t51 - _J 1 --
I 10
- -~-~-- ~10 to to - ~
t1 mootomp
- - mtom
~ j f - ~~~~ 0 (t)C5) no 11 01 oS n12 ntO0130 dt to J~ ~ ~ ~ ~ ~ ~ ~ ~ ~ r~l~ to If15Jnot o n15 n11n15 dtl dt () c 01 0 11 01 19 n5 oil 0 013 0 05
II=mOltII 3 9 nl n15 n22 n25 12 112 119 0 21 102101 1014)10251 nl 14
Trend Rainfall Maximum and Minimum Temperatures
Figure 21 (Canthpoundzrellusdbarius)
21
The mid-point for the fruiting season was around October 1 with the maximum number of sporocarps being found from the first week of September through the second week of October (see Fig 20) The total number of sporocarps reached zero in January when minimum temperatures dropped below 33 degrees Thus the fruiting season for Cantharellus dominated stands in Patricks Point State Park lasted 152 days within the permanent plot (see Fig 24) and approximately 227 days within the entire park When rainfall reached nearly 20 cm in December new sporocarp production ceased (Fig 1921)
Complete life span data was obtained for 132 sporocarps of Ca1Jtharellus cibarius with the shortest being 10 days the longest 92 days the average life span was 44 days The largest number of sporocarps had a life span of 58 or 40 or 21 days (see Fig 22)
On the average sporocarp longevity per number of sporocarps produced for Cantharellus cibarius increased each month beginning in September and ending in December (Fig 23) However September had the longest lived sporocarps with seven sporocarps living up to or past 80 days Analysis of the data on rainfall and air temperature did not readily provide an explanation and thus this characteristic could possibly be genetically controlled or related to host intervention
nu- _0000 HI_n in 11 numbo 1 doyo
100
10 90 - -- - -- - - -- - -- - - - -
1[tJ 90 -- -
1111 so 5 - -4-
1IiI 10
92 90 84 78 74 68 84 62 eo sa sa 54 52 SO48 46 44 42 40 38 35 31 29 26 24 21 16 10 1 Sopt 30 gtOc13 N 1 91 95 80 77 72 66 63 61 58 57 55 53 51 49 47 45 43 41 39 38 33 30 28 25 23 18 5 00lt1
to n in dyo
Number of Sporocarps and their life span Life Span of Individual Sporocarps related to the beginning of furiting
Figure 22 Figure 23
PH SOIL MOISTURE SOIL TEMPERATURE RELATIVE HUMIDITY
Cantharellus cibarius
In Cantharellus cibarius sporocarp initiation within most of the subplots is related to a decided rise in soil moisture after a period of relative dryness and in most instances with an accompanying rise in soil temperature in almost all instances the relative humidity is less than 100 The death of the sporocarp seems to be correlated with a distinct drop in soil moisture after a prolonged period of rather wet soil The pH of the soil seems to have no bearing on sporocarp initiation or cessation Generally sporocarps of Cantharellus seem to be found in econiches that have pH above 65
-
22
J20
Boletus eduis
Initiation of Boletus eduis sporocarps began the third week in November and lasted about three weeks (Fig 24) Apparently an accumulation of at least 10 cm of rain was necessary for sporocarps to begin to form Sporocarps of Boletus also seem to prefer sites with a pH of between 60 and 65 (Fig 25)
-
Ian ~ ~JJ1J ~ ~
7 I
I I r--- III I
II ~
D I I ~ t I I r_14
II i ~~~ I~gt (~ o~ 0-2 50 I I
~ - ~J J 0
-Cd2 ~
--shyrP63 Sop
Aug25 50 ~m
cn1lM 80
pH Relative Humbidity Soil Temperature Soil Moisture
Fruiting Season 1992 4 plots partical life span for Boletus eduis
Figure 24 Figure 25
SPORULATION STUDIES
During the four months when sporocarps were observed data was gathered on the duration and time of sporulation for each of the two target species Spores were obtained by placing microscope slides in metal holders (spore traps) under the hymenium of a viable fruiting body Once Deuteromycetes overtook the sporocarp or the hymenophore collapsed the fruiting body was considered dead Spore traps were left out for a period of 24 hours and were collected twice a week Spores were counted on thirty 1 micron grids for 163 micro slides for a total of 4890 spore measurements
Micro slides were collected twice weekly over the entire life spari~of 12 different sporocarps of Cantharelus cibarius Distinctly different patterns of sporulation were observed (see Fig 26) In general sporocarps of Cantharelus cibarius produce far less spores per day than any other of the edible mushrooms studied with 10 of 12 sporocarps having less than 1000000 spores per square centimeter of hymenophore produced per 24-hour period Maximum spore production during the life span of a sporocarp of Cantharelus is dependent on a rise in soil moisture accompanied by a distinct rise to near or at 100 relative humidity and these conditions must be preceded by a period in which the soil moisture and the relative humidity had dropped
4E6
4E64E6
3E6
2E6
2E6
2E6
1E6
5E5 r
14 days 50 days 50 days 66 days 58 days 48 days30 days 14 days 50 days 28 days 40 days 38 days
Spore production for 12 different sporocarps of Cantharellus cibarius
Figure 26
0
23
BIOMASS STUDIES OF CANTHARELLUS CIBARIUS
Pileus diameters and diameters of the stipe apex were recorded for 81 sporocarps of Cantharellus cibarius over a ten-week period Thirty-one of the sporocarps were located within the permanent plots and 50 were located outside the plot All of the sporocarps outside the plot were harvested in the same manner and fresh and dry weight recorded for each Age classifications were established for all 81 sporocarps
Preliminary Results
Of the 31 sporocarps studied within the plots 20 were lost due to some type of vandalism Complete data was recorded for the remaining 11 sporocarps over their entire life span Thus correlation of biomass with life span and with environmental data should be possible
Results indicate that biomass increases in direct proportion to the pileus diameter as well as to the stipe diameter It would appear that it may be possible to determine biomass from measuring sporocarp diameter However the data has to be analyzed
INDICATOR SPECIES
Observations of the fungal flora indicate that Chroogomphus tomentosus may be the indicator species for sporocarp initiation of Cantharellus cibarius in late-October and Tricholoma inamoenum may be the indicator species for initiation of fruiting of Boletus eduis
COMPARISON BETWEEN LANPHERE DUNES AND PATRICKS POINT STATE PARK
Lanphere Dunes is located approximately 20 miles south of Patricks Point State Park and is a sandshydune ecosystem All of the plots are located in a Lodgepole-pine dominated ecosystem with Huckleberry and Dwarf Manzanita being the dominant understory shrubs The Preserve is dominated by various completely open areas in which sandy soils are densely covered with mosses and lichens that retain moisture and thus prevent desiccation
The permanent plots established in Patricks Point State Park are dominated by large conifers in a closed canopy stand with the dominant conifer being Sitka Spruce Very little understory exists in the plot and the deep needle dominated humus is filled with woody debris that fUrtlttionsto keep the soil moisture high the closed canopy prevents desiccation
Cantharellus cibarius and Boletus eduis occur in both areas (see Fig 27 for comparison of fruiting seasons) For Cantharellus cibarius the length of the fruiting season is not as long in Lanphere Dunes as it is in Patricks Point State Park In 1992 Cantharellus cibarius dominated the fungal flora in the Park but was conspicuously reduced and almost absent in the Dunes in both areas the environmental conditions were the same
Boletus edulis began to fruit approximately 1 month later in Patricks Point State Park than in Lanphere Dunes In each case the lengths of life span of sporocarps were similar and the number of spores produced by each sporocarp was equally large
Leccinum manzanitae and Armillaria ponderosa occur in Lanphere Dunes the former species is rather rare in the Park while the latter species apparently does not occur at all
Jon8 Jon 13
DcI
I I I I Lanph8ltDune
Doc 14
- _14
I
I
I
I 0lt130 Del
i Sp30 i Sop
Aug30
990 99 Lshy
992 99 _udolis
Dune 992
PoInda PI
I I I
990 99 Cmuh=1las abarius
99
l Polnda PI
Au
Aug1 -
Comparinson of Fruiting Season of Target Species
Patricks Point State Park and Lanphere Dunes
Figure 27
24
FRUITING SEASON OF 1993
During the summer of 1993 two new permanent plots 2 and 3 were established in Patricks Point State Park with the intent of studying sporocarps of Boetusedulis Plot 2 is located southwest of Plot 1 which was established in 1992 It is 1024 m2 and is divided into 256 subplots each subplot is 4 m2 Plot 3 is located approximately 50 yards north of Plot 1 and is composed of324 m2plot 3 is divided in 81 subplots each subplot is 4 m2 The location of all trees and vegetation within each subplot has been surveyed and noted accurately on individual maps The subplots associated vegetation and mushroom sporocarps have been entered into a computer and maps are presently being analyzed and printed during the summer of 1994 Although fruiting of Canthareuscibariuswas noted in mid-May monitoring did not begin until July 25th when the first flush of a nine sporocarps were observed in Plot 1 Monitoring continued until November 7th when nearly all sporocarps were deemed absent from the plots The monitoring protocol was identical to that established during the 1992 season
Sampling occurred from July 25th through November 7th on a weekly basis Eleven individuals from the local community oriented Humboldt Bay Mycological Society volunteered their time once a week during the entire sampling period with their supervision conducted by David Sime from the Humboldt State University mycology laboratory Two individuals from the Mycological Society would sample 4 hours per week and these individuals sampled for 16 weeks In addition two senior students from the Humboldt State University Department of Biological Sciences completed their senior thesis by sampling Plot 1 each of these students sampled 12 of the plot two times a week for 20 weeks Each sampling period lasted 4 hours Therefore this project involved approximately 260 volunteer hours of assistance
In addition the maximum and minimum air temperature and the amount of rainfall was sampled once a week for 52 weeks Finally sporulation studies on Canthareluscibariuswere conducted twice weekly from July 25th until October 24th and prepared slides on which spores were deposited were obtained during the entire life span of 56 sporocarps A total of 3477 slides were obtained during this period and the data is still being analyzed
SPOROCARP STUDIES LIFE SPANS FRUITING SEASON AND SPOROCARP LONGEVITY
Cantharelus cibarius
Observations were obtained on 529 individual sporocarps of Canthareluscibarius In plot 1 observations were made over the entire life span of 335 sporocarps mammal predation accounted for a loss of 73 sporocarps while vandalism claimed 60 In Plot 2 data was obtained over the entire life span of 47 sporocarps only 9 were lost to mammals and 5 to vandals No sporocarps were observed in Plot 3
-
Fruiting Season
The fruiting season of Ccibariusbegan on 24 May 1993 and lasted until 1 Dec 1993 Fruiting was not abundant however until the 27 of June 1993 Of the micrometeorological factors which may affect the beginning of the fruiting season the average minimum air temperature and the amount of rainfall are most important
As the mean minimum air temperature at the soil surface (hereafter indicated by T min) in Plots 1 and 2 increased from 55 in April to 9 degC in June sporocarp production began and thus the fruiting season was initiated The fruiting season continued until the mean minimum air temperature dropped below 9 degC (see Fig 28) Initially the T min climbed in May 1993 from 9 degC to 102-11 degC in August At this time (29 July-II August) only 55 new sporocarps were initiated As the T min dropped to 93 C 214 new sporocarps were observed during the month of September Once the T min began to rise again in mid-September to above 10degC there was a decrease in new Ccibariusprimordia to only 53 produced As such it appears that the mean T min must rise for sporocarp initiation to occur and must reach a critical level of 10 degC for the mycelium to activate large numbers of primordia
The cumulative rainfall for the three months preceding the initiation of the fruiting season was a minimum of 23 cm and a substantial amount ofrain occurred in the month preceding the initiation of fruiting (Fig 29) Rainfall during peak production was less than a centimeter (see Fig 28 31) The fruiting season is initiated during the driest part of the year and sporocarp production occurs when it is not raining heavily An analysis of the data soil moisture (SM) soil temperature (ST)and soil pH did not readily provide an explanation as to any influence on the phenology of Ccibaius However at Relative Humidity of 60 for sporocarps to form and if the Relative Humidity rises to above 90 sporocarp production decreases and eventually ceases (Fig 32)
-r
25
oC
26
24 - - - - - - - - - - - - - - - - - - - - - - - - - - - - - - - - -
22 - - - - - - - - - - - - - ~- - - - 202
20 - - - - - - - - - - - - - - - - - - - - - - shy
2 - - - - - - - - - - - - - - - - - - - - - - - - _ - - - - - - - - - - - avg max
0 temp May July Sept Nov Jan93 Mar May July Sept Nov Jan94 Mar May
Jun Aug Oct Dee Feb Apr June Aug Oct Dee Feb Apr
Figure 28
monthly rain (em) yearly rain (em)
150shy -I -
75 - - yearly rainfall
~ ~ ~ ~ ~- i - ~ -- -y~ ~ ~-- -~- - ~- - -~- ~ -~- -- -- --- ~ ~ 60 - monthly~
--- -- - - _t - 45 rainfall
~ ~~~) ~j ~(t ~ V- ~~~ tLtJt- J~= Y ~~ 30
- - - - 15
0
(Figure 2829 Cantharellus dbarius)
Total Population
As in the 1992 the total number of sporocarps found during the entire fruiting season rose dramatically during the first two months of the season and in 1993 the highest number of sporocarps present at one time reached a peak of 270 sporocarpsfrom October4ththroughthe7th (Fig30)Rain in the amount of 16 cm which occurred on July 23rd appears to be the stimulus to increase the population from 9 sporocarps on July 23rd to 70 sporocarps on August 16th Another 15 cm ofrain which occurred on Aug 16th is the stimulus to increase the number ofsporocarps to 270 on October 4th As in 1992 the majority of sporocarps of Cantharellusdbarius are produced by only 3 cm of rain As the rainfall
26
increased 50 mm (50 cm) the total number ofsporocarps began to decline Therefore as in 1992 an increase of rain after a dry period is the stimulus to start a decline in the total number ofsporocarps (Figure 31)
In 1993 the total number ofsporocarps in Plots 1 and 2 dropped by 97 abruptly after the average maximum air temperature rose to nearly 20degC and remained at this temperature for over one week Between 23-26 October the Relative Humidity dropped more than 50 the Soil Moisture fell over 40 while the average maximum air temperature rose to + 19 degC in the study Plots (Fig 31 32) Once average minimum air temperatures were below 7degC sporocarp formation ceased
number of sporoearpo 300 20
25O~
J15 ~r
200~ 1 ~ ~ ~ ~ ~ 1 ~ t )~~TTgtHlt ~
150 ~ ~ ~ ~ ~ ~j ~ ~ ~ ~ ~ ~ ~ ~ ~ ~ ~ ~ ~ ~
10
~ ~ ~ ~ ~ ~ ~ ~ ~ ~ ~ ~ ~ ~ ~ ~ ~1 ~ ~ 100
plot 2
i plot 1 - tot31] ~-~-n-~Hr-nFH--N~ jun 7 j21 oU9 1 016 330 s6 13 20 oct 1 07 010 01lt 017 021 025 nov 1 n8
j13 jul23 36 326 sep 3 010 017 27 0lt 08 011 015 018 022 029 n5
Figure 30
0 OJm rain (mm) C
70 25 a 65 shy
lt --120 ~
- lt5 i L 1 shy
lt0
35 F--Ut - ~~
~ i ~10 inmm - ~ 1 - ~ j ~ ~ j j j (= ~ ~ ~ ~ j r r~ t ~ ovg m~ 09- max
~ - - - 5 - - - -
jun 7 i21 3U91 316 330 06 013 020 od 1 07 010 01lt 017 021 025 nov 1 n9j13 jul23 06 326 sep 3 010 17 527 0lt 06 011 015 018 022 029 n5
Figure 31
New Sporocarp Production
Throughout the fruiting season new sporocarps are produced in flushes or peaks (Figs 32 33) Relative Humidity seems to affect the number of sporocarps produced during each peak the largest number of new sporocarps produced per flush occurwhenthe relative humidity isbetween60 and 80 Once the relative humidity rises to 90 the number of sporocarps per flush decreases and eventually the number of flushes cease when the relative humidity reaches 100
27
A distinct correlation exists between the production of new flushes and soil moisture and soil temperature New flushes seem to be initiated when the soil moisture rise to or above 30 and the soil temperature rises to near or above 12 dc Each new flush seems to terminate when the soil moisture drops below 30 and the soil temperature drops below 12 dc (Fig 33)
Flushes seen to occur in clusters and each cluster is influenced by the amount of daily rainfall (Fig 33) Rainfall on July 23 influenced the clusters produced up to September 2nd Rainfall on August 26 influenced the clusters produced during the entire month of September
_m ~
----shy
10
rJv J ~Hi~~ y~ f U
30 1 -=1 - rn
- cA - ~ ~ ~ m1 A1lJA 1 -MO
- Oct-Figure33
Life Span
Life span data has to be interpreted carefully since the entire fruiting season ended with the dramatic rise in maximum air temperature during the last week of October During this period the longest life span was 84 days produced by a sporocarp formed in early August and The shortest life span was 11 days produG~d by a sporocarp formed in mid-October the average life span was 465 days
Of the micrometeorological factors affecting length of individuallifespans it was found that as Relative Humidity decreased and Soil Moisture decreased longevity also decreased Contrary to 1992 longest life spans were produced by sporocarps formed early in the fruiting seasons and as the fruiting season progressed the average life span decreased (Fig 3435)
However each month produced long and short life spans July sporocarps lived an average of525 days August 612 days and September 41 days The data on soil pH T soil did not appear to influence longevity
pa0
onde Plot 1 pan n de 0 Plot 2
0 0
10 10
0
0
0
0
20
10
I October rNovember I lt-firstof month last of n1Ofitgt-gt
T 0
w
0
0011
oS 022 0
010015
T
Figure 34 e bo Figure35
-
28
Boletus edulis
Observations on 6 sporocarps were madeS formed in Plot 2 and 1 formed in Plot 3 The fruiting season began on September 2nd about one month earlier than in 1992 However all of the sporocarps were vandalized by commercial or private mushroom pickers Therefore data on the end of fruiting season life span of individual sporocarps and sporulation studies were not available Information on rainfall average maximum air temperature and average minimum air temperature at the time of sporocarp formation is found in Figure 36 Information on Relative Humidity Soil Temperature Soil Moisture and pH for each of the 6 sporocarps observed is found in Table 4
Table 4
date plot mushroom ill Relative Humidity Soil Temperatur Soil Moisture p sep 1 2
sep 15 2 sep 13 2 sep 25 2 oct 28 2
62 55 81 49 81
83 78 62 75 60
14 14 14 12 13
32 30 30 37 5
6 6 6 6 7
oct 29 3 55 81 14 30 6
0 C
25 -- -- ~i~(~m)
20 j ~~ (~-gt-1 ~~ ~~ ~ ~ ~ pound ~ ~) ~lt -- --~~ -- ~
YiHjH~)+PfWHHiH~- 1- -- -- -- -- ---- -- -- -- -- 16 = ------ -- ---- -- -- -- -- -- 8 - - - ~
ISJ mm 1 0 maxtemp 0 m om june 7 j21 july 5 j19 aug 1 a16 a30 6 14 oct 7 014 021 n16 n30
j14 j29 j12 j23 a7 a25 sept 2 10 17 010 017 nov 14 n23
Figure 36
SPORULATION STUDIES
During the four months when sporocarps were found in Plots 1 and 2 data was gathered once a week on the duration and quantity ofbasidiospores discharged in a 24 hour period slides were placed under sporocarps in the morning of one day and gathered at the same time the next day Sporulation data was gathered from a total of 62 sporocarps of Cantharellusdbarius Of these data was obtained for the entire life cycle of 42 sporocarps from Plot 1 and 5 from Plot 2 The remaining 20 sporocarps were consumed by mammals at some point in their development Therefore a total of nearly 700 slides were obtained during this study
Out of 42 life cycles the mean life span was 56 days with sporulation first observed on a mean day of 44 The fungi that received spore measurements started sporulating with a mean Rh of 943 T soil of 136 C and a SM of3094 All fungi had a maximum spore discharge per square centimeter ofhymenophore (gt100000000) at mean Rh of 788 T soil of 144 C and SM of 32 A higher spore load and warmer soil temperatures appear to be correlated
For all 42 sporocarps studied at least 6 different patterns existed during which spores were produced as follows
I number of sporocarps [ when majority of spores are produced during the life span 20 near the end 2 from the middle to the end r 5 at the beginning 7 in the middle 2 from the beginning to the middle 5 over entire life cycle
29
Sporulation for each mushroom will be found in the unfinished graphs located in Appendix A
Some fruiting bodies produced their spores in two to three flushes some all at once while others did not produce more than 500000 spores per square em In a mycorrhizal fungus such as C dbatius basidiospore production may be genetically controlled
Sporulation data is still being analyzed as of this date During the next few months an attempt will be made to determine if sporocarp clustering has an effect on sporulation However the maps on which all sporocarp and vegetation will be located have to be completed
Comparison between 1992 and 1993 Fruiting Seasons
Comparisons of the data collected in 1992 with that of 1993 indicate distinct differences between the two years The fruiting seasons in each year began roughly at the same time however 1992 was a bit later than 1993
Cantharellus dbarius
The fruiting season in 1992 lasted nearly two months longer than in 1993 In 1992 freezing temperature terminated the life span near January 20th whereas in 1993the season was terminated on November 12th due to the week long period ofwarrn weather The initiation of the fruiting season were similar with the season observed to begin on June 7th in 1992 and the season observed to begin near June first in 1993 (see Figure 37) In each year the fruiting season began during a period of dry weather which was preceded by wet weather In each year new sporocarps were formed as long as the cumulative rainfall was kept below 5 em and the largest number ofsporocarps were produced during a time when no to very little rain occurred The termination of the fruiting season began when the relative humidity increased and new rain occurred Therefore it appears that sporocarp formation in Cantharellusdbatius responses to very little rain The stimulus for the initiation of the fruiting season seems to be a low relative humidity near 60 average minimum air temperatures rising from 5 to 9 dc In each year sporocarp formation was more restricted to the southeastern quadrant of plot 1 which has a large amount of buried wood Therefore sporocarp formation seems to respond to moisture found in this woody debris a phenomenon which correlates with the studies of Norvell
- Length of Fruiting Season
8oIlaquou edu
F r-
Jon
Doc
- D Nov2
Cd2
- 5
1992Con_ 993 1992Bou 3 1~3
Figure 37
The highest number of sporocarps found in plot 1 in 1992 was about 105 whereas in 1993the highest number was 267 The patterns of the highest number of sporocarps present at anyone time were similar in 1992 as in 1993 however the abrupt disappearance ofsporocarps in 1993 was caused by the warm weather (see Figure 38) The temperatures in 1993 were warmer and the rainfall less than in 1992 Therefore an increase in sPorocarp numbers during drier weather seems to correlate well with information provided by Norvell (1992) (See Figure 41)
New sporocarps were produced in flushes in both 1992 and 1993 However the number of flushes were about 3
times more in 1993 than in 1992 Interesting the highest number of new sporocarps produced per flush were equal in 1992 asin 1993(see Figure 39)
The pattern oflife spans were very different in 1992than in 1993 (See Fig 40) In 1992 the longest life spans were produced towards the middle and the end of the fruiting season however all parts of the fruiting season produced sporocarps with different lengths oflife span In 1993 the longest life spans were produced in the beginning of the fruiting
30
season and the average life span length was reduced as the fruiting season progressed However the longest life span shortest life span and average life spans were nearly identical in 1992 as in 1993 (see Table 5)
lifespan of individual sporocarps total number of highestnumber of sporocarps sporocarpsat anyone
longest shortest average observedin plot 1 time in v10t1 1992 92 I 10 I 44 364 105 1993 84 I 11 I 465 454 267
Sporulation patterns for the two years did correlate with maximum spore output for Relative Humidity Soil Moisture and Soil Temperature In 1992the Relative Humidity was 90 the Soil Moisture was 316 and the Soil Temperature was 143 C In 1993 the Relative Humidity was 878 the Soil Moisture was 32 and the Soil Temperature was 144 C Sporocarps growing only in bryophytes and those growing in woody debris need to be compared for sporulation patterns
~ 20
num ps
100
20 90
80 70 so 60 50
30 20 a 10
o~812
911 1011 1111
dol
1211 111 111
--- ~-- wJ
1 0I 1 yen~ _NO
ca
--19931992
Firgure 38
numfnowpongtc35 ~ ~
30r 29 r
20 21
20
15 10
0 A2 -
28 3
1992 199J Figure 39
31
IIr benln
Ipanon 9
Plot 1
numpY100
80
90 7
80
7
50
30 -20 T
pC to3 -- - on gtOd3 _0 1
1992 1993
Figure 40
+Figure 41
~~(=I
1U c
55
OJ In em
55 25
~
20
t5 v
1
- t
1 r -
s JO
- ~
i
12 -
- - momb moxmp
---~
~ It l - (bX)
3 t5 oct 04 011 0 029 n2 n19 023 n29 6 d26 1
19 m (02) 08 (01)(25)nov1 n nt5 n22 n25 2 2 9 jan4 0
5r~T OJn
c 13 ~ocT7 i ~~ I-ro18 s s
-
1992 1993
-shyem
50 135 120 105 90 30
plOt2 1992-1993
-pIot1 1992- 993
shy ~
)un A ope oct
nov
Jen
reo m br may
-plot199
Comparison of rain fall plot 1 and plot 2
32
Literature Cited
Bengston D 1993a Letter to the California Native Plant Society expressing concerns about the Harvesting of Wild Mushrooms County of Mendocino Department of Agriculture Agricultural Commissioner
Bengston David 1993b Subject Commercial Mushroom Industry Informational Memo Memorandum dated 18 March 1993 sent the supervisors of the County of Mendocino County of Mendocino Department of Agriculture Agricultural Commissioner
Cherfas J 1991 Disappearing Mushrooms Another Mass Extinction Science 254 1458
Fischer C Molina R Amaranthus M Luoma D L and J Trappe 1993 Productivity and Ecological Habitat of Matsutake Mushroom in the Chemult Ranger District Winema National Forest and the Illinois Valley Ranger District Siskiyou National Forest Research plan circulated to the various ranger districts in northern California and the pacific Northwest
Largent David L 1991 General Research Plan for the study of Armillaria ponderosa Submitted to and accepted by The Six Rivers National Forest Orleans District
Lizon Pavel 1993 Decline of Macrofungi in Europe An Overview Contributed paper presented to the 14th Annual Mid-Atlantic States Mycology Conference Duke University Durham NC April 17 1993
Millar C Cheng S Creasy M Largent D L and R Richards 1993 Environmental and Social Impact Analysis of Mushroom Harvesting Assessing the Sustainability of the Matsutake Mushroom on the Klamath National Forest Research Proposal submitted to the Klamath National Forest
Molina R ODell T Luoma D Amaranthus M Castellano M and K Russell 1993 Biology Ecology and Social Aspects of Wild Edible Mushrooms in the ForestS of the Pacific Northwest A Preface to Managing Commercial Harvest VSDA Gen Tech Report PNW-GTR-309 ~~
Norvell Lorelei 1992 The Oregon Cantharellus Study Project Mushroom harvesting and chanterelle productivity in Oregonua preliminary report
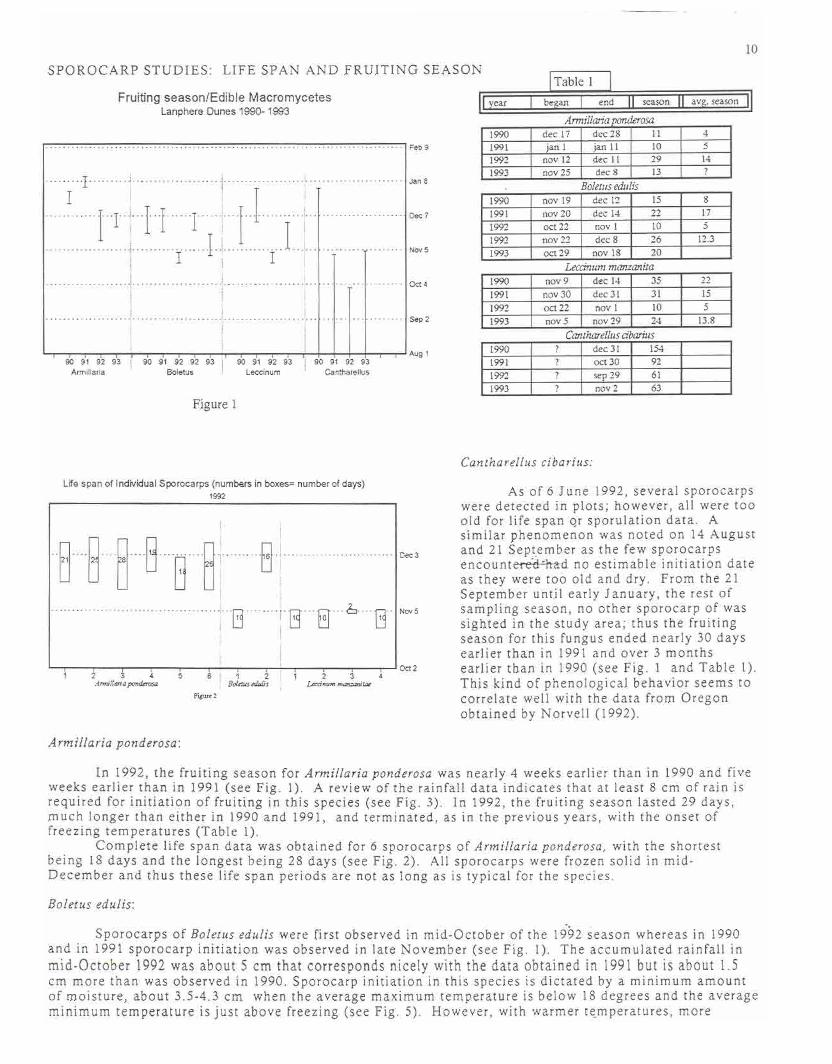

15
Boipoundtus edulisso
f8 In Boletus eduis sporulation occurred steadily as ea the fungus developed (see Figs 9 10) Eventually 8 sporulation decreased and even ceased as the sporocarp 1E8 aged As in previous seasons sporocarps of this species ~os produced large numbers of spores over their entire life
span with the majority of spore being produced in the f8
middle of the life span Although no sporulation 8 lIE
studies were completed for Leccinum manzanitae 4 lIE previous studies indicate the pattern is similar to that of
0023oa2S4 010 oa23 p8 M 0 oa23 0028 4 oa23 0028
Boletus eduis (see Fig 11) oa25 oa25 13 125 010 0
18 21 18Fig 9
Boletus edulis
1m po Leccinum manzanirae po
---Be8 81E8lIE
2E8
63E8
50e8 4 lIE4E8
4SE8
SEa
1E8 25e8
~ noy 22 noy 27 nov30 doc 13 28 - laquo4 do d _n - _8 0laquo1 0lt13 21 900- 16
Fg0 -1--
STUDY PERIOD SEASON OF 1993
The mushroom research at Lanphere Dunes Preserve was performed on a semiweekly basis from September 10 1993to January 9 1994 Seventy-nine 2-meter diameter plots were monitored on Tuesday and Friday of each week for appearance of any of the four target species Leccinum manzanitae Cantharellus cibarius Armillaria ponderosa (Tricholoma magnivelare) and Boletus eduis
When a sporocarp was detected in a plot it was monitored twice weeklythroughout its entire lifespan Monitoring consisted of measuring and recording soil pH and moisture content using a Kelway soil tester soil
temperature at a depth of7 to 9 cm using an Ertco soil thermometer and relative humidity and air temperature using a VWR digital humidity and temperature meter Each semiweekly visit induded monitoring four weather stations in different locations in the Preserve Each station was equipped with a rain gauge and a Taylor maximumminimum thermometer
WEATHER (see Figures 12-17)
In 1993rainfall during the monitoring period totaled 1273cm which makes it the second driest season since this studybegan in 1990 The 1993season was dry and warm with the total accumulated rainfall pattern and the maximum temperaturepattern being similar to those of the 1991season The average minimum temperature pattern on the other hand was unique
The 1990season was cold and wet the 1992season was wet and warm and the 1991and 1993seasons were dry and warm
-
16
Cumulative Rainfall (Figure 12) ~ Trend (Figure 13)
em 35
iz 30 I
28 I I 23j34
25
2~J 20 I
I 15 1P21421
1U I 1231~3 - 105w1I2
10 W~
51 54 01 02 03 04 N1 N2 N3 N4 01 02 03 D4 J1 J2 J3 J4
Minimum Air Temperature (Figure 14)0C
25
20
15
10
~lt-- ~-~- - --~v--- ~- gt
-- -5
0 51 54 01 02 03 N1 N2 N3 N4 01 02 03 D4 J1 J2 J3 J4
Maximum Air Temperature (Figure 16)
0 C
25
20
15
10
I
51 54 01 02 03 N1 N2 N3 N4 Of 02 00 D4 J1 J2 J3 J4
om 35
30
shy25 -
- 20
f5
1993 10 shy
- 1992
1991
1990 ~ 54 ~ ~ ~ ~ ~ ~ ~ ~ ~ ~ 00 D4 n J2 J3 J4
~ Trend (Figure 15)
c
25
20 --- -- shy
- - - - - -
--
- -- -
10 shy
1993[ 1 L --- lt
-s -1
-10 0 51 S4 01 02 03 N1 N N3 N4 01 02 03 04 JI J2 J3 J4
~ Trend (Figure 17)
0 C
25
- - --20 - 15
10
~ ~~~L~t~-~--~ c ~~ -~- -~-~~
051 54 01 02 03 N1 N2 N3 N4 01 D2 D3 D4 J1 J2 J3 J4
17
LIFE SPAN AND FRUITING SEASON
Among the four target species studied there was a distinct pattern of fruiting among all four of the target species
Cantharellusdbarius (Figures 14 Table 1)
Cantharellus dbarius began fruiting before our study started and continued fruiting until day 63 of the study Fifteensporocarps from seven different plots were recorded The average lifespan for a Cantharellusdbarius fruiting body was 1425 days
The fruiting season of sporocarps was 63 days the longest of all the target species and began during the summer when the rainfall was below a centimeter similar to the season found in Patricks Point State Pink The season ended when rainfall began to increase a pattern similar to that in Patricks Point State Park The 1993 season was similar in length and in pattern to that of 1991
The four environmental factors recorded at initial sporocarp observation averaged as follows
Average soil temperature 149degCAverage soil pH 698Average soil moisture 946Average relative humidity 728
At Cantharellus dbarius fruiting body death the averages of the environmental factors recorded were
Average soil temperature 124degCAverage soil pH 697Average soil moisture 51Average relative humidity 672
Armillariaponderosa (Figures 1 3 Table 1)
Armillariaponderosa(=Tricholomamagnivelare)was observed in two plots with a total of two sporocarps recorded Fruiting season for this species was the shortest of those studied beginning on November 25th and ending on December 8th
The life span was 13days and as in previous years the fruiting season was abruptly terminated by freezing temperatures Fruiting was initiated when the average maximum temperature dropped below 15degC and the average minimum temperature was near freezing A distinct correlation existsbetween the beginning of the fruiting season and the differencebetween average maximum temperature and average minimum temperature fruiting seems to begin when the temperature difference is at least 15 degC a pattern which appears each season over the last 4 years -
At the beginning of button stage for this species the environmental factors aver~
Average soil temperature 94 degCAverage soil pH 615Average soil moisture 1000Average relative humidity 8145
At fruiting body death the observed averages for environmental factors were
Average soil temperature 108degCAverage soil pH 61Average soil moisture 425Average relative humidity 8955
Boletus edulis (Figures 15 Table 1)
Boletuseduliswas not observed in any of the designated plots but was found at different locations in the Preserve Sporocarp-related data was not recorded for Boletusedulissince it did not appear in marked plots however beginning and end of fruiting season was noted The fruiting season for this species went from October 29 to November 18
Sporocarps of Boletusedulishad a fruitingseason of 20 days similar to in length to that found during the 1991and 1992 seasons and similar in length to that of Leccinwnmanzanitae
A pattern has developed over the past 4 years with the fruiting season beginning when the rainfall reaches at least 275 em in dry years 1991and 1993and when the rainfall reaches 5 em in wet years 1990and 1992
Fruiting ended when rainfall abruptly increased and the average minimum temperature dropped This pattern was similar to that found in previous years and suggests that the combination of increased soil moisture and spil temperature cause the termination of fruiting and the minimum temperature dropped near or below freezing
lecctnwn manzanltae (Figures 16 Table 1)
Lecdnum manzanitae was observed in four plots and seven sporocarps were recorded Fruiting season began on November 5th and continued until November 29th The average lifespan of a Lecdnum sporocarp was 138 daysshy
18
------
The fruiting season lasted 24 days similar to that of Boletusedulis Fruiting is initiated in dry years when the rainfall nears 3-5cm and in wet years when the rainfall nears 5 cm As in Boletus
edulisfruiting is terminated when the rainfall increases and the average minimum temperature drops to near 0 degc
The average environmental factors calculated for when fruiting began for Lecdnum manzanitae were
Average soil temperature 64 degC Average soil pH 643 Average soil moisture 15 Average relative humidity 825
When Lecdnum manzanitae fruiting body death occurred the observed averages were
Average soil temperature 90 degCAverage soil pH 646Average soil moisture 252Average relative humidity 761
-
- --- -
19 Location Patricks Point State Park near Trinidad California
BACKGROUND
Patricks Point State Park is located about 20 miles north of Humboldt State University on the Pacific coast near Trinidad California The study area is dominated by Pacific Hemlock (Tsuga heteropylla) and Sitka Spruce (Picea sitchensis) This site was added to the project in the 1992 season through the cooperation of the North Coast Red woods District of the California Parks and Recreation Department This is a popular and easily accessible park and a favorite site for mushroom pickers Picking mushrooms is prohibited in the park but proximity to good roads and uncontrolled accesses through unfenced boundaries make it easy for pickers to get in and out quickly
STUDY PERIOD SEASON OF 1992
During the summer of 1992 a permanent plot of 1024 square meters was established in Patricks Point State Park This plot was divided into 256 subplots of four square meters each The location of all trees and vegetation within each subplot was surveyed and noted accurately on individual maps (See Figure 7 for a sketch map of the entire plot) Monitoring of the subplots began on August 24 1992 however sporocarps of Cantharellus cibarius were observed in mid-June before the permanent plot was established Each monitoring visit involved the following once it was established a target species was fruiting in a subplot the sporocarp was assigned an identification number the date and developmental stage were noted (ie button or mature) and the subplot number recorded In addition relative humidity soil temperature soil pH and soil moisture content were recorded for each subplot in which sporocarps were observed Furthermore sporocarps of other epigeous fungi were noted which will provide information on indicator species
Sampling occurred from late August 1992 through March 1993 Ten individuals from the Humboldt Bay Mycological Society (HBMS) volunteered their time for the entire sampling period with their supervision conducted by David Sime from the Humboldt State University mycology laboratory Two individuals were used during each of the twice weekly sampling periods that lasted from 4-6 hours therefore this project involved approximately 450 volunteer hours of assistance
In addition life span and sporulation data were obtained twice weekly for Cantharellus cibarius by placing microscope slides under the hymenium of the sporocarps in the morninglt and leaving in place for 24 hours Volunteers were not used for this aspect of the study
Sampling methods for Boletus edulis were different from methods for Cantharellus cibarius Thirty 2x2 meter plots were established in Abalone campground during nine samplIng -dates during November and December Each plot was located around a group of sporocarps deemed fruiting from the same mycelium Relative humidity soil temperature soil pH and soil moisture content were recorded for each of the plots Life span and sporulation data were also obtained Volunteers were not used for the studies on Boletus edulis
Vandalism by recreational and commercial mushroom pickers was reduced in the permanent plot by posting easily visible iridescent signs and painting the sporocarps to indicate their potential uselessness for harvesting purposes However all of the sporocarps located outside the permanent plot were either harvested by recreational or commercial mushroom pickers or were eaten by various mammals
Overall observations for 364 sporocarps of Cantharellus cibarius were recorded with a majority of the sporocarps located in the southeastern quarter of the permanent plot (see Fig 18) Because of mammal predation and commercial or recreational mushroom harvesting 232 sporocarps were lost thus complete life span and environmental data were obtained for 132 sporocarps Furthermore 163 microscope slides for spore collections were placed and collected from 12 different sporocarps of Cantharellus cibarius over their complete life span
Observations on 30 different Boletus edulis sporocarps yielded only two complete life cycles however all Boletus edulis sporocarps were lost from intense commercial or recreational mushroom harvesting
Weather data from May until the projects inception on 24 August was provided by Virginia Waters (HBMS) after August 24 weather data was recorded in the permanent plot on a continuing basis
SPOROCARP STUDIES LIFE SPANS SEASON AND SPOROCARP LONGEVITY
Cantharellus cibarius
As early as June 7 a few scattered sporocarps were observed in Patrick5 Point State Park however all of these were outside the permanent plot Initiation of a large number of new sporocarps began in the plot on August 24 most probably the result of accumulation of moisture from fog drip that was retained in the woody debris and correlated with gentle drop in the air temperature From the August 24 until October 21 new sporocarps were produced in a series of flushes a phenomenon similar to that found in the Oregon studies (Norvell 1992) The stimulus for each flush seems to be a rise in both the average maximum and
average minimum air temperatures The largest numbers of new sporocarps were produced during the month of September when only 025 cm of rain occurred and the average maximum temperature was above 15 degrees and the average minimum temperature did not drop below 10 degrees (Fig 1921) As the minimum temperature dropped below 15 degrees there was an abrupt reduction of sporocarp initiation particularly in the months of November and December (Fig 20 21)
As a general trend the number of new sporocarps produced as well as the total number of sporocarps decreased steadily as the accumulated rainfall rose and both the maximum and minimum temperatures dropped (see Fig 192021)
numblaquo fnow -
35 35
30 29 30t I 11
2S 25 yen
2020
I15 15 i
10shyr ~
11 ~ ~ ~ 0 0
Au24SltoltI 457911 19 24 0lt12 911 19 30 11 Doc2 Au24 $opt 1 4 5 7 9 11 19 24 0lt12 9 11 19 30 11 Doc2 29 3 14 20 29 4 14 21 Nov10 1929 3 14 20 29 4 14 21 Nov10 19
TrendNumber of New Sporocarps
Figure 19 (Canthpoundzrellusdbarius)
numbolt d 0C8Ip$
100 100 =~ 90 90 90 -so70 -70 so ~
6O~ so soF 40 40 30 3020 20 10
tor -~ 0
9124 11i 211 0
91 ICY1 11 t19 9124 91 101
111 121 11 119
do
Total Number of New Sporocarps Trend
Figure 20 (Canthpoundzrellusdbaius)
nlnn m C
15 40 15
r 36 i 10 - 31 - - 28 I ( ---_ t51 - _J 1 --
I 10
- -~-~-- ~10 to to - ~
t1 mootomp
- - mtom
~ j f - ~~~~ 0 (t)C5) no 11 01 oS n12 ntO0130 dt to J~ ~ ~ ~ ~ ~ ~ ~ ~ ~ r~l~ to If15Jnot o n15 n11n15 dtl dt () c 01 0 11 01 19 n5 oil 0 013 0 05
II=mOltII 3 9 nl n15 n22 n25 12 112 119 0 21 102101 1014)10251 nl 14
Trend Rainfall Maximum and Minimum Temperatures
Figure 21 (Canthpoundzrellusdbarius)
21
The mid-point for the fruiting season was around October 1 with the maximum number of sporocarps being found from the first week of September through the second week of October (see Fig 20) The total number of sporocarps reached zero in January when minimum temperatures dropped below 33 degrees Thus the fruiting season for Cantharellus dominated stands in Patricks Point State Park lasted 152 days within the permanent plot (see Fig 24) and approximately 227 days within the entire park When rainfall reached nearly 20 cm in December new sporocarp production ceased (Fig 1921)
Complete life span data was obtained for 132 sporocarps of Ca1Jtharellus cibarius with the shortest being 10 days the longest 92 days the average life span was 44 days The largest number of sporocarps had a life span of 58 or 40 or 21 days (see Fig 22)
On the average sporocarp longevity per number of sporocarps produced for Cantharellus cibarius increased each month beginning in September and ending in December (Fig 23) However September had the longest lived sporocarps with seven sporocarps living up to or past 80 days Analysis of the data on rainfall and air temperature did not readily provide an explanation and thus this characteristic could possibly be genetically controlled or related to host intervention
nu- _0000 HI_n in 11 numbo 1 doyo
100
10 90 - -- - -- - - -- - -- - - - -
1[tJ 90 -- -
1111 so 5 - -4-
1IiI 10
92 90 84 78 74 68 84 62 eo sa sa 54 52 SO48 46 44 42 40 38 35 31 29 26 24 21 16 10 1 Sopt 30 gtOc13 N 1 91 95 80 77 72 66 63 61 58 57 55 53 51 49 47 45 43 41 39 38 33 30 28 25 23 18 5 00lt1
to n in dyo
Number of Sporocarps and their life span Life Span of Individual Sporocarps related to the beginning of furiting
Figure 22 Figure 23
PH SOIL MOISTURE SOIL TEMPERATURE RELATIVE HUMIDITY
Cantharellus cibarius
In Cantharellus cibarius sporocarp initiation within most of the subplots is related to a decided rise in soil moisture after a period of relative dryness and in most instances with an accompanying rise in soil temperature in almost all instances the relative humidity is less than 100 The death of the sporocarp seems to be correlated with a distinct drop in soil moisture after a prolonged period of rather wet soil The pH of the soil seems to have no bearing on sporocarp initiation or cessation Generally sporocarps of Cantharellus seem to be found in econiches that have pH above 65
-
22
J20
Boletus eduis
Initiation of Boletus eduis sporocarps began the third week in November and lasted about three weeks (Fig 24) Apparently an accumulation of at least 10 cm of rain was necessary for sporocarps to begin to form Sporocarps of Boletus also seem to prefer sites with a pH of between 60 and 65 (Fig 25)
-
Ian ~ ~JJ1J ~ ~
7 I
I I r--- III I
II ~
D I I ~ t I I r_14
II i ~~~ I~gt (~ o~ 0-2 50 I I
~ - ~J J 0
-Cd2 ~
--shyrP63 Sop
Aug25 50 ~m
cn1lM 80
pH Relative Humbidity Soil Temperature Soil Moisture
Fruiting Season 1992 4 plots partical life span for Boletus eduis
Figure 24 Figure 25
SPORULATION STUDIES
During the four months when sporocarps were observed data was gathered on the duration and time of sporulation for each of the two target species Spores were obtained by placing microscope slides in metal holders (spore traps) under the hymenium of a viable fruiting body Once Deuteromycetes overtook the sporocarp or the hymenophore collapsed the fruiting body was considered dead Spore traps were left out for a period of 24 hours and were collected twice a week Spores were counted on thirty 1 micron grids for 163 micro slides for a total of 4890 spore measurements
Micro slides were collected twice weekly over the entire life spari~of 12 different sporocarps of Cantharelus cibarius Distinctly different patterns of sporulation were observed (see Fig 26) In general sporocarps of Cantharelus cibarius produce far less spores per day than any other of the edible mushrooms studied with 10 of 12 sporocarps having less than 1000000 spores per square centimeter of hymenophore produced per 24-hour period Maximum spore production during the life span of a sporocarp of Cantharelus is dependent on a rise in soil moisture accompanied by a distinct rise to near or at 100 relative humidity and these conditions must be preceded by a period in which the soil moisture and the relative humidity had dropped
4E6
4E64E6
3E6
2E6
2E6
2E6
1E6
5E5 r
14 days 50 days 50 days 66 days 58 days 48 days30 days 14 days 50 days 28 days 40 days 38 days
Spore production for 12 different sporocarps of Cantharellus cibarius
Figure 26
0
23
BIOMASS STUDIES OF CANTHARELLUS CIBARIUS
Pileus diameters and diameters of the stipe apex were recorded for 81 sporocarps of Cantharellus cibarius over a ten-week period Thirty-one of the sporocarps were located within the permanent plots and 50 were located outside the plot All of the sporocarps outside the plot were harvested in the same manner and fresh and dry weight recorded for each Age classifications were established for all 81 sporocarps
Preliminary Results
Of the 31 sporocarps studied within the plots 20 were lost due to some type of vandalism Complete data was recorded for the remaining 11 sporocarps over their entire life span Thus correlation of biomass with life span and with environmental data should be possible
Results indicate that biomass increases in direct proportion to the pileus diameter as well as to the stipe diameter It would appear that it may be possible to determine biomass from measuring sporocarp diameter However the data has to be analyzed
INDICATOR SPECIES
Observations of the fungal flora indicate that Chroogomphus tomentosus may be the indicator species for sporocarp initiation of Cantharellus cibarius in late-October and Tricholoma inamoenum may be the indicator species for initiation of fruiting of Boletus eduis
COMPARISON BETWEEN LANPHERE DUNES AND PATRICKS POINT STATE PARK
Lanphere Dunes is located approximately 20 miles south of Patricks Point State Park and is a sandshydune ecosystem All of the plots are located in a Lodgepole-pine dominated ecosystem with Huckleberry and Dwarf Manzanita being the dominant understory shrubs The Preserve is dominated by various completely open areas in which sandy soils are densely covered with mosses and lichens that retain moisture and thus prevent desiccation
The permanent plots established in Patricks Point State Park are dominated by large conifers in a closed canopy stand with the dominant conifer being Sitka Spruce Very little understory exists in the plot and the deep needle dominated humus is filled with woody debris that fUrtlttionsto keep the soil moisture high the closed canopy prevents desiccation
Cantharellus cibarius and Boletus eduis occur in both areas (see Fig 27 for comparison of fruiting seasons) For Cantharellus cibarius the length of the fruiting season is not as long in Lanphere Dunes as it is in Patricks Point State Park In 1992 Cantharellus cibarius dominated the fungal flora in the Park but was conspicuously reduced and almost absent in the Dunes in both areas the environmental conditions were the same
Boletus edulis began to fruit approximately 1 month later in Patricks Point State Park than in Lanphere Dunes In each case the lengths of life span of sporocarps were similar and the number of spores produced by each sporocarp was equally large
Leccinum manzanitae and Armillaria ponderosa occur in Lanphere Dunes the former species is rather rare in the Park while the latter species apparently does not occur at all
Jon8 Jon 13
DcI
I I I I Lanph8ltDune
Doc 14
- _14
I
I
I
I 0lt130 Del
i Sp30 i Sop
Aug30
990 99 Lshy
992 99 _udolis
Dune 992
PoInda PI
I I I
990 99 Cmuh=1las abarius
99
l Polnda PI
Au
Aug1 -
Comparinson of Fruiting Season of Target Species
Patricks Point State Park and Lanphere Dunes
Figure 27
24
FRUITING SEASON OF 1993
During the summer of 1993 two new permanent plots 2 and 3 were established in Patricks Point State Park with the intent of studying sporocarps of Boetusedulis Plot 2 is located southwest of Plot 1 which was established in 1992 It is 1024 m2 and is divided into 256 subplots each subplot is 4 m2 Plot 3 is located approximately 50 yards north of Plot 1 and is composed of324 m2plot 3 is divided in 81 subplots each subplot is 4 m2 The location of all trees and vegetation within each subplot has been surveyed and noted accurately on individual maps The subplots associated vegetation and mushroom sporocarps have been entered into a computer and maps are presently being analyzed and printed during the summer of 1994 Although fruiting of Canthareuscibariuswas noted in mid-May monitoring did not begin until July 25th when the first flush of a nine sporocarps were observed in Plot 1 Monitoring continued until November 7th when nearly all sporocarps were deemed absent from the plots The monitoring protocol was identical to that established during the 1992 season
Sampling occurred from July 25th through November 7th on a weekly basis Eleven individuals from the local community oriented Humboldt Bay Mycological Society volunteered their time once a week during the entire sampling period with their supervision conducted by David Sime from the Humboldt State University mycology laboratory Two individuals from the Mycological Society would sample 4 hours per week and these individuals sampled for 16 weeks In addition two senior students from the Humboldt State University Department of Biological Sciences completed their senior thesis by sampling Plot 1 each of these students sampled 12 of the plot two times a week for 20 weeks Each sampling period lasted 4 hours Therefore this project involved approximately 260 volunteer hours of assistance
In addition the maximum and minimum air temperature and the amount of rainfall was sampled once a week for 52 weeks Finally sporulation studies on Canthareluscibariuswere conducted twice weekly from July 25th until October 24th and prepared slides on which spores were deposited were obtained during the entire life span of 56 sporocarps A total of 3477 slides were obtained during this period and the data is still being analyzed
SPOROCARP STUDIES LIFE SPANS FRUITING SEASON AND SPOROCARP LONGEVITY
Cantharelus cibarius
Observations were obtained on 529 individual sporocarps of Canthareluscibarius In plot 1 observations were made over the entire life span of 335 sporocarps mammal predation accounted for a loss of 73 sporocarps while vandalism claimed 60 In Plot 2 data was obtained over the entire life span of 47 sporocarps only 9 were lost to mammals and 5 to vandals No sporocarps were observed in Plot 3
-
Fruiting Season
The fruiting season of Ccibariusbegan on 24 May 1993 and lasted until 1 Dec 1993 Fruiting was not abundant however until the 27 of June 1993 Of the micrometeorological factors which may affect the beginning of the fruiting season the average minimum air temperature and the amount of rainfall are most important
As the mean minimum air temperature at the soil surface (hereafter indicated by T min) in Plots 1 and 2 increased from 55 in April to 9 degC in June sporocarp production began and thus the fruiting season was initiated The fruiting season continued until the mean minimum air temperature dropped below 9 degC (see Fig 28) Initially the T min climbed in May 1993 from 9 degC to 102-11 degC in August At this time (29 July-II August) only 55 new sporocarps were initiated As the T min dropped to 93 C 214 new sporocarps were observed during the month of September Once the T min began to rise again in mid-September to above 10degC there was a decrease in new Ccibariusprimordia to only 53 produced As such it appears that the mean T min must rise for sporocarp initiation to occur and must reach a critical level of 10 degC for the mycelium to activate large numbers of primordia
The cumulative rainfall for the three months preceding the initiation of the fruiting season was a minimum of 23 cm and a substantial amount ofrain occurred in the month preceding the initiation of fruiting (Fig 29) Rainfall during peak production was less than a centimeter (see Fig 28 31) The fruiting season is initiated during the driest part of the year and sporocarp production occurs when it is not raining heavily An analysis of the data soil moisture (SM) soil temperature (ST)and soil pH did not readily provide an explanation as to any influence on the phenology of Ccibaius However at Relative Humidity of 60 for sporocarps to form and if the Relative Humidity rises to above 90 sporocarp production decreases and eventually ceases (Fig 32)
-r
25
oC
26
24 - - - - - - - - - - - - - - - - - - - - - - - - - - - - - - - - -
22 - - - - - - - - - - - - - ~- - - - 202
20 - - - - - - - - - - - - - - - - - - - - - - shy
2 - - - - - - - - - - - - - - - - - - - - - - - - _ - - - - - - - - - - - avg max
0 temp May July Sept Nov Jan93 Mar May July Sept Nov Jan94 Mar May
Jun Aug Oct Dee Feb Apr June Aug Oct Dee Feb Apr
Figure 28
monthly rain (em) yearly rain (em)
150shy -I -
75 - - yearly rainfall
~ ~ ~ ~ ~- i - ~ -- -y~ ~ ~-- -~- - ~- - -~- ~ -~- -- -- --- ~ ~ 60 - monthly~
--- -- - - _t - 45 rainfall
~ ~~~) ~j ~(t ~ V- ~~~ tLtJt- J~= Y ~~ 30
- - - - 15
0
(Figure 2829 Cantharellus dbarius)
Total Population
As in the 1992 the total number of sporocarps found during the entire fruiting season rose dramatically during the first two months of the season and in 1993 the highest number of sporocarps present at one time reached a peak of 270 sporocarpsfrom October4ththroughthe7th (Fig30)Rain in the amount of 16 cm which occurred on July 23rd appears to be the stimulus to increase the population from 9 sporocarps on July 23rd to 70 sporocarps on August 16th Another 15 cm ofrain which occurred on Aug 16th is the stimulus to increase the number ofsporocarps to 270 on October 4th As in 1992 the majority of sporocarps of Cantharellusdbarius are produced by only 3 cm of rain As the rainfall
26
increased 50 mm (50 cm) the total number ofsporocarps began to decline Therefore as in 1992 an increase of rain after a dry period is the stimulus to start a decline in the total number ofsporocarps (Figure 31)
In 1993 the total number ofsporocarps in Plots 1 and 2 dropped by 97 abruptly after the average maximum air temperature rose to nearly 20degC and remained at this temperature for over one week Between 23-26 October the Relative Humidity dropped more than 50 the Soil Moisture fell over 40 while the average maximum air temperature rose to + 19 degC in the study Plots (Fig 31 32) Once average minimum air temperatures were below 7degC sporocarp formation ceased
number of sporoearpo 300 20
25O~
J15 ~r
200~ 1 ~ ~ ~ ~ ~ 1 ~ t )~~TTgtHlt ~
150 ~ ~ ~ ~ ~ ~j ~ ~ ~ ~ ~ ~ ~ ~ ~ ~ ~ ~ ~ ~
10
~ ~ ~ ~ ~ ~ ~ ~ ~ ~ ~ ~ ~ ~ ~ ~ ~1 ~ ~ 100
plot 2
i plot 1 - tot31] ~-~-n-~Hr-nFH--N~ jun 7 j21 oU9 1 016 330 s6 13 20 oct 1 07 010 01lt 017 021 025 nov 1 n8
j13 jul23 36 326 sep 3 010 017 27 0lt 08 011 015 018 022 029 n5
Figure 30
0 OJm rain (mm) C
70 25 a 65 shy
lt --120 ~
- lt5 i L 1 shy
lt0
35 F--Ut - ~~
~ i ~10 inmm - ~ 1 - ~ j ~ ~ j j j (= ~ ~ ~ ~ j r r~ t ~ ovg m~ 09- max
~ - - - 5 - - - -
jun 7 i21 3U91 316 330 06 013 020 od 1 07 010 01lt 017 021 025 nov 1 n9j13 jul23 06 326 sep 3 010 17 527 0lt 06 011 015 018 022 029 n5
Figure 31
New Sporocarp Production
Throughout the fruiting season new sporocarps are produced in flushes or peaks (Figs 32 33) Relative Humidity seems to affect the number of sporocarps produced during each peak the largest number of new sporocarps produced per flush occurwhenthe relative humidity isbetween60 and 80 Once the relative humidity rises to 90 the number of sporocarps per flush decreases and eventually the number of flushes cease when the relative humidity reaches 100
27
A distinct correlation exists between the production of new flushes and soil moisture and soil temperature New flushes seem to be initiated when the soil moisture rise to or above 30 and the soil temperature rises to near or above 12 dc Each new flush seems to terminate when the soil moisture drops below 30 and the soil temperature drops below 12 dc (Fig 33)
Flushes seen to occur in clusters and each cluster is influenced by the amount of daily rainfall (Fig 33) Rainfall on July 23 influenced the clusters produced up to September 2nd Rainfall on August 26 influenced the clusters produced during the entire month of September
_m ~
----shy
10
rJv J ~Hi~~ y~ f U
30 1 -=1 - rn
- cA - ~ ~ ~ m1 A1lJA 1 -MO
- Oct-Figure33
Life Span
Life span data has to be interpreted carefully since the entire fruiting season ended with the dramatic rise in maximum air temperature during the last week of October During this period the longest life span was 84 days produced by a sporocarp formed in early August and The shortest life span was 11 days produG~d by a sporocarp formed in mid-October the average life span was 465 days
Of the micrometeorological factors affecting length of individuallifespans it was found that as Relative Humidity decreased and Soil Moisture decreased longevity also decreased Contrary to 1992 longest life spans were produced by sporocarps formed early in the fruiting seasons and as the fruiting season progressed the average life span decreased (Fig 3435)
However each month produced long and short life spans July sporocarps lived an average of525 days August 612 days and September 41 days The data on soil pH T soil did not appear to influence longevity
pa0
onde Plot 1 pan n de 0 Plot 2
0 0
10 10
0
0
0
0
20
10
I October rNovember I lt-firstof month last of n1Ofitgt-gt
T 0
w
0
0011
oS 022 0
010015
T
Figure 34 e bo Figure35
-
28
Boletus edulis
Observations on 6 sporocarps were madeS formed in Plot 2 and 1 formed in Plot 3 The fruiting season began on September 2nd about one month earlier than in 1992 However all of the sporocarps were vandalized by commercial or private mushroom pickers Therefore data on the end of fruiting season life span of individual sporocarps and sporulation studies were not available Information on rainfall average maximum air temperature and average minimum air temperature at the time of sporocarp formation is found in Figure 36 Information on Relative Humidity Soil Temperature Soil Moisture and pH for each of the 6 sporocarps observed is found in Table 4
Table 4
date plot mushroom ill Relative Humidity Soil Temperatur Soil Moisture p sep 1 2
sep 15 2 sep 13 2 sep 25 2 oct 28 2
62 55 81 49 81
83 78 62 75 60
14 14 14 12 13
32 30 30 37 5
6 6 6 6 7
oct 29 3 55 81 14 30 6
0 C
25 -- -- ~i~(~m)
20 j ~~ (~-gt-1 ~~ ~~ ~ ~ ~ pound ~ ~) ~lt -- --~~ -- ~
YiHjH~)+PfWHHiH~- 1- -- -- -- -- ---- -- -- -- -- 16 = ------ -- ---- -- -- -- -- -- 8 - - - ~
ISJ mm 1 0 maxtemp 0 m om june 7 j21 july 5 j19 aug 1 a16 a30 6 14 oct 7 014 021 n16 n30
j14 j29 j12 j23 a7 a25 sept 2 10 17 010 017 nov 14 n23
Figure 36
SPORULATION STUDIES
During the four months when sporocarps were found in Plots 1 and 2 data was gathered once a week on the duration and quantity ofbasidiospores discharged in a 24 hour period slides were placed under sporocarps in the morning of one day and gathered at the same time the next day Sporulation data was gathered from a total of 62 sporocarps of Cantharellusdbarius Of these data was obtained for the entire life cycle of 42 sporocarps from Plot 1 and 5 from Plot 2 The remaining 20 sporocarps were consumed by mammals at some point in their development Therefore a total of nearly 700 slides were obtained during this study
Out of 42 life cycles the mean life span was 56 days with sporulation first observed on a mean day of 44 The fungi that received spore measurements started sporulating with a mean Rh of 943 T soil of 136 C and a SM of3094 All fungi had a maximum spore discharge per square centimeter ofhymenophore (gt100000000) at mean Rh of 788 T soil of 144 C and SM of 32 A higher spore load and warmer soil temperatures appear to be correlated
For all 42 sporocarps studied at least 6 different patterns existed during which spores were produced as follows
I number of sporocarps [ when majority of spores are produced during the life span 20 near the end 2 from the middle to the end r 5 at the beginning 7 in the middle 2 from the beginning to the middle 5 over entire life cycle
29
Sporulation for each mushroom will be found in the unfinished graphs located in Appendix A
Some fruiting bodies produced their spores in two to three flushes some all at once while others did not produce more than 500000 spores per square em In a mycorrhizal fungus such as C dbatius basidiospore production may be genetically controlled
Sporulation data is still being analyzed as of this date During the next few months an attempt will be made to determine if sporocarp clustering has an effect on sporulation However the maps on which all sporocarp and vegetation will be located have to be completed
Comparison between 1992 and 1993 Fruiting Seasons
Comparisons of the data collected in 1992 with that of 1993 indicate distinct differences between the two years The fruiting seasons in each year began roughly at the same time however 1992 was a bit later than 1993
Cantharellus dbarius
The fruiting season in 1992 lasted nearly two months longer than in 1993 In 1992 freezing temperature terminated the life span near January 20th whereas in 1993the season was terminated on November 12th due to the week long period ofwarrn weather The initiation of the fruiting season were similar with the season observed to begin on June 7th in 1992 and the season observed to begin near June first in 1993 (see Figure 37) In each year the fruiting season began during a period of dry weather which was preceded by wet weather In each year new sporocarps were formed as long as the cumulative rainfall was kept below 5 em and the largest number ofsporocarps were produced during a time when no to very little rain occurred The termination of the fruiting season began when the relative humidity increased and new rain occurred Therefore it appears that sporocarp formation in Cantharellusdbatius responses to very little rain The stimulus for the initiation of the fruiting season seems to be a low relative humidity near 60 average minimum air temperatures rising from 5 to 9 dc In each year sporocarp formation was more restricted to the southeastern quadrant of plot 1 which has a large amount of buried wood Therefore sporocarp formation seems to respond to moisture found in this woody debris a phenomenon which correlates with the studies of Norvell
- Length of Fruiting Season
8oIlaquou edu
F r-
Jon
Doc
- D Nov2
Cd2
- 5
1992Con_ 993 1992Bou 3 1~3
Figure 37
The highest number of sporocarps found in plot 1 in 1992 was about 105 whereas in 1993the highest number was 267 The patterns of the highest number of sporocarps present at anyone time were similar in 1992 as in 1993 however the abrupt disappearance ofsporocarps in 1993 was caused by the warm weather (see Figure 38) The temperatures in 1993 were warmer and the rainfall less than in 1992 Therefore an increase in sPorocarp numbers during drier weather seems to correlate well with information provided by Norvell (1992) (See Figure 41)
New sporocarps were produced in flushes in both 1992 and 1993 However the number of flushes were about 3
times more in 1993 than in 1992 Interesting the highest number of new sporocarps produced per flush were equal in 1992 asin 1993(see Figure 39)
The pattern oflife spans were very different in 1992than in 1993 (See Fig 40) In 1992 the longest life spans were produced towards the middle and the end of the fruiting season however all parts of the fruiting season produced sporocarps with different lengths oflife span In 1993 the longest life spans were produced in the beginning of the fruiting
30
season and the average life span length was reduced as the fruiting season progressed However the longest life span shortest life span and average life spans were nearly identical in 1992 as in 1993 (see Table 5)
lifespan of individual sporocarps total number of highestnumber of sporocarps sporocarpsat anyone
longest shortest average observedin plot 1 time in v10t1 1992 92 I 10 I 44 364 105 1993 84 I 11 I 465 454 267
Sporulation patterns for the two years did correlate with maximum spore output for Relative Humidity Soil Moisture and Soil Temperature In 1992the Relative Humidity was 90 the Soil Moisture was 316 and the Soil Temperature was 143 C In 1993 the Relative Humidity was 878 the Soil Moisture was 32 and the Soil Temperature was 144 C Sporocarps growing only in bryophytes and those growing in woody debris need to be compared for sporulation patterns
~ 20
num ps
100
20 90
80 70 so 60 50
30 20 a 10
o~812
911 1011 1111
dol
1211 111 111
--- ~-- wJ
1 0I 1 yen~ _NO
ca
--19931992
Firgure 38
numfnowpongtc35 ~ ~
30r 29 r
20 21
20
15 10
0 A2 -
28 3
1992 199J Figure 39
31
IIr benln
Ipanon 9
Plot 1
numpY100
80
90 7
80
7
50
30 -20 T
pC to3 -- - on gtOd3 _0 1
1992 1993
Figure 40
+Figure 41
~~(=I
1U c
55
OJ In em
55 25
~
20
t5 v
1
- t
1 r -
s JO
- ~
i
12 -
- - momb moxmp
---~
~ It l - (bX)
3 t5 oct 04 011 0 029 n2 n19 023 n29 6 d26 1
19 m (02) 08 (01)(25)nov1 n nt5 n22 n25 2 2 9 jan4 0
5r~T OJn
c 13 ~ocT7 i ~~ I-ro18 s s
-
1992 1993
-shyem
50 135 120 105 90 30
plOt2 1992-1993
-pIot1 1992- 993
shy ~
)un A ope oct
nov
Jen
reo m br may
-plot199
Comparison of rain fall plot 1 and plot 2
32
Literature Cited
Bengston D 1993a Letter to the California Native Plant Society expressing concerns about the Harvesting of Wild Mushrooms County of Mendocino Department of Agriculture Agricultural Commissioner
Bengston David 1993b Subject Commercial Mushroom Industry Informational Memo Memorandum dated 18 March 1993 sent the supervisors of the County of Mendocino County of Mendocino Department of Agriculture Agricultural Commissioner
Cherfas J 1991 Disappearing Mushrooms Another Mass Extinction Science 254 1458
Fischer C Molina R Amaranthus M Luoma D L and J Trappe 1993 Productivity and Ecological Habitat of Matsutake Mushroom in the Chemult Ranger District Winema National Forest and the Illinois Valley Ranger District Siskiyou National Forest Research plan circulated to the various ranger districts in northern California and the pacific Northwest
Largent David L 1991 General Research Plan for the study of Armillaria ponderosa Submitted to and accepted by The Six Rivers National Forest Orleans District
Lizon Pavel 1993 Decline of Macrofungi in Europe An Overview Contributed paper presented to the 14th Annual Mid-Atlantic States Mycology Conference Duke University Durham NC April 17 1993
Millar C Cheng S Creasy M Largent D L and R Richards 1993 Environmental and Social Impact Analysis of Mushroom Harvesting Assessing the Sustainability of the Matsutake Mushroom on the Klamath National Forest Research Proposal submitted to the Klamath National Forest
Molina R ODell T Luoma D Amaranthus M Castellano M and K Russell 1993 Biology Ecology and Social Aspects of Wild Edible Mushrooms in the ForestS of the Pacific Northwest A Preface to Managing Commercial Harvest VSDA Gen Tech Report PNW-GTR-309 ~~
Norvell Lorelei 1992 The Oregon Cantharellus Study Project Mushroom harvesting and chanterelle productivity in Oregonua preliminary report
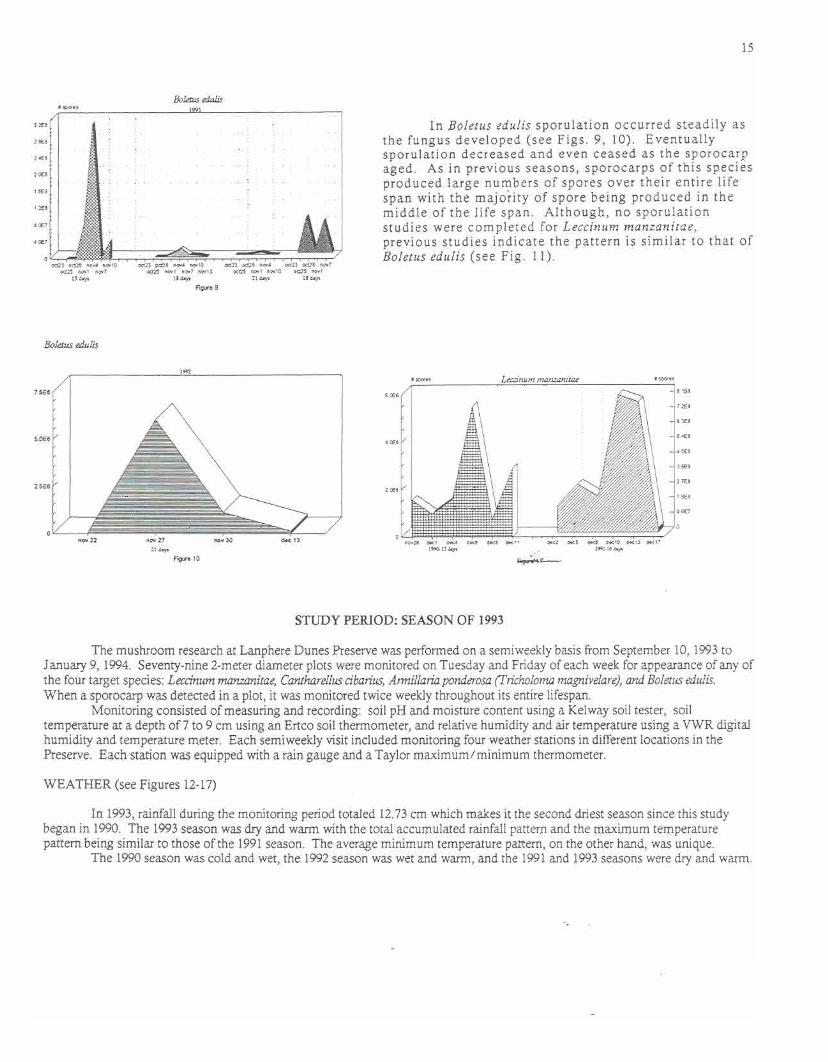
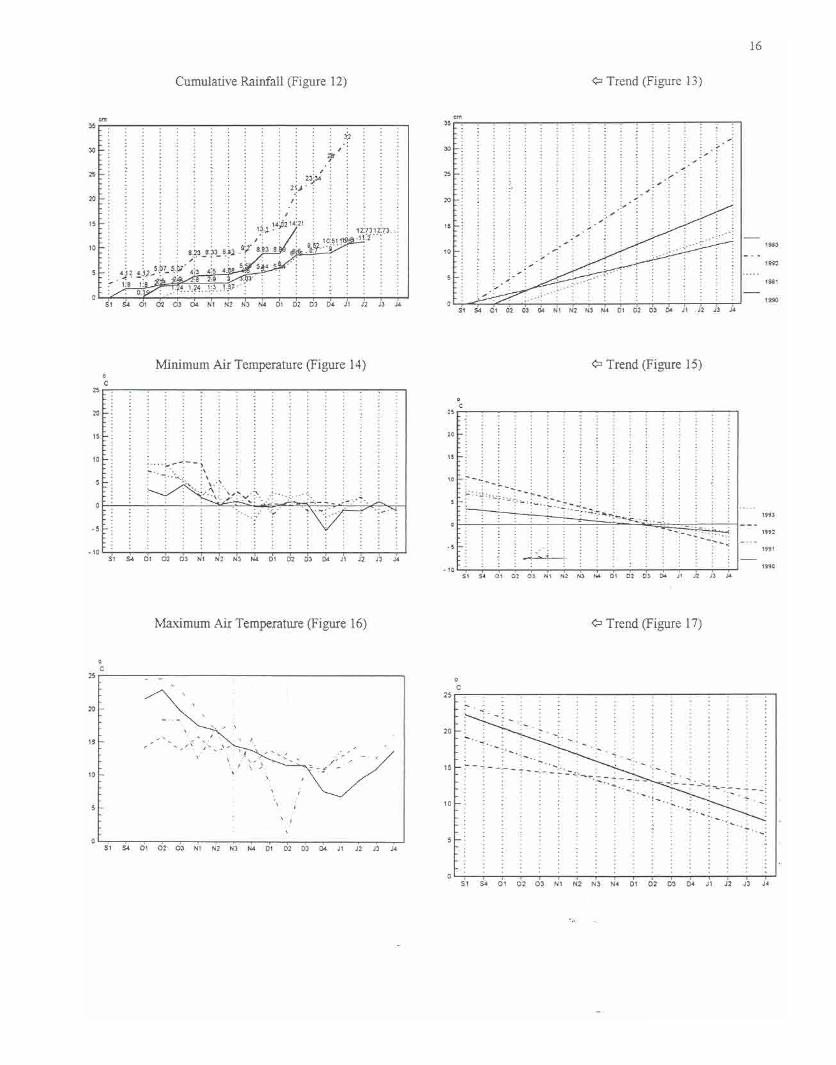
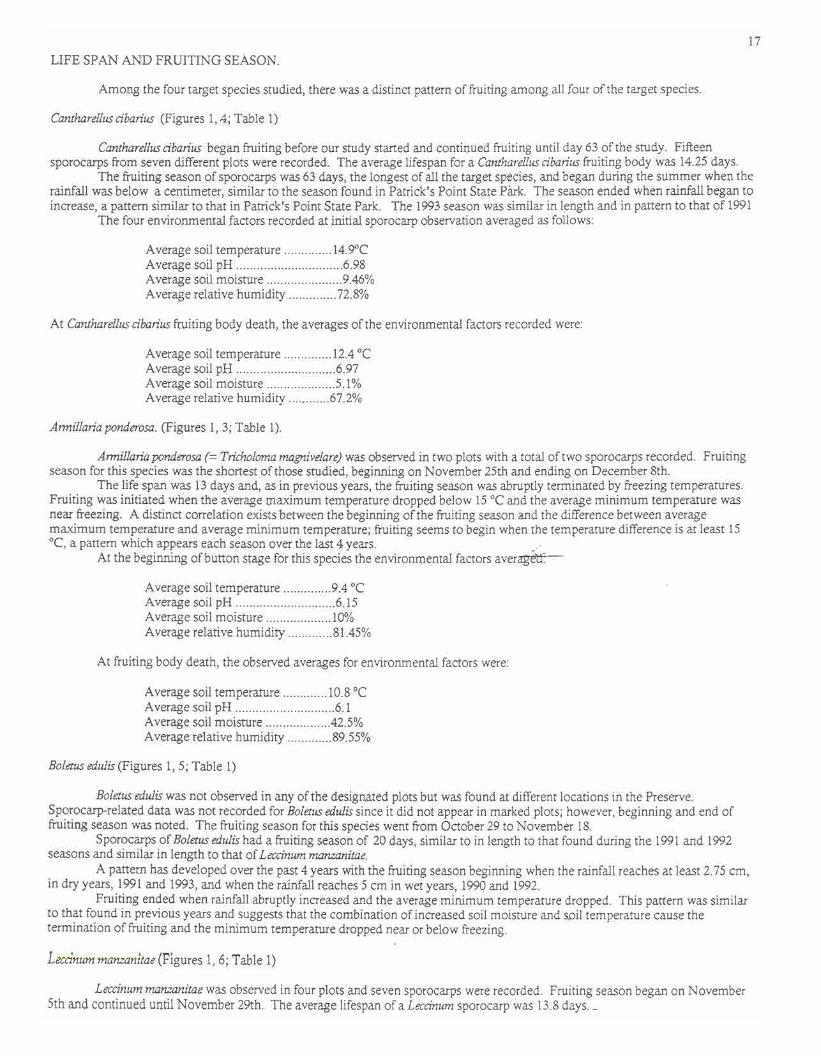
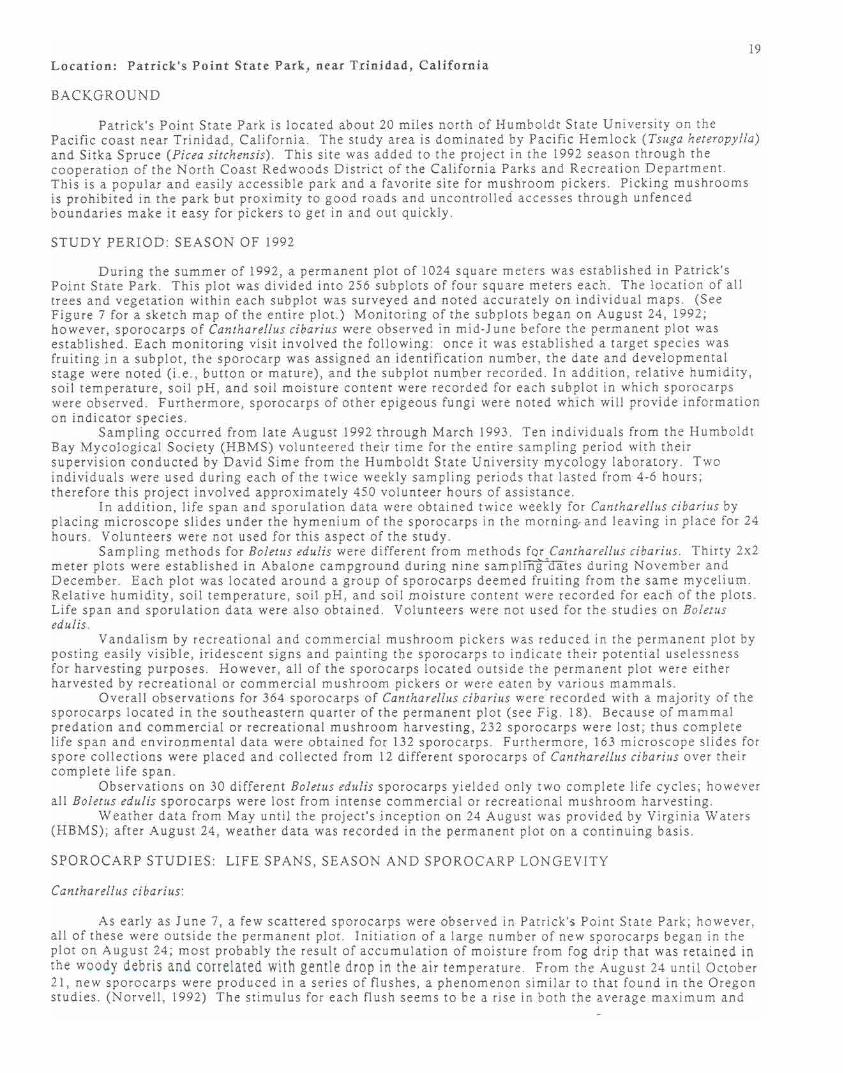
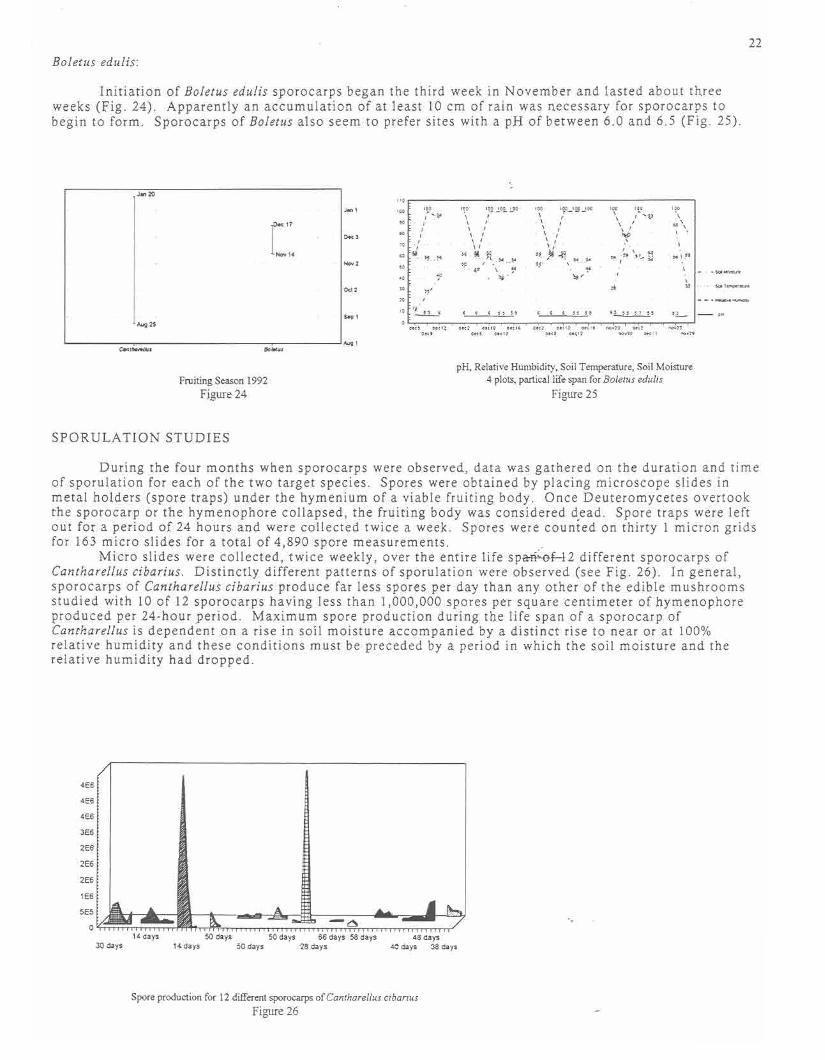