introduction - arel
TRANSCRIPT

3
INTRODUCTION
Federazione Italiana Giuoco Calcio (FIGC), Arel (Agenzia di Ricerche e Legislazione) and PwC are proud to present this third consecutive edition of ReportCalcio Abstract, published in English.
This abstract intends to summarise, in a brief but comprehensive way, the main figures and trends included in the unabridged version, edited in Italian, of ReportCalcio, the annual publication which began in 2011 and has reached, with this 2015 edition, its fifth issue. With more than 200 pages, its main purpose is to provide an as complete as possible reference for those who are interested in analysing and understanding the economic, social and managerial aspects of the football system.
ReportCalcio 2015 comprises nine sections: the first one, census of Italian Football, highlights the main trends concerning clubs, teams, registered players, competitions and a plethora of other indicators. Section 2 illustrates the sportive, media and commercial profile of the Italian National Teams, with a specific focus given to the remarkable growth in the use of official FIGC digital channels during the 2014 FIFA World Cup and to the outstanding triumph achieved by the Futsal National Team, who won the 2014 UEFA FUTSAL European Championship. The third section presents amateur and youth football, and includes an in-depth analysis of the fiscal contribution of Serie D, the major amateur football championship in Italy.
Section 4 provides a complete and broad examination of the financial sphere, highlighting the increasingly strategic relevance of the economic dimension of professional football. The fifth section analyses the significant tax and social security contributions the Italian professional football has contributed to the State income, confirming the main role played by the football industry in Italy.
The sixth section provides an international benchmarking analysis of the Italian football system in Europe and worldwide, while section 7 sheds light on one of the most crucial aspects of our football system: the infrastructural profile.
Thanks to the elaboration of data extracted from FIGC’s “Stadia Database” project, the aforementioned section provides a complete overview of the main features, services, security and quality level offered by the stadiums of the Italian professional leagues as well as an explanation of the increasing trend of attendances.
Section 8 focuses on governance models in the Italian professional football system and section 9, divulged for the first time with the 2015 edition, includes an in-depth analysis of the economic benefit for the city of Turin and the local economy generated by hosting the 2013-2014 UEFA Europa League Final. Such analysis allows us to assess the magnitude and the potential upsides that may be derived from organising main international events. This perspective is particularly crucial for our country, which is going to host in the next two years several relevant sporting events (i.e. male and female UEFA Champions League Final in 2016, UEFA European Championship in 2020).
The picture emerging from ReportCalcio 2015 clearly shows the current status of Italian Football at both local and international level. Despite the economic crisis, the football system confirms a significant economic growth as well as an extraordinary social relevance, and its critical role as a springboard to the economic expansion of our country.
Looking at the path that the current figures seem to outline, we hope that the future editions of ReportCalcio will show a football system continuously strengthening its social dimension and its ability to balance sporting results with economic and financial performances, in a fair play perspective.
Italian Football Association
4
FOREWORD
With more than one million players, almost 241,000 managers, more than 34,000 referees and 23,000 coaches, the world of football goes beyond the popularity among supporters and deserves attention also from a social and economic standpoint.
Over the last years, many European countries have levered on the strong attractiveness of this sporting phenomenon in order to enhance their influence in the world. In this respect, Italy seems to still have significant room for growth. AREL has always considered it crucial to work towards further internationalization of our system and exploiting the significant economic growth opportunities embedded in the world of football. Given the recurring episodes of violence, eradicating such phenomenon from stadiums represents a necessary condition in order to exploit such growth opportunities.
We want this fifth edition of ReportCalcio to represent a further opportunity to reflect on the need for a radical renewal of the industry. Making people keen to go to the stadium once more, creating modern infrastructure and sustaining the growth of young talents are essential steps in rebuilding the competitiveness of a football system that a few years ago used to dominate the worldwide scene. Special thanks to PwC and FIGC for their invaluable cooperation. Through this joint work we re-launch our belief that change is possible as well as necessary.
One of the most important theories J.M.Keynes (1883-1946) was credited with demonstrated that an economy may reach equilibrium, even if it corresponds to underemployment. Today there is no better definition for the Italian professional football system.
Following a resizing in the period 2011 – 2013, driven by wage decreases of 3% over the two seasons, the system has not shown any positive trends in terms of economic or financial performance. Since 2009, the annual growth rate in revenues has not exceeded 2%, unlike our major European competitors.
Financial tensions are due to continued net losses and a lower propensity of stakeholders to adequately recapitalise the clubs. In addition, the system uses techniques of anticipating expected cash flows, generating a mismatch between economic items and monetary flows which further threatens financial equilibrium. Sporting performances seen in recent seasons are the natural result of the above.
This current situation, characterized by slow revenue growth and financial distress, can only be overcome if the main stakeholders produce a strategic plan focused on the short-medium term. We believe that this plan has to be grounded on the enhancement of the youth sector, to which our Company dedicates this edition of ReportCalcio.
This 2015 edition represents the fifth ReportCalcio released. The report was born with the objective of providing a comprehensive overview of the key figures regarding the size and structure of the Italian football system. Throughout the years ReportCalcio has been progressively enriched with additional information in order to provide an as complete as possible reference for all the stakeholders of our country’s football system.
ReportCalcio is grounded on some fundamental pillars: first of all, it derives from the construction and elaboration of a database which encompasses all of the key dimensions – sportive, social, economic, organizational, infrastructure – of the phenomenon; secondly, it is created with the objective to represent an official and documented reference point for anyone interested in knowing, studying and analyzing the profile of the Italian Football System; in addition, it enhances transparency, providing evidence of both positive and negative aspects characterizing the Italian Football industry.
All stakeholders involved need to be aware of the importance achieved by football from an economic and social standpoint. In this respect, ReportCalcio aims to be a support and represents an independent, high quality reference point. Hence it is an unique and fundamental tool to help direct football to a sustainable growth path, with a long-term management vision that our system can no longer do without.
Enrico Letta AREL
Carlo Tavecchio Italian Football Association
Emanuele GrassoPwC
5
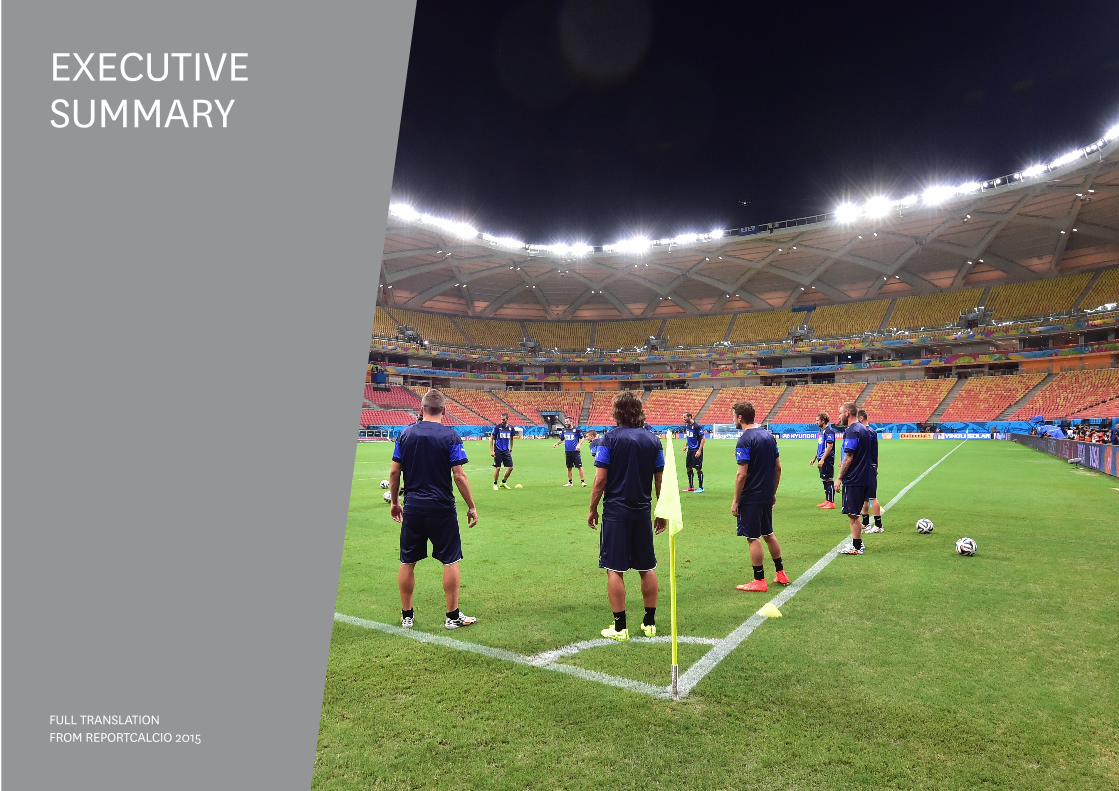
EXECUTIVE SUMMARY
FULL TRANSLATION FROM REPORTCALCIO 2015
6
HIGHLIGHTS
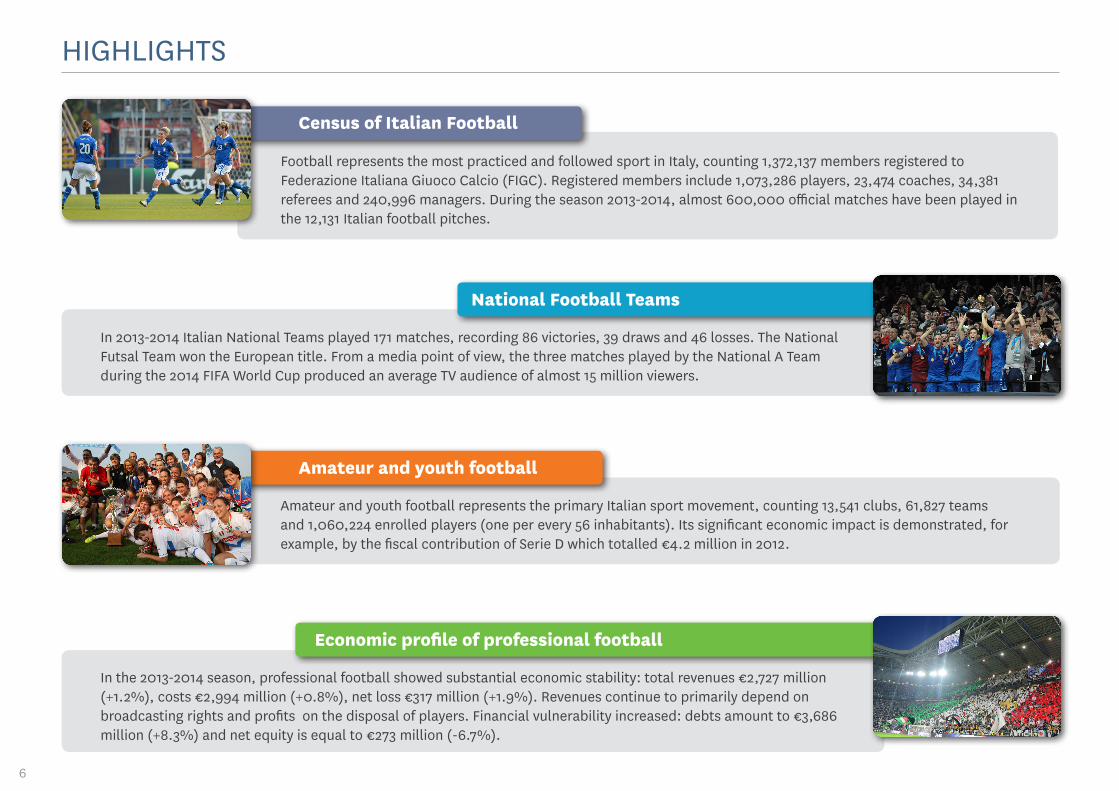
Census of Italian Football
Football represents the most practiced and followed sport in Italy, counting 1,372,137 members registered to Federazione Italiana Giuoco Calcio (FIGC). Registered members include 1,073,286 players, 23,474 coaches, 34,381 referees and 240,996 managers. During the season 2013-2014, almost 600,000 official matches have been played in the 12,131 Italian football pitches.
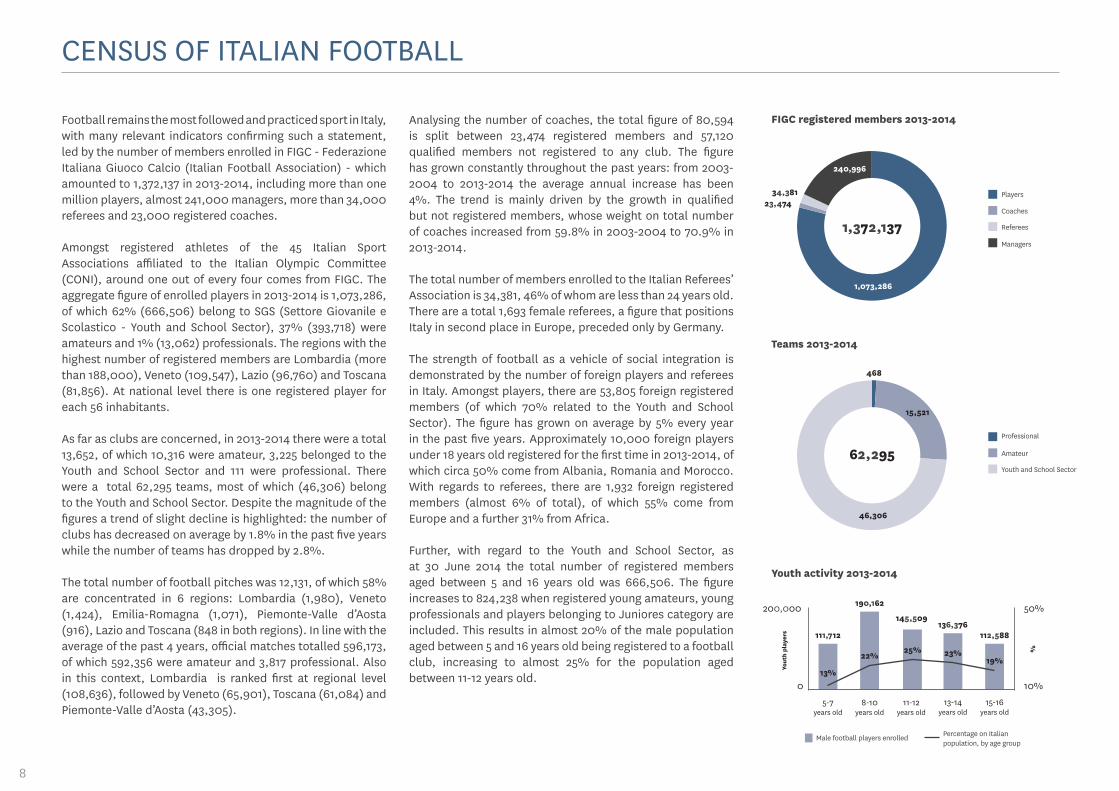
National Football Teams
In 2013-2014 Italian National Teams played 171 matches, recording 86 victories, 39 draws and 46 losses. The National Futsal Team won the European title. From a media point of view, the three matches played by the National A Team during the 2014 FIFA World Cup produced an average TV audience of almost 15 million viewers.
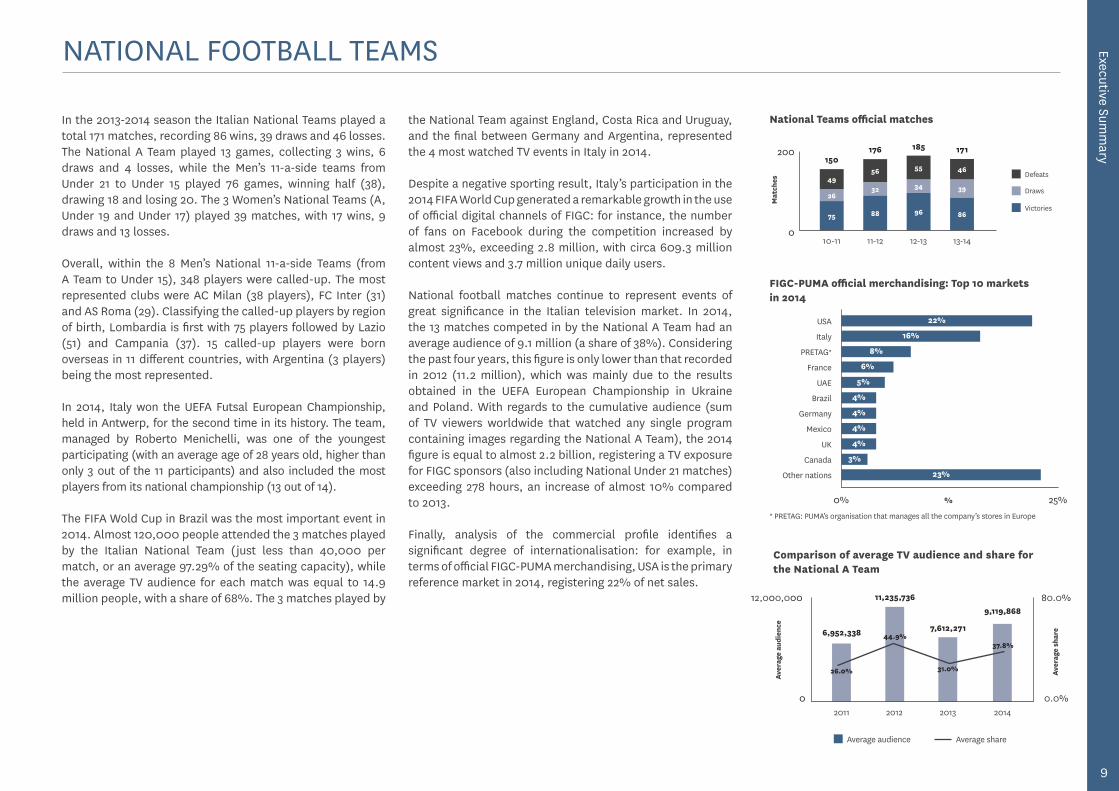
Amateur and youth football
Amateur and youth football represents the primary Italian sport movement, counting 13,541 clubs, 61,827 teams and 1,060,224 enrolled players (one per every 56 inhabitants). Its significant economic impact is demonstrated, for example, by the fiscal contribution of Serie D which totalled €4.2 million in 2012.
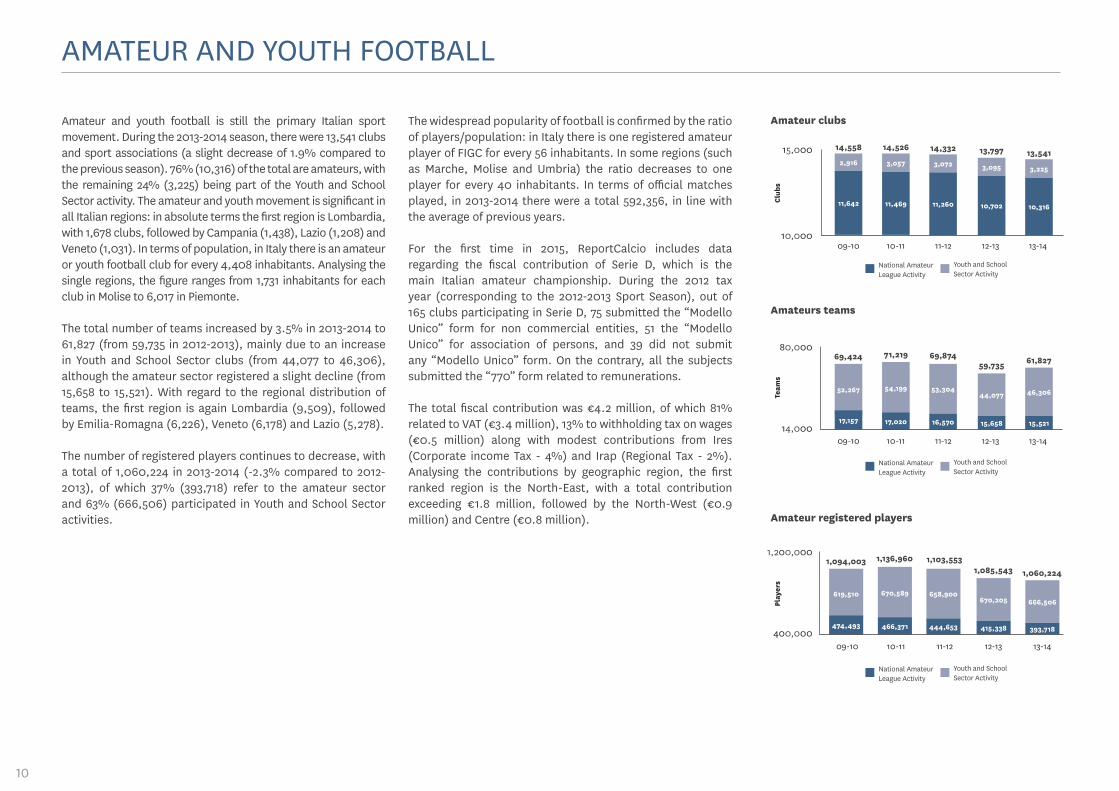
Economic profile of professional football
In the 2013-2014 season, professional football showed substantial economic stability: total revenues €2,727 million (+1.2%), costs €2,994 million (+0.8%), net loss €317 million (+1.9%). Revenues continue to primarily depend on broadcasting rights and profits on the disposal of players. Financial vulnerability increased: debts amount to €3,686 million (+8.3%) and net equity is equal to €273 million (-6.7%).

Executive Summ
ary
7
Tax and social security contribution of professional football
In 2012, the overall tax and social security contribution was €1,023 million, of which 86.5% was derived directly from the professional system (Serie A, Serie B and Lega Pro), with the remaining 13.5% from betting on football. From 2006 to 2012, the total direct contribution of the sector was almost €6 billion.
International benchmarking
The turnover of the Top 54 European Divisions reached €15 billion (+6.4%) in 2013 with a net loss of €0.8 billion, an improvement compared to 2012 (-€1.1 billion) and 2011 (-€1.7 billion). Total stadium attendance in Europe equalled 100.6 million spectators. Only 15% of clubs own their stadium.
Stadiums, spectators and security
In 2013-2014, the overall attendance to professional football in Italy was equal to 13.1 million spectators (+6% compared to the previous season). The stadium capacity utilisation exceeds 50% only in Serie A. Stadia have an average age of about 60 years and have significant deficiencies in terms of services, sustainability and infrastructure quality.
Governance models in professional football
The ownership structure is highly concentrated: the stake held by the controlling shareholder declines from 88.2% in Serie A to 62.3% in Lega Pro Second Division. During the period 2011-2014, shareholders made capital injections totalling more than €1 billion, with a downward trend evidenced in the period under review.
The legacy of the 2013-2014 UEFA Europa League Final
The UEFA Europa League Final produced a gross economic impact of €17.5 million, of which 72% (€12.6 million) was for the benefit of the city of Turin and the surrounding Metropolitan Area. The spending was generated by spectators (€8.7 million), media (€1.2 million) and by the production of the event (€2.6 million)
8
CENSUS OF ITALIAN FOOTBALL
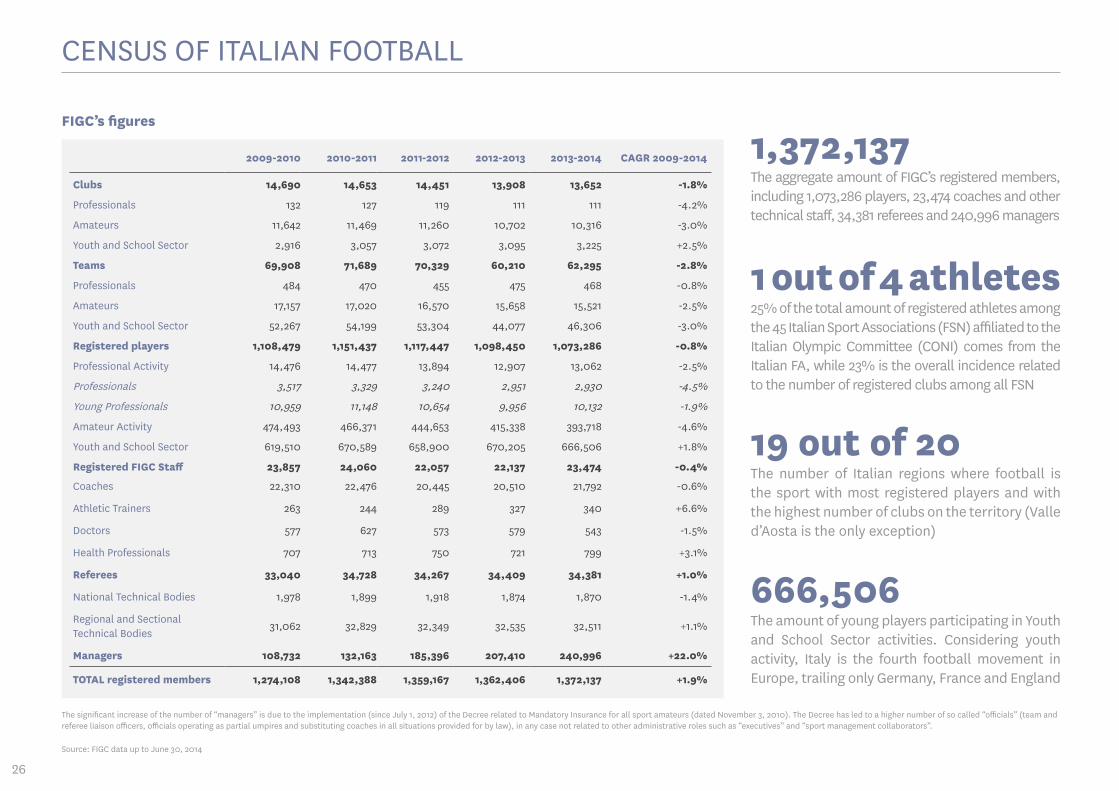
Football remains the most followed and practiced sport in Italy, with many relevant indicators confirming such a statement, led by the number of members enrolled in FIGC - Federazione Italiana Giuoco Calcio (Italian Football Association) - which amounted to 1,372,137 in 2013-2014, including more than one million players, almost 241,000 managers, more than 34,000 referees and 23,000 registered coaches.
Amongst registered athletes of the 45 Italian Sport Associations affiliated to the Italian Olympic Committee (CONI), around one out of every four comes from FIGC. The aggregate figure of enrolled players in 2013-2014 is 1,073,286, of which 62% (666,506) belong to SGS (Settore Giovanile e Scolastico - Youth and School Sector), 37% (393,718) were amateurs and 1% (13,062) professionals. The regions with the highest number of registered members are Lombardia (more than 188,000), Veneto (109,547), Lazio (96,760) and Toscana (81,856). At national level there is one registered player for each 56 inhabitants.
As far as clubs are concerned, in 2013-2014 there were a total 13,652, of which 10,316 were amateur, 3,225 belonged to the Youth and School Sector and 111 were professional. There were a total 62,295 teams, most of which (46,306) belong to the Youth and School Sector. Despite the magnitude of the figures a trend of slight decline is highlighted: the number of clubs has decreased on average by 1.8% in the past five years while the number of teams has dropped by 2.8%.
The total number of football pitches was 12,131, of which 58% are concentrated in 6 regions: Lombardia (1,980), Veneto (1,424), Emilia-Romagna (1,071), Piemonte-Valle d’Aosta (916), Lazio and Toscana (848 in both regions). In line with the average of the past 4 years, official matches totalled 596,173, of which 592,356 were amateur and 3,817 professional. Also in this context, Lombardia is ranked first at regional level (108,636), followed by Veneto (65,901), Toscana (61,084) and Piemonte-Valle d’Aosta (43,305).
Analysing the number of coaches, the total figure of 80,594 is split between 23,474 registered members and 57,120 qualified members not registered to any club. The figure has grown constantly throughout the past years: from 2003-2004 to 2013-2014 the average annual increase has been 4%. The trend is mainly driven by the growth in qualified but not registered members, whose weight on total number of coaches increased from 59.8% in 2003-2004 to 70.9% in 2013-2014.
The total number of members enrolled to the Italian Referees’ Association is 34,381, 46% of whom are less than 24 years old. There are a total 1,693 female referees, a figure that positions Italy in second place in Europe, preceded only by Germany.
The strength of football as a vehicle of social integration is demonstrated by the number of foreign players and referees in Italy. Amongst players, there are 53,805 foreign registered members (of which 70% related to the Youth and School Sector). The figure has grown on average by 5% every year in the past five years. Approximately 10,000 foreign players under 18 years old registered for the first time in 2013-2014, of which circa 50% come from Albania, Romania and Morocco. With regards to referees, there are 1,932 foreign registered members (almost 6% of total), of which 55% come from Europe and a further 31% from Africa.
Further, with regard to the Youth and School Sector, as at 30 June 2014 the total number of registered members aged between 5 and 16 years old was 666,506. The figure increases to 824,238 when registered young amateurs, young professionals and players belonging to Juniores category are included. This results in almost 20% of the male population aged between 5 and 16 years old being registered to a football club, increasing to almost 25% for the population aged between 11-12 years old.
Youth activity 2013-2014
Teams 2013-2014
1+25+74A15,521
468
62,295
46,306
Professional
Amateur
Youth and School Sector
FIGC registered members 2013-2014
Players
Coaches
Referees
Managers79+1+2+18A1,372,137
1,073,286
240,996
23,47434,381
Male football players enrolled
5-7 years old
8-10 years old
11-12 years old
13-14 years old
15-16 years old
200,000
0
Yout
h pl
ayer
s
%
190,162
22%
111,712
13%
145,509
25%
136,376
23%
112,588
19%
Percentage on Italian population, by age group
50%
10%
Executive Summ
ary
9
Youth and School Sector
FIGC registered members 2013-2014
Referees
NATIONAL FOOTBALL TEAMS
In the 2013-2014 season the Italian National Teams played a total 171 matches, recording 86 wins, 39 draws and 46 losses. The National A Team played 13 games, collecting 3 wins, 6 draws and 4 losses, while the Men’s 11-a-side teams from Under 21 to Under 15 played 76 games, winning half (38), drawing 18 and losing 20. The 3 Women’s National Teams (A, Under 19 and Under 17) played 39 matches, with 17 wins, 9 draws and 13 losses.
Overall, within the 8 Men’s National 11-a-side Teams (from A Team to Under 15), 348 players were called-up. The most represented clubs were AC Milan (38 players), FC Inter (31) and AS Roma (29). Classifying the called-up players by region of birth, Lombardia is first with 75 players followed by Lazio (51) and Campania (37). 15 called-up players were born overseas in 11 different countries, with Argentina (3 players) being the most represented.
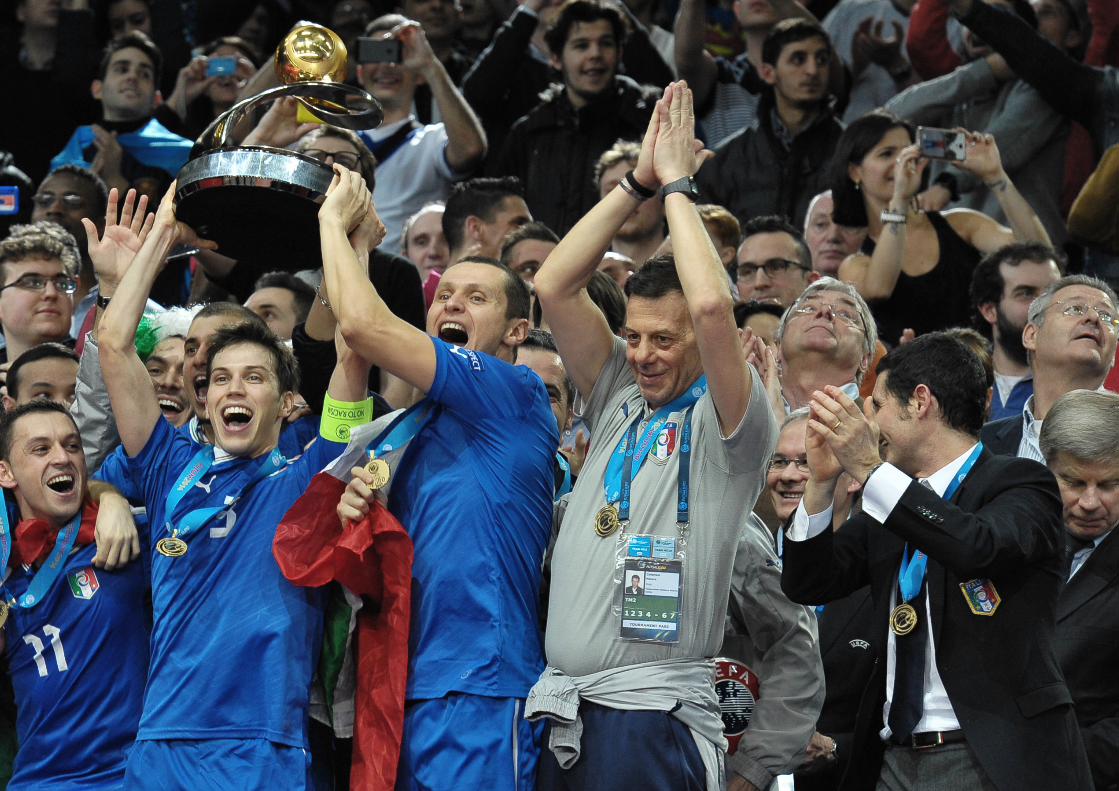
In 2014, Italy won the UEFA Futsal European Championship, held in Antwerp, for the second time in its history. The team, managed by Roberto Menichelli, was one of the youngest participating (with an average age of 28 years old, higher than only 3 out of the 11 participants) and also included the most players from its national championship (13 out of 14).
The FIFA Wold Cup in Brazil was the most important event in 2014. Almost 120,000 people attended the 3 matches played by the Italian National Team (just less than 40,000 per match, or an average 97.29% of the seating capacity), while the average TV audience for each match was equal to 14.9 million people, with a share of 68%. The 3 matches played by
the National Team against England, Costa Rica and Uruguay, and the final between Germany and Argentina, represented the 4 most watched TV events in Italy in 2014.
Despite a negative sporting result, Italy’s participation in the 2014 FIFA World Cup generated a remarkable growth in the use of official digital channels of FIGC: for instance, the number of fans on Facebook during the competition increased by almost 23%, exceeding 2.8 million, with circa 609.3 million content views and 3.7 million unique daily users.
National football matches continue to represent events of great significance in the Italian television market. In 2014, the 13 matches competed in by the National A Team had an average audience of 9.1 million (a share of 38%). Considering the past four years, this figure is only lower than that recorded in 2012 (11.2 million), which was mainly due to the results obtained in the UEFA European Championship in Ukraine and Poland. With regards to the cumulative audience (sum of TV viewers worldwide that watched any single program containing images regarding the National A Team), the 2014 figure is equal to almost 2.2 billion, registering a TV exposure for FIGC sponsors (also including National Under 21 matches) exceeding 278 hours, an increase of almost 10% compared to 2013.
Finally, analysis of the commercial profile identifies a significant degree of internationalisation: for example, in terms of official FIGC-PUMA merchandising, USA is the primary reference market in 2014, registering 22% of net sales.
Comparison of average TV audience and share for the National A Team
12,000,000 80.0%
0 0.0%2011 2012 2013 2014
Average audience Average share
11,235,736
6,952,338 7,612,271
9,119,868
Aver
age
audi
ence
Aver
age
shar
e
National Teams official matches
200
0
Victories
Draws
Mat
ches
13-14
39
46
86
171
12-13
34
55
96
185
11-12
32
56
88
176
10-11
26
49
75
150
Defeats
FIGC-PUMA official merchandising: Top 10 markets in 2014
0% 25%
USA
France
Germany
UK
Other nations
Italy
UAE
Mexico
Canada
PRETAG*
Brazil
22%
5%
4%
16%
4%
3%
8%
4%
23%
6%
4%
%
* PRETAG: PUMA’s organisation that manages all the company’s stores in Europe
26.0%
44.9%
31.0%
37.8%
10
AMATEUR AND YOUTH FOOTBALL
Amateur and youth football is still the primary Italian sport movement. During the 2013-2014 season, there were 13,541 clubs and sport associations (a slight decrease of 1.9% compared to the previous season). 76% (10,316) of the total are amateurs, with the remaining 24% (3,225) being part of the Youth and School Sector activity. The amateur and youth movement is significant in all Italian regions: in absolute terms the first region is Lombardia, with 1,678 clubs, followed by Campania (1,438), Lazio (1,208) and Veneto (1,031). In terms of population, in Italy there is an amateur or youth football club for every 4,408 inhabitants. Analysing the single regions, the figure ranges from 1,731 inhabitants for each club in Molise to 6,017 in Piemonte.
The total number of teams increased by 3.5% in 2013-2014 to 61,827 (from 59,735 in 2012-2013), mainly due to an increase in Youth and School Sector clubs (from 44,077 to 46,306), although the amateur sector registered a slight decline (from 15,658 to 15,521). With regard to the regional distribution of teams, the first region is again Lombardia (9,509), followed by Emilia-Romagna (6,226), Veneto (6,178) and Lazio (5,278).
The number of registered players continues to decrease, with a total of 1,060,224 in 2013-2014 (-2.3% compared to 2012-2013), of which 37% (393,718) refer to the amateur sector and 63% (666,506) participated in Youth and School Sector activities.
The widespread popularity of football is confirmed by the ratio of players/population: in Italy there is one registered amateur player of FIGC for every 56 inhabitants. In some regions (such as Marche, Molise and Umbria) the ratio decreases to one player for every 40 inhabitants. In terms of official matches played, in 2013-2014 there were a total 592,356, in line with the average of previous years.
For the first time in 2015, ReportCalcio includes data regarding the fiscal contribution of Serie D, which is the main Italian amateur championship. During the 2012 tax year (corresponding to the 2012-2013 Sport Season), out of 165 clubs participating in Serie D, 75 submitted the “Modello Unico” form for non commercial entities, 51 the “Modello Unico” for association of persons, and 39 did not submit any “Modello Unico” form. On the contrary, all the subjects submitted the “770” form related to remunerations.
The total fiscal contribution was €4.2 million, of which 81% related to VAT (€3.4 million), 13% to withholding tax on wages (€0.5 million) along with modest contributions from Ires (Corporate income Tax - 4%) and Irap (Regional Tax - 2%). Analysing the contributions by geographic region, the first ranked region is the North-East, with a total contribution exceeding €1.8 million, followed by the North-West (€0.9 million) and Centre (€0.8 million).
Amateur clubs
Amateurs teams
Amateur registered players
1,200,000
80,000
15,000
400,000
14,000
10,000
National Amateur League Activity
National Amateur League Activity
National Amateur League Activity
Youth and School Sector Activity
Youth and School Sector Activity
Youth and School Sector Activity
10-11
54,199
17,020
71,219
09-10
52,267
17,157
69,424
10-11
670,589
466,371
1,136,960
09-10
619,510
474,493
1,094,003
11-12
53,304
16,570
69,874
11-12
658,900
444,653
1,103,553
12-13
44,077
15,658
59,735
13-14
46,306
15,521
61,827
12-13
670,205
415,338
1,085,543
13-14
666,506
393,718
1,060,224
Play
ers
Team
sC
lubs
10-11
3,057
11,469
14,526
09-10
2,916
11,642
14,558
11-12
3,072
11,260
14,332
12-13
3,095
10,702
13,797
13-14
3,225
10,316
13,541
Executive Summ
ary
11
ECONOMIC PROFILE OF PROFESSIONAL FOOTBALL
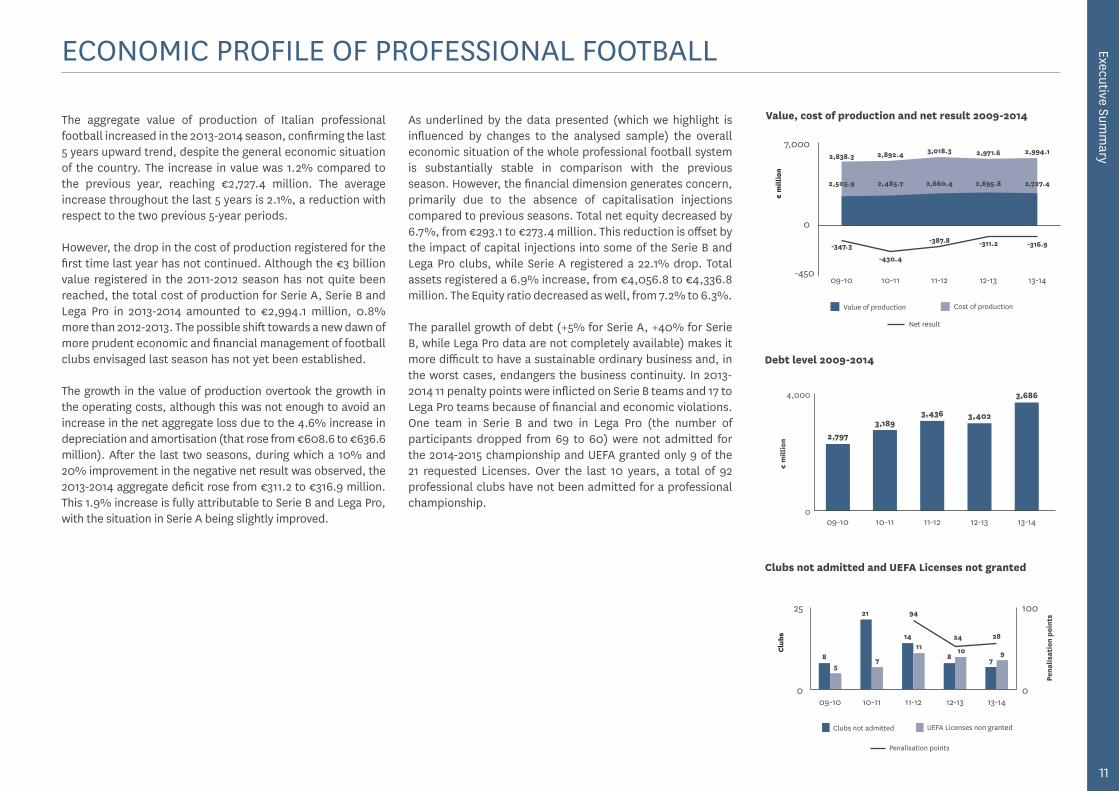
The aggregate value of production of Italian professional football increased in the 2013-2014 season, confirming the last 5 years upward trend, despite the general economic situation of the country. The increase in value was 1.2% compared to the previous year, reaching €2,727.4 million. The average increase throughout the last 5 years is 2.1%, a reduction with respect to the two previous 5-year periods.
However, the drop in the cost of production registered for the first time last year has not continued. Although the €3 billion value registered in the 2011-2012 season has not quite been reached, the total cost of production for Serie A, Serie B and Lega Pro in 2013-2014 amounted to €2,994.1 million, 0.8% more than 2012-2013. The possible shift towards a new dawn of more prudent economic and financial management of football clubs envisaged last season has not yet been established.
The growth in the value of production overtook the growth in the operating costs, although this was not enough to avoid an increase in the net aggregate loss due to the 4.6% increase in depreciation and amortisation (that rose from €608.6 to €636.6 million). After the last two seasons, during which a 10% and 20% improvement in the negative net result was observed, the 2013-2014 aggregate deficit rose from €311.2 to €316.9 million. This 1.9% increase is fully attributable to Serie B and Lega Pro, with the situation in Serie A being slightly improved.
As underlined by the data presented (which we highlight is influenced by changes to the analysed sample) the overall economic situation of the whole professional football system is substantially stable in comparison with the previous season. However, the financial dimension generates concern, primarily due to the absence of capitalisation injections compared to previous seasons. Total net equity decreased by 6.7%, from €293.1 to €273.4 million. This reduction is offset by the impact of capital injections into some of the Serie B and Lega Pro clubs, while Serie A registered a 22.1% drop. Total assets registered a 6.9% increase, from €4,056.8 to €4,336.8 million. The Equity ratio decreased as well, from 7.2% to 6.3%.
The parallel growth of debt (+5% for Serie A, +40% for Serie B, while Lega Pro data are not completely available) makes it more difficult to have a sustainable ordinary business and, in the worst cases, endangers the business continuity. In 2013-2014 11 penalty points were inflicted on Serie B teams and 17 to Lega Pro teams because of financial and economic violations. One team in Serie B and two in Lega Pro (the number of participants dropped from 69 to 60) were not admitted for the 2014-2015 championship and UEFA granted only 9 of the 21 requested Licenses. Over the last 10 years, a total of 92 professional clubs have not been admitted for a professional championship.
Value, cost of production and net result 2009-2014
Clubs not admitted UEFA Licenses non granted
09-10 10-11 11-12 12-13 13-14
25 100
0 0
Pena
lisat
ion
poin
ts
8
14
8 7
21
5
11 10 97
94
24 28
Penalisation points
Clubs not admitted and UEFA Licenses not granted
Clu
bs
Value of production Cost of production
09-10 10-11 11-12 12-13 13-14
7,000
0
€ m
illio
n
-430.4
2,892.4
2,485.7
-387.8
3,018.3
2,660.4
-311.2
2,971.6
2,695.8
-316.9
2,994.1
2,727.4
-347.3
2,838.3
2,505.9
Net result
Debt level 2009-2014
€ m
illio
n
4,000
0
2,797
09-10
3,189
10-11
3,436
11-12
3,402
12-13
3,686
13-14
-450
12
COSTS AND REVENUES OF PROFESSIONAL FOOTBALL
Breakdown of sources of income 2009-2014
%
100%
20%
Profit on disposal of players
Broadcasting rights income
Commercial and sponsorship income
Other income
Gate receipt
Solidarities
13-1409-10 10-11 11-12 12-13
19%
14%
17%
8%4%
37%
18%
15%
11%
11%
4%
41%
18%
16%
13%
10%
4%
39%
20%
15%
15%
9%4%
37%
20%
14%
16%
8%4%
38%
Breakdown of costs 2009-2014
13-1409-10 10-11 11-12 12-13
%
100%
30%
12%
21%
15%
3%
49%
15%
18%
13%
3%
51%
12%
20%
15%
3%
50%
11%
20%
15%
4%
50%
12%
20%
15%
4%
49%Employee costs
Other costs
Depreciations and amortisations
Service costs
Lease costs
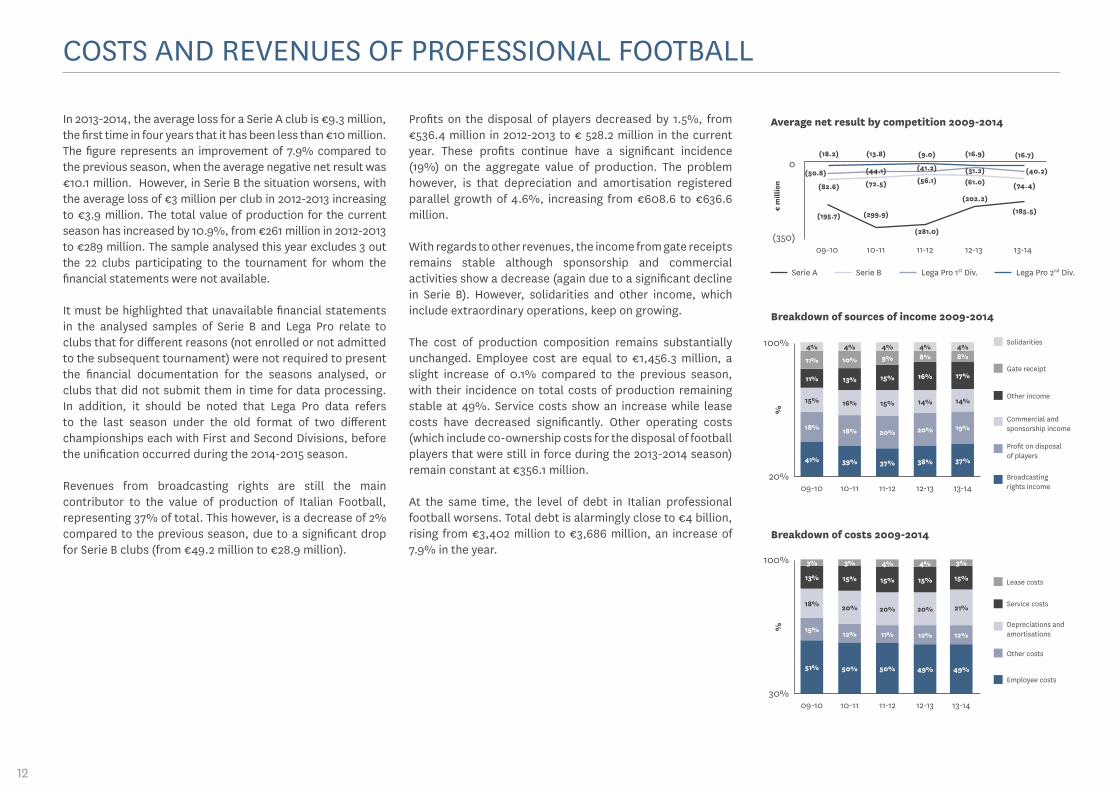
In 2013-2014, the average loss for a Serie A club is €9.3 million, the first time in four years that it has been less than €10 million. The figure represents an improvement of 7.9% compared to the previous season, when the average negative net result was €10.1 million. However, in Serie B the situation worsens, with the average loss of €3 million per club in 2012-2013 increasing to €3.9 million. The total value of production for the current season has increased by 10.9%, from €261 million in 2012-2013 to €289 million. The sample analysed this year excludes 3 out the 22 clubs participating to the tournament for whom the financial statements were not available.
It must be highlighted that unavailable financial statements in the analysed samples of Serie B and Lega Pro relate to clubs that for different reasons (not enrolled or not admitted to the subsequent tournament) were not required to present the financial documentation for the seasons analysed, or clubs that did not submit them in time for data processing. In addition, it should be noted that Lega Pro data refers to the last season under the old format of two different championships each with First and Second Divisions, before the unification occurred during the 2014-2015 season.
Revenues from broadcasting rights are still the main contributor to the value of production of Italian Football, representing 37% of total. This however, is a decrease of 2% compared to the previous season, due to a significant drop for Serie B clubs (from €49.2 million to €28.9 million).
Profits on the disposal of players decreased by 1.5%, from €536.4 million in 2012-2013 to € 528.2 million in the current year. These profits continue have a significant incidence (19%) on the aggregate value of production. The problem however, is that depreciation and amortisation registered parallel growth of 4.6%, increasing from €608.6 to €636.6 million.
With regards to other revenues, the income from gate receipts remains stable although sponsorship and commercial activities show a decrease (again due to a significant decline in Serie B). However, solidarities and other income, which include extraordinary operations, keep on growing.
The cost of production composition remains substantially unchanged. Employee cost are equal to €1,456.3 million, a slight increase of 0.1% compared to the previous season, with their incidence on total costs of production remaining stable at 49%. Service costs show an increase while lease costs have decreased significantly. Other operating costs (which include co-ownership costs for the disposal of football players that were still in force during the 2013-2014 season) remain constant at €356.1 million.
At the same time, the level of debt in Italian professional football worsens. Total debt is alarmingly close to €4 billion, rising from €3,402 million to €3,686 million, an increase of 7.9% in the year.
Average net result by competition 2009-2014
09-10 10-11 11-12 12-13 13-14
0
(350)
€ m
illio
n
(195.7) (299.9)
(72.5)
(13.8)(18.2)
(82.6)
(281.0)
(56.1)
(202.2)
(61.0)
(16.9)
(185.5)
(74.4)
(16.7)
(40.2)
Lega Pro 2nd Div.Serie BSerie A Lega Pro 1st Div.
(31.2)(41.2)
(9.0)
(50.8) (44.1)
Executive Summ
ary
13
ECONOMIC AND FINANCIAL IMPACT OF SPORTING PERFORMANCES
+€ 22.0 m
+€ 50.1 m
-€ 19.4 m
-€ 27.1 m
Value of production
Value of production
+€ 2.0 m
+€ 20.2 m
-€ 4.3 m
-€ 28.6 m
Net result
Net result
+€ 12.1 m
+€ 20.1 m
-€ 11.0 m
+€ 2.4 m
Cost of production
Cost of production
-€ 1.3 m
+€ 1.0 m
-€ 1.6 m
-€ 16.5 m
Net equity
Net equity
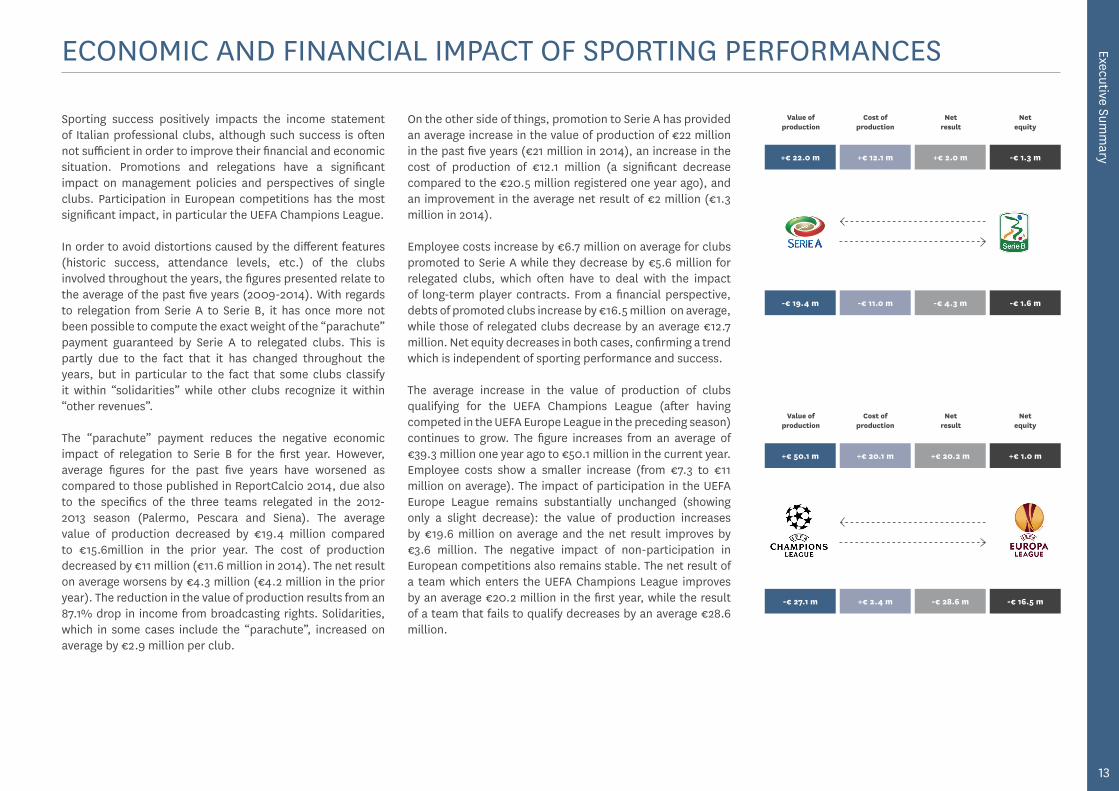
Sporting success positively impacts the income statement of Italian professional clubs, although such success is often not sufficient in order to improve their financial and economic situation. Promotions and relegations have a significant impact on management policies and perspectives of single clubs. Participation in European competitions has the most significant impact, in particular the UEFA Champions League.
In order to avoid distortions caused by the different features (historic success, attendance levels, etc.) of the clubs involved throughout the years, the figures presented relate to the average of the past five years (2009-2014). With regards to relegation from Serie A to Serie B, it has once more not been possible to compute the exact weight of the “parachute” payment guaranteed by Serie A to relegated clubs. This is partly due to the fact that it has changed throughout the years, but in particular to the fact that some clubs classify it within “solidarities” while other clubs recognize it within “other revenues”.
The “parachute” payment reduces the negative economic impact of relegation to Serie B for the first year. However, average figures for the past five years have worsened as compared to those published in ReportCalcio 2014, due also to the specifics of the three teams relegated in the 2012-2013 season (Palermo, Pescara and Siena). The average value of production decreased by €19.4 million compared to €15.6million in the prior year. The cost of production decreased by €11 million (€11.6 million in 2014). The net result on average worsens by €4.3 million (€4.2 million in the prior year). The reduction in the value of production results from an 87.1% drop in income from broadcasting rights. Solidarities, which in some cases include the “parachute”, increased on average by €2.9 million per club.
On the other side of things, promotion to Serie A has provided an average increase in the value of production of €22 million in the past five years (€21 million in 2014), an increase in the cost of production of €12.1 million (a significant decrease compared to the €20.5 million registered one year ago), and an improvement in the average net result of €2 million (€1.3 million in 2014).
Employee costs increase by €6.7 million on average for clubs promoted to Serie A while they decrease by €5.6 million for relegated clubs, which often have to deal with the impact of long-term player contracts. From a financial perspective, debts of promoted clubs increase by €16.5 million on average, while those of relegated clubs decrease by an average €12.7 million. Net equity decreases in both cases, confirming a trend which is independent of sporting performance and success.
The average increase in the value of production of clubs qualifying for the UEFA Champions League (after having competed in the UEFA Europe League in the preceding season) continues to grow. The figure increases from an average of €39.3 million one year ago to €50.1 million in the current year. Employee costs show a smaller increase (from €7.3 to €11 million on average). The impact of participation in the UEFA Europe League remains substantially unchanged (showing only a slight decrease): the value of production increases by €19.6 million on average and the net result improves by €3.6 million. The negative impact of non-participation in European competitions also remains stable. The net result of a team which enters the UEFA Champions League improves by an average €20.2 million in the first year, while the result of a team that fails to qualify decreases by an average €28.6 million.
14
SERIE A KEY RESULTS
Value and cost of production 2009-2014
Net result 2009-2014
13-1409-10 10-11 11-12 12-13
(300)
0
€ m
illio
n
Value of production Cost of production
13-1409-10 10-11 11-12 12-13
5,000
1,500
€ m
illio
n 2,268.8
2,097.3
2,306.3
2,031.2
2,376.0
2,145.9
2,472.5 2,438.4
2,307.6 2,298.8
(202.2)
(281.0)(299.9)
(195.7)(185.5)
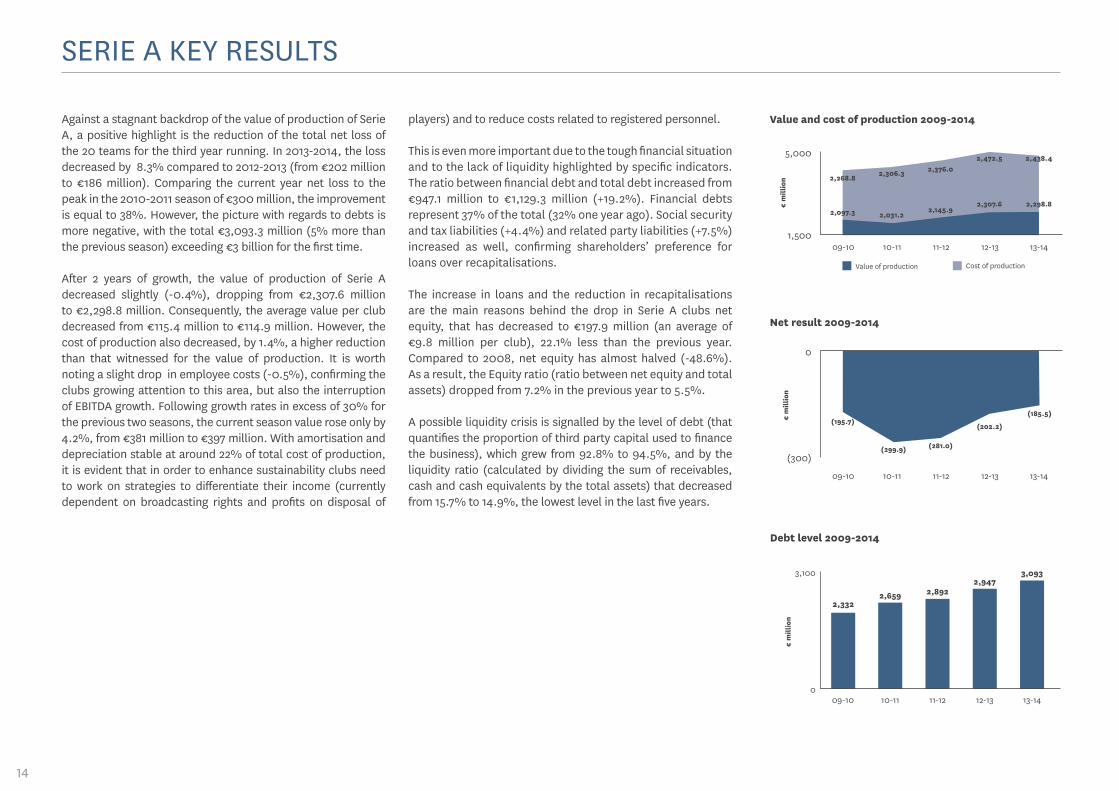
Against a stagnant backdrop of the value of production of Serie A, a positive highlight is the reduction of the total net loss of the 20 teams for the third year running. In 2013-2014, the loss decreased by 8.3% compared to 2012-2013 (from €202 million to €186 million). Comparing the current year net loss to the peak in the 2010-2011 season of €300 million, the improvement is equal to 38%. However, the picture with regards to debts is more negative, with the total €3,093.3 million (5% more than the previous season) exceeding €3 billion for the first time.
After 2 years of growth, the value of production of Serie A decreased slightly (-0.4%), dropping from €2,307.6 million to €2,298.8 million. Consequently, the average value per club decreased from €115.4 million to €114.9 million. However, the cost of production also decreased, by 1.4%, a higher reduction than that witnessed for the value of production. It is worth noting a slight drop in employee costs (-0.5%), confirming the clubs growing attention to this area, but also the interruption of EBITDA growth. Following growth rates in excess of 30% for the previous two seasons, the current season value rose only by 4.2%, from €381 million to €397 million. With amortisation and depreciation stable at around 22% of total cost of production, it is evident that in order to enhance sustainability clubs need to work on strategies to differentiate their income (currently dependent on broadcasting rights and profits on disposal of
players) and to reduce costs related to registered personnel.
This is even more important due to the tough financial situation and to the lack of liquidity highlighted by specific indicators. The ratio between financial debt and total debt increased from €947.1 million to €1,129.3 million (+19.2%). Financial debts represent 37% of the total (32% one year ago). Social security and tax liabilities (+4.4%) and related party liabilities (+7.5%) increased as well, confirming shareholders’ preference for loans over recapitalisations.
The increase in loans and the reduction in recapitalisations are the main reasons behind the drop in Serie A clubs net equity, that has decreased to €197.9 million (an average of €9.8 million per club), 22.1% less than the previous year. Compared to 2008, net equity has almost halved (-48.6%). As a result, the Equity ratio (ratio between net equity and total assets) dropped from 7.2% in the previous year to 5.5%.
A possible liquidity crisis is signalled by the level of debt (that quantifies the proportion of third party capital used to finance the business), which grew from 92.8% to 94.5%, and by the liquidity ratio (calculated by dividing the sum of receivables, cash and cash equivalents by the total assets) that decreased from 15.7% to 14.9%, the lowest level in the last five years.
Debt level 2009-2014
€ m
illio
n
3,100
0
2,332
09-10
2,659
10-11
2,892
11-12
2,947
12-13
3,093
13-14
Executive Summ
ary
15
COSTS AND REVENUES OF SERIE A
Breakdown of sources of income 2009-2014
Profit on players’ disposal & amortisation 2009-2014
€ m
illio
n
13-1409-10 10-11 11-12 12-13
500
200
Profit on disposal of players Amortisation of players’ rights
457.7
443.2391.9
383.3
405.3
356.9
427.8455.8
467.8427.9
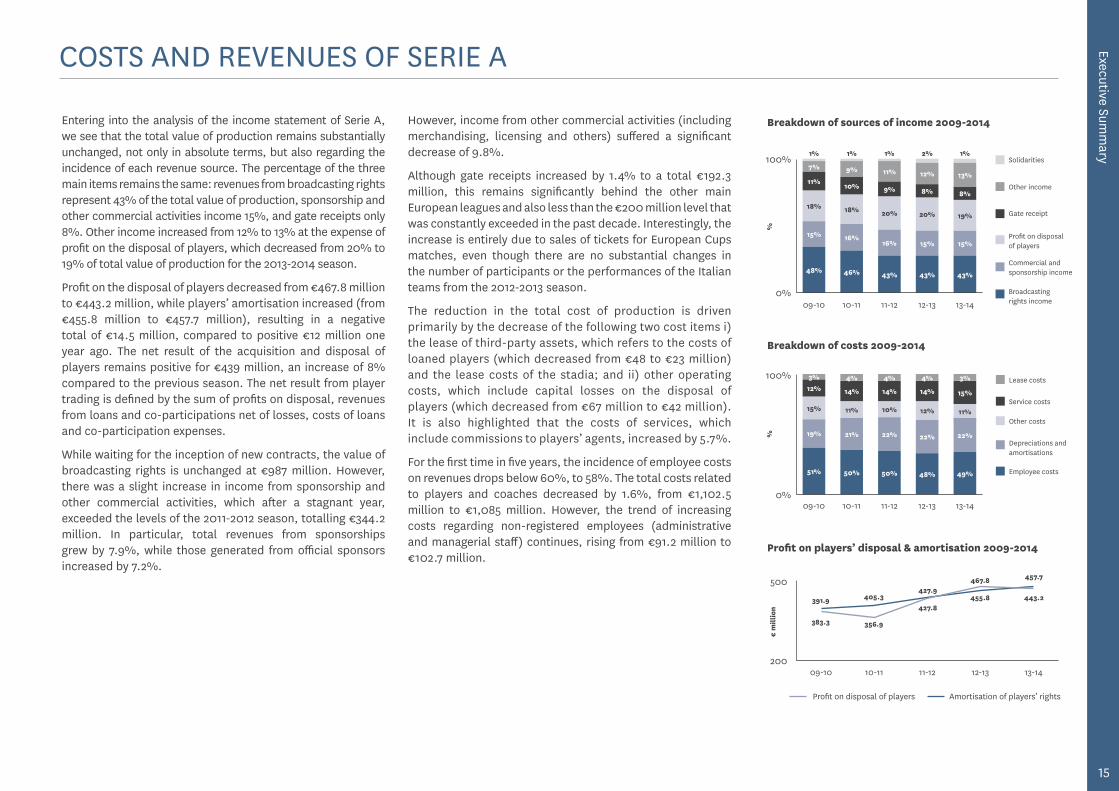
Entering into the analysis of the income statement of Serie A, we see that the total value of production remains substantially unchanged, not only in absolute terms, but also regarding the incidence of each revenue source. The percentage of the three main items remains the same: revenues from broadcasting rights represent 43% of the total value of production, sponsorship and other commercial activities income 15%, and gate receipts only 8%. Other income increased from 12% to 13% at the expense of profit on the disposal of players, which decreased from 20% to 19% of total value of production for the 2013-2014 season.
Profit on the disposal of players decreased from €467.8 million to €443.2 million, while players’ amortisation increased (from €455.8 million to €457.7 million), resulting in a negative total of €14.5 million, compared to positive €12 million one year ago. The net result of the acquisition and disposal of players remains positive for €439 million, an increase of 8% compared to the previous season. The net result from player trading is defined by the sum of profits on disposal, revenues from loans and co-participations net of losses, costs of loans and co-participation expenses.
While waiting for the inception of new contracts, the value of broadcasting rights is unchanged at €987 million. However, there was a slight increase in income from sponsorship and other commercial activities, which after a stagnant year, exceeded the levels of the 2011-2012 season, totalling €344.2 million. In particular, total revenues from sponsorships grew by 7.9%, while those generated from official sponsors increased by 7.2%.
However, income from other commercial activities (including merchandising, licensing and others) suffered a significant decrease of 9.8%.
Although gate receipts increased by 1.4% to a total €192.3 million, this remains significantly behind the other main European leagues and also less than the €200 million level that was constantly exceeded in the past decade. Interestingly, the increase is entirely due to sales of tickets for European Cups matches, even though there are no substantial changes in the number of participants or the performances of the Italian teams from the 2012-2013 season.
The reduction in the total cost of production is driven primarily by the decrease of the following two cost items i) the lease of third-party assets, which refers to the costs of loaned players (which decreased from €48 to €23 million) and the lease costs of the stadia; and ii) other operating costs, which include capital losses on the disposal of players (which decreased from €67 million to €42 million). It is also highlighted that the costs of services, which include commissions to players’ agents, increased by 5.7%.
For the first time in five years, the incidence of employee costs on revenues drops below 60%, to 58%. The total costs related to players and coaches decreased by 1.6%, from €1,102.5 million to €1,085 million. However, the trend of increasing costs regarding non-registered employees (administrative and managerial staff) continues, rising from €91.2 million to €102.7 million.
Breakdown of costs 2009-2014
%
13-1409-10 10-11 11-12 12-13
100%
0%
11%
15%
19%
15%
12%
51%
21%
11%
14%
50%
22%
10%
14%
50%
22%
12%
14%
48%
Depreciations and amortisations
Other costs
Service costs
Employee costs
Lease costs3%4% 4% 4%3%
22%
49%
%
13-1409-10 10-11 11-12 12-13
100%
0%
15%
19%
8%
13%7%
43%
15%
18%
11%
48%
16%
18%
10%
9%
46%
16%
20%
9%
11%
43%
15%
20%
8%
12%
43%
1%1% 1% 1% 2%
Profit on disposal of players
Broadcasting rights income
Commercial and sponsorship income
Other income
Gate receipt
Solidarities
16
ECONOMIC PROFILE OF SERIE B
Average value and cost of production 2009-2014
Value of production Cost of production
13-1409-10 10-11 11-12 12-13
50
0
€ m
illio
n
19.0
15.2
19.1
14.3
18.5
15.2
21.1
17.5
16.2
13.0
Average net result 2009-2014
13-1409-10 10-11 11-12 12-13
(90)
0
€ m
illio
n
-3.0-2.5
-3.3
-4.1-3.9
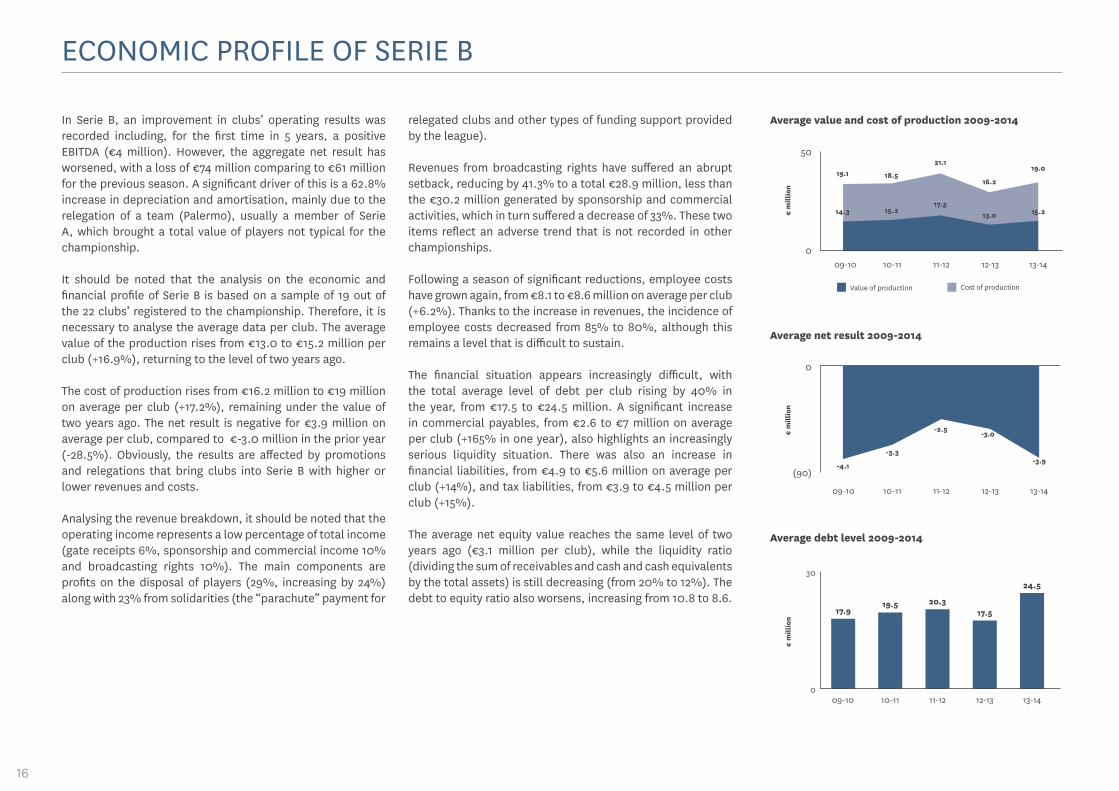
In Serie B, an improvement in clubs’ operating results was recorded including, for the first time in 5 years, a positive EBITDA (€4 million). However, the aggregate net result has worsened, with a loss of €74 million comparing to €61 million for the previous season. A significant driver of this is a 62.8% increase in depreciation and amortisation, mainly due to the relegation of a team (Palermo), usually a member of Serie A, which brought a total value of players not typical for the championship.
It should be noted that the analysis on the economic and financial profile of Serie B is based on a sample of 19 out of the 22 clubs’ registered to the championship. Therefore, it is necessary to analyse the average data per club. The average value of the production rises from €13.0 to €15.2 million per club (+16.9%), returning to the level of two years ago.
The cost of production rises from €16.2 million to €19 million on average per club (+17.2%), remaining under the value of two years ago. The net result is negative for €3.9 million on average per club, compared to €-3.0 million in the prior year (-28.5%). Obviously, the results are affected by promotions and relegations that bring clubs into Serie B with higher or lower revenues and costs.
Analysing the revenue breakdown, it should be noted that the operating income represents a low percentage of total income (gate receipts 6%, sponsorship and commercial income 10% and broadcasting rights 10%). The main components are profits on the disposal of players (29%, increasing by 24%) along with 23% from solidarities (the “parachute” payment for
relegated clubs and other types of funding support provided by the league).
Revenues from broadcasting rights have suffered an abrupt setback, reducing by 41.3% to a total €28.9 million, less than the €30.2 million generated by sponsorship and commercial activities, which in turn suffered a decrease of 33%. These two items reflect an adverse trend that is not recorded in other championships.
Following a season of significant reductions, employee costs have grown again, from €8.1 to €8.6 million on average per club (+6.2%). Thanks to the increase in revenues, the incidence of employee costs decreased from 85% to 80%, although this remains a level that is difficult to sustain.
The financial situation appears increasingly difficult, with the total average level of debt per club rising by 40% in the year, from €17.5 to €24.5 million. A significant increase in commercial payables, from €2.6 to €7 million on average per club (+165% in one year), also highlights an increasingly serious liquidity situation. There was also an increase in financial liabilities, from €4.9 to €5.6 million on average per club (+14%), and tax liabilities, from €3.9 to €4.5 million per club (+15%).
The average net equity value reaches the same level of two years ago (€3.1 million per club), while the liquidity ratio (dividing the sum of receivables and cash and cash equivalents by the total assets) is still decreasing (from 20% to 12%). The debt to equity ratio also worsens, increasing from 10.8 to 8.6.
Average debt level 2009-2014
€ m
illio
n
30
0
17.9
09-10
19.5
10-11
20.3
11-12
17.5
12-13
24.5
13-14
Executive Summ
ary
17
ECONOMIC PROFILE OF LEGA PRO
€ th
ousa
nd
Average cost of production 2009-2014
13-1413-14 09-1009-10 10-1110-11 11-1211-12 12-1312-13
6,000
0
4,561
2,186
4,429
1,814
4,194
1,579
4,340
1,912
4,187
2,255
€ th
ousa
nd
Lega Pro 1st Div.
Lega Pro 1st Div.
Lega Pro 2nd Div.
Lega Pro 2nd Div.
Average value of production 2009-2014
13-1413-14 09-1009-10 10-1110-11 11-1211-12 12-1312-13
4,000
0
3,291
1,549
2,724
1,305
2,541
1,261
2,925
1,593
3,025
1,638
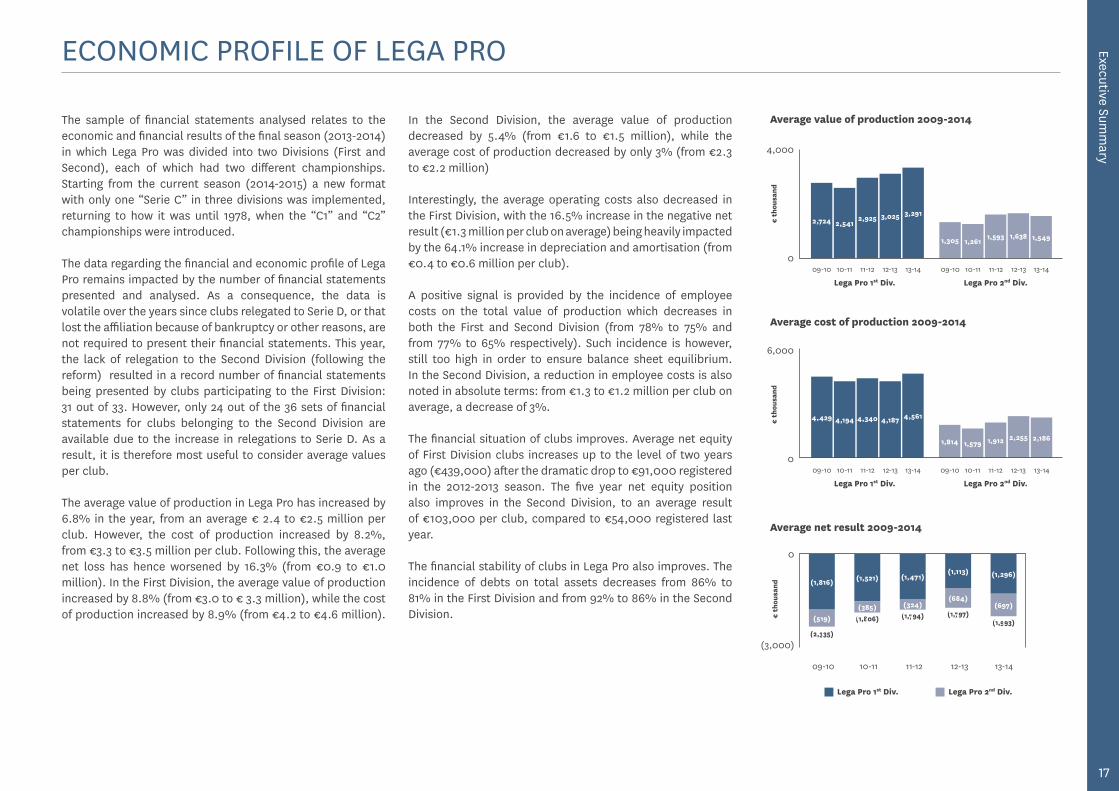
The sample of financial statements analysed relates to the economic and financial results of the final season (2013-2014) in which Lega Pro was divided into two Divisions (First and Second), each of which had two different championships. Starting from the current season (2014-2015) a new format with only one “Serie C” in three divisions was implemented, returning to how it was until 1978, when the “C1” and “C2” championships were introduced.
The data regarding the financial and economic profile of Lega Pro remains impacted by the number of financial statements presented and analysed. As a consequence, the data is volatile over the years since clubs relegated to Serie D, or that lost the affiliation because of bankruptcy or other reasons, are not required to present their financial statements. This year, the lack of relegation to the Second Division (following the reform) resulted in a record number of financial statements being presented by clubs participating to the First Division: 31 out of 33. However, only 24 out of the 36 sets of financial statements for clubs belonging to the Second Division are available due to the increase in relegations to Serie D. As a result, it is therefore most useful to consider average values per club.
The average value of production in Lega Pro has increased by 6.8% in the year, from an average € 2.4 to €2.5 million per club. However, the cost of production increased by 8.2%, from €3.3 to €3.5 million per club. Following this, the average net loss has hence worsened by 16.3% (from €0.9 to €1.0 million). In the First Division, the average value of production increased by 8.8% (from €3.0 to € 3.3 million), while the cost of production increased by 8.9% (from €4.2 to €4.6 million).
In the Second Division, the average value of production decreased by 5.4% (from €1.6 to €1.5 million), while the average cost of production decreased by only 3% (from €2.3 to €2.2 million)
Interestingly, the average operating costs also decreased in the First Division, with the 16.5% increase in the negative net result (€1.3 million per club on average) being heavily impacted by the 64.1% increase in depreciation and amortisation (from €0.4 to €0.6 million per club).
A positive signal is provided by the incidence of employee costs on the total value of production which decreases in both the First and Second Division (from 78% to 75% and from 77% to 65% respectively). Such incidence is however, still too high in order to ensure balance sheet equilibrium. In the Second Division, a reduction in employee costs is also noted in absolute terms: from €1.3 to €1.2 million per club on average, a decrease of 3%.
The financial situation of clubs improves. Average net equity of First Division clubs increases up to the level of two years ago (€439,000) after the dramatic drop to €91,000 registered in the 2012-2013 season. The five year net equity position also improves in the Second Division, to an average result of €103,000 per club, compared to €54,000 registered last year.
The financial stability of clubs in Lega Pro also improves. The incidence of debts on total assets decreases from 86% to 81% in the First Division and from 92% to 86% in the Second Division.
(1,816) (1,521) (1,471)(1,113) (1,296)
€ th
ousa
nd
0
(3,000)
09-10 10-11 11-12 12-13 13-14
Average net result 2009-2014
(519)(385) (324)
(684)(697)
Lega Pro 1st Div. Lega Pro 2nd Div.
(2,335)
(1,806) (1,794) (1,797)(1,993)
18
171.7141.6
176.7 155.1 166.1 142.1
Sources of tax and social security contribution by type
Tax and social security contributions of professional football – Total aggregated 2006-2012
€ m
illio
n
Serie A
Bets on football gamesProfessional football
Serie B
Lega Pro 1st Div.
Lega Pro 2nd Div.
1,200.0
0.02006 2007 2008 2009 2010 2011
692.9 784.3 856.8 874.3 903.7
864.5 925.81,033.5 1,029.4 1,069.8 1,033.7
891.6
138.4
2012
1,022.9
884.6
€ 5.9 billion
77.3%
15.6%
5.1%2.0%
Maximum tax rate on personal income as at 31/12/14
Tax
rate
80%
0%
Fran
ce
Port
ugal
Net
herl
ands
Spai
n
Ger
man
y
Italy
Unite
d Ki
ngdo
m
Aust
ralia
Gre
ece
Sout
h Af
rica
Unite
d St
ates
Turk
ey
Braz
il
Russ
ia
Qat
ar
75%
%
53% 52% 52%47.5%46% 45% 45% 42% 40% 39.6% 35% 27.5%
13%
0%
TAX AND SOCIAL SECURITY CONTRIBUTION OF PROFESSIONAL FOOTBALL
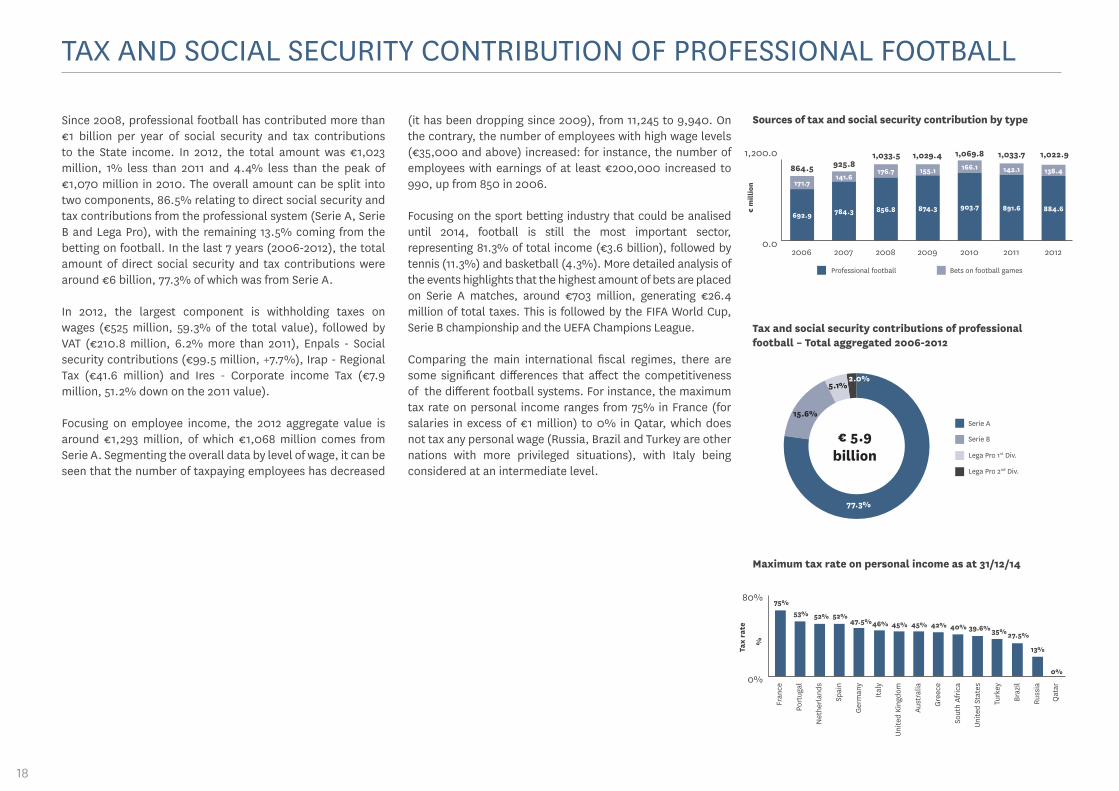
Since 2008, professional football has contributed more than €1 billion per year of social security and tax contributions to the State income. In 2012, the total amount was €1,023 million, 1% less than 2011 and 4.4% less than the peak of €1,070 million in 2010. The overall amount can be split into two components, 86.5% relating to direct social security and tax contributions from the professional system (Serie A, Serie B and Lega Pro), with the remaining 13.5% coming from the betting on football. In the last 7 years (2006-2012), the total amount of direct social security and tax contributions were around €6 billion, 77.3% of which was from Serie A.
In 2012, the largest component is withholding taxes on wages (€525 million, 59.3% of the total value), followed by VAT (€210.8 million, 6.2% more than 2011), Enpals - Social security contributions (€99.5 million, +7.7%), Irap - Regional Tax (€41.6 million) and Ires - Corporate income Tax (€7.9 million, 51.2% down on the 2011 value).
Focusing on employee income, the 2012 aggregate value is around €1,293 million, of which €1,068 million comes from Serie A. Segmenting the overall data by level of wage, it can be seen that the number of taxpaying employees has decreased
(it has been dropping since 2009), from 11,245 to 9,940. On the contrary, the number of employees with high wage levels (€35,000 and above) increased: for instance, the number of employees with earnings of at least €200,000 increased to 990, up from 850 in 2006.
Focusing on the sport betting industry that could be analised until 2014, football is still the most important sector, representing 81.3% of total income (€3.6 billion), followed by tennis (11.3%) and basketball (4.3%). More detailed analysis of the events highlights that the highest amount of bets are placed on Serie A matches, around €703 million, generating €26.4 million of total taxes. This is followed by the FIFA World Cup, Serie B championship and the UEFA Champions League.
Comparing the main international fiscal regimes, there are some significant differences that affect the competitiveness of the different football systems. For instance, the maximum tax rate on personal income ranges from 75% in France (for salaries in excess of €1 million) to 0% in Qatar, which does not tax any personal wage (Russia, Brazil and Turkey are other nations with more privileged situations), with Italy being considered at an intermediate level.
Executive Summ
ary
19
Aggregated revenues and costs comparison of European Top Division clubs
Aggregated net result comparison of European Top Division clubs
Comparison with North American sport – Average revenues by club
Total revenues Total costs
2009 2010 2011 2012 2013
20.0
0.0
€ bi
llio
n 11.712.9 12.8
14.413.2
14.8 14.115.2 15.015.8
€ bi
llio
n
%
Net result
0.0 0%
-2.0 -14%
2009 2010 2011 2012 2013
-1.2-1.6 -1.7
-1.1-0.8
Net result/revenues
-10.2%
-12.7% -12.7%
-7.8%
-5.3%
INTERNATIONAL BENCHMARKING
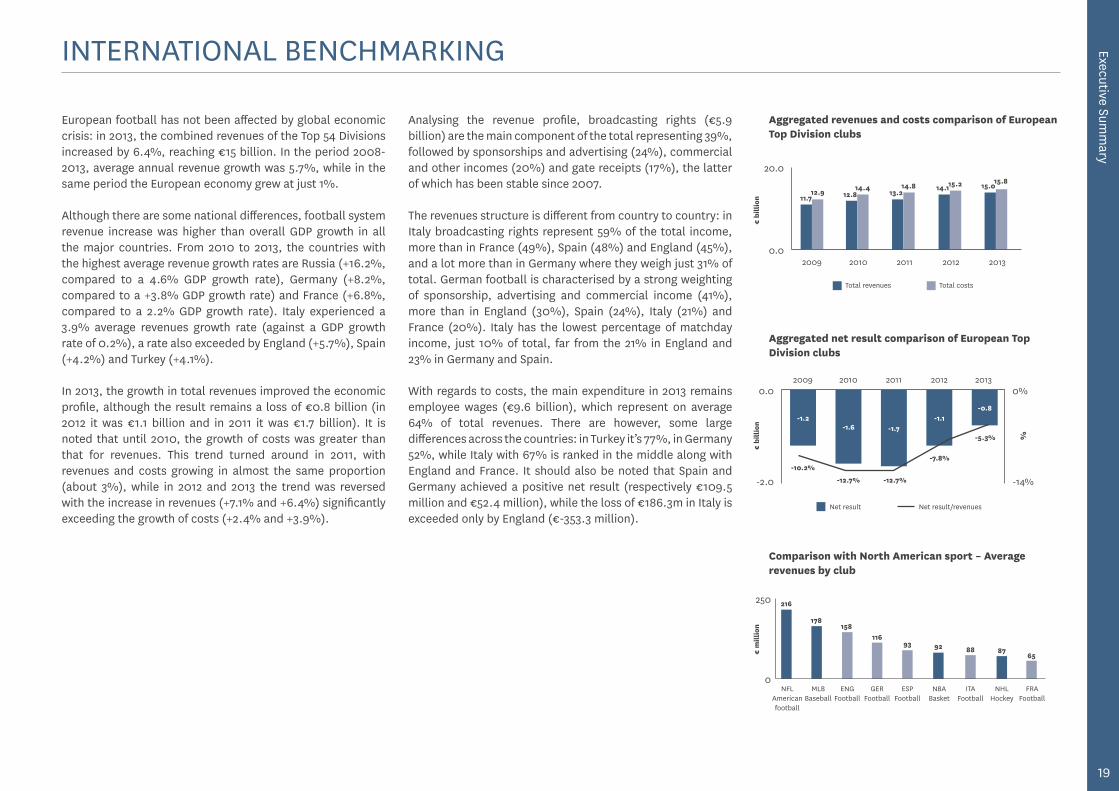
European football has not been affected by global economic crisis: in 2013, the combined revenues of the Top 54 Divisions increased by 6.4%, reaching €15 billion. In the period 2008-2013, average annual revenue growth was 5.7%, while in the same period the European economy grew at just 1%.
Although there are some national differences, football system revenue increase was higher than overall GDP growth in all the major countries. From 2010 to 2013, the countries with the highest average revenue growth rates are Russia (+16.2%, compared to a 4.6% GDP growth rate), Germany (+8.2%, compared to a +3.8% GDP growth rate) and France (+6.8%, compared to a 2.2% GDP growth rate). Italy experienced a 3.9% average revenues growth rate (against a GDP growth rate of 0.2%), a rate also exceeded by England (+5.7%), Spain (+4.2%) and Turkey (+4.1%).
In 2013, the growth in total revenues improved the economic profile, although the result remains a loss of €0.8 billion (in 2012 it was €1.1 billion and in 2011 it was €1.7 billion). It is noted that until 2010, the growth of costs was greater than that for revenues. This trend turned around in 2011, with revenues and costs growing in almost the same proportion (about 3%), while in 2012 and 2013 the trend was reversed with the increase in revenues (+7.1% and +6.4%) significantly exceeding the growth of costs (+2.4% and +3.9%).
Analysing the revenue profile, broadcasting rights (€5.9 billion) are the main component of the total representing 39%, followed by sponsorships and advertising (24%), commercial and other incomes (20%) and gate receipts (17%), the latter of which has been stable since 2007.
The revenues structure is different from country to country: in Italy broadcasting rights represent 59% of the total income, more than in France (49%), Spain (48%) and England (45%), and a lot more than in Germany where they weigh just 31% of total. German football is characterised by a strong weighting of sponsorship, advertising and commercial income (41%), more than in England (30%), Spain (24%), Italy (21%) and France (20%). Italy has the lowest percentage of matchday income, just 10% of total, far from the 21% in England and 23% in Germany and Spain.
With regards to costs, the main expenditure in 2013 remains employee wages (€9.6 billion), which represent on average 64% of total revenues. There are however, some large differences across the countries: in Turkey it’s 77%, in Germany 52%, while Italy with 67% is ranked in the middle along with England and France. It should also be noted that Spain and Germany achieved a positive net result (respectively €109.5 million and €52.4 million), while the loss of €186.3m in Italy is exceeded only by England (€-353.3 million).
€ m
illio
n
250
0
216
158116
93
NFL American football
MLB Baseball
ENG Football
GER Football
ESP Football
NBA Basket
ITA Football
NHL Hockey
FRA Football
178
92 88 8765
20
Average attendance per match – Worldwide Top Divisions 2013-2014
Spec
tato
rs
50,000
0
Ger
man
y
Engl
and
Spai
n
Italy
Mex
ico
Fran
ce
Arge
ntin
a
Net
herl
ands
Unite
d St
ates
Chin
a
43,499
36,670
26,95523,011 22,939 20,953 20,599 19,504 18,743 18,571
Stadium ownership - Aggregated data from 54 Top Divisions 2014
Club’s direct ownership
Associate/parent company ownership
Municipal/State ownership
Other parties ownership698 clubs examined
62%
15%
15%
8%
28.00
23.00
Italy
Turk
ey
Russ
ia
Unite
d Ki
ngdo
m
Spai
n
Fran
ce
Ger
man
y
Port
ugal
Scot
land
Net
herl
ands
27.32
European Top Divisions - Average age of football players
26.78 26.70 26.7026.39
25.9225.63 25.57
24.98 24.54
Avg
. age
(ye
ars)
INTERNATIONAL BENCHMARKING
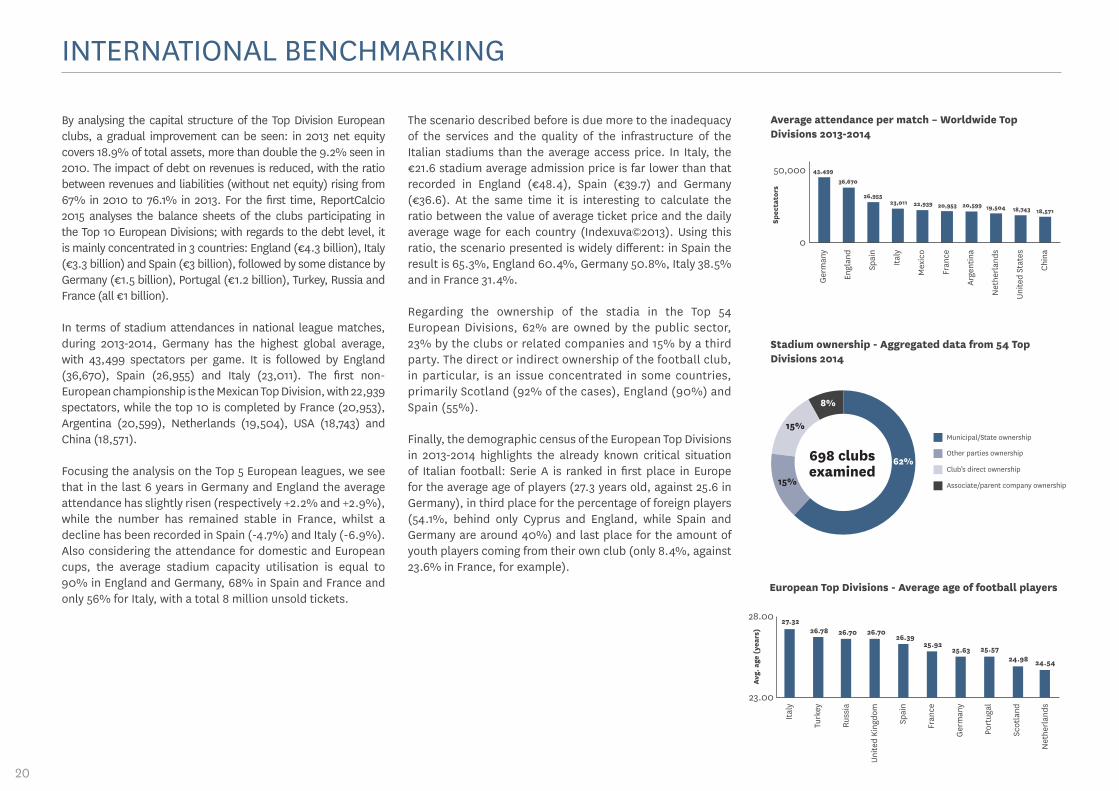
By analysing the capital structure of the Top Division European clubs, a gradual improvement can be seen: in 2013 net equity covers 18.9% of total assets, more than double the 9.2% seen in 2010. The impact of debt on revenues is reduced, with the ratio between revenues and liabilities (without net equity) rising from 67% in 2010 to 76.1% in 2013. For the first time, ReportCalcio 2015 analyses the balance sheets of the clubs participating in the Top 10 European Divisions; with regards to the debt level, it is mainly concentrated in 3 countries: England (€4.3 billion), Italy (€3.3 billion) and Spain (€3 billion), followed by some distance by Germany (€1.5 billion), Portugal (€1.2 billion), Turkey, Russia and France (all €1 billion).
In terms of stadium attendances in national league matches, during 2013-2014, Germany has the highest global average, with 43,499 spectators per game. It is followed by England (36,670), Spain (26,955) and Italy (23,011). The first non-European championship is the Mexican Top Division, with 22,939 spectators, while the top 10 is completed by France (20,953), Argentina (20,599), Netherlands (19,504), USA (18,743) and China (18,571).
Focusing the analysis on the Top 5 European leagues, we see that in the last 6 years in Germany and England the average attendance has slightly risen (respectively +2.2% and +2.9%), while the number has remained stable in France, whilst a decline has been recorded in Spain (-4.7%) and Italy (-6.9%). Also considering the attendance for domestic and European cups, the average stadium capacity utilisation is equal to 90% in England and Germany, 68% in Spain and France and only 56% for Italy, with a total 8 million unsold tickets.
The scenario described before is due more to the inadequacy of the services and the quality of the infrastructure of the Italian stadiums than the average access price. In Italy, the €21.6 stadium average admission price is far lower than that recorded in England (€48.4), Spain (€39.7) and Germany (€36.6). At the same time it is interesting to calculate the ratio between the value of average ticket price and the daily average wage for each country (Indexuva©2013). Using this ratio, the scenario presented is widely different: in Spain the result is 65.3%, England 60.4%, Germany 50.8%, Italy 38.5% and in France 31.4%.
Regarding the ownership of the stadia in the Top 54 European Divisions, 62% are owned by the public sector, 23% by the clubs or related companies and 15% by a third party. The direct or indirect ownership of the football club, in particular, is an issue concentrated in some countries, primarily Scotland (92% of the cases), England (90%) and Spain (55%).
Finally, the demographic census of the European Top Divisions in 2013-2014 highlights the already known critical situation of Italian football: Serie A is ranked in first place in Europe for the average age of players (27.3 years old, against 25.6 in Germany), in third place for the percentage of foreign players (54.1%, behind only Cyprus and England, while Spain and Germany are around 40%) and last place for the amount of youth players coming from their own club (only 8.4%, against 23.6% in France, for example).

Executive Summ
ary
21
23%
28%
56%55%
8.68.48.99.29.4
Average utilisation of stadium capacity
80%
0%10-11 11-12 12-13
Serie A
Serie B
Lega Pro 1st Division
Lega Pro 2nd Division
59%
30%
20%
26%
12%
32%
26%
14%
Comparison of aggregated number of spectators in professional football
14.5
0.012-1308-09 09-10 10-11 11-12
2.3
1.30.4
2.6
1.40.8
2.6
1.7
2.4
1.50.5
2.9
1.30.6
13-14
2.6
1.20.5
8.7
Serie A
Serie B
Lega Pro 1st DivisionLega Pro 2nd Division
Spec
tato
rs (
mill
ion)
13-14
23%
33%
58%
19%
%
Opening year of professional football’s stadiums, by cluster
100%
0%Serie A Serie B Lega Pro
1st Division
Before 1949
1950-1989
1990-today
Not available
%
Lega Pro2nd Division
50%
31%
19%
41%
50%
9%
45%
42%
12%
40%
37%
17%
6%
STADIUMS, SPECTATORS AND SECURITY
During the 2013-2014 season the total number of spectators who have attended matches in the professional championships was 13.1 million, an increase of 6% compared to the previous season. As a result, the negative trend which was constant since the 2009-2010 season (during that year the total aggregate exceeded 14.1 million) has ended. In terms of average attendance, all the professional leagues recorded a slight increase: for Serie A from 22,591 to 23,011, for Serie B from 4,848 to 5,504, for Lega Pro from 1,935 to 2,240 (First Division) and from 707 to 864 (Second Division).
The numbers regarding the other Italian competitions are rising too; for example, the average attendance for the 6 matches of the National A Team was 33,408, an increase of 34.7% compared to 2012-2013.
Despite this slight improvement, the situation remains critical: the average stadium capacity utilization exceeds 50% only in Serie A (where it reaches 58%), falling to 33% in Serie B and 23% and 19% in Lega Pro First and Second Divison. These figures are directly connected to the fact that Italian stadia are old and underdeveloped, both in terms of infrastructure and services offered.
According to the Stadia Database study, the average age of Serie A stadiums is 61 years, and is only slightly lower in the other professional leagues. In 2013-2014 there is only one stadium directly owned by a club (the Juventus Stadium),
while the average percentage of covered seats in the stadia exceeds 70% only in Serie A, decreasing to 40% in Serie B and 37% in Lega Pro. Approximately 40% of the stadia used in the professional leagues contain athletics tracks, which significantly worsen spectator visibility. In 25% of Serie A stadia, the infrastructure cannot be used for other activities, a percentage that rises up to 51% in Lega Pro and 68% in Serie B.
Regarding the facilities, in Serie A one stadium in 4 has no store for commercial activities, and this indicator ranges between 50% and 60% for the other professional leagues. There are also significant deficiencies in terms of sustainability. Stadia using sources of renewable energy are very few: one out of 16 in Serie A, 3 out of 22 in Serie B and 2 out of 57 in Lega Pro.
Regarding security, there is an evident trend of improvement over the last 10 years, although the season 2013-2014 indicates a slight deterioration compared to the season before: there were 59 matches with people injured, far less then the 209 in 2004-2005 and the 81 in 2009-2010, but slightly increasing compared to the 43 in 2012-2013. The same trend exists for the number of people reported and arrested (1,003 and 105 respectively), which increased from the season 2011-2012. Finally, it should be noted that the number of stewards employed totalled 206,998, the highest number ever recorded, with the exception of 2010-2011 season, where there were 211,846.
0.7 12.3
14.1 14.113.4 13.2 13.1
22
82.2
76.0
47.316.5
221.1
40.751.614.2
366.2
51.7
Comparison of recapitalisations – professional clubs 2013-2014
Average number of members of the Board of Directors
Ave
rage
num
ber
of d
irec
tors 8.0
0.010-11 11-12 12-13
€ m
illio
n
490.0
011-12 12-13 13-14
33.3
13-14
7.2
4.0
4.9
3.7
7.5
4.8
3.7
3.2
7.1
4.0
4.0
3.4
6.4
3.7 4
.13.
3
9.6
Average percentage of main shareholder’s ownership 2013-2014
100%
0%Serie A Serie B Lega Pro
1st Div.
%
Lega Pro 2nd Div.
88.2%
79.4%74.7%
62.3%
GOVERNANCE MODELS IN PROFESSIONAL FOOTBALL
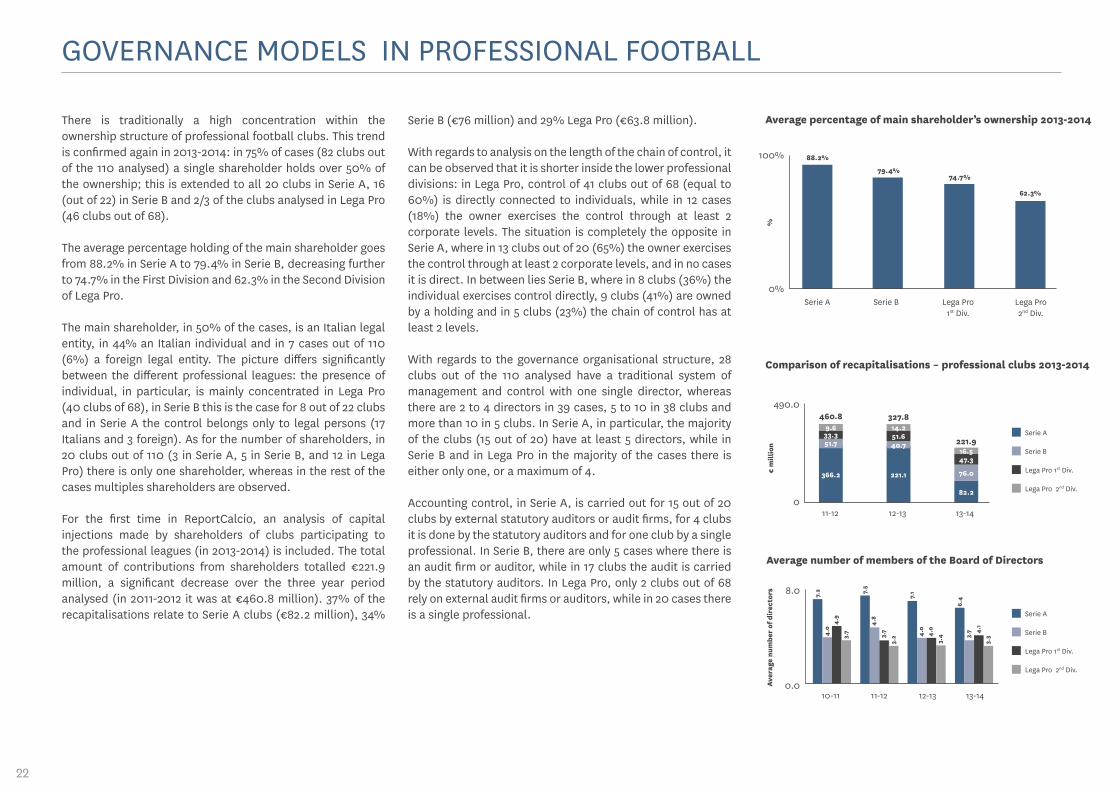
There is traditionally a high concentration within the ownership structure of professional football clubs. This trend is confirmed again in 2013-2014: in 75% of cases (82 clubs out of the 110 analysed) a single shareholder holds over 50% of the ownership; this is extended to all 20 clubs in Serie A, 16 (out of 22) in Serie B and 2/3 of the clubs analysed in Lega Pro (46 clubs out of 68).
The average percentage holding of the main shareholder goes from 88.2% in Serie A to 79.4% in Serie B, decreasing further to 74.7% in the First Division and 62.3% in the Second Division of Lega Pro.
The main shareholder, in 50% of the cases, is an Italian legal entity, in 44% an Italian individual and in 7 cases out of 110 (6%) a foreign legal entity. The picture differs significantly between the different professional leagues: the presence of individual, in particular, is mainly concentrated in Lega Pro (40 clubs of 68), in Serie B this is the case for 8 out of 22 clubs and in Serie A the control belongs only to legal persons (17 Italians and 3 foreign). As for the number of shareholders, in 20 clubs out of 110 (3 in Serie A, 5 in Serie B, and 12 in Lega Pro) there is only one shareholder, whereas in the rest of the cases multiples shareholders are observed.
For the first time in ReportCalcio, an analysis of capital injections made by shareholders of clubs participating to the professional leagues (in 2013-2014) is included. The total amount of contributions from shareholders totalled €221.9 million, a significant decrease over the three year period analysed (in 2011-2012 it was at €460.8 million). 37% of the recapitalisations relate to Serie A clubs (€82.2 million), 34%
Serie B (€76 million) and 29% Lega Pro (€63.8 million).
With regards to analysis on the length of the chain of control, it can be observed that it is shorter inside the lower professional divisions: in Lega Pro, control of 41 clubs out of 68 (equal to 60%) is directly connected to individuals, while in 12 cases (18%) the owner exercises the control through at least 2 corporate levels. The situation is completely the opposite in Serie A, where in 13 clubs out of 20 (65%) the owner exercises the control through at least 2 corporate levels, and in no cases it is direct. In between lies Serie B, where in 8 clubs (36%) the individual exercises control directly, 9 clubs (41%) are owned by a holding and in 5 clubs (23%) the chain of control has at least 2 levels.
With regards to the governance organisational structure, 28 clubs out of the 110 analysed have a traditional system of management and control with one single director, whereas there are 2 to 4 directors in 39 cases, 5 to 10 in 38 clubs and more than 10 in 5 clubs. In Serie A, in particular, the majority of the clubs (15 out of 20) have at least 5 directors, while in Serie B and in Lega Pro in the majority of the cases there is either only one, or a maximum of 4.
Accounting control, in Serie A, is carried out for 15 out of 20 clubs by external statutory auditors or audit firms, for 4 clubs it is done by the statutory auditors and for one club by a single professional. In Serie B, there are only 5 cases where there is an audit firm or auditor, while in 17 clubs the audit is carried by the statutory auditors. In Lega Pro, only 2 clubs out of 68 rely on external audit firms or auditors, while in 20 cases there is a single professional.
460.8 327.8
221.9Serie A
Serie A
Serie B
Serie B
Lega Pro 1st Div.
Lega Pro 1st Div.
Lega Pro 2nd Div.
Lega Pro 2nd Div.
Executive Summ
ary
23
10,000
0Spectators Media Event
production
Net direct economic impact
€ th
ousa
nd
8,752
1,2382,600
Continents of origin of audience at the stadium
Europe
Asia
South America
Africa
79 represented
countries49%
27%
11%
8%
North and Central America
Oceania
4% 1%
Gross direct economic impact
Net direct impact
Other expenses not beneficial to the Metropolitan Area of Turin
€ 17.5million
€ 12.6 m(72%)
THE LEGACY OF THE 2013-2014 UEFA EUROPA LEAGUE FINAL
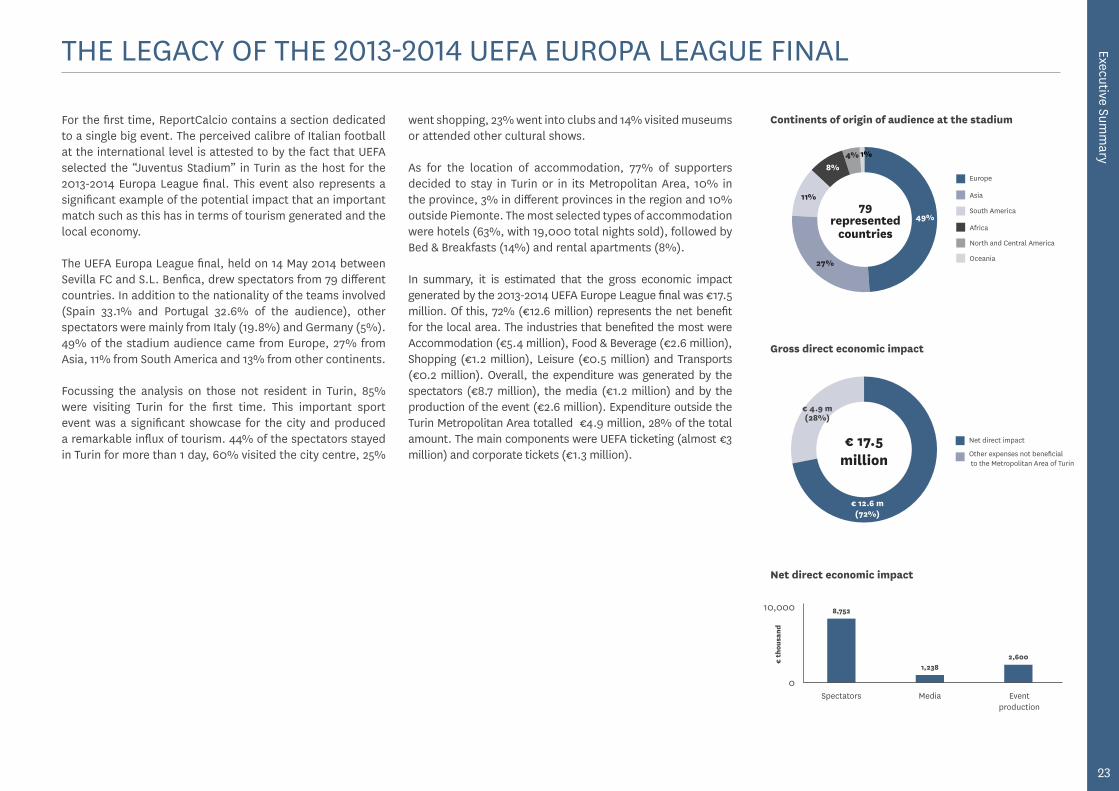
For the first time, ReportCalcio contains a section dedicated to a single big event. The perceived calibre of Italian football at the international level is attested to by the fact that UEFA selected the “Juventus Stadium” in Turin as the host for the 2013-2014 Europa League final. This event also represents a significant example of the potential impact that an important match such as this has in terms of tourism generated and the local economy.
The UEFA Europa League final, held on 14 May 2014 between Sevilla FC and S.L. Benfica, drew spectators from 79 different countries. In addition to the nationality of the teams involved (Spain 33.1% and Portugal 32.6% of the audience), other spectators were mainly from Italy (19.8%) and Germany (5%). 49% of the stadium audience came from Europe, 27% from Asia, 11% from South America and 13% from other continents.
Focussing the analysis on those not resident in Turin, 85% were visiting Turin for the first time. This important sport event was a significant showcase for the city and produced a remarkable influx of tourism. 44% of the spectators stayed in Turin for more than 1 day, 60% visited the city centre, 25%
went shopping, 23% went into clubs and 14% visited museums or attended other cultural shows.
As for the location of accommodation, 77% of supporters decided to stay in Turin or in its Metropolitan Area, 10% in the province, 3% in different provinces in the region and 10% outside Piemonte. The most selected types of accommodation were hotels (63%, with 19,000 total nights sold), followed by Bed & Breakfasts (14%) and rental apartments (8%).
In summary, it is estimated that the gross economic impact generated by the 2013-2014 UEFA Europe League final was €17.5 million. Of this, 72% (€12.6 million) represents the net benefit for the local area. The industries that benefited the most were Accommodation (€5.4 million), Food & Beverage (€2.6 million), Shopping (€1.2 million), Leisure (€0.5 million) and Transports (€0.2 million). Overall, the expenditure was generated by the spectators (€8.7 million), the media (€1.2 million) and by the production of the event (€2.6 million). Expenditure outside the Turin Metropolitan Area totalled €4.9 million, 28% of the total amount. The main components were UEFA ticketing (almost €3 million) and corporate tickets (€1.3 million).
€ 4.9 m(28%)
24
HIGHLIGHTS
CENSUS OF ITALIAN FOOTBALL
NATIONAL FOOTBALL TEAMS
AMATEUR AND YOUTH FOOTBALL
ECONOMIC PROFILE OF PROFESSIONAL FOOTBALL
TAX AND SOCIAL SECURITY CONTRIBUTION OF PROFESSIONAL FOOTBALL
INTERNATIONAL BENCHMARKING
STADIUMS, SPECTATORS AND SECURITY
GOVERNANCE MODELS IN PROFESSIONAL FOOTBALL
THE LEGACY OF THE 2013-2014 UEFA EUROPA LEAGUE FINAL
Executive Summ
ary
25
26
CENSUS OF ITALIAN FOOTBALL
2009-2010 2010-2011 2011-2012 2012-2013 2013-2014 CAGR 2009-2014
Clubs 14,690 14,653 14,451 13,908 13,652 -1.8%
Professionals 132 127 119 111 111 -4.2%
Amateurs 11,642 11,469 11,260 10,702 10,316 -3.0%
Youth and School Sector 2,916 3,057 3,072 3,095 3,225 +2.5%
Teams 69,908 71,689 70,329 60,210 62,295 -2.8%
Professionals 484 470 455 475 468 -0.8%
Amateurs 17,157 17,020 16,570 15,658 15,521 -2.5%
Youth and School Sector 52,267 54,199 53,304 44,077 46,306 -3.0%
Registered players 1,108,479 1,151,437 1,117,447 1,098,450 1,073,286 -0.8%
Professional Activity 14,476 14,477 13,894 12,907 13,062 -2.5%
Professionals 3,517 3,329 3,240 2,951 2,930 -4.5%
Young Professionals 10,959 11,148 10,654 9,956 10,132 -1.9%
Amateur Activity 474,493 466,371 444,653 415,338 393,718 -4.6%
Youth and School Sector 619,510 670,589 658,900 670,205 666,506 +1.8%
Registered FIGC Staff 23,857 24,060 22,057 22,137 23,474 -0.4%
Coaches 22,310 22,476 20,445 20,510 21,792 -0.6%
Athletic Trainers 263 244 289 327 340 +6.6%
Doctors 577 627 573 579 543 -1.5%
Health Professionals 707 713 750 721 799 +3.1%
Referees 33,040 34,728 34,267 34,409 34,381 +1.0%
National Technical Bodies 1,978 1,899 1,918 1,874 1,870 -1.4%
Regional and Sectional Technical Bodies
31,062 32,829 32,349 32,535 32,511 +1.1%
Managers 108,732 132,163 185,396 207,410 240,996 +22.0%
TOTAL registered members 1,274,108 1,342,388 1,359,167 1,362,406 1,372,137 +1.9%
FIGC’s figures
1,372,137The aggregate amount of FIGC’s registered members, including 1,073,286 players, 23,474 coaches and other technical staff, 34,381 referees and 240,996 managers
1 out of 4 athletes25% of the total amount of registered athletes among the 45 Italian Sport Associations (FSN) affiliated to the Italian Olympic Committee (CONI) comes from the Italian FA, while 23% is the overall incidence related to the number of registered clubs among all FSN
19 out of 20The number of Italian regions where football is the sport with most registered players and with the highest number of clubs on the territory (Valle d’Aosta is the only exception)
666,506The amount of young players participating in Youth and School Sector activities. Considering youth activity, Italy is the fourth football movement in Europe, trailing only Germany, France and England
The significant increase of the number of “managers” is due to the implementation (since July 1, 2012) of the Decree related to Mandatory Insurance for all sport amateurs (dated November 3, 2010). The Decree has led to a higher number of so called “officials” (team and referee liaison officers, officials operating as partial umpires and substituting coaches in all situations provided for by law), in any case not related to other administrative roles such as “executives” and “sport management collaborators”.
Source: FIGC data up to June 30, 2014
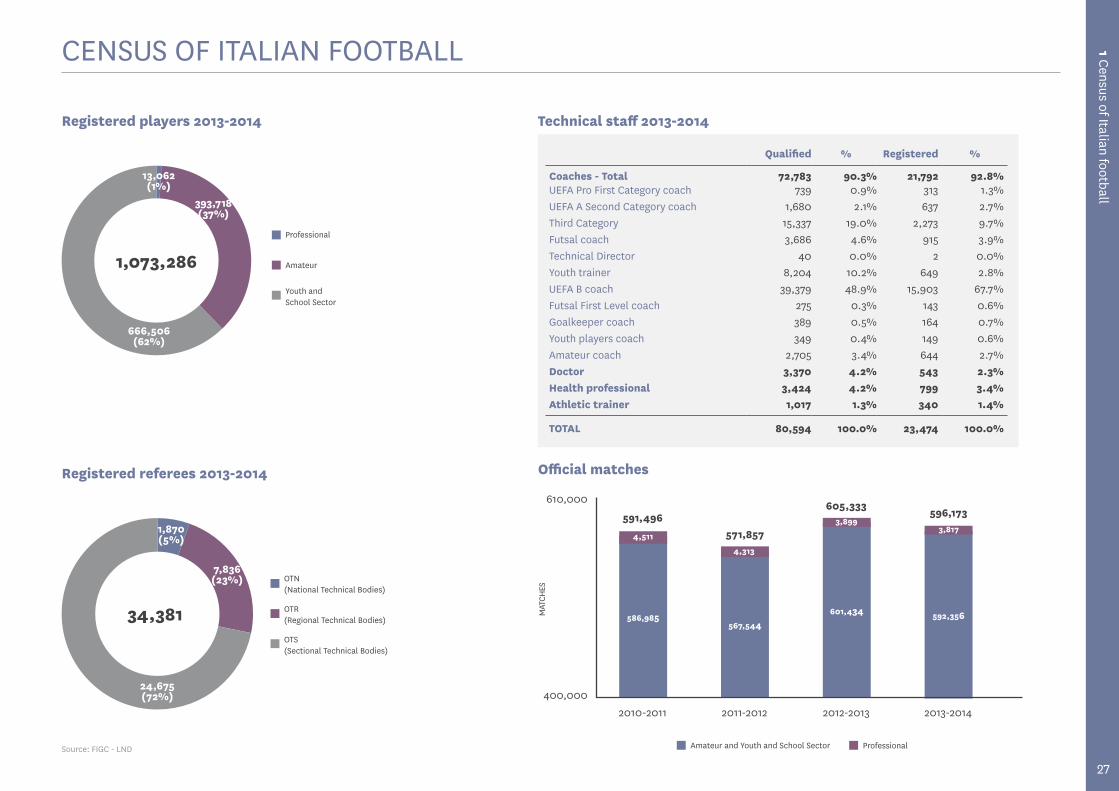
1 Census of Italian football
27
Source: FIGC - LND
CENSUS OF ITALIAN FOOTBALL
Registered players 2013-2014 Technical staff 2013-2014
1,073,286
393,718(37%)
666,506(62%)
13,062(1%)
Professional
Youth and School Sector
Amateur
Registered referees 2013-2014
Qualified % Registered %
Coaches - Total 72,783 90.3% 21,792 92.8%UEFA Pro First Category coach 739 0.9% 313 1.3%UEFA A Second Category coach 1,680 2.1% 637 2.7%Third Category 15,337 19.0% 2,273 9.7%Futsal coach 3,686 4.6% 915 3.9%Technical Director 40 0.0% 2 0.0%Youth trainer 8,204 10.2% 649 2.8%UEFA B coach 39,379 48.9% 15,903 67.7%Futsal First Level coach 275 0.3% 143 0.6%Goalkeeper coach 389 0.5% 164 0.7%Youth players coach 349 0.4% 149 0.6%Amateur coach 2,705 3.4% 644 2.7%Doctor 3,370 4.2% 543 2.3%Health professional 3,424 4.2% 799 3.4%Athletic trainer 1,017 1.3% 340 1.4%
TOTAL 80,594 100.0% 23,474 100.0%
MAT
CHES
610,000
400,0002010-2011
586,985
2011-2012
567,544
591,496571,857
596,173605,333
2012-2013
601,434
2013-2014
592,356
Official matches
4,511
4,313
3,8993,817
ProfessionalAmateur and Youth and School Sector
OTN (National Technical Bodies)
OTS (Sectional Technical Bodies)
OTR (Regional Technical Bodies)
24,675(72%)
7,836(23%)
1,870(5%)
34,381
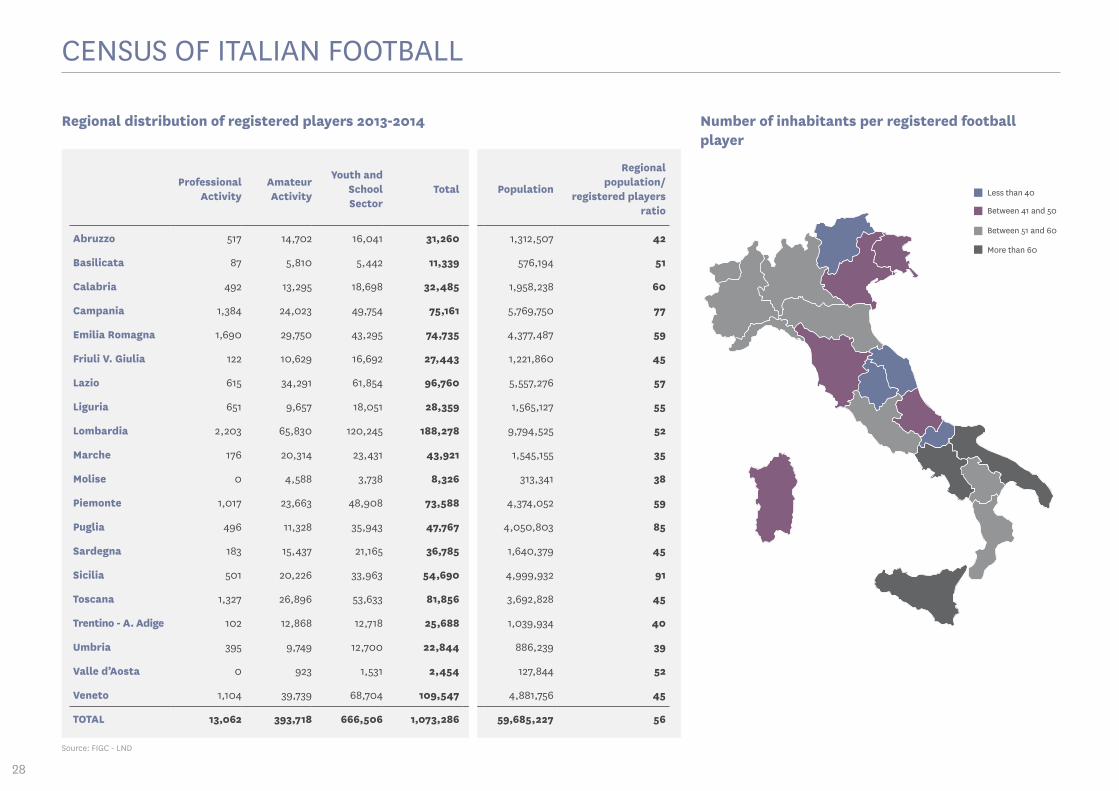
28
CENSUS OF ITALIAN FOOTBALL
Professional Activity
Amateur Activity
Youth and School Sector
Total Population
Regional population/
registered players ratio
Abruzzo 517 14,702 16,041 31,260 1,312,507 42
Basilicata 87 5,810 5,442 11,339 576,194 51
Calabria 492 13,295 18,698 32,485 1,958,238 60
Campania 1,384 24,023 49,754 75,161 5,769,750 77
Emilia Romagna 1,690 29,750 43,295 74,735 4,377,487 59
Friuli V. Giulia 122 10,629 16,692 27,443 1,221,860 45
Lazio 615 34,291 61,854 96,760 5,557,276 57
Liguria 651 9,657 18,051 28,359 1,565,127 55
Lombardia 2,203 65,830 120,245 188,278 9,794,525 52
Marche 176 20,314 23,431 43,921 1,545,155 35
Molise 0 4,588 3,738 8,326 313,341 38
Piemonte 1,017 23,663 48,908 73,588 4,374,052 59
Puglia 496 11,328 35,943 47,767 4,050,803 85
Sardegna 183 15,437 21,165 36,785 1,640,379 45
Sicilia 501 20,226 33,963 54,690 4,999,932 91
Toscana 1,327 26,896 53,633 81,856 3,692,828 45
Trentino - A. Adige 102 12,868 12,718 25,688 1,039,934 40
Umbria 395 9,749 12,700 22,844 886,239 39
Valle d’Aosta 0 923 1,531 2,454 127,844 52
Veneto 1,104 39,739 68,704 109,547 4,881,756 45
TOTAL 13,062 393,718 666,506 1,073,286 59,685,227 56
Less than 40
Between 51 and 60
Between 41 and 50
More than 60
Number of inhabitants per registered football player
Regional distribution of registered players 2013-2014
Source: FIGC - LND
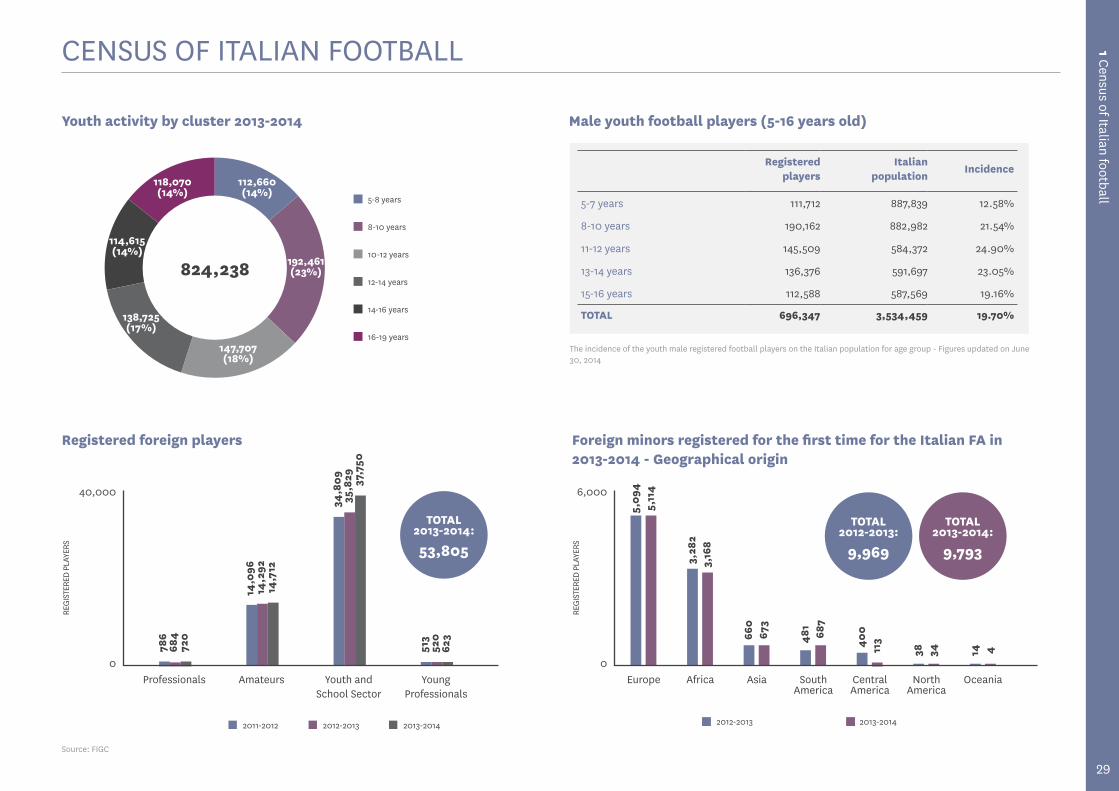
1 Census of Italian football
29
CENSUS OF ITALIAN FOOTBALL
Registered foreign players
Youth activity by cluster 2013-2014 Male youth football players (5-16 years old)
5-8 years
8-10 years
10-12 years
12-14 years
14-16 years
16-19 years
2011-2012 2012-2013 2013-2014
Registered players
Italian population
Incidence
5-7 years 111,712 887,839 12.58%
8-10 years 190,162 882,982 21.54%
11-12 years 145,509 584,372 24.90%
13-14 years 136,376 591,697 23.05%
15-16 years 112,588 587,569 19.16%
TOTAL 696,347 3,534,459 19.70%
REGI
STER
ED P
LAYE
RS
REGI
STER
ED P
LAYE
RS
6,00040,000
00
Foreign minors registered for the first time for the Italian FA in 2013-2014 - Geographical origin
Europe
5,09
4
Professionals
786
684
720
Amateurs
14,0
9614
,292
14,7
12
Youth and School Sector
34,8
0935
,829 37
,750
5,11
4
3,28
23,
168
660
673
481
687
400
113
38 34 14 4
Africa Asia South America
Central America
North America
Oceania
513
520
623
Young Professionals
2013-20142012-2013
Source: FIGC
TOTAL 2012-2013:
9,969
TOTAL 2013-2014:
53,805
TOTAL 2013-2014:
9,793
The incidence of the youth male registered football players on the Italian population for age group - Figures updated on June 30, 2014
192,461(23%)
114,615(14%)
112,660(14%)
147,707(18%)
118,070(14%)
138,725(17%)
824,238
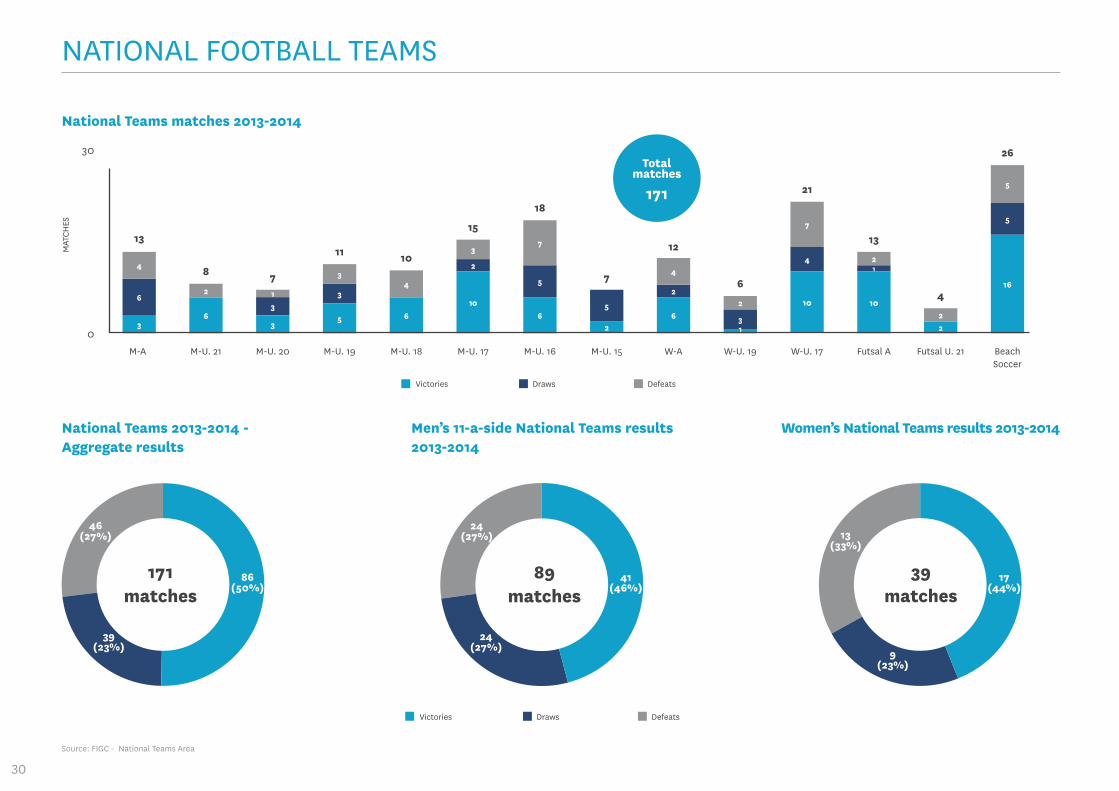
30
NATIONAL FOOTBALL TEAMS
13
8 7
11 10
15
18
7
12
6
21
13
4
26
MAT
CHES
3
63
3
2
5
5
2
3
14
5
4
2
2
2
7
5
2 1
3
37
4
4
63
5 610
62
106
10
2
16
30
0
National Teams matches 2013-2014
M-A M-U. 21 M-U. 20 M-U. 19 M-U. 18 M-U. 17 M-U. 16 M-U. 15 W-A W-U. 19 W-U. 17 Futsal A Futsal U. 21 Beach Soccer
1
DrawsVictories Defeats
DrawsVictories Defeats
National Teams 2013-2014 - Aggregate results
171matches
86(50%)
39(23%)
46(27%)
Men’s 11-a-side National Teams results 2013-2014
89matches
41(46%)
24(27%)
24(27%)
Women’s National Teams results 2013-2014
39matches
13(33%)
9(23%)
17(44%)
Source: FIGC - National Teams Area
Totalmatches
171
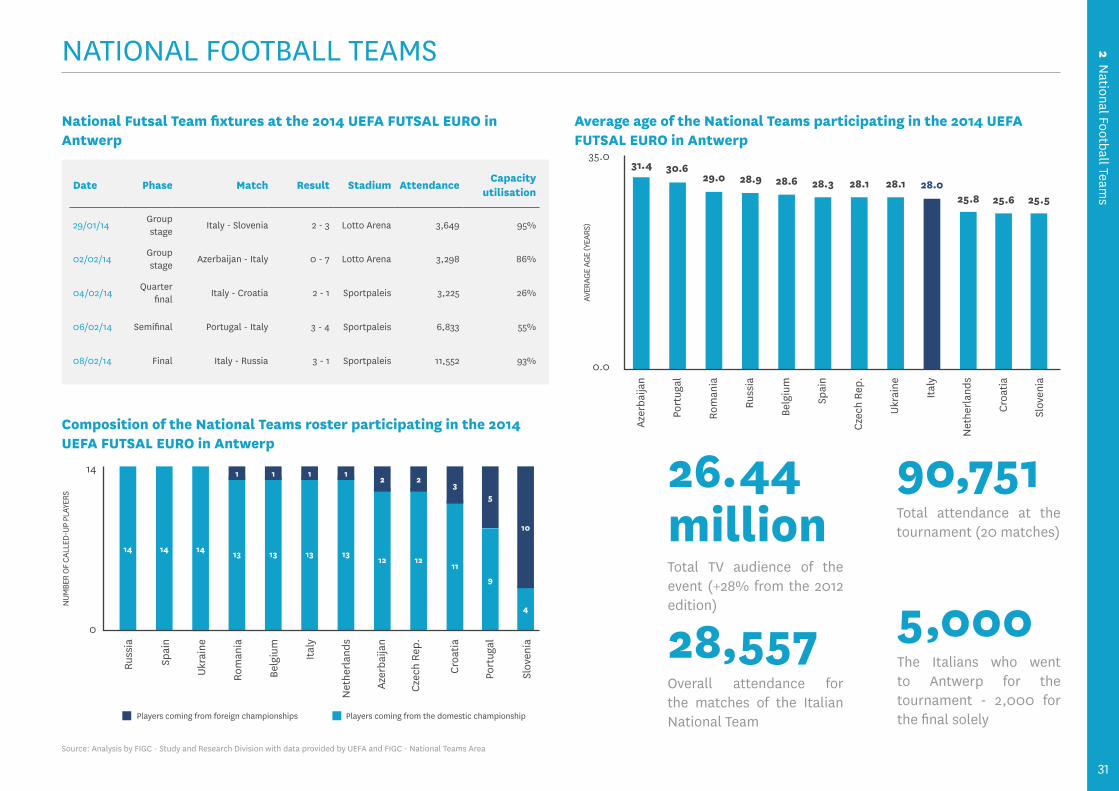
2 National Football Team
s
31
NATIONAL FOOTBALL TEAMS
Date Phase Match Result Stadium AttendanceCapacity
utilisation
29/01/14Group stage
Italy - Slovenia 2 - 3 Lotto Arena 3,649 95%
02/02/14Group stage
Azerbaijan - Italy 0 - 7 Lotto Arena 3,298 86%
04/02/14Quarter
finalItaly - Croatia 2 - 1 Sportpaleis 3,225 26%
06/02/14 Semifinal Portugal - Italy 3 - 4 Sportpaleis 6,833 55%
08/02/14 Final Italy - Russia 3 - 1 Sportpaleis 11,552 93%
National Futsal Team fixtures at the 2014 UEFA FUTSAL EURO in Antwerp
AVER
AGE
AGE
(YEA
RS)
35.0
0.0
Average age of the National Teams participating in the 2014 UEFA FUTSAL EURO in Antwerp
Azer
baija
n
31.4 30.629.0 28.9 28.6 28.3 28.1 28.1 28.0
25.8 25.6 25.5
Port
ugal
Rom
ania
Russ
ia
Belg
ium
Spai
n
Czec
h Re
p.
Ukra
ine
Italy
Net
herl
ands
Croa
tia
Slov
enia
NUM
BER
OF C
ALLE
D-UP
PLA
YERS
14
0
14 14 14 13 13 13 1312 12
11
9
4
Composition of the National Teams roster participating in the 2014 UEFA FUTSAL EURO in Antwerp
Russ
ia
Spai
n
Ukra
ine
Rom
ania
Belg
ium
Italy
Net
herl
ands
Azer
baija
n
Czec
h Re
p.
Croa
tia
Port
ugal
Slov
enia
26.44millionTotal TV audience of the event (+28% from the 2012 edition)
90,751Total attendance at the tournament (20 matches)
28,557Overall attendance for the matches of the Italian National Team
5,000The Italians who went to Antwerp for the tournament - 2,000 for the final solely
Source: Analysis by FIGC - Study and Research Division with data provided by UEFA and FIGC - National Teams Area
1 1 1 12 2
35
10
Players coming from the domestic championshipPlayers coming from foreign championships
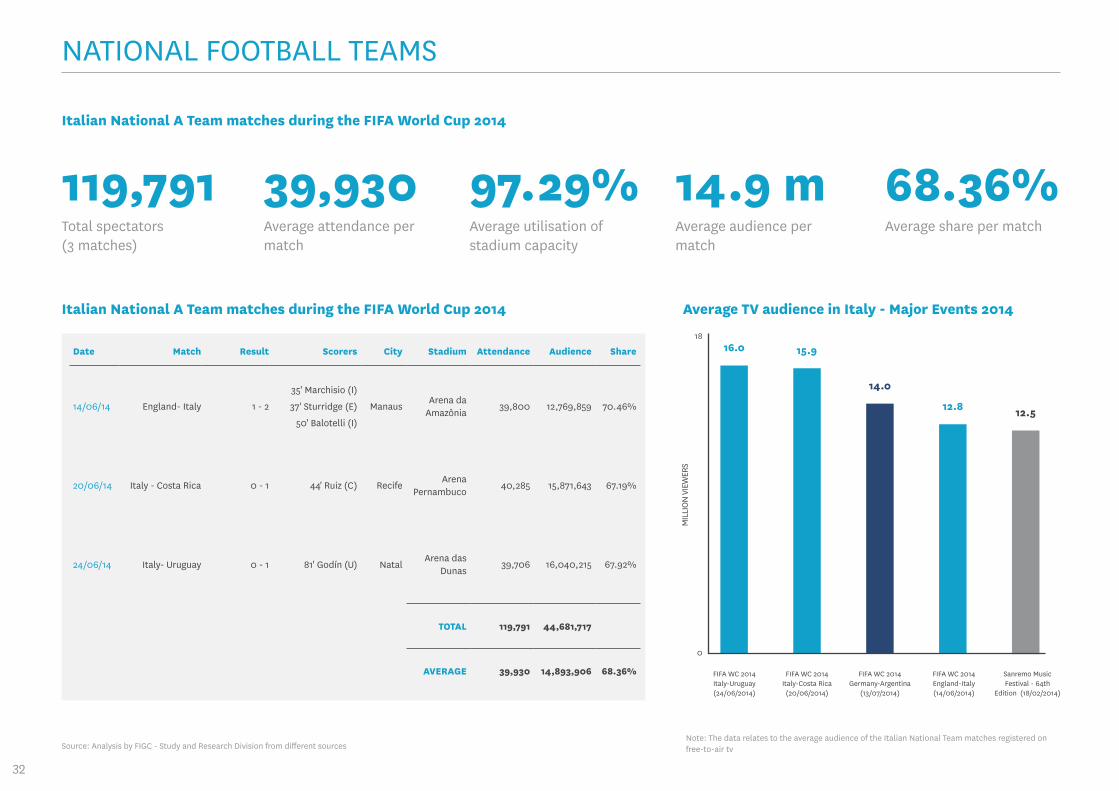
32
Italian National A Team matches during the FIFA World Cup 2014
119,791Total spectators(3 matches)
39,930Average attendance per match
97.29%Average utilisation of stadium capacity
14.9 mAverage audience per match
68.36%Average share per match
Date Match Result Scorers City Stadium Attendance Audience Share
14/06/14 England- Italy 1 - 2
35' Marchisio (I)
37' Sturridge (E)
50' Balotelli (I)
Manaus Arena da
Amazônia 39,800 12,769,859 70.46%
20/06/14 Italy - Costa Rica 0 - 1 44' Ruiz (C) RecifeArena
Pernambuco 40,285 15,871,643 67.19%
24/06/14 Italy- Uruguay 0 - 1 81' Godín (U) NatalArena das
Dunas 39,706 16,040,215 67.92%
TOTAL 119,791 44,681,717
AVERAGE 39,930 14,893,906 68.36%
Italian National A Team matches during the FIFA World Cup 2014 Average TV audience in Italy - Major Events 2014
MIL
LION
VIE
WER
S
18
0
FIFA WC 2014 England-Italy (14/06/2014)
FIFA WC 2014 Germany-Argentina
(13/07/2014)
Sanremo Music Festival - 64th
Edition (18/02/2014)
16.0 15.9
14.0
12.8 12.5
FIFA WC 2014 Italy-Costa Rica
(20/06/2014)
FIFA WC 2014 Italy-Uruguay (24/06/2014)
Source: Analysis by FIGC - Study and Research Division from different sourcesNote: The data relates to the average audience of the Italian National Team matches registered on free-to-air tv
NATIONAL FOOTBALL TEAMS
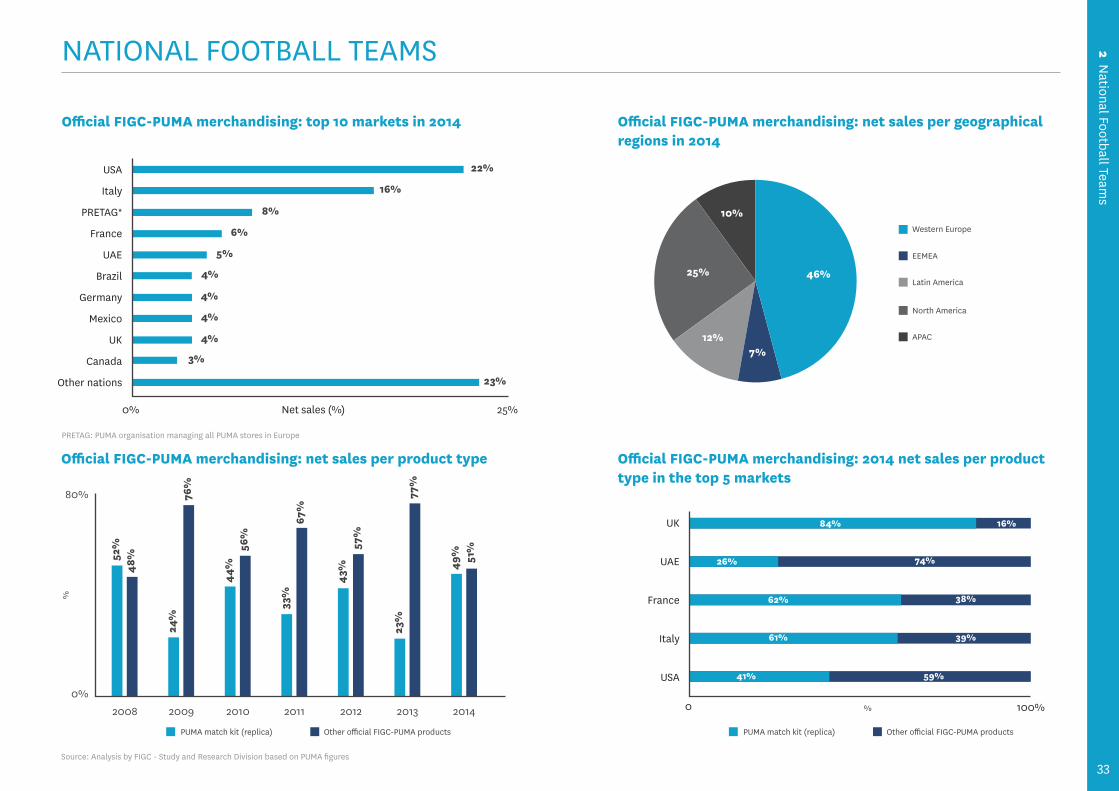
2 National Football Team
s
33
NATIONAL FOOTBALL TEAMS
Official FIGC-PUMA merchandising: top 10 markets in 2014
22%
16%
4%
52%
48%
24%
76%
44%
56%
33%
67%
43%
57%
23%
77%
49% 51%
5%
6%
4%
4%
4%
8%
USA
Italy
PRETAG*
France
UAE
Brazil
Germany
Mexico
UK
Canada
Other nations
0% 25%
3%
23%
Net sales (%)
Official FIGC-PUMA merchandising: net sales per geographical regions in 2014
Western Europe
EEMEA
Latin America
North America
APAC
46%
7%12%
25%
10%
%
80%
0%
Official FIGC-PUMA merchandising: net sales per product type
2008 2009 2010 2011 2012 2013 2014
Other official FIGC-PUMA productsPUMA match kit (replica)
Official FIGC-PUMA merchandising: 2014 net sales per product type in the top 5 markets
UK
UAE
France
Italy
USA
0 100%%
84%
26%
62%
16%
74%
38%
61% 39%
41% 59%
Source: Analysis by FIGC - Study and Research Division based on PUMA figures
PRETAG: PUMA organisation managing all PUMA stores in Europe
Other official FIGC-PUMA productsPUMA match kit (replica)
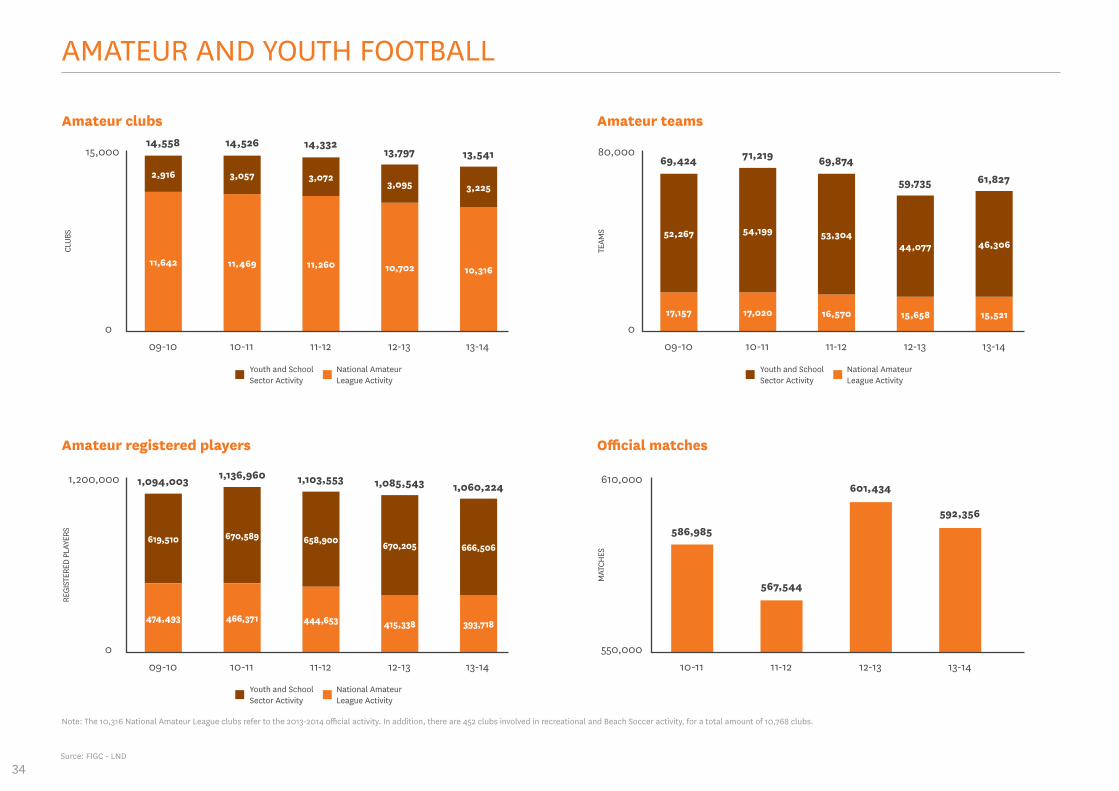
34
AMATEUR AND YOUTH FOOTBALL CL
UBS
15,000
009-10
11,642
10-11
11,469
14,558 14,526 14,33213,797 13,541
11-12
11,260
12-13
10,702
13-14
10,316
2,916 3,057 3,0723,095 3,225
Amateur clubs
TEAM
S
80,000
009-10
17,157
10-11
17,020
69,424 71,219 69,874
59,735 61,827
11-12
16,570
12-13
15,658
13-14
15,521
52,267 54,199 53,30444,077 46,306
Amateur teams
National Amateur League Activity
National Amateur League Activity
National Amateur League Activity
Youth and School Sector Activity
Youth and School Sector Activity
Youth and School Sector Activity
REGI
STER
ED P
LAYE
RS
1,200,000
009-10 10-11
1,094,003 1,136,960 1,103,553 1,085,543 1,060,224
11-12 12-13 13-14
393,718
619,510 670,589 658,900 670,205 666,506
Amateur registered players
MAT
CHES
610,000
550,00010-11 11-12
586,985
567,544
601,434
592,356
12-13 13-14
Official matches
Surce: FIGC - LND
Note: The 10,316 National Amateur League clubs refer to the 2013-2014 official activity. In addition, there are 452 clubs involved in recreational and Beach Soccer activity, for a total amount of 10,768 clubs.
474,493 466,371 444,653 415,338
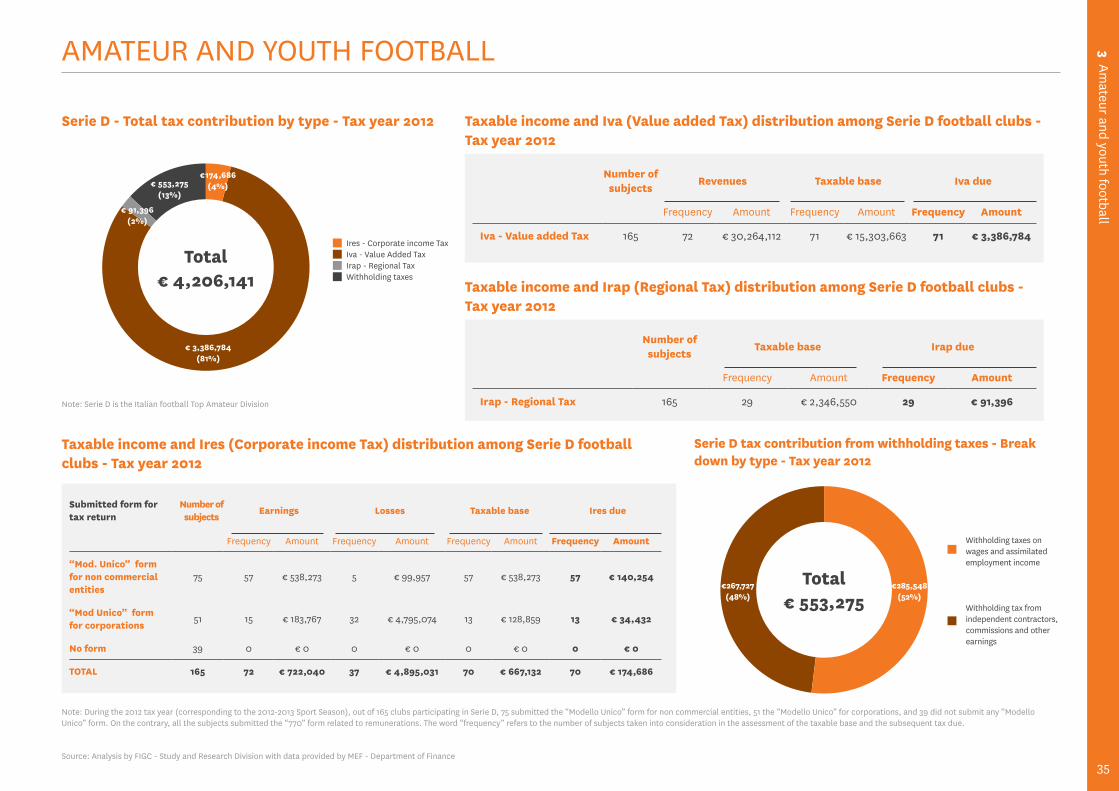
3 Amateur and youth football
35
AMATEUR AND YOUTH FOOTBALL
Serie D - Total tax contribution by type - Tax year 2012
Serie D tax contribution from withholding taxes - Break down by type - Tax year 2012
Withholding taxes on wages and assimilated employment income
Withholding tax from independent contractors, commissions and other earnings
Total€ 4,206,141
Total€ 553,275
€ 3,386,784 (81%)
€ 91,396 (2%)
€ 553,275(13%)
€174,686(4%)
Taxable income and Iva (Value added Tax) distribution among Serie D football clubs - Tax year 2012
Number of subjects
Revenues Taxable base Iva due
Frequency Amount Frequency Amount Frequency Amount
Iva - Value added Tax 165 72 € 30,264,112 71 € 15,303,663 71 € 3,386,784
Number of subjects
Taxable base Irap due
Frequency Amount Frequency Amount
Irap - Regional Tax 165 29 € 2,346,550 29 € 91,396
Taxable income and Ires (Corporate income Tax) distribution among Serie D football clubs - Tax year 2012
Submitted form for tax return
Number of subjects
Earnings Losses Taxable base Ires due
Frequency Amount Frequency Amount Frequency Amount Frequency Amount
“Mod. Unico” form for non commercial entities
75 57 € 538,273 5 € 99,957 57 € 538,273 57 € 140,254
“Mod Unico” form for corporations
51 15 € 183,767 32 € 4,795,074 13 € 128,859 13 € 34,432
No form 39 0 € 0 0 € 0 0 € 0 0 € 0
TOTAL 165 72 € 722,040 37 € 4,895,031 70 € 667,132 70 € 174,686
€285,548(52%)
Ires - Corporate income Tax
Irap - Regional TaxIva - Value Added Tax
Withholding taxes
Note: During the 2012 tax year (corresponding to the 2012-2013 Sport Season), out of 165 clubs participating in Serie D, 75 submitted the “Modello Unico” form for non commercial entities, 51 the “Modello Unico” for corporations, and 39 did not submit any “Modello Unico” form. On the contrary, all the subjects submitted the “770” form related to remunerations. The word “frequency” refers to the number of subjects taken into consideration in the assessment of the taxable base and the subsequent tax due.
Source: Analysis by FIGC - Study and Research Division with data provided by MEF - Department of Finance
Note: Serie D is the Italian football Top Amateur Division
€267,727(48%)
Taxable income and Irap (Regional Tax) distribution among Serie D football clubs - Tax year 2012
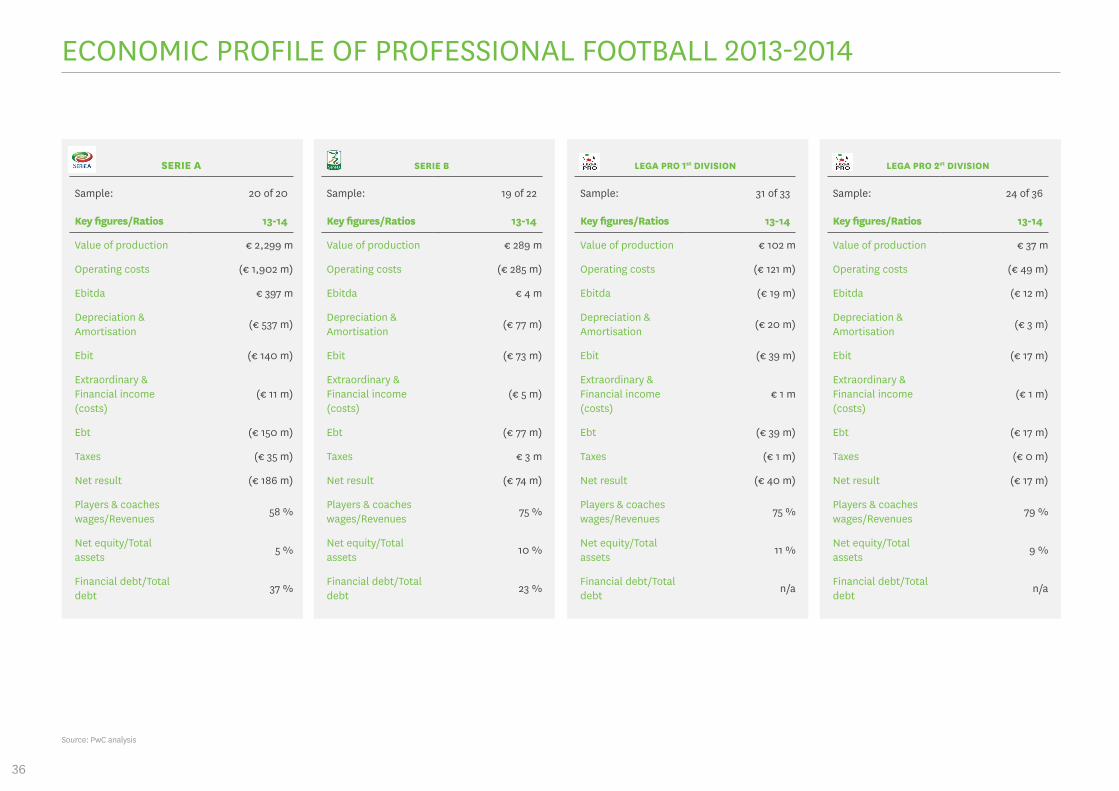
36
SERIE A
Sample: 20 of 20
Key figures/Ratios 13-14
Value of production € 2,299 m
Operating costs (€ 1,902 m)
Ebitda € 397 m
Depreciation & Amortisation
(€ 537 m)
Ebit (€ 140 m)
Extraordinary & Financial income (costs)
(€ 11 m)
Ebt (€ 150 m)
Taxes (€ 35 m)
Net result (€ 186 m)
Players & coaches wages/Revenues
58 %
Net equity/Total assets
5 %
Financial debt/Total debt
37 %
SERIE B
Sample: 19 of 22
Key figures/Ratios 13-14
Value of production € 289 m
Operating costs (€ 285 m)
Ebitda € 4 m
Depreciation & Amortisation
(€ 77 m)
Ebit (€ 73 m)
Extraordinary & Financial income (costs)
(€ 5 m)
Ebt (€ 77 m)
Taxes € 3 m
Net result (€ 74 m)
Players & coaches wages/Revenues
75 %
Net equity/Total assets
10 %
Financial debt/Total debt
23 %
LEGA PRO 1st DIVISION
Sample: 31 of 33
Key figures/Ratios 13-14
Value of production € 102 m
Operating costs (€ 121 m)
Ebitda (€ 19 m)
Depreciation & Amortisation
(€ 20 m)
Ebit (€ 39 m)
Extraordinary & Financial income (costs)
€ 1 m
Ebt (€ 39 m)
Taxes (€ 1 m)
Net result (€ 40 m)
Players & coaches wages/Revenues
75 %
Net equity/Total assets
11 %
Financial debt/Total debt
n/a
LEGA PRO 2st DIVISION
Sample: 24 of 36
Key figures/Ratios 13-14
Value of production € 37 m
Operating costs (€ 49 m)
Ebitda (€ 12 m)
Depreciation & Amortisation
(€ 3 m)
Ebit (€ 17 m)
Extraordinary & Financial income (costs)
(€ 1 m)
Ebt (€ 17 m)
Taxes (€ 0 m)
Net result (€ 17 m)
Players & coaches wages/Revenues
79 %
Net equity/Total assets
9 %
Financial debt/Total debt
n/a
ECONOMIC PROFILE OF PROFESSIONAL FOOTBALL 2013-2014
Source: PwC analysis
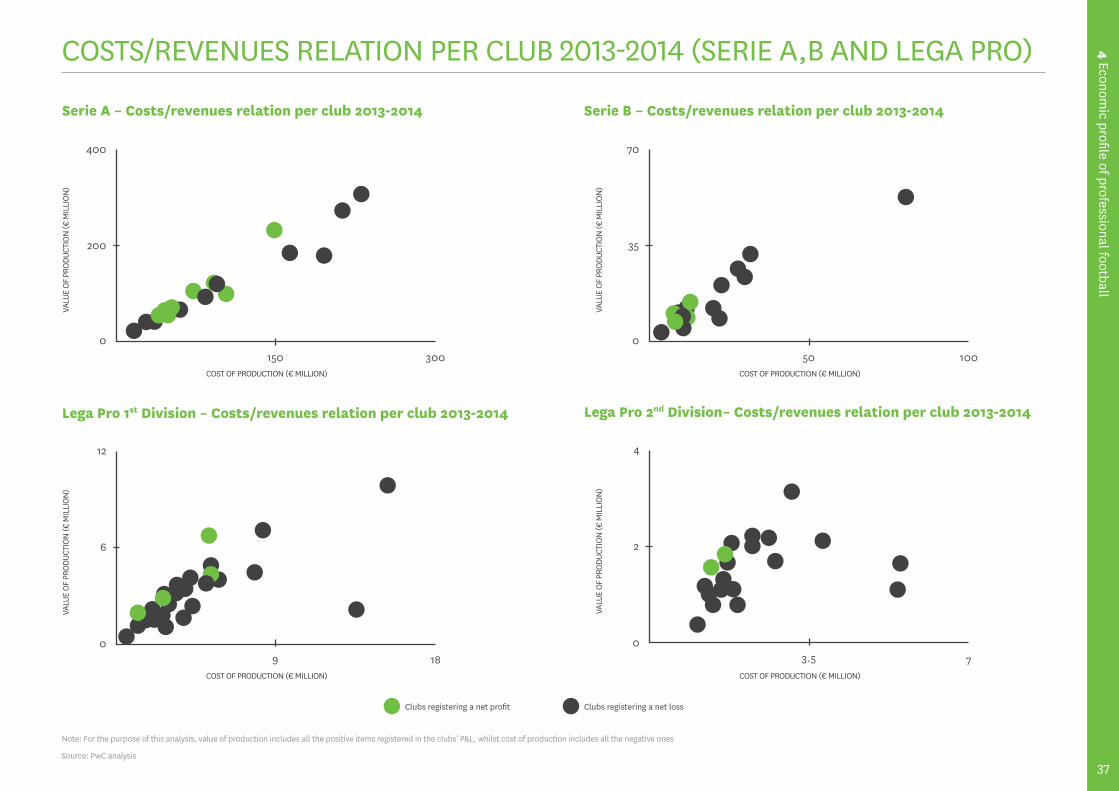
37
4 Economic profile of professional football
Serie A – Costs/revenues relation per club 2013-2014 Serie B – Costs/revenues relation per club 2013-2014
Lega Pro 2nd Division– Costs/revenues relation per club 2013-2014Lega Pro 1st Division – Costs/revenues relation per club 2013-2014
400 70
412
0 0
0 0
VALU
E OF
PRO
DUCT
ION
(€ M
ILLI
ON)
VALU
E OF
PRO
DUCT
ION
(€ M
ILLI
ON)
VALU
E OF
PRO
DUCT
ION
(€ M
ILLI
ON)
VALU
E OF
PRO
DUCT
ION
(€ M
ILLI
ON)
COST OF PRODUCTION (€ MILLION)
300
18 7COST OF PRODUCTION (€ MILLION) COST OF PRODUCTION (€ MILLION)
100COST OF PRODUCTION (€ MILLION)
Clubs registering a net profit Clubs registering a net loss
150
200
50
35
9
6
3.5
2
COSTS/REVENUES RELATION PER CLUB 2013-2014 (SERIE A,B AND LEGA PRO)
Source: PwC analysis
Note: For the purpose of this analysis, value of production includes all the positive items registered in the clubs’ P&L, whilst cost of production includes all the negative ones
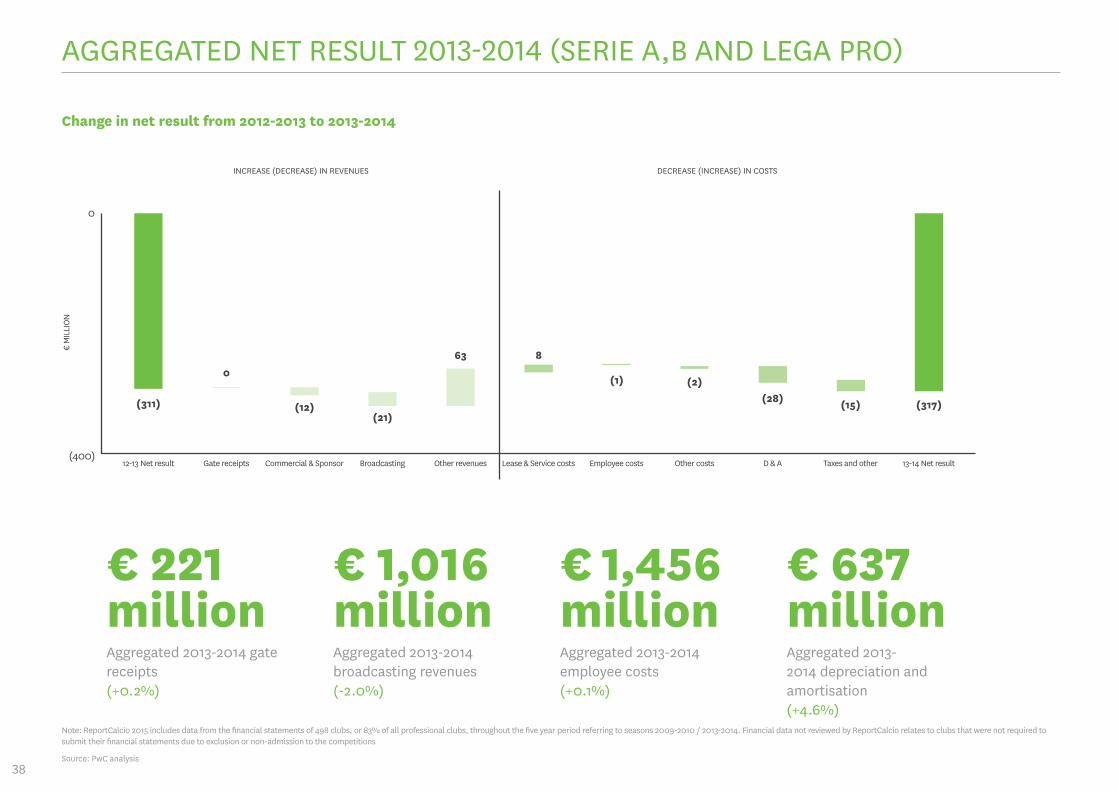
38
€ 221 million Aggregated 2013-2014 gate receipts (+0.2%)
€ 1,016 million Aggregated 2013-2014 broadcasting revenues (-2.0%)
€ 1,456 million Aggregated 2013-2014 employee costs (+0.1%)
€ 637 million Aggregated 2013-2014 depreciation and amortisation (+4.6%)
€ M
ILLI
ON
0
(400)12-13 Net result Gate receipts Commercial & Sponsor
INCREASE (DECREASE) IN REVENUES DECREASE (INCREASE) IN COSTS
Broadcasting Other revenues Lease & Service costs Employee costs Other costs Taxes and other 13-14 Net result
Change in net result from 2012-2013 to 2013-2014
(311) (317)(28)
0
(21)
63
(12)
D & A
8
(1) (2)
(15)
Source: PwC analysis
AGGREGATED NET RESULT 2013-2014 (SERIE A,B AND LEGA PRO)
Note: ReportCalcio 2015 includes data from the financial statements of 498 clubs, or 83% of all professional clubs, throughout the five year period referring to seasons 2009-2010 / 2013-2014. Financial data not reviewed by ReportCalcio relates to clubs that were not required to submit their financial statements due to exclusion or non-admission to the competitions
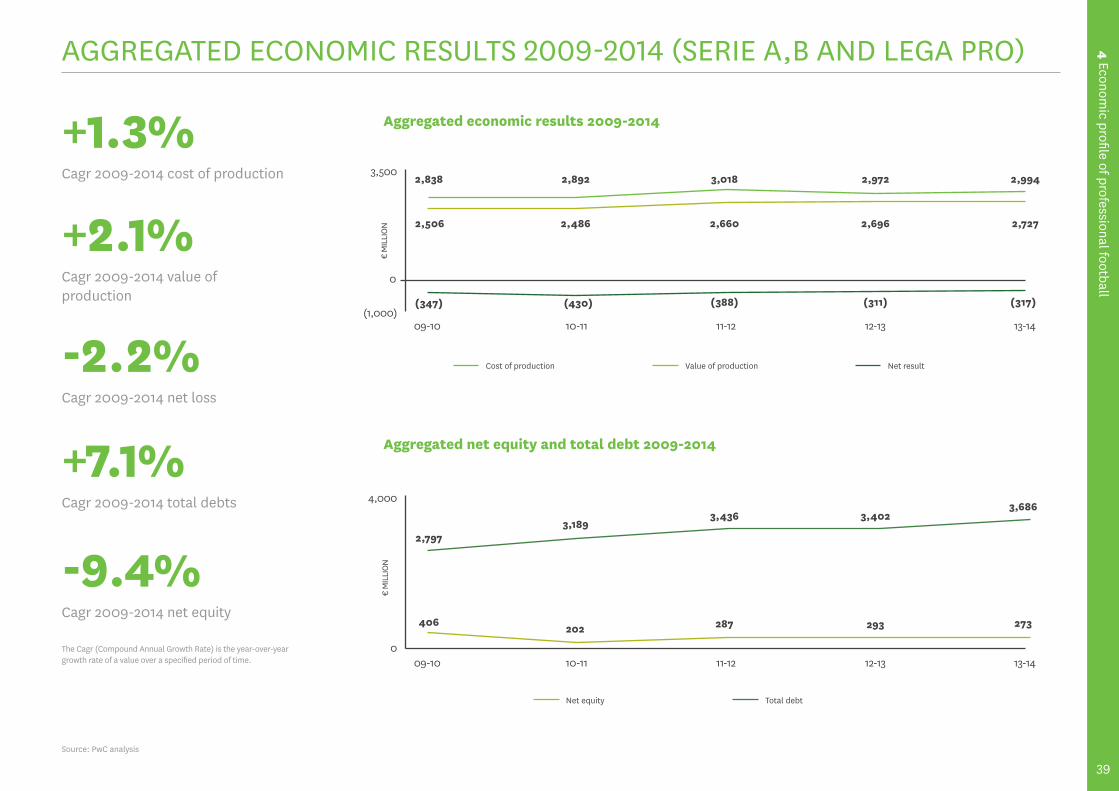
39
4 Economic profile of professional football
+1.3% Cagr 2009-2014 cost of production
+2.1% Cagr 2009-2014 value of production
-2.2% Cagr 2009-2014 net loss
+7.1% Cagr 2009-2014 total debts
-9.4% Cagr 2009-2014 net equity
AGGREGATED ECONOMIC RESULTS 2009-2014 (SERIE A,B AND LEGA PRO)
The Cagr (Compound Annual Growth Rate) is the year-over-year growth rate of a value over a specified period of time.
Aggregated economic results 2009-2014
Aggregated net equity and total debt 2009-2014
€ M
ILLI
ON€
MIL
LION
(1,000)
4,000
0
0
3,500
09-10
09-10
10-11
10-11
11-12
11-12
12-13
12-13
13-14
13-14
(347)
406
2,838
2,797
2,506 2,486
2,892
3,189
2,660
3,018
3,436
2,696
2,972
3,402
2,727
2,994
3,686
(430)
202
(388)
287
(311)
293
(317)
273
Cost of production Value of production Net result
Source: PwC analysis
Net equity Total debt
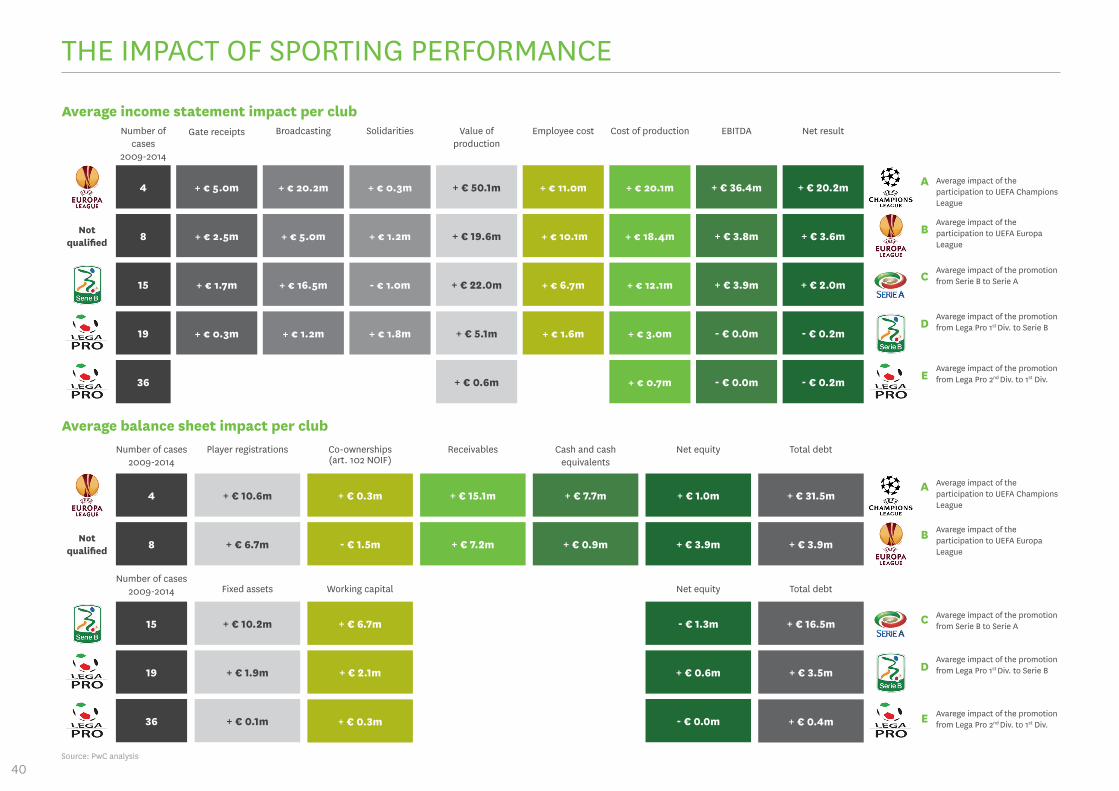
40
+ € 5.0m
+ € 2.5m
+ € 1.7m
+ € 0.3m
Gate receipts
THE IMPACT OF SPORTING PERFORMANCE
4
8
15
19
36
+ € 11.0m
+ € 10.1m
+ € 6.7m
+ € 1.6m
+ € 20.2m
+ € 5.0m
+ € 16.5m
+ € 1.2m
+ € 20.1m
+ € 18.4m
+ € 12.1m
+ € 3.0m
+ € 0.7m
+ € 0.3m
+ € 1.2m
- € 1.0m
+ € 1.8m
+ € 36.4m
+ € 3.8m
+ € 3.9m
- € 0.0m
- € 0.0m
+ € 50.1m
+ € 19.6m
+ € 22.0m
+ € 5.1m
+ € 0.6m
+ € 20.2m
+ € 3.6m
+ € 2.0m
- € 0.2m
- € 0.2m
Number of cases
2009-2014
Employee costBroadcasting Cost of productionSolidarities EBITDA
Average impact of the participation to UEFA Champions League
Avarege impact of the promotion from Serie B to Serie A
Avarege impact of the participation to UEFA Europa League
Avarege impact of the promotion from Lega Pro 1st Div. to Serie B
Avarege impact of the promotion from Lega Pro 1st Div. to Serie B
Avarege impact of the promotion from Lega Pro 2nd Div. to 1st Div.
Avarege impact of the promotion from Lega Pro 2nd Div. to 1st Div.
Value of production
Net result
Average income statement impact per club
+ € 0.3m
- € 1.5m
+ € 6.7m
+ € 2.1m
+ € 0.3m
+ € 15.1m
+ € 7.2m
+ € 7.7m
+ € 0.9m
+ € 10.6m
+ € 6.7m
+ € 10.2m
+ € 1.9m
+ € 0.1m
+ € 1.0m
+ € 3.9m
- € 1.3m
+ € 0.6m
- € 0.0m
Co-ownerships (art. 102 NOIF)
Working capital
Receivables Cash and cash equivalents
Player registrations
Fixed assets
Net equity
Net equity
+ € 31.5m
+ € 3.9m
+ € 16.5m
+ € 3.5m
+ € 0.4m
4
8
15
19
36
Total debt
Total debt
Number of cases 2009-2014
Number of cases 2009-2014
Notqualified
Not qualified
Average balance sheet impact per club
A
B
C
D
E
A
B
C
D
E
Average impact of the participation to UEFA Champions League
Avarege impact of the participation to UEFA Europa League
Avarege impact of the promotion from Serie B to Serie A
Source: PwC analysis
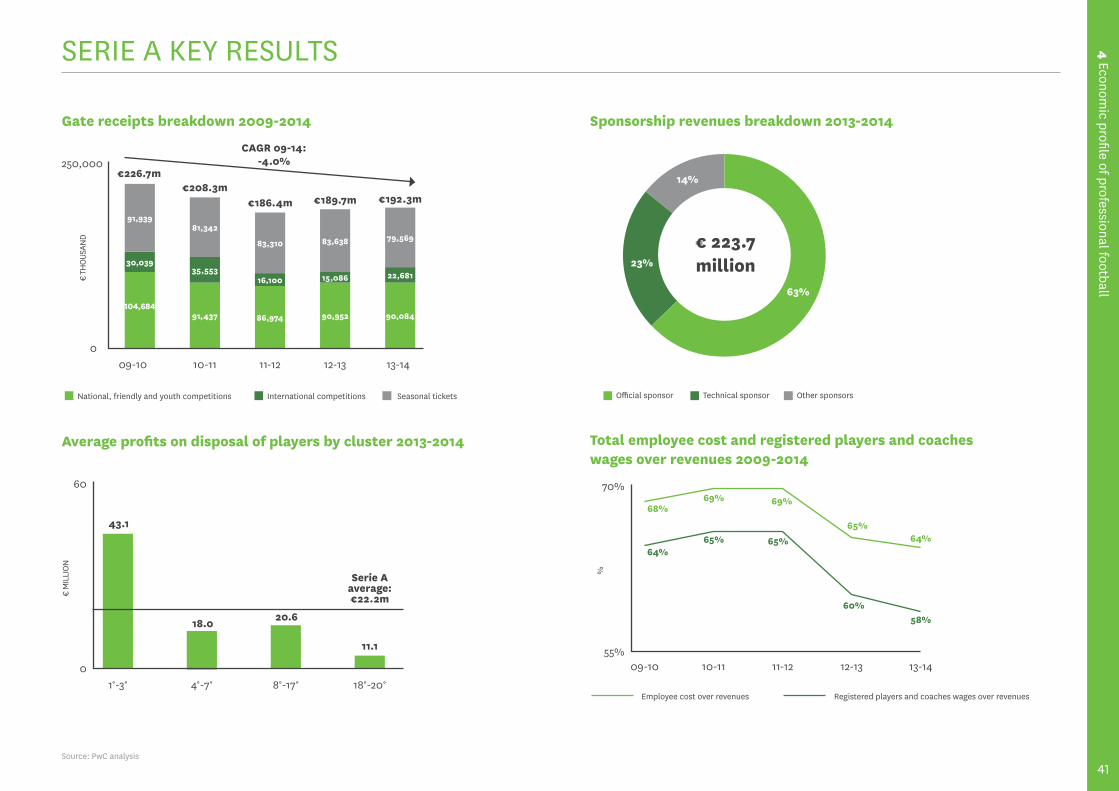
41
4 Economic profile of professional football
SERIE A KEY RESULTS€
THOU
SAN
D
250,000
009-10 10-11 11-12 12-13 13-14
Gate receipts breakdown 2009-2014
91,437 86,974 90,952 90,084
CAGR 09-14:-4.0%
National, friendly and youth competitions International competitions Seasonal tickets
30,03935,553
16,100 15,086 22,681
79,56983,63883,310
81,34291,939
€226.7m€208.3m
€186.4m €189.7m €192.3m
104,684
Sponsorship revenues breakdown 2013-2014
€ 223.7million
63%
23%
14%
Other sponsorsOfficial sponsor Technical sponsor
Average profits on disposal of players by cluster 2013-2014
€ M
ILLI
ON
60
01°-3° 4°-7° 8°-17° 18°-20°
43.1
18.0 20.6
11.1
Serie A average:€22.2m
68%69% 69%
65%64%
Total employee cost and registered players and coaches wages over revenues 2009-2014
%
70%
55%09-10 10-11 11-12 12-13 13-14
Employee cost over revenues Registered players and coaches wages over revenues
64%65% 65%
60%58%
Source: PwC analysis
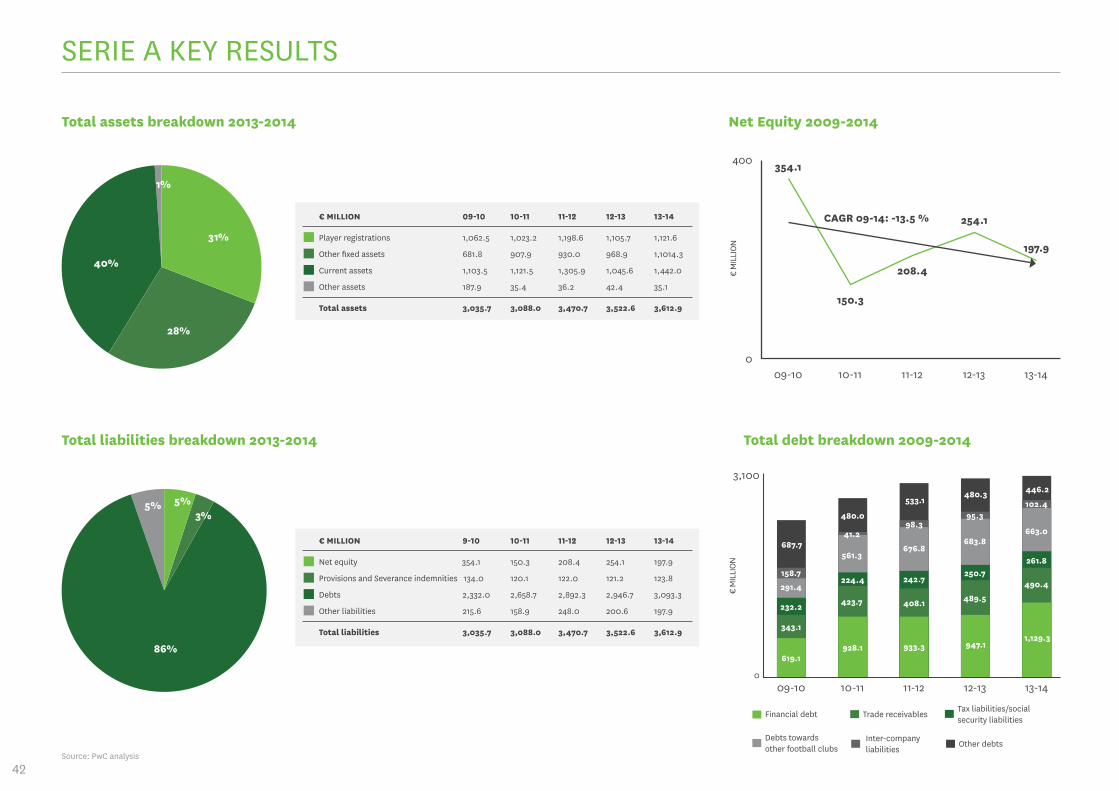
42
SERIE A KEY RESULTS
Total assets breakdown 2013-2014
31%
1%
28%
40%
€ MILLION 09-10 10-11 11-12 12-13 13-14
Total assets 3,035.7 3,088.0 3,470.7 3,522.6 3,612.9
Player registrations 1,062.5 1,023.2 1,198.6 1,105.7 1,121.6
Current assets 1,103.5 1,121.5 1,305.9 1,045.6 1,442.0
Other fixed assets 681.8 907.9 930.0 968.9 1,1014.3
Other assets 187.9 35.4 36.2 42.4 35.1
Net Equity 2009-2014
400
009-10 10-11 11-12 12-13 13-14
354.1
208.4
CAGR 09-14: -13.5 %
150.3
254.1
197.9
€ M
ILLI
ON
Financial debt Trade receivablesTax liabilities/social security liabilities
Debts towards other football clubs
Inter-company liabilities
Other debts
Total debt breakdown 2009-2014
€ M
ILLI
ON
3,100
009-10 10-11 11-12 12-13 13-14
619.1928.1 933.3 947.1
1,129.3343.1
423.7 408.1 489.5
490.4
232.2
224.4 242.7250.7
261.8
291.4
158.7
561.3
41.2
676.8
98.3
683.8
95.3
663.0
102.4
687.7
480.0
533.1480.3 446.2
Source: PwC analysis
5%5%3%
86%
€ MILLION 9-10 10-11 11-12 12-13 13-14
Total liabilities 3,035.7 3,088.0 3,470.7 3,522.6 3,612.9
Net equity 354.1 150.3 208.4 254.1 197.9
Debts 2,332.0 2,658.7 2,892.3 2,946.7 3,093.3
Provisions and Severance indemnities 134.0 120.1 122.0 121.2 123.8
Other liabilities 215.6 158.9 248.0 200.6 197.9
Total liabilities breakdown 2013-2014
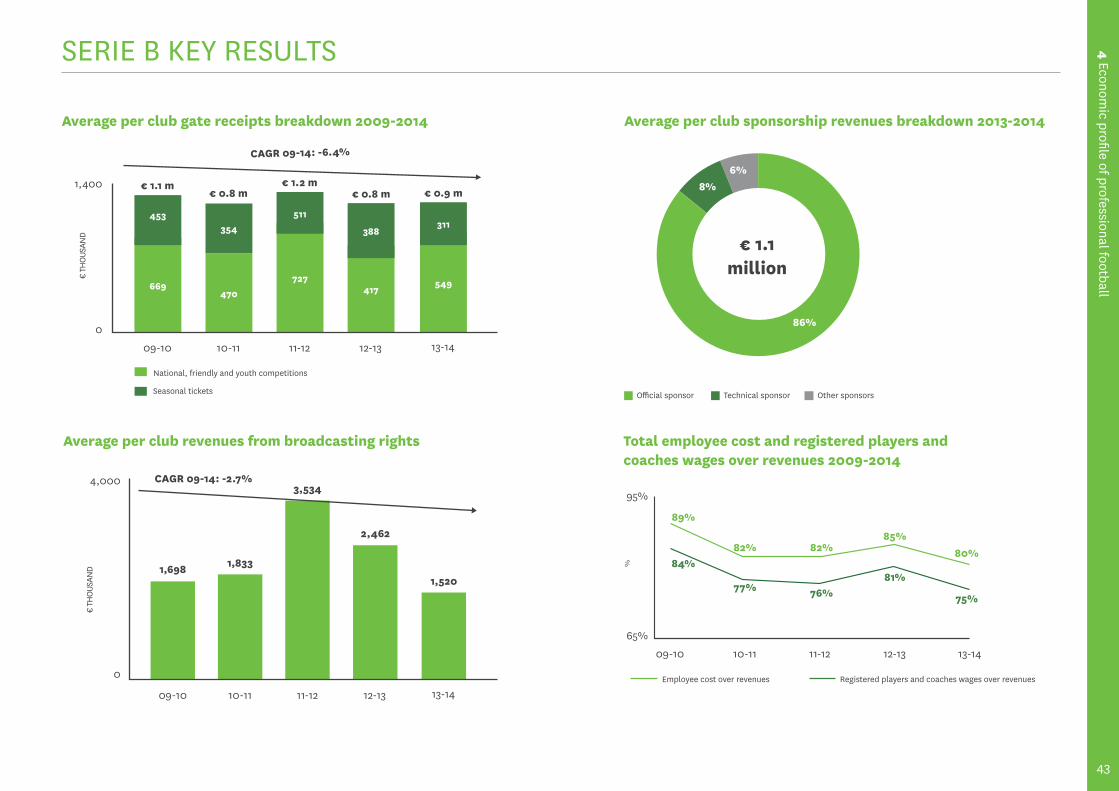
43
4 Economic profile of professional football
Total debt breakdown 2009-2014
727
SERIE B KEY RESULTS
Average per club gate receipts breakdown 2009-2014
1,400
0
09-10
669
10-11
470
354
€ 1.1 m€ 0.8 m
€ 1.2 m€ 0.8 m
11-12 12-13
417
453 511
National, friendly and youth competitions
Seasonal tickets
€ 0.9 m
13-14
549
388311
€ TH
OUSA
ND
CAGR 09-14: -6.4%
Average per club sponsorship revenues breakdown 2013-2014
€ 1.1million
86%
8%6%
Average per club revenues from broadcasting rights
4,000
0
09-10 10-11
1,698 1,833
3,534
2,462
11-12 12-13
1,520
13-14
€ TH
OUSA
ND
CAGR 09-14: -2.7%
%
95%
65%
09-10 10-11 11-12 12-13 13-14
Total employee cost and registered players and coaches wages over revenues 2009-2014
89%
84%
Employee cost over revenues Registered players and coaches wages over revenues
82%
77%
82%
76%
85%
81%
80%
75%
Other sponsorsOfficial sponsor Technical sponsor
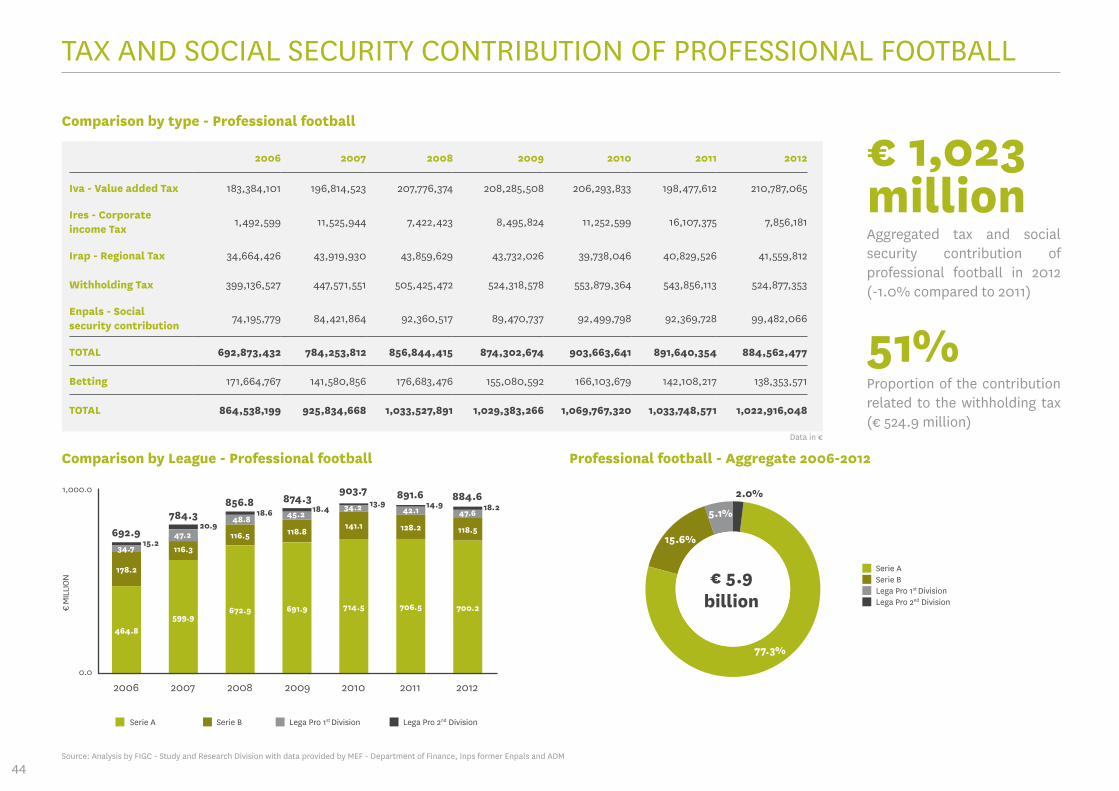
44
TAX AND SOCIAL SECURITY CONTRIBUTION OF PROFESSIONAL FOOTBALL
Comparison by type - Professional football
2006 2007 2008 2009 2010 2011 2012
Iva - Value added Tax 183,384,101 196,814,523 207,776,374 208,285,508 206,293,833 198,477,612 210,787,065
Ires - Corporate income Tax
1,492,599 11,525,944 7,422,423 8,495,824 11,252,599 16,107,375 7,856,181
Irap - Regional Tax 34,664,426 43,919,930 43,859,629 43,732,026 39,738,046 40,829,526 41,559,812
Withholding Tax 399,136,527 447,571,551 505,425,472 524,318,578 553,879,364 543,856,113 524,877,353
Enpals - Social security contribution
74,195,779 84,421,864 92,360,517 89,470,737 92,499,798 92,369,728 99,482,066
TOTAL 692,873,432 784,253,812 856,844,415 874,302,674 903,663,641 891,640,354 884,562,477
Betting 171,664,767 141,580,856 176,683,476 155,080,592 166,103,679 142,108,217 138,353,571
TOTAL 864,538,199 925,834,668 1,033,527,891 1,029,383,266 1,069,767,320 1,033,748,571 1,022,916,048
Serie B Lega Pro 1st Division Lega Pro 2nd DivisionSerie A
15.2
20.918.6 18.4
13.9 14.9 18.2
€ M
ILLI
ON
1,000.0
0.0
2006
178.2
464.8
692.9
2007
116.3
599.9
784.3
2008
116.5
672.9
856.8
2009
118.8
691.9
874.3
2010 2011 2012
141.1 128.2 118.5
714.5 706.5 700.2
903.7 891.6 884.6
Comparison by League - Professional football
34.747.2
48.8 45.234.2 42.1 47.6
€ 5.9 billion
Professional football - Aggregate 2006-2012
77.3%
15.6%
5.1%
2.0%
Source: Analysis by FIGC - Study and Research Division with data provided by MEF - Department of Finance, Inps former Enpals and ADM
Serie A
Lega Pro 1st DivisionSerie B
Lega Pro 2nd Division
Data in €
€ 1,023millionAggregated tax and social security contribution of professional football in 2012 (-1.0% compared to 2011)
51%Proportion of the contribution related to the withholding tax (€ 524.9 million)
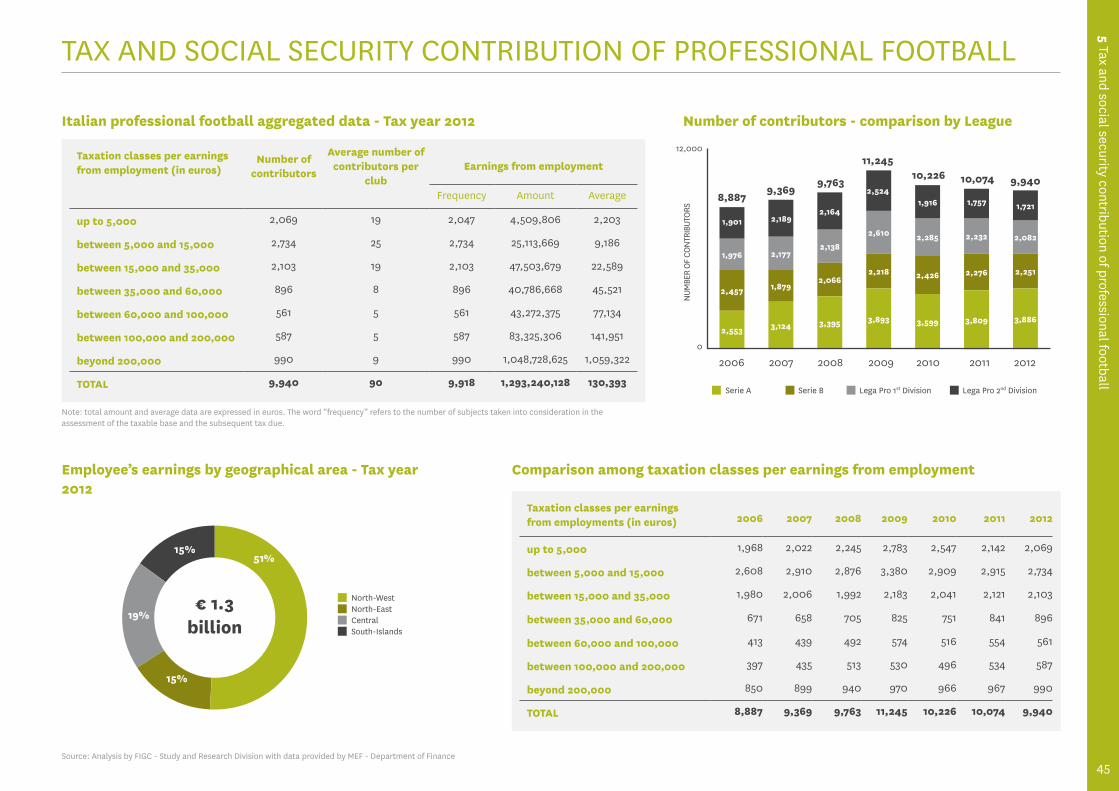
45
5 Tax and social security contribution of professional football
45
TAX AND SOCIAL SECURITY CONTRIBUTION OF PROFESSIONAL FOOTBALL
Taxation classes per earnings from employment (in euros)
Number of contributors
Average number of contributors per
clubEarnings from employment
Frequency Amount Average
up to 5,000 2,069 19 2,047 4,509,806 2,203
between 5,000 and 15,000 2,734 25 2,734 25,113,669 9,186
between 15,000 and 35,000 2,103 19 2,103 47,503,679 22,589
between 35,000 and 60,000 896 8 896 40,786,668 45,521
between 60,000 and 100,000 561 5 561 43,272,375 77,134
between 100,000 and 200,000 587 5 587 83,325,306 141,951
beyond 200,000 990 9 990 1,048,728,625 1,059,322
TOTAL 9,940 90 9,918 1,293,240,128 130,393
Source: Analysis by FIGC - Study and Research Division with data provided by MEF - Department of Finance
Italian professional football aggregated data - Tax year 2012
NUM
BER
OF C
ONTR
IBUT
ORS
12,000
0
2006 2007 2008 2009 2010 2011 2012
Number of contributors - comparison by League
Serie B Lega Pro 1st Division Lega Pro 2nd DivisionSerie A
2,457
2,553
1,976
1,901
8,887
1,879
3,124
2,177
2,189
9,369
2,138
2,066
3,395
2,164
9,763
2,610
2,218
3,893
2,524
11,245
2,285
2,426
3,599
1,916
10,226
2,232
2,276
3,809
1,757
10,074
2,082
2,251
3,886
1,721
9,940
Employee’s earnings by geographical area - Tax year 2012
51%
19%
15%
15%
€ 1.3billion
North-West
CentralNorth-East
South-Islands
Taxation classes per earnings from employments (in euros) 2006 2007 2008 2009 2010 2011 2012
up to 5,000 1,968 2,022 2,245 2,783 2,547 2,142 2,069
between 5,000 and 15,000 2,608 2,910 2,876 3,380 2,909 2,915 2,734
between 15,000 and 35,000 1,980 2,006 1,992 2,183 2,041 2,121 2,103
between 35,000 and 60,000 671 658 705 825 751 841 896
between 60,000 and 100,000 413 439 492 574 516 554 561
between 100,000 and 200,000 397 435 513 530 496 534 587
beyond 200,000 850 899 940 970 966 967 990
TOTAL 8,887 9,369 9,763 11,245 10,226 10,074 9,940
Comparison among taxation classes per earnings from employment
Note: total amount and average data are expressed in euros. The word “frequency” refers to the number of subjects taken into consideration in the assessment of the taxable base and the subsequent tax due.
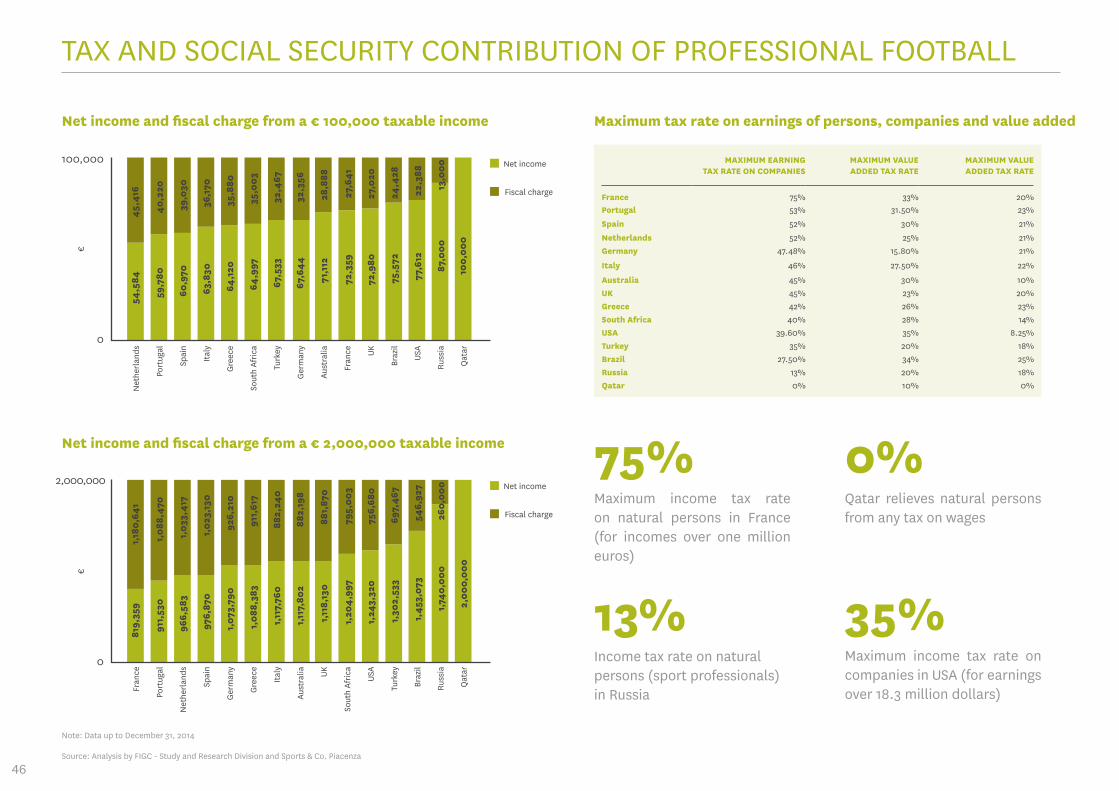
46
Net income and fiscal charge from a € 100,000 taxable income
€
100,000
0
53%
52%
52%
TAX AND SOCIAL SECURITY CONTRIBUTION OF PROFESSIONAL FOOTBALL
45,4
16
40,2
20
39,0
30
36,1
70
35,8
80
35,0
03
32,4
67
28,8
88
27,6
41
27,0
20
24,4
28
22,3
88
13,0
00
32,3
56
Net income
Net income
Fiscal charge
Fiscal charge
Maximum tax rate on earnings of persons, companies and value added
Net income and fiscal charge from a € 2,000,000 taxable income
€
2,000,000
0
Fran
ce
Port
ugal
Net
herl
ands
Spai
n
Ger
man
y
Gre
ece
Italy
Aust
ralia UK
Sout
h Af
rica
USA
Turk
ey
Braz
il
Russ
ia
Qat
ar
53%
52%
52%
1,18
0,64
1
1,08
8,47
0
1,03
3,41
7
1,02
3,13
0
926,
210
911,
617
882,
240
881,
870
795,
003
756,
680
697,
467
546,
927
260,
000
882,
198
75%Maximum income tax rate on natural persons in France (for incomes over one million euros)
0%Qatar relieves natural persons from any tax on wages
13%Income tax rate on natural persons (sport professionals) in Russia
35%Maximum income tax rate on companies in USA (for earnings over 18.3 million dollars)
Note: Data up to December 31, 2014
54,5
84
59,7
80
60,9
70
63,8
30
64,1
20
64,9
97
67,5
33
71,1
12
72,3
59
72,9
80
75,5
72
77,6
12
87,0
00
67,6
44 100,
000
819,
359
911,
530
966,
583
976,
870
1,07
3,79
0
1,08
8,38
3
1,11
7,76
0
1,11
8,13
0
1,20
4,9
97
1,24
3,32
0
1,30
2,53
3
1,45
3,07
3
1,74
0,00
0
1,11
7,80
2
2,00
0,00
0
Source: Analysis by FIGC - Study and Research Division and Sports & Co. Piacenza
Net
herl
ands
Port
ugal
Spai
n
Italy
Gre
ece
Sout
h Af
rica
Turk
ey
Ger
man
y
Aust
ralia
Fran
ce UK
Braz
il
USA
Russ
ia
Qat
ar
MAXIMUM EARNING TAX RATE ON COMPANIES
MAXIMUM VALUE ADDED TAX RATE
MAXIMUM VALUE ADDED TAX RATE
France 75% 33% 20%Portugal 53% 31.50% 23%
Spain 52% 30% 21%
Netherlands 52% 25% 21%Germany 47.48% 15.80% 21%
Italy 46% 27.50% 22%
Australia 45% 30% 10%UK 45% 23% 20%Greece 42% 26% 23%South Africa 40% 28% 14%USA 39.60% 35% 8.25%Turkey 35% 20% 18%Brazil 27.50% 34% 25%Russia 13% 20% 18%Qatar 0% 10% 0%
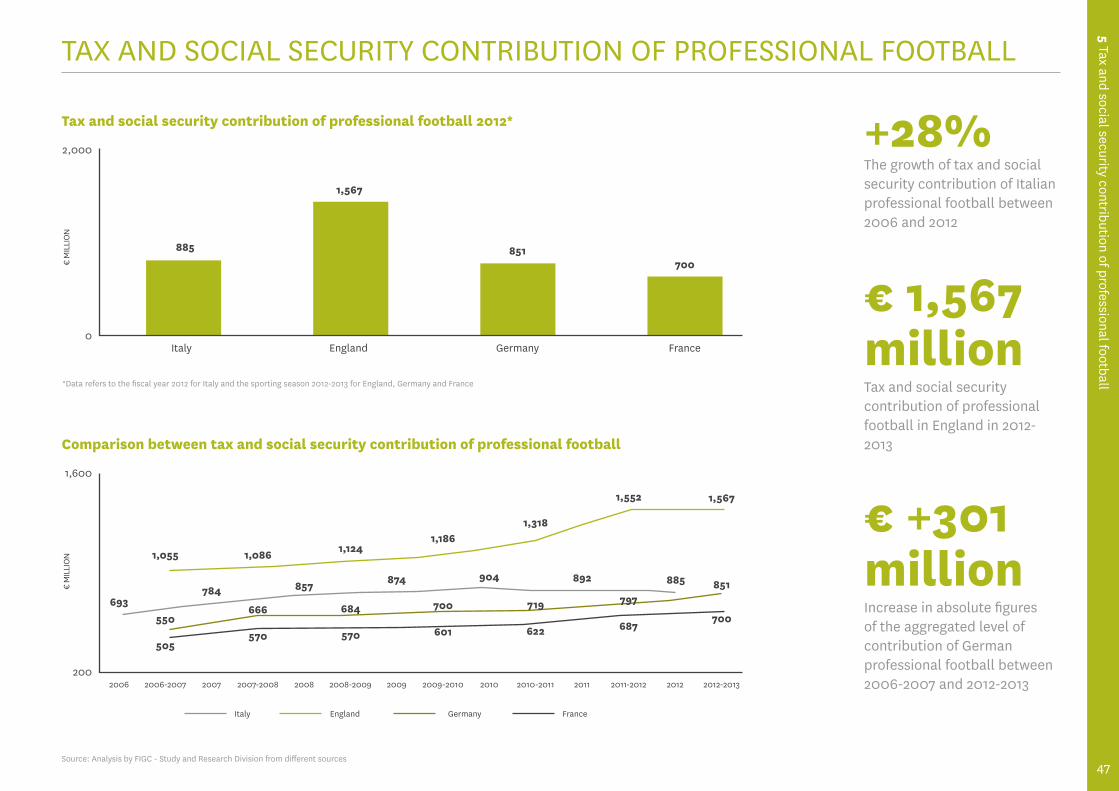
47
5 Tax and social security contribution of professional football
47
TAX AND SOCIAL SECURITY CONTRIBUTION OF PROFESSIONAL FOOTBALL
Tax and social security contribution of professional football 2012*
€ M
ILLI
ON
2,000
0Italy
885
1,055
784693
1,086
857
1,124
874
1,186
904
1,318
892
1,552
885
1,567
1,567
851700
England Germany France
*Data refers to the fiscal year 2012 for Italy and the sporting season 2012-2013 for England, Germany and France
€ M
ILLI
ON
1,600
2002006 2006-2007 2007 2007-2008 2008 2008-2009 2009 2009-2010 2010 2010-2011 2011 2011-2012 2012 2012-2013
Comparison between tax and social security contribution of professional football
Italy England Germany France
550666 684 700 719 797
851
505570 570 601 622 687
700
Source: Analysis by FIGC - Study and Research Division from different sources
+28%The growth of tax and social security contribution of Italian professional football between 2006 and 2012
€ 1,567million Tax and social security contribution of professional football in England in 2012-2013
€ +301million Increase in absolute figures of the aggregated level of contribution of German professional football between 2006-2007 and 2012-2013

48
INTERNATIONAL BENCHMARKING
2006 2007 2008 2009 2010 2011 2012 2013
Broadcasting 2.8 3.5 4.0 4.2 4.5 4.8 5.5 5.9
Annual percentage growth rate +24.7% +13.4% +3.9% +8.6% +6.9% +13.9% +7.3%
Sponsorship and advertising 2.4 2.7 2.8 3.0 3.2 3.3 3.3 3.6
Annual percentage growth rate +10.5% +4.7% +5.8% +6.1% +4.2% -0.4% +9.1%
Gate receipts 2.1 2.5 2.5 2.5 2.6 2.5 2.5 2.5
Annual percentage growth rate +19.7% +3.2% -1.2% +3.7% -2.6% -1.5% 0.0%
Commercial and other income 1.7 1.9 2.0 2.1 2.5 2.5 2.8 3
Annual percentage growth rate +10.8% +5.2% +3.9% +20.3% +0.6% +12.4% +7.1%
Total revenue* 9.0 10.6 11.4 11.7 12.8 13.2 14.1 15.0
Annual percentage growth rate +17.1% +7.4% +3.2% +9.0% +3.0% +7.1% +6.4%
Employee costs 4.9 6.2 7.1 7.5 8.2 8.6 9.2 9.6
Annual percentage growth rate +26.7% +14.0% +6.0% +9.0% +5.0% +7.4% +4.3%
Net trasfer expenses** 0.5 0.4 0.3 0.5 0.9 0.8 0.6 0.6
Annual percentage growth rate -11.2% -22.7% +35.6% +104.2% -12.4% -26.6% 0.0%
Other costs*** 3.9 4.5 4.6 5.0 5.3 5.5 5.4 5.6
Annual percentage growth rate +17.6% +0.7% +8.9% +6.4% +2.9% -1.1% +3.7%
Total costs 9.2 11.2 12.0 12.9 14.4 14.8 15.2 15.8
Annual percentage growth rate +20.9% +7.1% +7.9% +11.4% +3.1% +2.4% +3.9%
Net result -0.2 -0.6 -0.6 -1.2 -1.6 -1.7 -1.1 -0.8
*Revenue consists of all income less the following investing and financing results: profits or income on transfer dealings, gains or income on the sale of other assets, gains or income on the sale of financial investments, financial interest, tax income or credits.**This comprises the combination of players’ amortisation and depreciation minus the net balance between profit and losses from players trading***This comprises other operating costs and non-operating expenses (such as net finance costs, taxes and net gains and losses from sales of assets other than players)In each financial year, the missing figures of few clubs were estimated based on comparative information related to previous years income statements and in comparison with other clubs of the same country. In 2013, such estimates were made for 27 out of the 729 clubs taking part in the 54 European Top Leagues (those clubs had only 1% incidence of the total amount)
European football Top Division clubs income statement
Source: Analysis by FIGC - Study and Research Division with data provided by UEFA
Data in € billion
€ 15.0billionTotal revenues of the 729 clubs participating in the 54 Top Divisions across Europe in 2013
64%Incidence of employee costs on total revenues in 2013 (versus 54% in 2006)
€ -0.8billionTotal net loss in 2013, a significant improvement if compared to 2011 (€ -1.7 billion)
+5.7%Average annual growth of total revenues in the 2008-2013 timeframe, in comparison with the European economy that didn’t exceed +1.0%

6 International benchmarking
49
Number of clubs
Average broadcasting revenues per club
Average gate receipts per club
Average sponsorship, advertising and commercial revenues per club
Average other revenues per club
Average total revenues per club
TOTAL REVENUES
€ thousand % on total € thousand % on total € thousand % on total € thousand % on total € thousand € thousand
ENG 20 71,702 45% 33,021 21% 47,268 30% 6,414 4% 158,405 3,168,093
GER 18 36,155 31% 26,489 23% 47,758 41% 5,253 5% 115,655 2,081,793
ESP 20 44,775 48% 21,303 23% 22,227 24% 4,586 5% 92,891 1,857,827
ITA 20 51,940 59% 9,251 10% 18,155 21% 9,147 10% 88,492 1,769,847
FRA 20 31,760 49% 7,436 11% 13,079 20% 13,122 20% 65,397 1,307,940
RUS 16 5,942 10% 1,677 3% 30,842 51% 21,748 36% 60,209 963,337
TUR 18 16,179 50% 3,686 11% 9,517 30% 2,852 9% 32,234 580,220
NED 18 5,420 22% 5,131 21% 12,948 53% 1,124 5% 24,624 443,233
POR 16 8,080 43% 3,023 16% 4,969 26% 2,787 15% 18,859 301,740
SCO 12 3,827 30% 4,413 34% 4,034 31% 543 4% 12,817 153,810
INTERNATIONAL BENCHMARKING
Broadcasting
€ BI
LLIO
N
16.0
0.0
2009 2010 2011 2012 2013
Comparison of total revenues - Top Division clubs
4.2 4.5 4.8 5.5 5.9
3.0 3.2 3.33.3
3.62.5
2.6 2.52.5
2.52.12.5 2.5
2.83.0
Sponsorship and advertising Gate receipts Commercial and other incomes
ENG GER ESP ITA FRA RUS TUR NED POR SCO
%
100%
0%
11.712.8 13.2
14.115.0
Incidence of the different sources of revenue - Top 10 Leagues in 2013
Broadcasting Gate receipts Sponsorship, advertising and commercial Other income
45%
31%
48%
59%49%
10%
50%
22%
43%30%
21%
30%
4%
23%
41%
5%
23%
24%
5%
10%
21%
10%
11%
20%
20%
3%
51%
36%
11%
30%
9%
21%
53%
5%
16%
26%
15%
34%
31%
4%
Average and total revenues per club - Top 10 Leagues in 2013
Source: Analysis by FIGC - Study and Research Division with data provided by UEFA
Note: Total revenues are net of profits and losses from players trading. Other revenues include donations, grants, solidarity payments and other extraordinary revenues. Economic and financial data from the Portuguese League refer to income statement analysis of 10 clubs and estimates of other 6 clubs.
+6.4%
+9.9%
-0.1%
+4.7%
+9.1%
CAGR
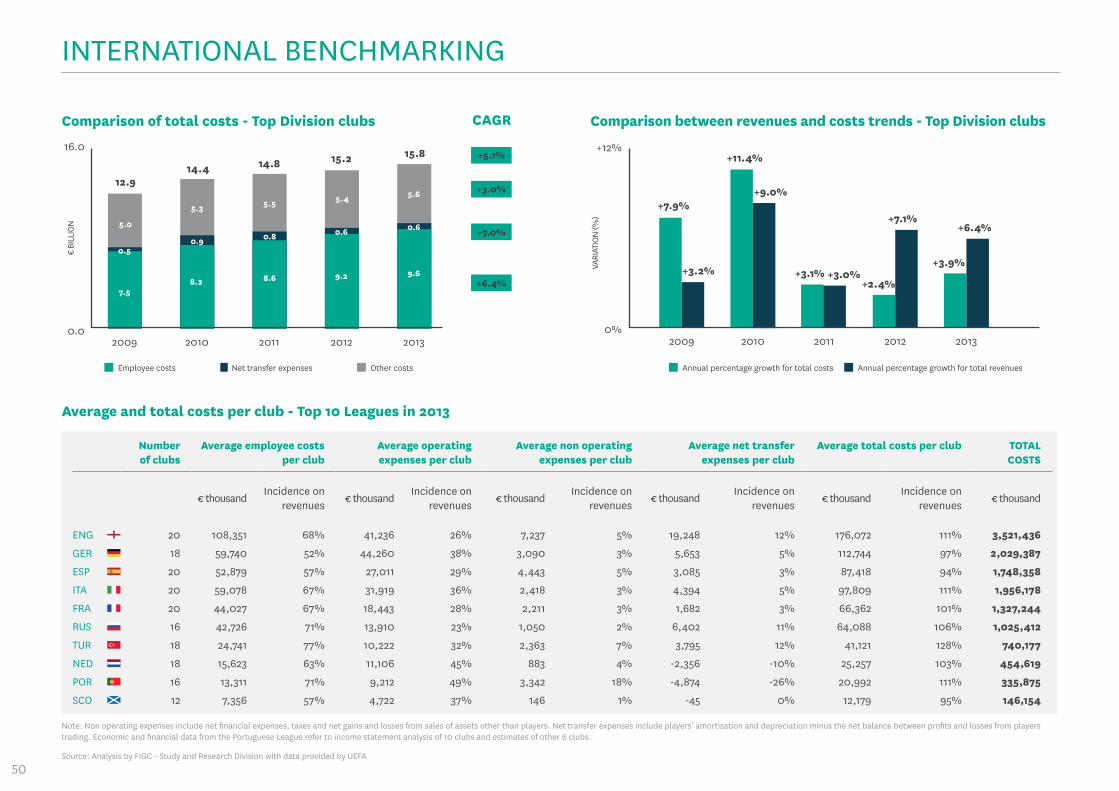
50
INTERNATIONAL BENCHMARKING
Employee costs
€ BI
LLIO
N
16.0
0.02009 2010 2011 2012 2013
Comparison of total costs - Top Division clubs
7.58.2 8.6 9.2 9.6
0.50.9 0.8 0.6 0.65.0
5.3 5.5 5.4 5.6
Net transfer expenses Other costs
VARI
ATIO
N (%
)
+12%
0%
12.914.4 14.8 15.2 15.8
Comparison between revenues and costs trends - Top Division clubs
Annual percentage growth for total costs Annual percentage growth for total revenues
CAGR
Number of clubs
Average employee costs per club
Average operating expenses per club
Average non operating expenses per club
Average net transfer expenses per club
Average total costs per club TOTAL COSTS
€ thousandIncidence on
revenues€ thousand
Incidence on revenues
€ thousandIncidence on
revenues€ thousand
Incidence on revenues
€ thousandIncidence on
revenues€ thousand
ENG 20 108,351 68% 41,236 26% 7,237 5% 19,248 12% 176,072 111% 3,521,436
GER 18 59,740 52% 44,260 38% 3,090 3% 5,653 5% 112,744 97% 2,029,387
ESP 20 52,879 57% 27,011 29% 4,443 5% 3,085 3% 87,418 94% 1,748,358
ITA 20 59,078 67% 31,919 36% 2,418 3% 4,394 5% 97,809 111% 1,956,178
FRA 20 44,027 67% 18,443 28% 2,211 3% 1,682 3% 66,362 101% 1,327,244
RUS 16 42,726 71% 13,910 23% 1,050 2% 6,402 11% 64,088 106% 1,025,412
TUR 18 24,741 77% 10,222 32% 2,363 7% 3,795 12% 41,121 128% 740,177
NED 18 15,623 63% 11,106 45% 883 4% -2,356 -10% 25,257 103% 454,619
POR 16 13,311 71% 9,212 49% 3,342 18% -4,874 -26% 20,992 111% 335,875
SCO 12 7,356 57% 4,722 37% 146 1% -45 0% 12,179 95% 146,154
Average and total costs per club - Top 10 Leagues in 2013
Source: Analysis by FIGC - Study and Research Division with data provided by UEFA
2009 2010
+7.9%
+3.2%
+11.4%
+9.0%
+3.1% +3.0%+2.4%
+7.1%
+3.9%
+6.4%
2011 2012 2013
Note: Non operating expenses include net financial expenses, taxes and net gains and losses from sales of assets other than players. Net transfer expenses include players’ amortisation and depreciation minus the net balance between profits and losses from players trading. Economic and financial data from the Portuguese League refer to income statement analysis of 10 clubs and estimates of other 6 clubs.
+5.1%
+3.0%
+7.0%
+6.4%
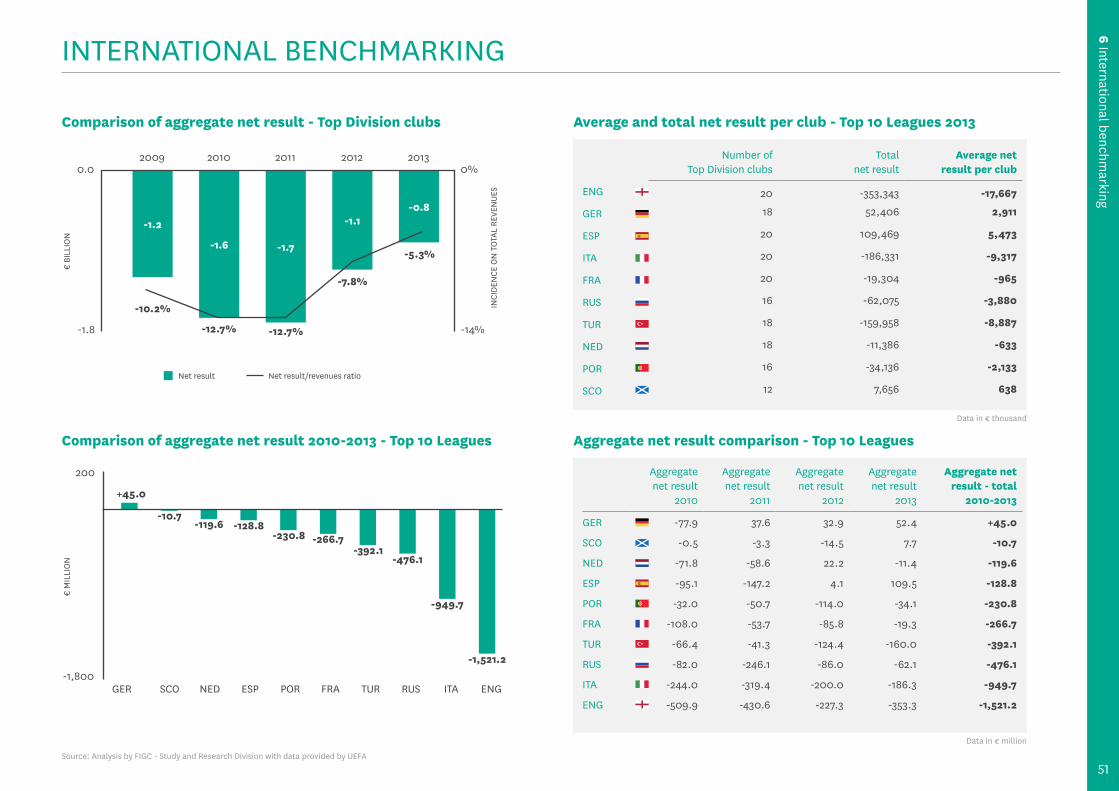
6 International benchmarking
51
€ BI
LLIO
N
INCI
DEN
CE O
N T
OTA
L RE
VEN
UES
-1.8 -14%
2009 2010 2011 2012 20130.0 0%
-1.2
-1.6 -1.7
-1.1-0.8
-10.2%
+45.0
-10.7-119.6 -128.8
-230.8 -266.7-392.1
-476.1
-949.7
-1,521.2
-12.7% -12.7%
-7.8%
-5.3%
Net result/revenues ratioNet result
€ M
ILLI
ON
200
GER SCO NED ESP POR FRA TUR RUS ITA ENG-1,800
Number of Top Division clubs
Total net result
Average net result per club
ENG 20 -353,343 -17,667
GER 18 52,406 2,911
ESP 20 109,469 5,473
ITA 20 -186,331 -9,317
FRA 20 -19,304 -965
RUS 16 -62,075 -3,880
TUR 18 -159,958 -8,887
NED 18 -11,386 -633
POR 16 -34,136 -2,133
SCO 12 7,656 638
Source: Analysis by FIGC - Study and Research Division with data provided by UEFA
Data in € thousand
INTERNATIONAL BENCHMARKING
Comparison of aggregate net result - Top Division clubs Average and total net result per club - Top 10 Leagues 2013
Comparison of aggregate net result 2010-2013 - Top 10 Leagues
Aggregate net result
2010
Aggregate net result
2011
Aggregate net result
2012
Aggregate net result
2013
Aggregate net result - total
2010-2013
GER -77.9 37.6 32.9 52.4 +45.0
SCO -0.5 -3.3 -14.5 7.7 -10.7
NED -71.8 -58.6 22.2 -11.4 -119.6
ESP -95.1 -147.2 4.1 109.5 -128.8
POR -32.0 -50.7 -114.0 -34.1 -230.8
FRA -108.0 -53.7 -85.8 -19.3 -266.7
TUR -66.4 -41.3 -124.4 -160.0 -392.1
RUS -82.0 -246.1 -86.0 -62.1 -476.1
ITA -244.0 -319.4 -200.0 -186.3 -949.7
ENG -509.9 -430.6 -227.3 -353.3 -1,521.2
Data in € million
Aggregate net result comparison - Top 10 Leagues
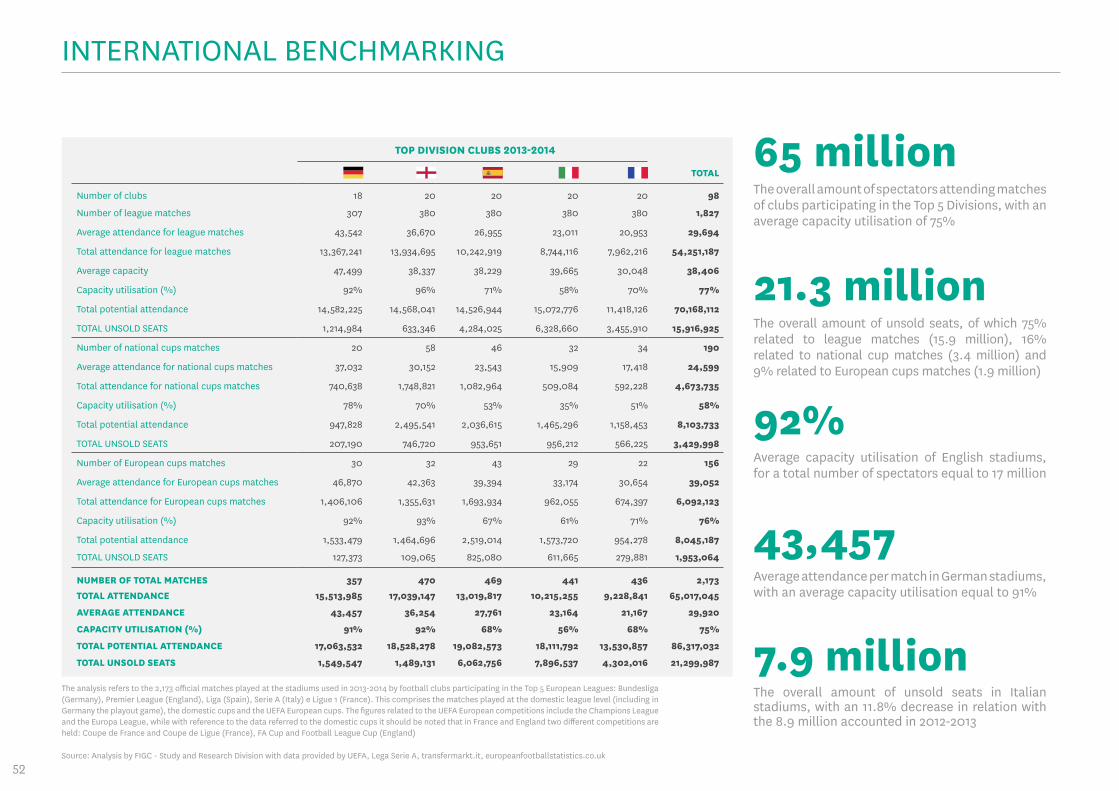
52
INTERNATIONAL BENCHMARKING
TOP DIVISION CLUBS 2013-2014
TOTAL
Number of clubs 18 20 20 20 20 98
Number of league matches 307 380 380 380 380 1,827
Average attendance for league matches 43,542 36,670 26,955 23,011 20,953 29,694
Total attendance for league matches 13,367,241 13,934,695 10,242,919 8,744,116 7,962,216 54,251,187
Average capacity 47,499 38,337 38,229 39,665 30,048 38,406
Capacity utilisation (%) 92% 96% 71% 58% 70% 77%
Total potential attendance 14,582,225 14,568,041 14,526,944 15,072,776 11,418,126 70,168,112
TOTAL UNSOLD SEATS 1,214,984 633,346 4,284,025 6,328,660 3,455,910 15,916,925
Number of national cups matches 20 58 46 32 34 190
Average attendance for national cups matches 37,032 30,152 23,543 15,909 17,418 24,599
Total attendance for national cups matches 740,638 1,748,821 1,082,964 509,084 592,228 4,673,735
Capacity utilisation (%) 78% 70% 53% 35% 51% 58%
Total potential attendance 947,828 2,495,541 2,036,615 1,465,296 1,158,453 8,103,733
TOTAL UNSOLD SEATS 207,190 746,720 953,651 956,212 566,225 3,429,998
Number of European cups matches 30 32 43 29 22 156
Average attendance for European cups matches 46,870 42,363 39,394 33,174 30,654 39,052
Total attendance for European cups matches 1,406,106 1,355,631 1,693,934 962,055 674,397 6,092,123
Capacity utilisation (%) 92% 93% 67% 61% 71% 76%
Total potential attendance 1,533,479 1,464,696 2,519,014 1,573,720 954,278 8,045,187
TOTAL UNSOLD SEATS 127,373 109,065 825,080 611,665 279,881 1,953,064
NUMBER OF TOTAL MATCHES 357 470 469 441 436 2,173TOTAL ATTENDANCE 15,513,985 17,039,147 13,019,817 10,215,255 9,228,841 65,017,045
AVERAGE ATTENDANCE 43,457 36,254 27,761 23,164 21,167 29,920
CAPACITY UTILISATION (%) 91% 92% 68% 56% 68% 75%
TOTAL POTENTIAL ATTENDANCE 17,063,532 18,528,278 19,082,573 18,111,792 13,530,857 86,317,032
TOTAL UNSOLD SEATS 1,549,547 1,489,131 6,062,756 7,896,537 4,302,016 21,299,987
The analysis refers to the 2,173 official matches played at the stadiums used in 2013-2014 by football clubs participating in the Top 5 European Leagues: Bundesliga (Germany), Premier League (England), Liga (Spain), Serie A (Italy) e Ligue 1 (France). This comprises the matches played at the domestic league level (including in Germany the playout game), the domestic cups and the UEFA European cups. The figures related to the UEFA European competitions include the Champions League and the Europa League, while with reference to the data referred to the domestic cups it should be noted that in France and England two different competitions are held: Coupe de France and Coupe de Ligue (France), FA Cup and Football League Cup (England)
Source: Analysis by FIGC - Study and Research Division with data provided by UEFA, Lega Serie A, transfermarkt.it, europeanfootballstatistics.co.uk
65 millionThe overall amount of spectators attending matches of clubs participating in the Top 5 Divisions, with an average capacity utilisation of 75%
21.3 millionThe overall amount of unsold seats, of which 75% related to league matches (15.9 million), 16% related to national cup matches (3.4 million) and 9% related to European cups matches (1.9 million)
92%Average capacity utilisation of English stadiums, for a total number of spectators equal to 17 million
43,457Average attendance per match in German stadiums, with an average capacity utilisation equal to 91%
7.9 millionThe overall amount of unsold seats in Italian stadiums, with an 11.8% decrease in relation with the 8.9 million accounted in 2012-2013
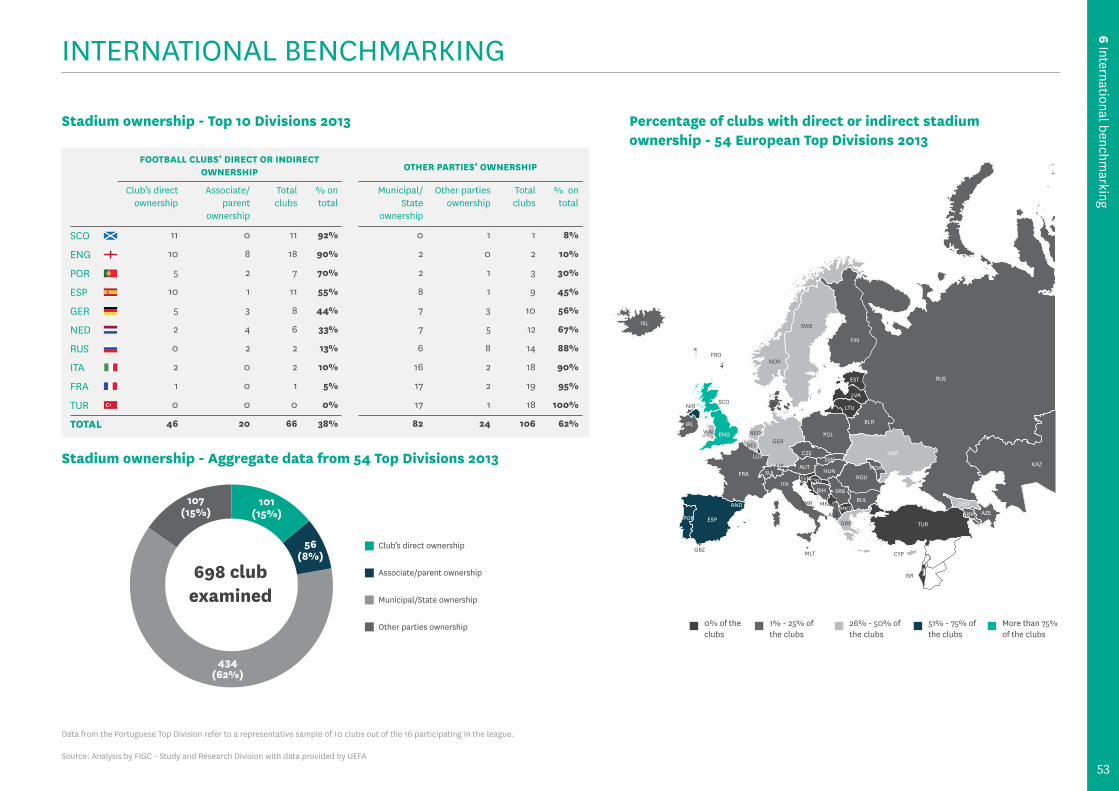
6 International benchmarking
53
INTERNATIONAL BENCHMARKING
FOOTBALL CLUBS’ DIRECT OR INDIRECT OWNERSHIP OTHER PARTIES’ OWNERSHIP
Club’s direct ownership
Associate/parent
ownership
Total clubs
% on total
Municipal/State
ownership
Other parties ownership
Total clubs
% on total
SCO 11 0 11 92% 0 1 1 8%
ENG 10 8 18 90% 2 0 2 10%
POR 5 2 7 70% 2 1 3 30%
ESP 10 1 11 55% 8 1 9 45%
GER 5 3 8 44% 7 3 10 56%
NED 2 4 6 33% 7 5 12 67%
RUS 0 2 2 13% 6 8 14 88%
ITA 2 0 2 10% 16 2 18 90%
FRA 1 0 1 5% 17 2 19 95%
TUR 0 0 0 0% 17 1 18 100%
TOTAL 46 20 66 38% 82 24 106 62%
Stadium ownership - Top 10 Divisions 2013 Percentage of clubs with direct or indirect stadium ownership - 54 European Top Divisions 2013
Stadium ownership - Aggregate data from 54 Top Divisions 2013
Club’s direct ownership
Associate/parent ownership
Municipal/State ownership
Other parties ownership
698 club examined
434(62%)
107(15%)
101(15%)
56(8%)
Source: Analysis by FIGC - Study and Research Division with data provided by UEFA
Data from the Portuguese Top Division refer to a representative sample of 10 clubs out of the 16 participating in the league.
0% of the clubs
1% - 25% of the clubs
26% - 50% of the clubs
51% - 75% of the clubs
More than 75% of the clubs
ESP
ISL
FRO
GBZ MLT
NIR
IRL
SCO
ENG
FRA
ITA
BEL
LIE
GER
CZE
POL
SVK
HUNSVNCRO
BIH
BLR
RUS
FIN
SWE
NOR
DEN
UKR
ROU
BULMKD
ALB
MNESMR
SRB
MDA
TUR
AZE
KAZ
EST
LVA
LTU
CYP
ISR
ARMGRE
SUIAUT
LUX
NED
POR
AND GEO
WAL
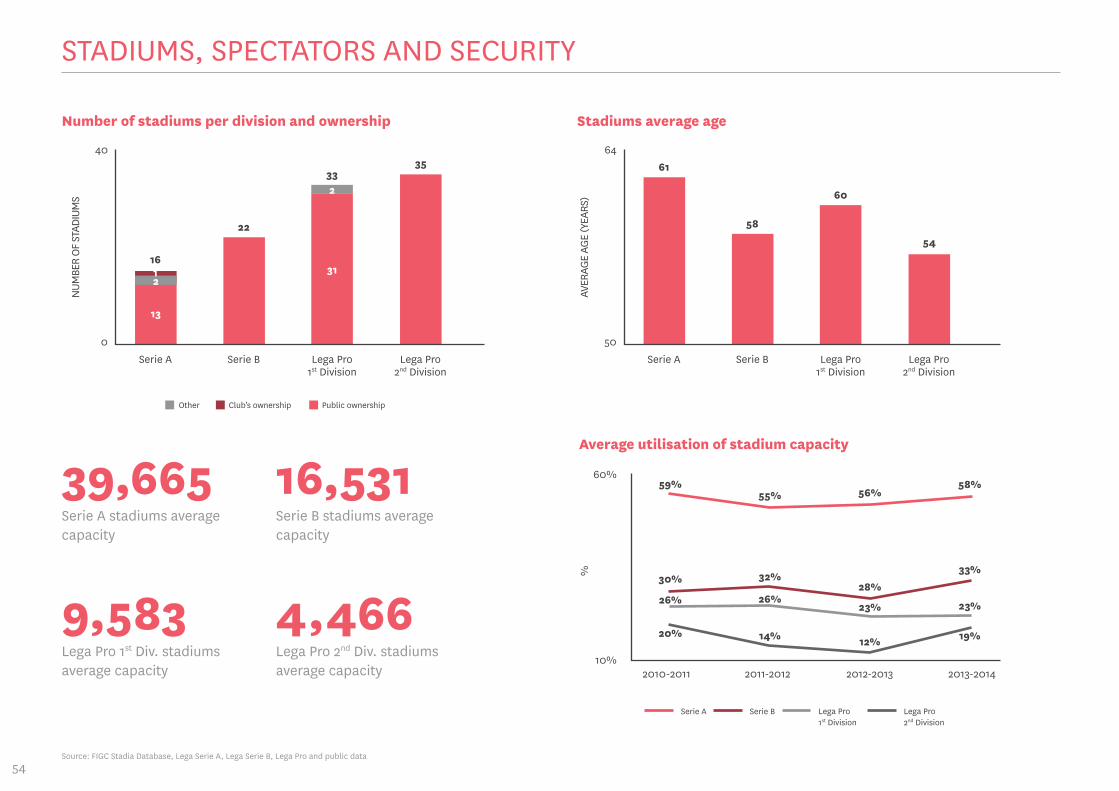
54
STADIUMS, SPECTATORS AND SECURITY
AVER
AGE
AGE
(YEA
RS)
64
50Serie A Serie B
61
58
60
54
Lega Pro1st Division
Lega Pro2nd Division
31
13
NUM
BER
OF S
TADI
UMS
40
0Serie A Serie B
16
22
3335
Lega Pro1st Division
Lega Pro2nd Division
Stadiums average ageNumber of stadiums per division and ownership
2
2
39,665Serie A stadiums average capacity
9,583Lega Pro 1st Div. stadiums average capacity
16,531Serie B stadiums average capacity
4,466Lega Pro 2nd Div. stadiums average capacity
Other Club’s ownership Public ownership
Source: FIGC Stadia Database, Lega Serie A, Lega Serie B, Lega Pro and public data
Average utilisation of stadium capacity
%
60%
10%2010-2011 2011-2012 2012-2013 2013-2014
59%
30%
26%
20% 14% 12%
32%
26%23% 23%
19%
28%33%
55% 56%58%
Serie A Serie B Lega Pro1st Division
Lega Pro 2nd Division
1
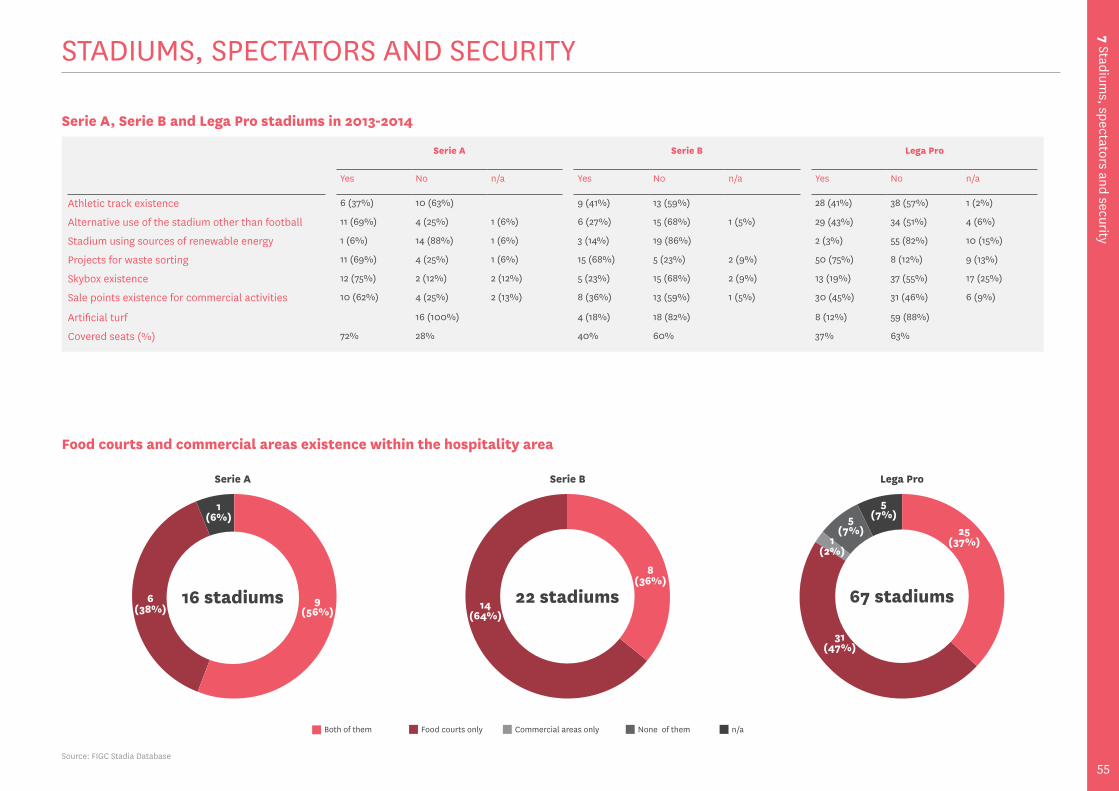
7 Stadiums, spectators and security
55
STADIUMS, SPECTATORS AND SECURITY
Source: FIGC Stadia Database
Food courts and commercial areas existence within the hospitality area
Both of them Food courts only Commercial areas only None of them n/a
Serie A, Serie B and Lega Pro stadiums in 2013-2014
Serie A Serie B Lega Pro
Yes No n/a Yes No n/a Yes No n/a
Athletic track existence 6 (37%) 10 (63%) 9 (41%) 13 (59%) 28 (41%) 38 (57%) 1 (2%)
Alternative use of the stadium other than football 11 (69%) 4 (25%) 1 (6%) 6 (27%) 15 (68%) 1 (5%) 29 (43%) 34 (51%) 4 (6%)
Stadium using sources of renewable energy 1 (6%) 14 (88%) 1 (6%) 3 (14%) 19 (86%) 2 (3%) 55 (82%) 10 (15%)
Projects for waste sorting 11 (69%) 4 (25%) 1 (6%) 15 (68%) 5 (23%) 2 (9%) 50 (75%) 8 (12%) 9 (13%)
Skybox existence 12 (75%) 2 (12%) 2 (12%) 5 (23%) 15 (68%) 2 (9%) 13 (19%) 37 (55%) 17 (25%)
Sale points existence for commercial activities 10 (62%) 4 (25%) 2 (13%) 8 (36%) 13 (59%) 1 (5%) 30 (45%) 31 (46%) 6 (9%)
Artificial turf 16 (100%) 4 (18%) 18 (82%) 8 (12%) 59 (88%)
Covered seats (%) 72% 28% 40% 60% 37% 63%
Serie A
9(56%)
6(38%)
1(6%)
16 stadiums
Serie B
8(36%)
14(64%)
22 stadiums
Lega Pro
25(37%)
31(47%)
5(7%)5
(7%)1
(2%)
67 stadiums
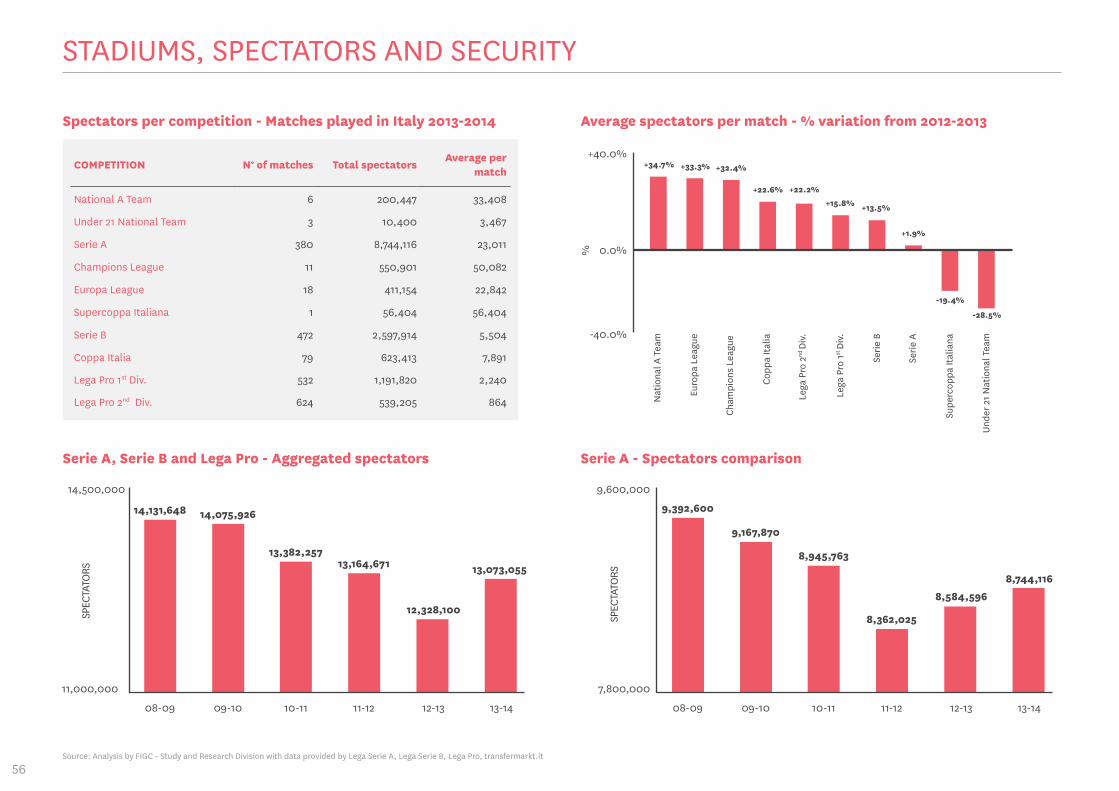
56
STADIUMS, SPECTATORS AND SECURITY
Spectators per competition - Matches played in Italy 2013-2014
COMPETITION N° of matches Total spectators Average per
match
National A Team 6 200,447 33,408
Under 21 National Team 3 10,400 3,467
Serie A 380 8,744,116 23,011
Champions League 11 550,901 50,082
Europa League 18 411,154 22,842
Supercoppa Italiana 1 56,404 56,404
Serie B 472 2,597,914 5,504
Coppa Italia 79 623,413 7,891
Lega Pro 1st Div. 532 1,191,820 2,240
Lega Pro 2nd Div. 624 539,205 864
Average spectators per match - % variation from 2012-2013
%
+40.0%
0.0%
Nat
iona
l A T
eam
+34.7% +33.3% +32.4%
+22.6% +22.2%+15.8% +13.5%
+1.9%
-19.4%
-28.5%
Euro
pa L
eagu
e
Cham
pion
s Le
ague
Copp
a Ita
lia
Lega
Pro
2nd
Div.
Lega
Pro
1st Di
v.
Serie
B
Serie
A
Supe
rcop
pa It
alia
na
Unde
r 21 N
atio
nal T
eam-40.0%
SPEC
TATO
RS
14,500,000
11,000,000
08-09 09-10
14,131,648 14,075,926
13,382,25713,164,671
12,328,100
13,073,055
10-11 11-12
Serie A, Serie B and Lega Pro - Aggregated spectators
12-13 13-14
Source: Analysis by FIGC - Study and Research Division with data provided by Lega Serie A, Lega Serie B, Lega Pro, transfermarkt.it
SPEC
TATO
RS
9,600,000
7,800,000
08-09 09-10
9,392,600
9,167,870
8,945,763
8,362,025
8,584,596
8,744,116
10-11 11-12
Serie A - Spectators comparison
12-13 13-14
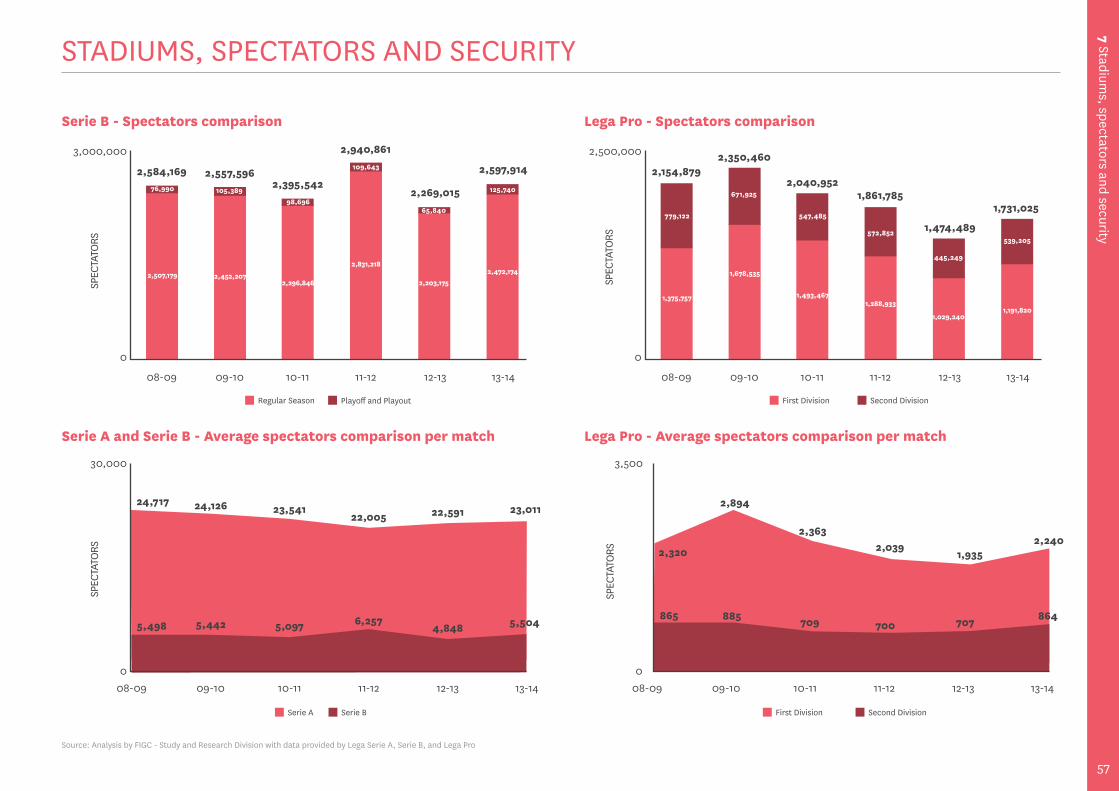
7 Stadiums, spectators and security
57
STADIUMS, SPECTATORS AND SECURITYSP
ECTA
TORS
3,000,000
0
08-09 09-10
2,584,169
24,717 24,126 23,54122,005 22,591 23,011
2,557,5962,395,542
2,940,861
2,269,015
2,597,914
10-11 11-12
Serie B - Spectators comparison
12-13 13-14
Playoff and PlayoutRegular Season
2,507,179 2,452,2072,296,846
2,831,218
2,203,1752,472,174
76,990 105,38998,696
109,643
65,840
125,740
SPEC
TATO
RS
2,500,000
0
08-09 09-10
2,154,8792,350,460
2,040,9521,861,785
1,474,489
1,731,025
10-11 11-12
Lega Pro - Spectators comparison
12-13 13-14
1,375,757
1,678,535
1,493,4671,288,933
1,029,2401,191,820
779,122
671,925
547,485
572,852
445,249
539,205
Second DivisionFirst Division
SPEC
TATO
RS
30,000
008-09 09-10 10-11 11-12
Serie A and Serie B - Average spectators comparison per match
12-13 13-14
Serie A Serie B First Division Second Division
Source: Analysis by FIGC - Study and Research Division with data provided by Lega Serie A, Serie B, and Lega Pro
5,498 5,442 5,097 6,2574,848 5,504
2,320
2,894
2,3632,039
1,9352,240
SPEC
TATO
RS
3,500
008-09 09-10 10-11 11-12
Lega Pro - Average spectators comparison per match
12-13 13-14
865 885 709 700 707 864
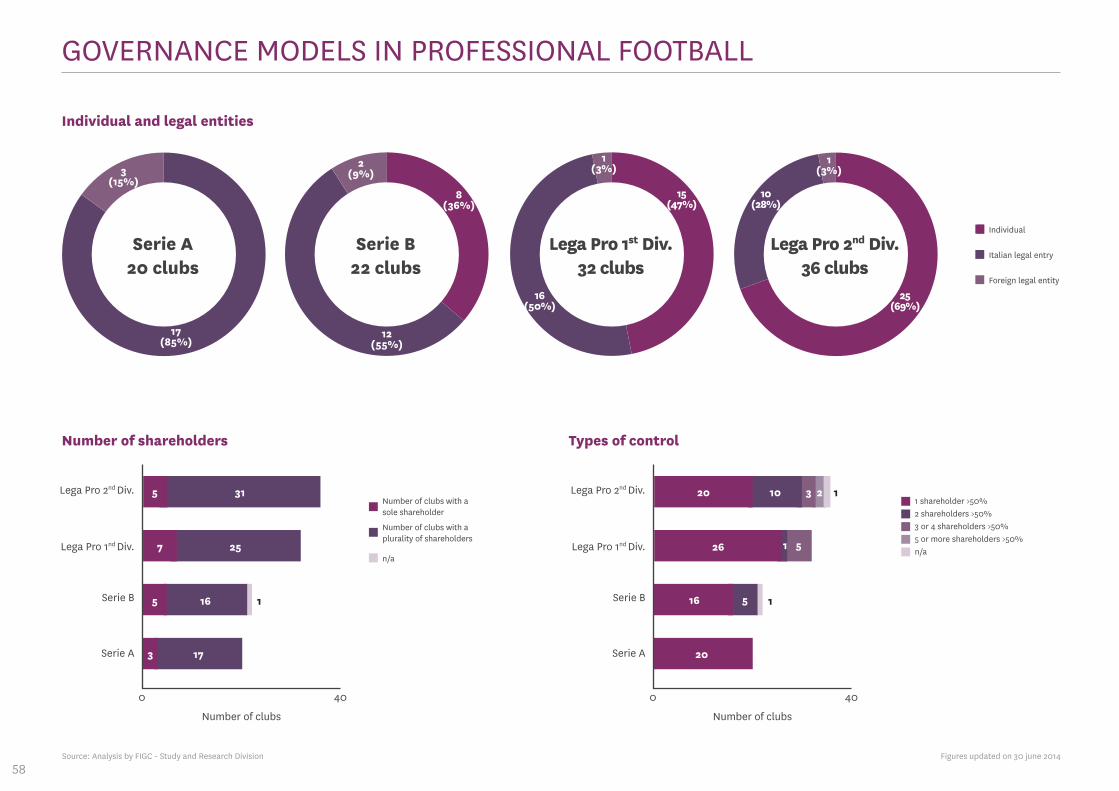
58
GOVERNANCE MODELS IN PROFESSIONAL FOOTBALL
Individual and legal entities
Source: Analysis by FIGC - Study and Research Division Figures updated on 30 june 2014
Italian legal entry
Foreign legal entity
Individual
Serie A20 clubs
17(85%)
3(15%)
Serie B22 clubs
12(55%)
2(9%)
8(36%)
Lega Pro 2nd Div.36 clubs
1(3%)
10(28%)
25(69%)
Lega Pro 1st Div.32 clubs
1(3%)
15(47%)
16(50%)
Number of shareholders Types of control
Lega Pro 2nd Div. Lega Pro 2nd Div.
0 040 40
Number of clubs with a sole shareholder
Number of clubs with a plurality of shareholders
n/a
3 or 4 shareholders >50%5 or more shareholders >50%
2 shareholders >50%
n/a
1 shareholder >50%
Lega Pro 1nd Div. Lega Pro 1nd Div.
Serie B Serie B
Serie A Serie A
Number of clubs Number of clubs
5 20
26
16 5
1
10 3 2
5
20
7
5
31
25
16 1 1
1
3 17
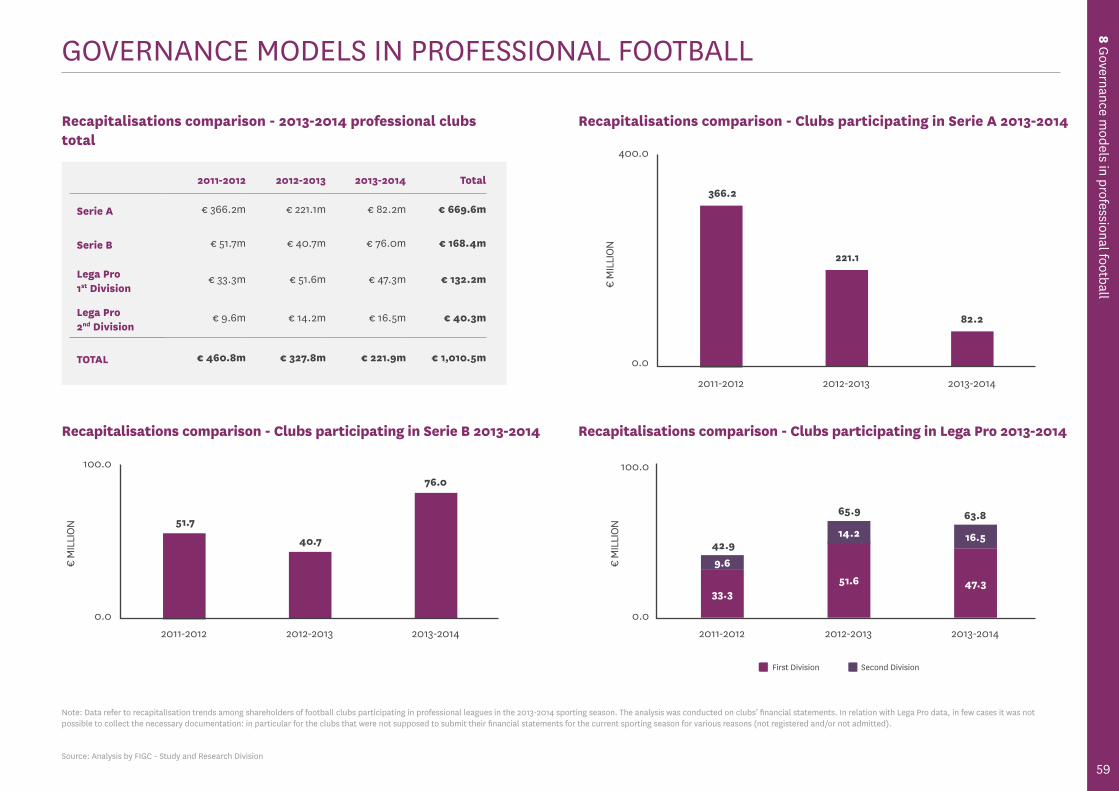
8 Governance m
odels in professional football
59
GOVERNANCE MODELS IN PROFESSIONAL FOOTBALL
2011-2012 2012-2013 2013-2014 Total
Serie A € 366.2m € 221.1m € 82.2m € 669.6m
Serie B € 51.7m € 40.7m € 76.0m € 168.4m
Lega Pro 1st Division
€ 33.3m € 51.6m € 47.3m € 132.2m
Lega Pro 2nd Division
€ 9.6m € 14.2m € 16.5m € 40.3m
TOTAL € 460.8m € 327.8m € 221.9m € 1,010.5m
Recapitalisations comparison - 2013-2014 professional clubs total
€ M
ILLI
ON
€ M
ILLI
ON
400.0
100.0
0.0
0.0
2011-2012
2011-2012
2012-2013
2012-2013
366.2
51.7
221.1
40.7
82.2
76.0
2013-2014
2013-2014
Recapitalisations comparison - Clubs participating in Serie A 2013-2014
Recapitalisations comparison - Clubs participating in Serie B 2013-2014
€ M
ILLI
ON
100.0
0.02011-2012 2012-2013
51.633.3
42.9
65.9 63.8
2013-2014
47.3
Recapitalisations comparison - Clubs participating in Lega Pro 2013-2014
9.6
14.2 16.5
Second DivisionFirst Division
Source: Analysis by FIGC - Study and Research Division
Note: Data refer to recapitalisation trends among shareholders of football clubs participating in professional leagues in the 2013-2014 sporting season. The analysis was conducted on clubs’ financial statements. In relation with Lega Pro data, in few cases it was not possible to collect the necessary documentation: in particular for the clubs that were not supposed to submit their financial statements for the current sporting season for various reasons (not registered and/or not admitted).
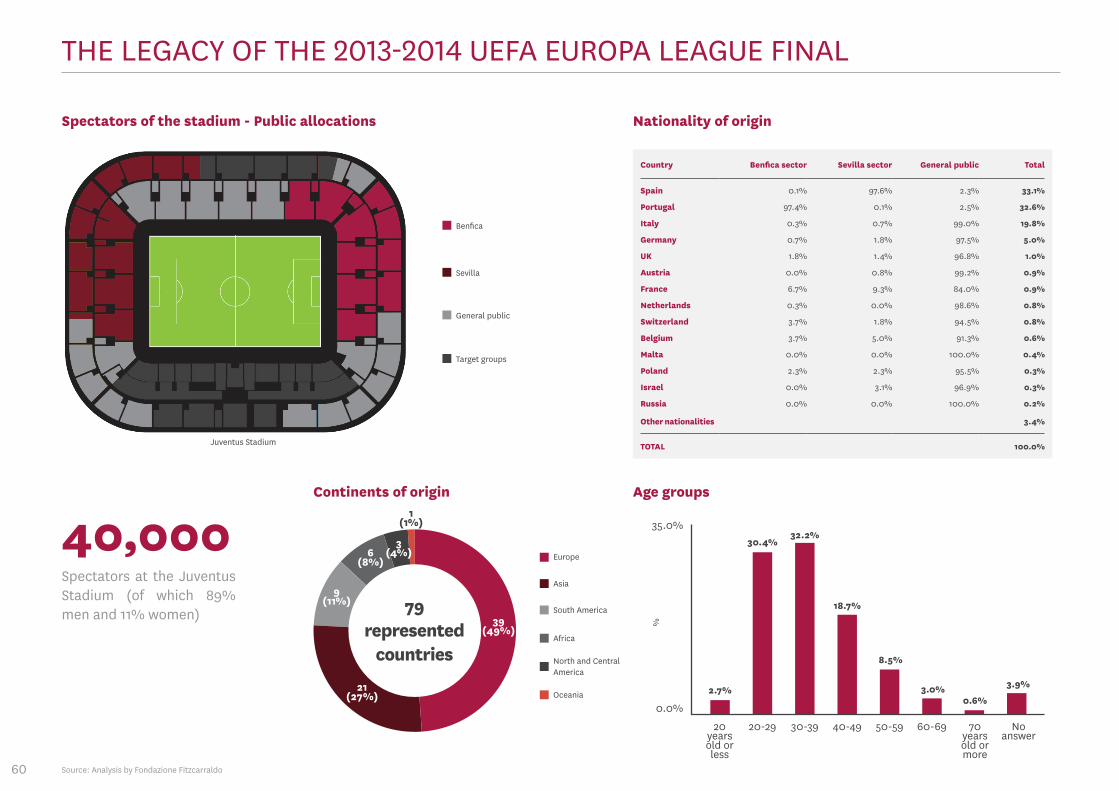
60
THE LEGACY OF THE 2013-2014 UEFA EUROPA LEAGUE FINAL
Spectators of the stadium - Public allocations
Benfica
Sevilla
General public
Target groups
Juventus Stadium
Country Benfica sector Sevilla sector General public Total
Spain 0.1% 97.6% 2.3% 33.1%
Portugal 97.4% 0.1% 2.5% 32.6%
Italy 0.3% 0.7% 99.0% 19.8%
Germany 0.7% 1.8% 97.5% 5.0%
UK 1.8% 1.4% 96.8% 1.0%
Austria 0.0% 0.8% 99.2% 0.9%
France 6.7% 9.3% 84.0% 0.9%
Netherlands 0.3% 0.0% 98.6% 0.8%
Switzerland 3.7% 1.8% 94.5% 0.8%
Belgium 3.7% 5.0% 91.3% 0.6%
Malta 0.0% 0.0% 100.0% 0.4%
Poland 2.3% 2.3% 95.5% 0.3%
Israel 0.0% 3.1% 96.9% 0.3%
Russia 0.0% 0.0% 100.0% 0.2%
Other nationalities 3.4%
TOTAL 100.0%
Nationality of origin
Europe
Asia
South America
Africa
North and CentralAmerica
Oceania
Continents of origin
39(49%)
21(27%)
9(11%)
6(8%)
Source: Analysis by Fondazione Fitzcarraldo
3(4%)
1(1%)
20 years old or less
20-29 30-39 40-49 50-59 60-69 70 years old or more
No answer
%
35.0%
0.0%
2.7%
30.4%32.2%
18.7%
8.5%
3.0%0.6%
3.9%
Age groups
40,000Spectators at the Juventus Stadium (of which 89% men and 11% women) 79
represented countries
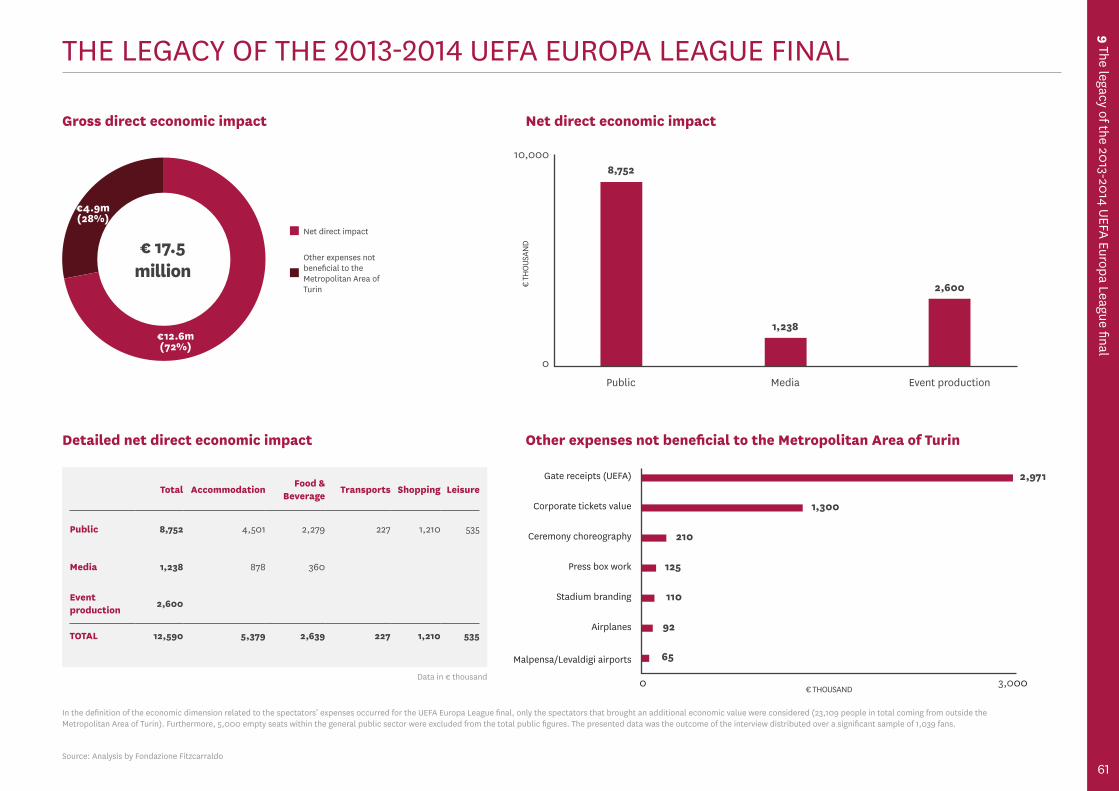
9 The legacy of the 2013-2014 UEFA Europa League final
61
THE LEGACY OF THE 2013-2014 UEFA EUROPA LEAGUE FINAL
Gross direct economic impact
€ TH
OUSA
ND
10,000
0
Public Media
8,752
1,238
2,600
Event production
Net direct economic impact
Net direct impact
Other expenses not beneficial to the Metropolitan Area of Turin
€12.6m(72%)
€4.9m(28%)
Total AccommodationFood &
BeverageTransports Shopping Leisure
Public 8,752 4,501 2,279 227 1,210 535
Media 1,238 878 360
Event production
2,600
TOTAL 12,590 5,379 2,639 227 1,210 535
Detailed net direct economic impact Other expenses not beneficial to the Metropolitan Area of Turin
210
125
110
92
65
Gate receipts (UEFA)
Corporate tickets value
Ceremony choreography
Press box work
Stadium branding
Airplanes
0€ THOUSAND
1,300
2,971
3,000
Malpensa/Levaldigi airports
Source: Analysis by Fondazione Fitzcarraldo
Data in € thousand
In the definition of the economic dimension related to the spectators’ expenses occurred for the UEFA Europa League final, only the spectators that brought an additional economic value were considered (23,109 people in total coming from outside the Metropolitan Area of Turin). Furthermore, 5,000 empty seats within the general public sector were excluded from the total public figures. The presented data was the outcome of the interview distributed over a significant sample of 1,039 fans.
€ 17.5million
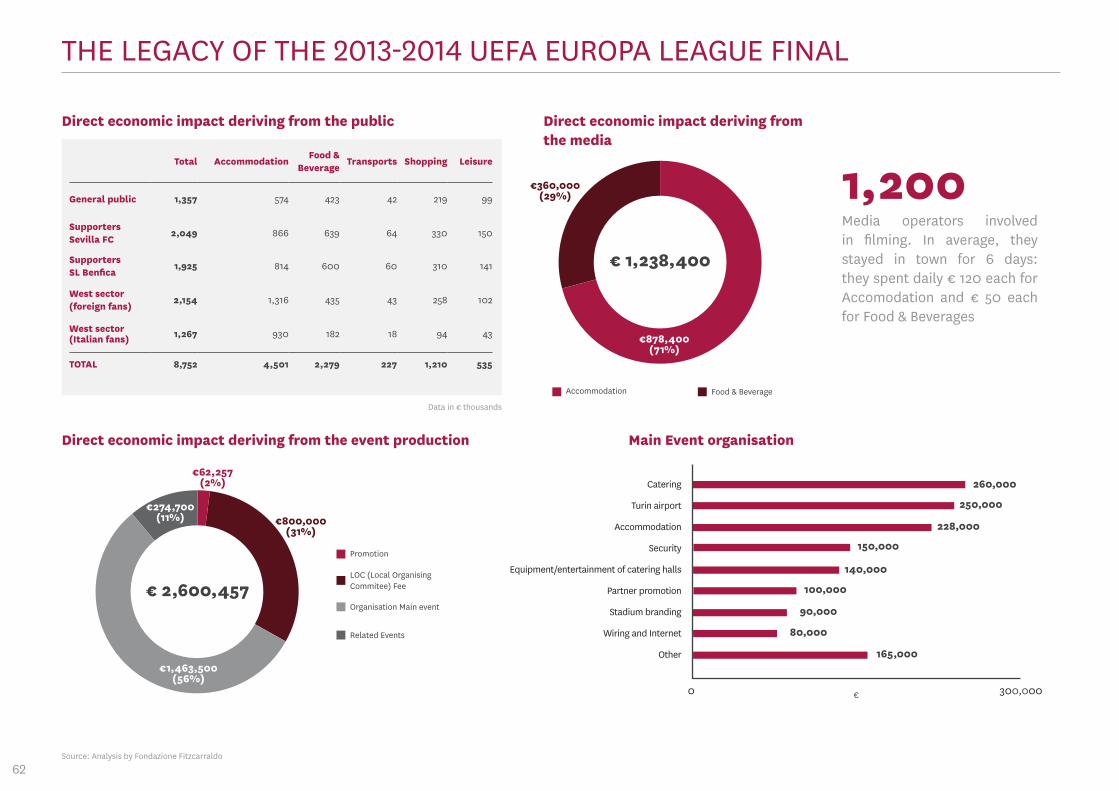
62
THE LEGACY OF THE 2013-2014 UEFA EUROPA LEAGUE FINAL
Data in € thousands
Total AccommodationFood &
BeverageTransports Shopping Leisure
General public 1,357 574 423 42 219 99
Supporters Sevilla FC
2,049 866 639 64 330 150
Supporters SL Benfica
1,925 814 600 60 310 141
West sector (foreign fans)
2,154 1,316 435 43 258 102
West sector (Italian fans) 1,267 930 182 18 94 43
TOTAL 8,752 4,501 2,279 227 1,210 535
Direct economic impact deriving from the public Direct economic impact deriving from the media
Accommodation Food & Beverage
€360,000(29%) 1,200
Media operators involved in filming. In average, they stayed in town for 6 days: they spent daily € 120 each for Accomodation and € 50 each for Food & Beverages
€ 1,238,400
€ 2,600,457
Direct economic impact deriving from the event production
Promotion
LOC (Local Organising Commitee) Fee
Organisation Main event
Related Events
€274,700(11%)
€62,257(2%)
€1,463,500(56%)
€800,000(31%)
Main Event organisation
260,000
250,000
228,000
150,000
140,000
100,000
90,000
80,000
165,000
Catering
Turin airport
Accommodation
Security
Equipment/entertainment of catering halls
Partner promotion
Stadium branding
Wiring and Internet
Other
0 300,000€
Source: Analysis by Fondazione Fitzcarraldo
€878,400(71%)
63
CREDITS
Project authors and executives: Niccolò Donna , FIGC - Study and Research Division, and PwC for financial topics
Coordination and editing FIGC: Niccolò Donna, Alessandro Mosca, Gianluca Famigli
Coordination and editing PwC: Giorgio Bonfanti, Giampaolo Panetta, Gabriele Picuti, Chiara Valzano
Verbal oversight: Gianfranco Teotino
Text overview: Marta Tamburrelli
Graphic elaboration: blossoming.it
The following offices and departments of the Italian Football Association participated in the creation of the document: National Teams Area, Professional Football Financial Control Commitee (Co.Vi.So.C.), National Coordination of Safety and Security Delegates, TV Broadcasting Rights, UEFA Club Licensing and Financial Fair Play, Marketing, General Secretariat, IT Systems, Press Office, Insitutional and External Relations, Registration Office, Vivo Azzurro
Special thanks for their collaboration to: Lega Serie A Lega Serie B Lega Italiana Calcio Professionistico National Amateur League Italian Referees’ Association Italian Players’ Union Italian Coaches’ Union Technical Sector Youth and School Sector
Special thanks as well to: FIFA UEFA CIES ECA Ministero dell’Interno Ministero dell’Economia e delle Finanze Osservatorio Nazionale sulle Manifestazioni Sportive Inps (gestione ex Enpals) Agenzia delle Dogane e dei Monopoli RCS Sport Repucom Fondazione Fitzcarraldo Professor Adriano Benazzi Dr. Gianfranco Serioli Professor Ennio Lugli Professor Luigi Marchini
Photo credits: FIGC photografich database, LND photografic database, Getty Images
REPORTCALCIO 2015

Printed July 27, 2015Grafica Cristal S.r.l. - Via Raffaele Paolucci, 12/14 - 00152 Roma