introduction - oklahoma state university– · web viewa split-plot in space analysis of...
TRANSCRIPT

S O I L F E R T I L I T Y R E S E A R C H R E P O R T 1 9 9 7
O K L A H O M A A G R I C U L T U R A L E X P E R I M E N T S T A T I O N
O K L A H O M A C O O P E R A T I V E E X T E N S I O N S E R V I C E
D I V I S I O N O F A G R I C U L T U R A L S C I E N C E S A N D
N A T U R A L R E S O U R C E S
O K L A H O M A S T A T E U N I V E R S I T Y
E D I T O R S
H . S e m b i r i n g , J . M . L a R u f f a , S . B . P h i l l i p s , E . V . L u k i n a , W . E . T h o m a s o n ,
J . C h e n , H . L . L e e s , D . A . K e a h e y , J . L . D e n n i s , D . A . C o s s e y , M . W . G o e d e k e n , S . L . N o r t o n ,
B . M . H o w e l l , M . J . D e L e o n , S . L . T a y l o r , J . B . S o l i e , M . L . S t o n e , R . W . W h i t n e y
N . T . B a s t a , J . A . H a t t e y , H . Z h a n g ,R . L . W e s t e r m a n , G . V . J o h n s o n a n d W . R . R a u n
D E P A R T M E N T O F P L A N T A N D S O I L S C I E N C E S

Page 2 1997 OSU Soil Fertility Research

OSU Soil Fertility Research 1997 Page 3
ForewordOn November 1, 1989, the state adopted a program whereby an assessment of thirty cents
($0.30) per ton of fertilizer sold in the state would be directed for the sole purpose of conducting soil fertility research involving efficient fertilizer use on agronomic crops and forages and groundwater protection from plant food nutrients. A Research Advisory Committee was formed to oversee and guide research programs as mandated by the legislation. The committee is composed of representatives from the Oklahoma Fertilizer and Chemical Association, fertilizer dealer representatives from the northeast, southeast, northwest and southwest quadrants of the state, representative from a fertilizer manufacturer, representatives from the Farm Bureau and Farmers Union and the Director of the Oklahoma Department of Agriculture with Ex-Officio members consisting of the Head of the Department of Plant and Soil Sciences, Oklahoma State University, the Director of the Oklahoma Conservation Commission and the President of the Oklahoma Fertilizer and Chemical Association. Each year, the Research Advisory Committee meets to review preproposals for research. Without the support provided by The Fertilizer Advisory Board (Senate Bill 314), the extent of work reported here would not have been possible.
Over the years many agricultural industries, agencies and commodity groups have provided support and service for ongoing research projects that promote the wise and efficient use of fertilizers that minimize environmental risks. Significant contributors include the following:
The Fertilizer Advisory Board, SB 314Samuel Roberts Noble FoundationOklahoma Fertilizer and Chemical AssociationOklahoma Plant Food Educational SocietyFarmland Industries Phillips Chemical Company Agrico Allied Chemical The Potash/Phosphate Institute The Foundation for Agronomic Research The Fluid Fertilizer Foundation Tennessee Valley Authority State Department of Agriculture Oklahoma Wheat Research Foundation Oklahoma Wheat CommissionOklahoma Center for the Advancement of Science and Technology
Many of these groups still provide financial assistance and service today. Investigators whose work is cited in this report greatly appreciate the cooperation of many County Extension Agents, Area Extension Agronomists, farmers and ranchers, fertilizer dealers, grain dealers, seed suppliers, fertilizer equipment manufacturers, agricultural chemical manufacturers, and the representatives of the various firms who contributed time, effort, land, machinery, materials and laboratory analyses. Without their support, much of the work reported here would have greatly diminished.
This report provides a summary of some of the latest results in soil fertility research and as such does not constitute publication of the finalized form of the various investigations. No part of this report may be duplicated or reproduced without the written consent of the individual researchers involved.
Both English and metric units are used in the articles which comprise this document. A simple conversion table has been included (Appendix Table 1) in order to avoid any confusion that might arise.
Robert L. WestermanProfessor and HeadDepartment of Plant and Soil SciencesOklahoma State University

Page 4 1997 OSU Soil Fertility Research
Graduate Students in Soil Fertility (1994-present)H. Sembiring Indonesia M.S. 1993, Ph.D. 1997

OSU Soil Fertility Research 1997 Page 5
J.M. LaRuffa USA M.S. 1998S.B. Phillips USA M.S. 1995, Ph.D. 1999E.V. Lukina Uzbekistan M.S. 1998W.E. Thomason USA M.S. 1998J. Chen China M.S. 1997H.L. Lees USA M.S. 1997D.A. Keahey USA M.S. 1997J.L. Dennis USA M.S. 1999D.A. Cossey USA M.S. 1999B.M. Howell USA M.S. 1999M.W. Goedeken USA M.S. 1998M.J. DeLeon Argentina M.S. 1999O. Kachurina Russia Ph.D. 2000S.L. Taylor USA M.S. 1996M.E. Jojola USA M.S. 1994J.B. Ball USA M.S. 1995E.N. Ascencio El Salvador M.S. 1992, Ph.D. 1995F. Gavi-Reyes Mexico Ph.D. 1995F. Kanampiu Kenya Ph.D. 1995
Contributing Plant and Soil Sciences Faculty and StaffN.T. Basta USA Soil ChemistryJ.A. Hattey USA Soil Science Teaching and ResearchHailin Zhang China Director Soil, Water and Forage Anal. LabR.B. Westerman USA Row Crops Weed SpecialistJ.H. Stiegler USA Soil ManagementJ.L. Caddel USA Alfalfa BreedingE.G. Krenzer USA Small Grains SpecialistD.S. Murray USA Row Crops Weed ControlJ.F. Stritzke USA Forage Weed ControlC.M. Taliaferro USA Bermudagrass and Switchgrass BreedingB. Woods USA Extension Area AgronomistM.P. Anderson USA Plant BiochemistryJ.C. Banks USA Cotton SpecialistR.L.Gillen USA Range ScienceT.L. Springer USA Cropping SystemsR.L. Westerman USA Department HeadG.V. Johnson USA Soil Fertility Extension and ResearchW.R. Raun USA Soil Fertility Research
Contributing Biosystems and Agricultural Engineering FacultyJ.B. Solie USA Machine Design and AnalysisM.L. Stone USA Sensor Design and ControlsR.W. Whitney USA Machine Design and Analysis/Pesticide Application
Contributing Staff from The Noble FoundationJ.L. Rogers USA Soil FertilityW. Altom USA Soil Fertility/Crop Management
Undergraduate Support PersonnelS.L. Norton Mangum, OKT.R. Johnston Bartlesville, OKD.W. Drury Mangum, OKJ.W. Moore Frederick, OKC.A. Dietrick Guymon, OKC.G. Lively Mangum, OKK.J. Wynn Mangum, OKW. Hahn Bartlesville, OKC. Woolfolk Guymon, OKJ. Tallman Welch, OKM.K. Fletcher Altus, OKR.F. Miller Stillwater, OKS.E. Taylor Vinson, OKRavi Kolli Hydrabad, IndiaP. Hale Lexington, KY

Page 6 1997 OSU Soil Fertility Research

OSU Soil Fertility Research 1997 Page 7
TABLE OF CONTENTS
LONG TERM EXPERIMENTS............................................................................................................ 9
LONG-TERM WINTER WHEAT FERTILITY EXPERIMENT WITH CONTINUOUS APPLICATIONS OF N, P AND K, EXPERIMENT #222, STILLWATER, OK...............................................................................................9WHEAT GRAIN YIELD RESPONSE TO NITROGEN, PHOSPHORUS AND POTASSIUM FERTILIZATION, EXPERIMENT 406, ALTUS, OKLAHOMA................................................................................................12RESPONSE OF DRYLAND WINTER WHEAT TO NITROGEN, PHOSPHORUS AND POTASSIUM FERTILIZATION, EXPERIMENT 407, ALTUS, OKLAHOMA................................................................................................15RESPONSE OF GRAIN SORGHUM TO NITROGEN, PHOSPHORUS AND POTASSIUM FERTILIZATION, EXPERIMENT 501, LAHOMA, OKLAHOMA............................................................................................18EFFECTS OF ANNUAL APPLICATIONS OF NITROGEN, PHOSPHORUS AND POTASSIUM ON GRAIN YIELD CONTINUOUS WINTER WHEAT PRODUCTION, EXPERIMENT 502, LAHOMA, OKLAHOMA........................21NITROGEN SOURCE AND RATE EFFECTS ON LONG-TERM CONTINOUS WINTER WHEAT GRAIN YIELD, EXPERIMENT 505, LAHOMA, OKLAHOMA............................................................................................24EFFECTS OF NITROGEN, PHOSPHORUS, AND POTASSIUM ON YIELD OF WINTER WHEAT, EXPERIMENT 801, HASKELL, OKLAHOMA................................................................................................................ 28WHEAT GRAIN YIELD RESPONSE IN ACID SOILS TO PHOSPHORUS APPLICATIONS, EXPERIMENT 802, HASKELL, OKLAHOMA........................................................................................................................ 31WHEAT GRAIN YIELD RESPONSE IN ACID SOILS TO POTASSIUM APPLICATIONS, EXPERIMENT 803, HASKELL, OKLAHOMA........................................................................................................................ 34WHEAT GRAIN YIELD RESPONSE IN ACID SOILS TO LIME APPLICATIONS, EXPERIMENT 804, HASKELL, OKLAHOMA........................................................................................................................................ 37SUPPRESSION OF WINTER WHEAT TAKE-ALL DISEASE USING CHLORIDE FERTILIZERS, CARRIER, OKLAHOMA........................................................................................................................................ 40EFFECT OF SEWAGE SLUDGE AND AMMONIUM NITRATE ON WHEAT YIELD AND SOIL PROFILE INORGANIC NITROGEN ACCUMULATION..............................................................................................43
NITROGEN USE EFFICIENCY.........................................................................................................57
WINTER WHEAT NITROGEN USE EFFICIENCY IN GRAIN AND FORAGE PRODUCTION SYSTEMS...............57BERMUDAGRASS FORAGE YIELD RESPONSE TO HIGH RATES OF APPLIED UREA AND AMMONIUM NITRATE............................................................................................................................................. 63NITROGEN USE EFFICIENCY IN IRRIGATED CORN PRODUCTION............................................................78SEASONAL AND LONG-TERM CHANGES IN NITRATE-NITROGEN CONTENT OF WELL WATER IN OKLAHOMA........................................................................................................................................ 84EFFECT OF NITROGEN FERTILIZER SOURCE ON BERMUDAGRASS YIELD................................................95EFFECT OF N RATE, SOURCE, AND TIMING OF APPLICATION ON SOYBEAN YIELD.................................98BLUESTEM FORAGE YIELD RESPONSE TO SOURCE, RATE, AND TIMING OF APPLIED N, AND SPRING BURNING.......................................................................................................................................... 102USE OF REFLECTOMETRY FOR DETERMINATION OF NITRATE-NITROGEN IN WELL WATER..................111EFFECT OF NITROGEN RATE ON PLANT NITROGEN LOSS IN WINTER WHEAT VARIETIES.....................116EFFECT OF LONG-TERM NITROGEN FERTILIZATION ON SOIL ORGANIC CARBON AND TOTAL NITROGEN IN CONTINUOUS WHEAT................................................................................................................... 129ESTIMATING GASEOUS N LOSSES FROM WINTER WHEAT USING 15N..................................................140FERTILIZER NITROGEN RECOVERY IN LONG-TERM CONTINUOUS WINTER WHEAT.............................161WHEAT PRODUCTION IN THE GREAT PLAINS OF NORTH AMERICA.....................................................172WINTER WHEAT AND CHEAT RESPONSE TO FOLIAR NITROGEN APPLICATIONS...................................183IMPROVING FERTILIZER NITROGEN USE EFFICIENCY USING ALTERNATIVE LEGUME INTERSEEDING IN CONTINUOUS CORN PRODUCTION SYSTEMS.......................................................................................192NITROGEN ACCUMULATION EFFICIENCY: RELATIONSHIP BETWEEN EXCESS FERTILIZER AND SOIL-PLANT BIOLOGICAL ACTIVITY IN WINTER WHEAT.......................................................................................207EFFECT OF RATIOS, TIME AND TEMPERATURE ON KCL-MINERALIZATION POTENTIAL INDEX............217

Page 8 1997 OSU Soil Fertility Research
PRECISION AGRICULTURE..........................................................................................................227
INDIRECT MEASURES OF PLANT NUTRIENTS......................................................................................227MICRO-VARIABILITY IN SOIL TEST, PLANT NUTRIENT, AND YIELD PARAMETERS IN BERMUDAGRASS.238EFFECT OF ROW SPACING, NITROGEN RATE AND GROWTH STAGE ON SPECTRAL RADIANCE IN WINTER WHEAT............................................................................................................................................. 251USE OF SPECTRAL RADIANCE FOR CORRECTING NITROGEN DEFICIENCIES AND ESTIMATING SOIL TEST VARIABILITY IN AN ESTABLISHED BERMUDAGRASS PASTURE............................................................259DETECTION OF NITROGEN AND PHOSPHORUS NUTRIENT STATUS IN BERMUDAGRASS (CYNODON DACTYLON L.) USING SPECTRAL RADIANCE.......................................................................................273DETECTION OF NITROGEN AND PHOSPHORUS NUTRIENT STATUS IN WINTER WHEAT (TRITICUM AESTIVUM L.) USING SPECTRAL RADIANCE........................................................................................284VARIABILITY IN WINTER WHEAT SPECTRAL RADIANCE AS AFFECTED BY NITROGEN RATE, GROWTH STAGE AND VARIETY........................................................................................................................ 293DEVELOPMENT OF FIELD STANDARDS FOR VARIABLE RATE TECHNOLOGY.........................................303OPTIMUM FIELD ELEMENT SIZE FOR MAXIMUM YIELDS IN WINTER WHEAT USING VARIABLE NITROGEN RATES.............................................................................................................................................. 317EFFECTIVENESS OF SENSOR BASED TECHNOLOGY TO DETECT NITROGEN DEFICIENCIES IN TURFGRASS........................................................................................................................................................ 322EXPECTATIONS OF PRECISION PHOSPHATE MANAGEMENT..................................................................326
PRODUCTION TECHNOLOGY......................................................................................................331
EFFECT OF 'AMISORB AND 'MPACT' ON WHEAT GRAIN YIELD.......................................................332ALFALFA YIELD RESPONSE TO METHOD AND RATE OF APPLIED PHOSPHORUS....................................335MODIFICATION OF A SELF-PROPELLED ROTARY MOWER FOR WHEAT FORAGE HARVEST....................342ANALYSIS OF SPRING RAINFALL PATTERNS IN OKLAHOMA................................................................347WINTER WHEAT FORAGE AND GRAIN YIELD RESPONSE TO JOINT BAND APPLIED PHOSPHORUS AND GYPSUM........................................................................................................................................... 351BERMUDAGRASS PASTURE FORAGE PRODUCTION AS AFFECTED BY INTERSEEDED LEGUMES AND PHOSPHORUS FERTILIZATION............................................................................................................. 356SWITCHGRASS RESPONSE TO HARVEST FREQUENCY, AND TIME AND RATE OF APPLIED NITROGEN.....360SULFUR AND CHLORIDE RESPONSE IN WINTER WHEAT......................................................................361

OSU Soil Fertility Research 1997 Page 9
LONG TERM EXPERIMENTS
Long-Term Winter Wheat Fertility With Continuous Applications of N, P and K, Experiment 222, Stillwater, OK
ABSTRACTIn 1969, experiment #222 was initiated at the Agronomy Research Station in Stillwater, Oklahoma. This trial was established to evaluate long-term winter wheat grain yield response to applied nitrogen (N), phosphorus (P) and potassium (K). In addition, joint applications of sulfur (S) and magnesium (Mg) (Sul-Po-Mag) were compared. In the first decade of the experiment, few responses to applied N, P and/or K were found. Check plots with no fertilization had average yields equal to that of treatments receiving N, P and K. Following twenty years without fertilization, average check plot yields were 20 bu/ac. It was not until the third decade of this experiment that a dramatic response to aplied N was observed. A tendency for increased yields with applied P and K (5 vs 6 and 8 vs 9) was present for the 1989-1997 time period, but, this was not significant. Over the 29 years that these treatments have been evaluated, only applied N has produced a significant increase in grain yields. In many regards this continuous wheat data demonstrates the dificulty of evaluating P and K fertilizers since no response could be induced without fertilization following 29 years. Nitrogen applied at an annual rate of 80 pounds per acre was adequate to produce near maximum yields in all three decades evaluated. Considering these results it can also be concluded that if there was no response to applied K (as KCl), there would also be no response to applied Cl. Also, no response was seen to applied S and/or Mg as K,MgSO4.
MATERIALS AND METHODS
xperiment #222 was established in 1969 under conventional tillage on a Kirkland silt loam (fine, mixed, thermic Udertic Paleustoll). Wheat was planted for 22 continuous years in 10 inch rows at seeding rates of 60 pounds per acre. Since
1992, winter wheat has been planted in 7.5 inch rows. The variety 'Scout 66' was planted from 1968-73, 'Triumph 64' from 1974-1977, 'Osage' from 1978-80 and 'TAM W-101' from 1981-91, 'Karl' from 1992-1994 and 'Tonkawa' since 1995. Changes in management, fertilization and application dates are reported in Table 1. The experimental design employed was a randomized complete block with four replications. Fertilizer treatments used in this experiment and average grain yield means over selected periods are reported in Table 2. Surface soil (0-6 inches) test analyses from samples collected in 1995 are also reported in Table 2. Individual plots at this site are 20 feet wide and 60 ft long. The center 10 feet (1969-1995) and 6 ft (1996-present) of each plot was harvested with a conventional combine the entire 60 ft in length for yield. In
E

Page 10 1997 OSU Soil Fertility Research
addition to wheat grain yield measured every year from this experiment, periodic soil and grain samples were taken for further chemical analyses.
A significant response to applied N was not seen until the second decade of the experiment (Table 2, 1979-1988). Since that time, applied N has resulted in significant yield increases. Other than applied N, limited response to applied P or K has been found in this experiment. However, a recent trend for increased yields as a result of applying K has been observed, especially at the high rates of applied N. Considering these results it can also be concluded that if there was no consistent response to applied K (as KCl), there would also be no response to applied Cl. Also, no response was seen to applied S and/or Mg as K,MgSO4 (treatment 13 versus 3).
The fertilizer treatments evaluated have resulted in relatively small surface soil pH (0-6 inches) changes following 27 years (1969-1995) of continuous winter wheat. Soil test P declined with increasing applied N, a result of increased depletion. Surface soil organic matter levels have not changed dramatically, however, organic matter levels have increased at the high N rates when compared to the 0 N checks.
Table 1. Treatment applications, and experimental management for continuous winter wheat Experiment 222, Stillwater, OK, 1970-1997. ____________________________________________________________________Year Variety Fertilizer Planting Date Harvest Date Seeding Rate Topdress
Application lb/ac DateDate
____________________________________________________________________________________1969 Scout 66 601970 Scout 66 601971 Scout 66 601972 Scout 66 601973 Scout 66 10-3-72 10-9-72 60 3-16-731974 Triumph 64 601975 Triumph 63 8-29-75 601976 Triumph 64 601977 Triumph 64 6-15-77 601978 Osage 9-9-77 6-14-78 60 3-29-781979 Osage 6-29-79 601980 Osage 6-25-80 601981 TAM W-101 6-31-81 721982 TAM W-101 9-18-81 9-22-81 6-14-82 601983 TAM W-101 9-29-82 6-21-83 90 3-1-831984 TAM W-101 8-31-83 10-5-83 6-25-84 721985 TAM W-101 8-23-84 10-2-84 6-12-85 72 3-8-851986 TAM W-101 10-7-85 6-12-86 72 2-18-861987 TAM W-101 8-20-86 10-17-86 6-15-87 72 3-6-871988 TAM W-101 9-17-87 6-14-88 721989 TAM W-101 8-18-88 6-20-89 601990 TAM W-101 8-29-89 10-11-89 6-13-90 601991 TAM W-101 601992 TAM W-101 9-10-91 9-30-91 6-17-92 75 2-3-921993 Karl 9-16-92 10-12-92 6-17-93 95 2-3-931994 Karl 9-22-93 9-27-93 6-8-94 951995 Tonkawa 8-30-94 9-29-94 6-20-95 90 2-24-951996 Tonkawa 10-9-95 10-10-95 6-11-96 70 3-13-961997 Tonkawa 9-5-96 10-3-96 6-19-97 70 2-17-97__________________________________________________________________________

OSU Soil Fertility Research 1997 Page 11
Table 2. Soil fertility treatment effects on Experiment #222 wheat grain yields, Stillwater, OK 1969-97, and surface (0-6 inches) soil test results from 1995._____________________________________________________________________________________
Year Period Soil Test (1995)Treatment 1969-78 1979-88 1989-97 1969-1997 -------------------
N P2O5 K2O pH P OMlb/ac ---------------bu/ac-------------- ppm %
______________________________________________________________________________1. 0 60 40 25.3 19.2 13.0 18.7 5.85 50 2.272. 40 60 40 27.9 27.2 18.4 24.3 5.83 37 2.353. 80 60 40 28.5 28.6 21.9 26.3 5.50 34 2.274. 120 60 40 26.7 31.2 25.2 27.8 5.72 26 2.375. 80 0 40 25.0 27.2 23.5 25.2 5.59 14 2.206. 80 30 40 25.0 31.6 25.2 27.6 5.48 23 2.257. 80 90 40 29.1 28.4 21.1 26.0 5.54 50 2.308. 80 60 0 25.5 27.7 21.1 24.8 5.67 32 2.279. 80 60 80 27.3 29.9 22.8 26.7 5.55 38 2.2410. 0 0 0 23.7 20.1 13.4 18.7 5.93 16 2.1311. 120 90 80 27.6 30.7 25.9 28.2 5.73 40 2.2712. 120 90 0 24.5 27.9 23.1 25.4 5.91 38 2.2013. 80 60 40* 32.3 27.4 21.8 26.0 5.89 26 2.23
Mean 26.6 27.5 21.1 25.0 5.73 33 2.26SED 3.1 2.8 2.0 2.7 0.15 8 0.11CV, % 17 15 14 15 3.7 32 7______________________________________________________________________________N, P2O5, and K2O applied as ammonium nitrate (34-0-0), triple superphosphate ( 0-46-0) and potassium chloride (0-0-60), respectively. *- K2O applied as sulpomag (0-0-22). SED standard error of the difference between two equally replicated means. CV coefficient of variation. pH 1:1 soil:water, P, Mehlich III extraction, OM = organic matter = OC*1.8+0.35 (Ranney, 1969)
REFERENCES
Ranney, R.W. 1969. An organic carbon-organic matter conversion equation for pennsylvania surface soils. Soil Sci. Soc. Amer. Proc. 33:809-811.

Page 12 1997 OSU Soil Fertility Research
Wheat Grain Yield Response to Nitrogen, Phosphorus and Potassium Fertilization, Experiment 406, Altus, Oklahoma
ABSTRACTResponse of irrigated winter wheat to fertilization with nitrogen (N), phosphorus (P) and potassium (K) has been evaluated by various research programs, however, few have determined response for long periods of time when grown continuously. Experiment 406 was established in 1966 to evaluate fertilizer applications on irrigated winter wheat grown in southwestern Oklahoma. This experiment has now been conducted for 31 years. The objectives of this experiment were to determine the response of winter wheat to N, P and K fertilization, specifically over long periods of time, and to establish accurate soil test indexes for this crop as related to response on similar soils. Over a 31 year period, only applied N has provided consistent wheat yield increases. However, soil test P has now approached deficient levels and yield response to applied P in coming years is expected.
MATERIALS AND METHODS
n the fall of 1965, Experiment 406 was established under conventional tillage on a Tillman-Hollister clay loam (fine-mixed, thermic Typic Paleustoll) at the Irrigation Research Station near Altus, Oklahoma. Winter Wheat has been planted in 10 inch
rows at seeding rates of 90 pounds per acre. In 1969 and 1971, grain yield data was not obtained. In most years, plots were not irrigated in the spring because the economics of the irrigation district have dictated that water is only released for summer crops. When water was applied, it was usually a pre-irrigation prior to planting. The experimental design employed is a randomized complete block with six replications. Management, varieties, and application dates are reported in Table 1. Fertilizer treatments used in this experiment and average grain yields over selected perids are reported in Table 2. Soil test levels from surface samples collected in 1995 are included in Table 3. Individual plots at this site are 15 feet wide and 60 feet long. The center 10 (1966-1995) and 6 (1996-present) feet were harvested with a conventional combine the entire 60 feet in length. In addition to wheat grain yield measured every year, periodic soil and grain samples were taken for further chemical analyses.
I
RESULTS
Grain yield response to applied N was significant in the first ten years of the experiment, however, the average yield increase did not exceed 4.4 bu/ac/yr. Yields were maximized at the low N rate of 40 lb N/ac applied annually. Similarly, the next ten years (1976-1985) provided good response to applied N, with yields being maximized at the low N rate. The tendency for increased yields as a result of P fertilization was found, but this effect was not consistent over N rates. In the last eleven years (1986-97) of this experiment, little response to fertilization other than N was apparent.

OSU Soil Fertility Research 1997 Page 13
Over the thirty one year period that this experiment has been conducted, soil organic carbon levels have increased with increasing N applied when compared to the check (Table 3). Soil test P levels where no P fertilizers have been applied have decreased dramatically and a yield response to applied P is likely in the coming years.
Table 1. Treatment applications and experimental management for continuous winter wheat Experiment 406, Altus, OK, 1966-1997. _____________________________________________________________________________Year Variety Fertilizer Planting Date Harvest Date Seeding Rate Irrigation Topdress
Application lb/ac Date DateDate
_________________________________________________________________________________________________1966 10-1-66 2-9-67196719681969 4-28-69 1-28-691970 Tascosa 10-10-69 10-11-69 6-6-70 90 2-17-70 2-2-701971 Tascosa 10-14-70 10-21-71 6-1-71 90 8-27-70 1-25-711972 Sturdy 8-17-71 10-9-71 6-8-72 90 None 2-21-721973 TAM W-101 9-11-72 10-12-72 6-11-73 90 9-13-721974 TAM W-101 8-31-73 10-26-73 6-13-74 90 None 2-11-741975 TAM W-101 9-5-74 9-6-74 6-13-75 90 8-2-741976 TAM W-101 8-20-75 10-9-75 6-8-76 90 9-3-75 1-13-761977 TAM W-101 8-9-76 10-14-76 6-9-77 80 8-11-76 2-16-771978 TAM W-101 9-14-77 10-31-77 6-23-78 90 None 3-13-781979 TAM W-101 8-20-78 10-10-78 6-20-79 90 None 3-13-791980 TAM W-101 9-13-79 10-18-79 6-13-80 96 None 3-7-801981 TAM W-101 8-22-80 11-7-80 6-10-81 90 None 1-26-811982 TAM W-101 9-9-81 10-27-81 6-30-82 90 None 2-23-821983 TAM W-101 8-16-82 8-16-82 6-15-83 90 None 3-2-831984 TAM W-101 8-25-83 11-3-83 6-13-84 90 None 3-1-841985 TAM W-101 8-29-84 10-10-84 6-20-85 90 9-7-84 3-14-851986 TAM W-101 8-23-85 11-4-85 6-10-86 90 None 2-18-861987 TAM W-101 9-18-86 11-15-86 6-8-87 90 None 3-6-871988 TAM W-101 9-1-87 10-6-87 6-9-88 90 9-2-87 2-17-881989 TAM W-101 10-24-88 11-17-88 6-22-89 90 9-1-88 All N preplant1990 TAM W-101 8-10-89 9-22-89 6-9-90 90 8-24-89 All N preplant1991 TAM W-101 8-30-90 10-10-90 6-18-91 90 None All N preplant1992 TAM-W-101 9-22-91 9-27-91 6-15-92 90 7-25,8-8-91 2-9-921993 Karl 10-20-92 6-15-93 90 8-12-92 3-25-931994 Karl 8-17-93 9-28-93 6-3-94 90 8-20-93 3-24-941995 Tonkawa 8-19-94 10-27-94 6-17-95 90 8-9-94 3-8-951996 Tonkawa 8-17-95 10-12-95 6-5-96 90 None 2-3-961997 Tonkawa 8-15-96 10-1-96 6-14-97 90 8-1-96 2-3-97_________________________________________________________________________________________________

Page 14 1997 OSU Soil Fertility Research
Table 2. Treatment structure of a long-term supplemental irrigation winter wheat Experiment 406 and overall means, Altus, OK, 1966-1997._____________________________________________________________________________
Trt . N P2O5 K2O --------------- Mean Yield ------------- All Yearslb/ac 1966-75 1976-85 1986-97 1966-1997
bu/ac bu/ac bu/ac bu/ac_____________________________________________________________________________
1 0 0 0 17.1 25.0 15.2 19.02 40 0 0 21.5 34.2 21.5 25.73 80 0 0 20.6 35.9 21.1 25.94 120 0 0 21.1 36.1 21.1 26.15 160 0 0 19.8 36.7 21.2 25.96 40 40 0 23.1 38.7 21.0 27.57 80 40 0 21.3 39.3 22.3 27.78 120 40 0 20.2 40.4 23.6 28.39 160 40 0 19.0 38.2 22.4 26.810 40 40 40 22.7 37.7 21.1 27.111 80 40 40 21.5 41.5 22.3 28.412 120 40 40 20.2 36.6 22.7 26.713 160 40 40 18.7 36.7 21.4 25.8
SED 2.0 2.8 2.1 2.5CV, % 17 13 17 16_____________________________________________________________________________N, P and K applied as 34-0-0, 0-46-0 and 0-0-60 respectively. N applied 1/2 fall, 1/2 spring
Table 3. Treatment structure and surface (0-6 inches) soil test analyses from samples collected in the summer of 1995, Experiment 406, Altus, OK._____________________________________________________________________________
Trt . N P2O5 K2O pH Organic C Total N P Klb/ac % % ppm ppm
_____________________________________________________________________________1 0 0 0 7.29 0.84 0.073 9 4092 40 0 0 7.22 0.88 0.078 9 4143 80 0 0 7.39 0.90 0.079 7 4034 120 0 0 7.97 0.90 0.082 8 4215 160 0 0 7.39 0.90 0.086 9 4156 40 40 0 7.42 0.87 0.080 31 4187 80 40 0 7.35 0.93 0.083 26 4108 120 40 0 7.30 1.00 0.089 27 4089 160 40 0 7.20 0.96 0.088 27 40710 40 40 40 7.12 0.87 0.076 32 44411 80 40 40 7.38 0.93 0.082 25 43212 120 40 40 7.12 0.95 0.085 24 44513 160 40 40 6.79 0.93 0.083 24 441
SED 0.18 0.03 0.004 2.3 14CV, % 4 6 9 20 5_____________________________________________________________________________N, P and K applied as 34-0-0, 0-46-0 and 0-0-60 respectively. N applied 1/2 fall, 1/2 spring. SED - standard error of the difference between two equally replicated means, CV - coefficient of variation.

OSU Soil Fertility Research 1997 Page 15
Response of Dryland Winter Wheat to Nitrogen, Phosphorus and Potassium Fertilization, Experiment 407, Altus, Oklahoma
ABSTRACTResponse of dryland winter wheat to fertilization with nitrogen (N), phosphorus (P) and potassium (K) has been evaluated by various research programs, however, few have determined response for long periods of time when grown continuously. Experiment 407 was established in 1966, to evaluate fertilizer applications on dryland winter wheat grown in southwestern Oklahoma. This experiment has now been conducted for 31 years. Response to applied N, P and K has been limited at this site, largely due to high soil test nutrient levels and low yields over the extensive number of years evaluated.
MATERIALS AND METHODS
n the fall of 1965, Experiment 407 was established under conventional tillage on a Tillman-Hollister clay loam (fine-mixed, thermic Typic Paleustoll) at the Irrigation Research Station near Altus, Oklahoma. Winter Wheat has been planted for 31
continuous years in 10 inch rows at seeding rates of 60 pounds per acre. Grain yield data for the 1971 crop year was lost due to drought. The experimental design employed is a randomized complete block with six replications. Variety changes and associated fertilizer application, planting and harvest dates are included in Table 1. Fertilizer treatments used in this experiment and grain yield averages from selected periods are reported in Table 2. Individual plots at this site are 15 feet wide and 60 feet long. The center 10 feet were harvested with a conventional combine the entire 60 feet in length. In addition to wheat grain yield measured every year, periodic soil and grain samples were taken for further chemical analyses. Soil test results from surface samples collected in the summer of 1995 are included in Table 3.
I
RESULTS
No grain yield response to N, P or K fertilization was found in the first ten years (1966-1975) of this experiment (Table 2). By the second ten year period (1976-1985), response to applied N and P was significant with 40 lb N/ac and 40 lb P2O5/ac producing the largest average annual yields. In the last eleven years of the experiment (1986-1997), a similar yield increase from N and P fertilization was found. To date, no response to applied K has been seen, largely due to high native soil test K at this site (Table 3). Soil test P levels have declined significantly where no P has been applied. Surface soil pH has not been affected by fertilization over the 31 years that this experiment has been conducted.

Page 16 1997 OSU Soil Fertility Research
Table 1. Treatment applications, and experimental management for continuous winter wheat Experiment 407, Altus, OK, 1966-1997._____________________________________________________________________________Year Variety Fertilizer Planting Date Harvest Date Seeding Rate Topdress Date
Application Date lb/ac_________________________________________________________________________________________________1966196719681969 6-3-691970 KAW 61 10-9-69 10-11-69 6-5-70 401971 KAW 61 10-14-70 10-20-70 6-1-71 60 1-26-711972 Danne 8-17-71 10-5-71 6-8-72 40 2-23-721973 Nicoma 9-5-72 10-4-72 6-6-73 401974 Nicoma 9-21-73 10-24-73 6-13-74 50 2-11-741975 Nicoma 10-9-74 10-11-74 6-12-75 401976 Triumph 64 8-14-75 10-7-75 6-10-76 60 1-13-761977 Triumph 64 8-10-76 10-14-76 6-8-77 60 2-17-771978 Triumph 64 9-14-77 11-7-77 6-22-78 60 3-14-781979 Triumph 64 8-20-78 10-9-78 6-20-79 60 3-12-791980 Triumph 64 9-12-79 10-18-79 6-19-80 60 3-10-801981 TAM W-101 8-20-80 11-7-80 6-10-81 60 1-26-811982 TAM W-101 9-8-81 10-27-81 6-30-82 60 2-23-821983 TAM W-101 8-18-82 10-28-82 6-16-83 60 3-4-831984 TAM W-101 8-25-83 12-5-83* 6-12-84 60 3-2-841985 TAM W-101 8-29-84 10-10-84 6-20-85 90 3-5-851986 TAM W-101 8-23-85 11-5-85 6-2-86 60 2-19-861987 TAM W-101 9-16-86 11-15-86 6-23-87 60 3-5-871988 TAM W-101 9-4-87 10-6-87 6-10-88 60 2-18-881989 TAM W-101 10-26-88 11-17-88 6-22-89 60 3-9-891990 TAM W-101 8-10-89 9-22-89 6-8-90 60 3-9-901991 TAM W-101 8-30-90 9-27-90 6-19-91 60 2-7-911992 TAM W-101 9-22-91 9-27-91 6-16-92 60 2-9-921993 Karl 10-20-92 6-16-93 60 3-25-931994 Karl 8-17-93 9-28-93 6-3-94 60 3-24-941995 Tonkawa 8-19-94 10-27-94 6-17-95 60 3-8-951996 Tonkawa 8-18-95 10-11-95 6-6-96 60 2-3-961997 Tonkawa 8-15-96 10-1-96 6-14-97 60 2-3-97_________________________________________________________________________________________________
Table 2. Treatment structure of long-term dryland winter wheat Experiment 407 and overall yield means, Altus, OK, 1966-1997.______________________________________________________________________________
Trt . N P2O5 K2O -------------------------Mean Yield-----------------------lb/ac 1966-1975 1976-1985 1986-1997 1966-1997
bu/ac 1 0 0 0 19.5 23.5 18.7 20.52 20 0 0 19.8 25.4 21.1 22.23 40 0 0 18.6 25.9 21.7 22.24 80 0 0 19.3 27.9 22.8 23.45 0 40 0 21.9 24.6 17.7 21.16 20 40 0 21.1 29.2 22.4 24.27 40 40 0 19.1 32.2 24.6 25.58 80 40 0 17.8 28.3 25.5 24.29 0 40 40 21.1 24.3 17.7 20.810 20 40 40 21.9 31.1 22.6 25.111 40 40 40 19.9 32.0 24.9 25.712 80 40 40 17.7 30.3 25.1 24.6
SED 1.6 2.1 2.3 2.1CV 14 13 18 15

OSU Soil Fertility Research 1997 Page 17
N, P and K applied as 34-0-0, 0-46-0 and 0-0-60 respectively. All N applied in the spring. P and K applied preplant and incorporated. SED - standard error of the difference between two equally replicated means, CV - coefficient of variation.
Table 3. Treatment structure and surface (0-6 inches) soil test analyses from samples collected in the summer of 1995, Experiment 407, Altus, OK, 1966-1997._____________________________________________________________________________
Trt . N P2O5 K2O pH Organic C Total N P Klb/ac % % ppm ppm
_____________________________________________________________________________1 0 0 0 6.8 0.929 0.079 7.4 5022 20 0 0 6.8 0.989 0.094 8.4 4803 40 0 0 6.8 0.982 0.084 9.2 5464 80 0 0 6.5 1.038 0.091 9.2 5285 0 40 0 6.8 0.948 0.084 42.2 4966 20 40 0 6.7 0.950 0.082 36.6 5257 40 40 0 6.7 1.045 0.092 34.1 5308 80 40 0 6.4 1.087 0.104 33.5 5169 0 40 40 6.9 0.931 0.081 45.8 59010 20 40 40 6.8 1.006 0.085 37.3 57011 40 40 40 6.6 1.024 0.087 33.0 58312 80 40 40 6.4 1.076 0.095 32.5 564
SED 0.12 0.12 0.004 3.5 84CV 3 10 8 22 7_____________________________________________________________________________N, P and K applied as 34-0-0, 0-46-0 and 0-0-60 respectively. All N applied in the spring. P and K applied preplant and incorporated. SED - standard error of the difference between two equally replicated means, CV - coefficient of variation.

Page 18 1997 OSU Soil Fertility Research
Response of Grain Sorghum to Nitrogen, Phosphorus and Potassium Fertilization, Experiment 501, Lahoma, Oklahoma
ABSTRACTResponse of sorghum grain yields to fertilization with nitrogen (N), phosphorus (P) and potassium (K) has been evaluated by various research programs, however, few have determined response for long periods of time when the same crop is grown continuously. Experiment 501 was established in 1971 to evaluate fertilizer applications on grain sorghum grown in western Oklahoma. This experiment has now been conducted for 26 years. Response to applied N was not seen until the second decade of the experiment. Following 26 years of evaluation, only a significant response to applied N fertilizer has been found.
MATERIALS AND METHODS
n the spring of 1971, Experiment 501 was established under conventional tillage on a Grant silt loam (fine-silty, mix, thermic Udic Argiustoll) at the North Central Research Station near Lahoma, Oklahoma. Grain Sorghum has been planted for 20
continuous years in 36 inch rows at seeding rates of 4.3 pounds per acre. The variety 'ACCOR1019' was planted from 1971-79, 'DKC42Y+' from 1980-1994 and SG-822 from 1995 to present. Experimental methods, application dates and changes over time are reported in Table 1. The experimental design employed is a randomized complete block with four replications. Fertilizer treatments and average grain yield means over selected periods are reported in Table 2. Individual plots at this site are 20 feet wide and 60 feet long. The center 2 rows of each plot were harvested for yield using a conventional combine the entire 60 feet in length. In addition to grain sorghum yield measured every year (exception was 1973 where crop failure resulted due to lack of rainfall for most experiments at the North Central Research Station), periodic soil and grain samples were taken for further chemical analyses. Results from surface (0-6 inches) soil test analyses from samples collected in 1988 are reported in Table 3.
I
RESULTS
Overall means from 1971-96 are reported in Table 2. No response to applied N, P or K was found in the first five years of the experiment (1971-1975). From 1976 to 1985, consistent increases in sorghum grain yields were found from applied N, while limited response to P and K was observed. In the last eleven years (1986-1997), applied N has doubled sorghum grain yields. The tendency for increased yields due to P fertilization has also been evident in the last decade of the experiment. Consistent with other long-term experiments, response to applied fertilizer P and K has been limited even when more than 25 years have passed without fertilization. Soil test P levels have declined in plots where no P fertilizer has been applied, but even these check plots (1 and 7) remain at 100 percent sufficiency.

OSU Soil Fertility Research 1997 Page 19
Table 1. Treatment applications, and experimental management for continuous sorghum Experiment 501, Lahoma, OK, 1971-1997._________________________________________________________________________________________________
Year Variety Fertilizer Planting Harvest Seeding Rate Harvest AreaApplication Date DateDate
_________________________________________________________________________________________________1972 2rows*60ft1973 11-15-73 180sqft1974 ACCO R1019 5-22-74 6-24-74 12-4-74 10lb/A 10'*60'1975 11-14-75 3row*60ft1976 11-9-76 10'*60'1977 11-18-77 10'*60'1978 12-5-78 10'*60'1979 12-3-79 2row*60ft1980 DKC42Y+ 6-12-80 11-10-80 3row*60ft1981 DKC42Y+ 7-12-81 12-4-81 4.3#/A1982 DKC42Y+ 6-14-82 11-9-82 5#/A 85%germ1983 DKC42Y+ 5-26-83 6-17-83 11-16-83 4.5#/A 3row*60ft1984 DKC42Y+ 6-22-84 11-14-841985 DKC42Y+ 12-6-85 3row*60ft1986 DKC42Y+ 6-18-86 11-14-861987 DKC42Y+ 6-23-87 6-24-871988 DKC42Y+ 6-7-88 3#/A1989 DKC42Y+ 10-26-89 10'*60'1990 DKC42Y+ 6-5-90 10-26-90 10'*60'1991 DKC42Y+ 6-21-91 11-8-91 6#/A 10'*60'1992 DKC427 5-1-92 5-7-92 6#/A 10’*60’1993 DKC427 5-28-93 5-28-93 8#/A 10’*60’1994 DKC427 5-10-94 6-1-94 Hailed out 8#/A 10’*60’1995 SG-822 6-13-95 6-19-95 6#/A 10’*60’1996 SG-822 5-21-96 5-29-96 6#/A 10’*60’1997 SG-822 5-23-97 6-19-97 6#/A 10’*60’_______________________________________________________________________________________________
Table 2. Treatment structure of long-term grain sorghum Experiment 501 and overall means, Lahoma, OK, 1971-1996._____________________________________________________________________________
Trt . N P2O5 K2O -------------------------Mean Yield------------------------- lb/ac 1971-1975 1976-1985 1986-1997 1971-1996
lb/ac_____________________________________________________________________________
1 0 0 0 2639 1479 1108 15012 0 40 40 2633 1680 1102 15833 20 40 40 2639 1882 1693 19204 40 40 40 2597 1806 1701 18885 60 40 40 2591 1727 2201 20746 80 40 40 2663 1859 2136 21107 60 0 40 2713 1914 2059 21058 60 20 40 2662 1792 1887 19749 60 40 0 2770 1774 2018 204110 60 60 40 2624 1959 2147 214811 60 80 40 2643 1821 2004 203312 60 40 40* 2629 1847 2162 211113 60 40 40** 2618 1809 2214 2117
SED 204 413 378 379CV, % 11 32 28 27_____________________________________________________________________________N, P2O5, and K2O applied as ammonium nitrate (34-0-0), triple superphosphate (0-46-0) and potassium chloride (0-0-60), respectively. * -K2O as Sul-po-mag, **- 60-40-40 + Cyamid Micro charger in 0-38-10

Page 20 1997 OSU Soil Fertility Research
applied to give 40# P2O5. SED - standard error of the difference between two equally replicated means, CV - coefficient of variation.
Table 3. Treatment structure of long-term grain sorghum Experiment 501 and results from surface (0-6 inches) soil test analyses conducted in 1988, Lahoma, OK._____________________________________________________________________________
Trt . N P2O5 K2O pH P K lb/ac ppm ppm
_____________________________________________________________________________1 0 0 0 5.33 25 5372 0 40 40 5.30 64 7053 20 40 40 5.17 41 6344 40 40 40 5.07 40 6685 60 40 40 4.95 43 6636 80 40 40 4.87 44 7137 60 0 40 4.87 24 6468 60 20 40 4.97 35 6539 60 40 0 4.95 44 56210 60 60 40 4.92 46 61311 60 80 40 5.00 59 62512 60 40 40* 4.92 34 59313 60 40 40** 4.95 42 622
SED 0.05 12 47CV, % 1.4 39 11_____________________________________________________________________________N, P2O5, and K2O applied as ammonium nitrate (34-0-0), triple superphosphate (0-46-0) and potassium chloride (0-0-60), respectively. * -K2O as Sul-po-mag, **- 60-40-40 + Cyamid Micro charger in 0-38-10 applied to give 40# P2O5. SED - standard error of the difference between two equally replicated means, CV - coefficient of variation.

OSU Soil Fertility Research 1997 Page 21
Effects of Annual Applications of Nitrogen, Phosphorus and Potassium on Grain Yield Continuous Winter Wheat Production,
Experiment 502, Lahoma, OklahomaABSTRACT
Response of wheat grain yields to fertilization with nitrogen (N), phosphorus (P) and potassium (K) has been determined in numerous soil fertility experiments around the globe. Experiment 502 was established in 1971 to evaluate fertilizer applications on continuous winter wheat. The objectives of this experiment were to determine the response of winter wheat to N, P and K fertilization specifically over long periods of time. Yield increases due to applied N (80 pounds N/acre) have averaged between 15 and 20 bushels/acre/year. No response to applied P or K has been seen in any year, since soil test P and K levels were high when this experiment was initiated in 1970. Soil test P levels have declined somewhat where no P has been applied, however, sufficiency levels still exceed 100%. Soil organic C levels have increased with increasing N applied when compared to the check. Long-term N management where straw is not removed following harvest can impact soil quality, as has been demonstrated here.
MATERIALS AND METHODS
xperiment 502 was established in the fall of 1970 under conventional tillage on a Grant silt loam (fine-silty, mixed, thermic Udic Argiustoll). Wheat has been planted for 28 continuous years in 10 inch rows at seeding rates of 60 pounds per
acre. The variety 'Nicoma' was planted from 1971-74, 'Triumph 64' from 1975-1976, 'Osage' in 1977 and 1979, 'Triumph 64' in 1978, 'TAM W-101' from 1980-91, Karl 92 from 1993 to 1994 and Tonkawa from 1995 to present. Changes in management, application dates and fertilization are reported in Table 1. The experimental design employed is a randomized complete block with four replications. Fertilizer treatments used in this experiment and average grain yield means for selected periods are reported in Table 2. Results from surface (0-6 inches) soil samples collected in 1995 are reported in Table 3. Individual plots at this site are 16 feet wide and 60 feet long. The center 10 feet of each plot was harvested for yield using a conventional combine. In addition to wheat grain yield measured every year (exception was 1973 where crop failure resulted due to lack of rainfall), periodic soil and grain samples were taken for further chemical analyses.
E
RESULTS
In the first years of the experiment, limited response to applied fertilizer was observed (Table 2). From 1976-1986, grain yields increased by an average of 16 bushels/acre/year when 80 pounds of N as ammonium nitrate was applied preplant. In the last eleven years (1986-1997), grain yields have been increased by 20 bushels/acre/year from the application of 80 pounds of N. No increase in grain yield

Page 22 1997 OSU Soil Fertility Research
could be attributed to P or K in any year of the experiment. Soil test P levels have declined somewhat where no P has been applied, but sufficiency levels still exceed 100%. Soil organic C levels increased with increasing applied N when compared to the check (Table 3). Soil pH and K have changed very little over the 28 years that these treatments have been evaluated.
Table 1. Treatment applications and experimental management for continuous winter wheat Experiment 502, Lahoma, OK, 1971-1997.____________________________________________________________
Year Variety Fertilizer Planting Date Harvest Seeding RateApplication Date lb/ac
Date 19711972197319741975197619771978 6-13-781979 TAM W-101 6-28-791980 TAM W-101 6-24-801981 TAM W-101 10-31-80 6-18-81 651982 TAM W-101 6-28-821983 TAM W-101 10-18-82 7-1-831984 TAM W-101 6-21-841985 TAM W-101 10-30-84 6-13-85 751986 TAM W-101 10-21-85 6-11-86 741987 TAM W-101 10-28-86 6-18-87 681988 TAM W-101 8-31-87 10-2-87 6-20-88 671989 TAM W-101 10-10-88 10-14-88 6-19-89 701990 TAM W-101 10-13-89 6-20-90 651991 TAM W-101 8-2-90 10-15-90 6-6-91 651992 TAM W-101 9-9-91 9-26-91 631993 Karl 8-24-92 10-1-92 761994 Karl 9-14-93 9-28-93 751995 Tonkawa 8-5-94 10-28-94 6-19-95 621996 Tonkawa 8-31-95 10-10-95 6-21-96 69
1997 Tonkawa 9-4-96 10-3-96 6-13-97 66
Table 2. Treatment structure of long-term wheat Experiment 502, and wheat grain yield means for selected periods, Lahoma, OK, 1970-1997._____________________________________________________________________________Trt. N P2O5 K2O ----------------------------Mean Yield--------------------------
lb/ac applied 1971-1975 1976-1985 1986-1997 1971-1997 bu/ac 1 0 0 0 26.9 25.8 23.5 24.92 0 40 60 27.0 25.9 23.1 24.83 20 40 60 31.3 34.4 31.6 32.64 40 40 60 33.3 36.0 35.8 35.55 60 40 60 34.4 39.7 39.7 38.86 80 40 60 34.8 41.2 43.0 41.07 100 40 60 34.4 38.4 43.6 40.18 60 0 60 33.4 34.5 40.5 37.19 60 20 60 33.3 38.6 40.7 38.710 60 60 60 35.0 38.8 40.5 39.011 60 80 60 36.0 41.2 40.4 40.112 60 60 0 35.4 38.6 41.7 39.613 100 80 60 34.4 38.4 40.3 38.614 60 40 60* 34.9 41.3 42.3 40.8SED 2.3 3.1 2.7 2.9CV 10 12 10 11____________________________________________________________________________

OSU Soil Fertility Research 1997 Page 23
N, P2O5, and K2O applied as ammonium nitrate (34-0-0), triple superphosphate (0-46-0) and potassium chloride (0-0-60), respectively. * K2O applied as sulpomag (0-0-22). SED - standard error of the difference between two equally replicated means, CV - coefficient of variation.
Table 3. Treatment structure of long-term wheat Experiment 502, and surface (0-6 inches) soil test analyses from samples collected in the summer of 1995, Lahoma, OK._____________________________________________________________________________
Trt. N P2O5 K2O pH Total N Organic C P K lb/ac applied % % ppm ppm
_____________________________________________________________________________
1 0 0 0 5.69 0.085 0.89 45 4232 0 40 60 5.81 0.083 0.88 69 4813 20 40 60 5.69 0.083 0.91 71 4564 40 40 60 5.60 0.088 0.91 69 4585 60 40 60 5.47 0.086 0.96 79 4786 80 40 60 5.38 0.088 0.92 76 4537 100 40 60 5.23 0.089 0.98 83 4438 60 0 60 5.59 0.089 1.04 38 4879 60 20 60 5.65 0.090 1.09 63 47210 60 60 60 5.63 0.091 1.12 96 52511 60 80 60 5.65 0.093 1.16 103 47212 60 60 0 5.52 0.090 1.12 92 38713 100 80 60 5.44 0.095 1.17 129 53514 60 40 60* 5.59 0.089 1.10 64 460
SED 0.16 0.005 0.10 14 47CV, % 4 8 14 27 15_____________________________________________________________________________N, P2O5, and K2O applied as ammonium nitrate (34-0-0), triple superphosphate (0-46-0) and potassium chloride (0-0-60), respectively. * K2O applied as sulpomag (0-0-22). SED - standard error of the difference between two equally replicated means, CV - coefficient of variation.

Page 24 1997 OSU Soil Fertility Research
Nitrogen Source and Rate Effects on Long-Term Continous Winter Wheat Grain Yield, Experiment 505, Lahoma, Oklahoma
ABSTRACTEnvironmental concerns relative to nitrogen applications in grain crop production systems have become increasingly important in recent years. Recommendations are continually based on both use efficiency and economic yields. Various sources of nitrogen are available to farmers in wheat production systems, however, few have ever been evaluated over a long period of time. In 1971, Experiment 505 was initiated to compare sources and rates of N application on wheat grain yield. Few differences between N sources were found in this experiment. Wheat grain yields increased significantly when N was applied at low annual N rates (30-60 pounds/acre), becoming greater with time. Split applied N did not increase wheat grain yields when compared to the same rates applied preplant. The highest rates of N (120-240 lb N/ac) are associated with decreased yield and critically low (<5.0) soil pH.
MATERIALS AND METHODS
n the fall of 1970, Experiment 505 was established under conventional tillage on a Grant silt loam (fine-silty, mixed, thermic Udic Argiustoll). For 28 years, wheat has been planted in 10 inch rows in this North Central Research Station experiment. The
experimental design employed is a randomized complete block with four replications. Variety changes and associated fertilizer application, planting and harvest dates are included in Table 1. Fertilizer treatments used in this experiment are defined in Table 2. The sources of nitrogen included anhydrous ammonia (AA), ammonium nitrate (AN), urea, (UR), and sulfur coated urea (SCU) applied at rates of 0, 30, 60, 120 and 240 pounds of N/ac. Additional topdress treatments were also evaluated using AN, UR and SCU as defined in Table 2. Sources of AN, UR, and SCU were broadcast and incorporated prior to planting in the fall while AA was injected preplant with knife spacings of 18 inches. Topdress applications were broadcast without incorporation on the dates listed in Table 1. Phosphorus and potassium were applied as triple superphosphate and potassium chloride at rates of 60 pounds P2O5 /acre and 60 pounds K2O/ac respectively. Individual plots at this site are 16 feet wide and 60 feet long. The center 10 feet of each plot was harvested with a conventional combine for yield. In addition to wheat grain yield measured every year, periodic soil and grain samples were taken for further chemical analyses. Results from surface (0-6 inches) soil test analyses from samples collected in 1995 are reported in Table 3.
I
RESULTS
Wheat grain yields showed little response to applied N from 1971 to 1975 (Table 2). Differences between sources of N were generally small for this same time period. From 1976 to 1985, wheat grain yields were 10 to 14 bushels /acre/year greater in plots receiving only 30 pounds of N/acre/year when compared to that found in the checks (1

OSU Soil Fertility Research 1997 Page 25
and 6) with no N fertilization. Similar benefits associated with N fertilization were found from 1986 to 1997, with grain yields being maximized with applied N rates between 30 and 60 pounds of N acre. Differences due to N source were small in the three separate time periods reported in Table 2. For all N sources, grain yields decreased at the high N rate of 240 pounds N/acre. No benefit was found for split applications of N compared to applying all N preplant. Similar to results reported for other long-term winter wheat experiments, applied N tended to increase soil organic C when compared to the check, especially at rates in excess of that required for maximum yield.
Table 1. Treatment applications, and experimental management for continuous winter wheat Experiment 505, Lahoma, OK, 1971-1997. _________________________________________________________________________________________________
Year Variety Fertilizer Planting Date Harvest Seeding Rate Topdress DatesApplication Date lb/acDate
_________________________________________________________________________________________________1971 Nicoma 10-13-701972 Nicoma 5-8-721973 Nicoma 9-15-72 6-18-731974 Nicoma 9-20-73 10-19-73 6-12-74 55 11-19-73, 1-7-74, 2-12-741975 Triumph 9-10-74 10-11-74 6-18-75 58 9-9-74, 10-2-74, 1-14-751976 Triumph 8-22-75 10-20-75 6-12-76 60 11-19-75, 1-12-76, 2-17-
761977 Osage 8-18-76 10-12-76 6-9-77 67 9-21-76, 11-17-76, 12-30-
761978 Triumph 9-1-77 10-12-77 6-14-78 70 11-17-77, 1-3-78, 3-13-781979 Osage 9-11-78 10-4-78 6-28-79 70 12-4-78, 1-22-79, 3-9-791980 TAM W-101 9-30-79 10-24-79 6-25-80 60 11-15-79,1-15-80,2-15-801981 TAM W-101 10-2-80 10-31-80 6-12-81 65 12-3-80,1-7-81,2-17-811982 TAM W-101 9-30-81 10-23-81 6-23-82 65 12-8-81,1-4-82,3-2-821983 TAM W-101 8-24-82 10-18-82 7-1-83 70 11-17-82,1-7-83,3-1-831984 TAM W-101 8-31-83 10-28-83 6-19-84 67 11-16-83,1-6-84,2-15-841985 TAM W-101 9-10-84 10-30-84 6-13-85 75 13-3-84, 1-25-85, 3-6-851986 TAM W-101 8-12-85 10-4-85 6-9-86 74 11-11-85, 1-15-86, 2-24-
861987 TAM W-101 8-4-86 10-20-86 6-17-87 68 12-4-86, 1-6-87, 3-5-871988 TAM W-101 8-31-87 9-25-87 6-20-88 67 11-13-87,2-2-88,2-15-881989 TAM W-101 9-29-88 10-13-88 6-19-89 70 11-18-88,1-5-89,2-21-891990 TAM W-101 8-25-89 9-25-89 6-18-90 75 11-16-89,1-4-90,2-15-901991 TAM W-101 8-3-90 10-12-90 6-5-91 50 11-19-90,1-11-91,2-14-911992 TAM W-101 9-9-91 9-27-91 73 11-25-91,1-3-92,2-13-921993 Karl 8-24-92 10-1-92 76 11-17-92,1-5-93,3-9-931994 Karl 9-14-93 9-28-93 75 11-15-93,1-4-94,2-15-941995 Tonkawa 8-5-94 10-28-94 6-19-95 62 11-16-94,1-3-95,2-15-951996 Tonkawa 8-31-95 10-13-95 6-21-96 63 11-16-95,1-3-96,2-15-961997 Tonkawa 9-4-96 10-3-96 6-13-97 66 1-24-97,2-16-97
_________________________________________________________________________________________________

Page 26 1997 OSU Soil Fertility Research
Table 2. Treatment structure of long-term nitrogen source-method-rate wheat Experiment 505 and overall means, Lahoma, OK, 1971-1997._____________________________________________________________________________
Time of Application ---------------------Mean Yield----------------Trt. Preplant Nov 16 Jan 1 Feb 15 Source 1971-19751976-85 1986-97 1971-
97lb N/ac bu/ac
_____________________________________________________________________________1 0 - 24.6 24.1 22.0 23.32 30 AA 31.2 38.7 39.7 37.73 60 AA 32.5 39.6 36.5 36.94 120 AA 31.4 37.4 33.4 34.55 240 AA 31.7 37.8 22.5 29.96 0 - 26.6 28.4 29.5 28.57 30 UR 30.0 38.3 34.0 34.98 60 UR 36.8 41.0 43.5 41.39 120 UR 32.0 40.6 42.8 39.910 240 UR 31.7 38.8 36.6 36.511 30 30 30 30 UR 33.0 37.3 37.5 36.612 60 60 60 60 UR 32.9 38.8 37.1 36.913 15 15 15 15 UR 35.0 39.7 40.8 39.314 30 30 UR 34.7 41.7 46.3 42.415 60 60 UR 35.2 38.8 41.7 39.416 120 120 UR 31.5 37.9 33.9 34.617 30 AN 31.6 35.0 36.7 35.218 60 AN 35.2 37.8 41.9 39.219 120 AN 34.2 40.8 43.9 40.920 240 AN 30.6 39.0 34.6 35.521 30 30 30 30 AN 32.9 39.7 39.7 38.422 60 60 60 60 AN 31.2 39.0 29.9 33.523 15 15 15 15 AN 33.7 38.9 40.7 38.824 30 30 AN 34.6 40.1 45.6 41.525 60 60 AN 32.9 39.4 39.8 38.426 120 120 AN 31.8 38.8 34.0 35.427 30 SCU 28.3 35.7 30.8 32.128 60 SCU 32.9 41.1 43.5 40.729 120 SCU 38.3 40.4 43.3 41.330 240 SCU 31.8 38.9 27.9 32.3
SED 3.4 3.3 4.7 4.1CV, % 13 11 15 14_____________________________________________________________________________*All plots received 60 lbs P2O5 (0-46-0) and 60 lbs K2O (0-0-60) applied broadcast preplant. AA-anhydrous ammonia, UR-urea, AN-ammonium nitrate, SCU-sulfur coated urea.

OSU Soil Fertility Research 1997 Page 27
Table 3. Treatment structure of long-term nitrogen source-method-rate wheat Experiment 505 and surface (0-6 inches) soil test analyses from samples collected in 1995, Lahoma, OK._____________________________________________________________________________
Preplant--- Sidedress N --Trt N Nov 16 Jan 1 Feb 15Source pH NO3-N P K Total N Org. C
ppm ppm ppm % %_____________________________________________________________________________1 0 - 5.74 1.6 120 420 0.079 0.7362 30 AA 4.97 6.9 107 407 0.095 0.8543 60 AA 4.98 9.7 112 417 0.094 0.8644 120 AA 4.76 18.9 131 417 0.101 0.8855 240 AA 4.53 41.3 147 380 0.113 0.8956 0 - 5.55 1.5 102 373 0.089 0.7647 30 UR 5.60 3.9 96 340 0.085 0.7608 60 UR 5.28 5.4 104 383 0.096 0.8669 120 UR 5.17 7.5 100 400 0.096 0.86410 240 UR 5.07 5.6 107 357 0.101 0.92011 30 30 30 30 UR 5.01 12.6 96 390 0.093 0.90512 60 60 60 60 UR 4.72 24.4 118 373 0.097 0.97413 15 15 15 15 UR 5.33 4.6 105 390 0.087 0.89114 30 30 UR 5.15 6.0 85 360 0.091 0.94815 60 60 UR 5.15 7.9 98 393 0.095 0.96216 120 120 UR 4.48 34.6 114 383 0.093 0.92317 30 AN 5.43 2.0 94 343 0.086 0.85018 60 AN 5.24 5.5 104 340 0.086 0.90119 120 AN 5.05 6.0 121 413 0.097 0.96520 240 AN 4.85 11.2 93 367 0.105 1.07121 30 30 30 30 AN 5.09 11.2 100 443 0.093 0.97322 60 60 60 60 AN 4.36 68.2 118 403 0.109 1.00023 15 15 15 15 AN 5.44 5.9 84 420 0.099 0.95824 30 30 AN 5.18 6.6 86 357 0.088 0.93425 60 60 AN 5.28 8.5 83 360 0.092 0.98726 120 120 AN 4.48 45.0 128 403 0.105 1.03327 30 SCU 5.51 2.0 103 360 0.082 0.90828 60 SCU 5.18 6.0 99 373 0.091 0.96629 120 SCU 5.01 6.0 88 407 0.089 0.92230 240 SCU 4.34 29.9 101 363 0.102 1.016
SED 0.16 8.4 17 40 0.005 0.07CV, % 4 76 19 13 7 10____________________________________________________________________________*All plots received 60 lbs P2O5 (0-46-0) and 60 lbs K2O (0-0-60) applied broadcast preplant. AA-anhydrous ammonia, UR-urea, AN-ammonium nitrate, SCU-sulfur coated urea. SED - standard error of the difference between two equally replicated means, CV - coefficient of variation.

Page 28 1997 OSU Soil Fertility Research
Effects of Nitrogen, Phosphorus, and Potassium on Yield of Winter Wheat, Experiment 801, Haskell, Oklahoma
ABSTRACTMany of the soils where winter wheat is grown in northeastern Oklahoma are extremely acid and deficient in phosphorus. Long-term evaluation of wheat grain yield response to fertilizer applications are being achieved by this experiment. Experiment 801 was established in 1978 to evaluate nitrogen, phosphorus and potassium fertilizer applications on continuous winter wheat. Applied P was expected to precipitate some of the Al in soil solution, especially at the low soil pH levels where increased Al was expected at this site. Applied P without N produced the highest grain yields from 1978 to 1986, and 1987 to 1997. Applied N did not increase grain yields with or without P in any year.
MATERIALS AND METHODS
xperiment 801 was established in the fall of 1977 under conventional tillage on a Taloka silt loam (fine-mixed, thermic Mollic Albaqualf). Wheat has been planted for 19 continuous years in 10 inch rows at seeding rates of 90 pounds per acre
(rates increased when planting was delayed). Fertilization, planting and management dates are listed in Table 1. The experimental design in this continuing experiment employs a randomized complete block with four replications. Fertilizer treatments and average grain yields for selected periods are reported in Table 2. Individual plots at this site are 17 feet wide and 50 feet long. The center 10 feet are harvested with a conventional combine the entire 50 feet in length. In addition to wheat grain yield measured every year, periodic soil and grain samples were taken for chemical analyses. Results from surface (0-6 inches) soil samples collected in 1995 are reported in Table 3.
E
RESULTS
Soil pH declined significantly in all plots receiving N (with or without P and K). As a result, low soil pH (increased Al and Mn in soil solution) is the controlling factor for wheat grain production at this site. The lowest soil pH values were also those associated with the highest NO3-N levels in the surface. Applied P was expected to precipitate some of the Al in soil solution, especially at low soil pH levels where increased Al was expected. Applied P without N produced the highest grain yields from 1978 to 1986, and 1987 to 1997. Applied N did not result in any increased yield with or without P in any year. It was interesting to find NO3-N levels in excess of 300 ppm in the surface six inches. This translates into over 600 lb N /ac that would be available. Over the 18 years from the time the experiment was initiated to being soil sampled in 1995, accumulation of N was expected. However, if leaching of excess N were a viable pathway over time, surface accumulation at levels greater than the annual rate applied would likely not be found. Increased applied K (treatments 6, 7 and 8) tended to increase surface NO3-N. Grain yields decreased with increasing applied K (Table 2).

OSU Soil Fertility Research 1997 Page 29
Table 1. Treatment applications and experimental management for continuous winter wheat Experiment 801, Haskell, OK, 1978-1997. _____________________________________________________________________________
Year Variety Fertilizer Planting Date Harvest Seeding RateApplication Date lb/ac
Date_____________________________________________________________________________1978 6-26-78 751979 Osage 10-15-78 10-24-78 7-2-79 1001980 TAM W-101 10-15-79 10-17-79 6-30-80 1201981 TAM W-101 10-8-80 10-14-80 6-24-81 901982 TAM W-101 10-28-81 10-30-81 7-16-82 901983 TAM W-101 9-9-82 9-29-82 7-5-83 901984 Vona 11-4-83 11-4-83 6-20-84 901985 Vona 10-3-84 10-8-84 6-18-85 901986 Vona 1-10-86 1-11-86 6-19-86 1501987 Chisholm 9-22-86 9-23-86 6-17-87 901988 Chisholm 10-2-87 10-6-87 6-9-88 901989 Chisholm 10-13-88 10-14-88 6-20-89 901990 Chisholm 10-12-89 10-18-89 6-13-90 901991 Chisholm 8-21-90 10-15-90 6-20-91 901992 Chisholm 10-1-91 10-2-91 6-20-92 901993 Karl 10-5-92 10-6-92 6-18-93 1201994 2163 10-5-93 10-6-93 6-15-94 901995 Tonkawa 10-10-94 10-12-94 6-17-95 901996 Tonkawa 10-6-95 10-12-95 6-18-96 901997 Tonkawa 10-9-96 10-11-96 6-18-97 100_____________________________________________________________________________
Table 2. Treatment structure and wheat grain yields of long-term wheat Experiment 801, Haskell, OK, 1978-1997.____________________________________________________________________________
---------------Mean Yield--------------Trt. N P2O5 K2O 1978-86 1987-97 1978-97
lb/ac bu/ac____________________________________________________________________________1. 0 0 0 19.0 17.1 18.02. 0 120 120 36.1 29.3 32.43. 100 0 0 15.4 1.9 7.94 150 0 0 16.9 0.07 7.65. 100 120 0 29.9 13.7 21.06. 100 120 40 33.5 19.8 25.67. 100 120 80 32.0 20.1 25.58. 100 120 120 32.4 16.2 23.59. 100 0 120 17.2 1.5 8.610. 100 40 120 32.1 9.7 18.111. 100 80 120 35.5 16.3 24.912. 150 120 120 30.9 9.2 19.013. 150* 120 120 30.2 8.1 18.1
SED 2.9 3.3 3.4

Page 30 1997 OSU Soil Fertility Research
CV, % 15 38 25_____________________________________________________________________________*-N split applied, 100 lb N/ac in the fall and 50 lb N/ac in the spring. N applied as 34-0-0, P as 0-46-0, and K as 0-0-60. SED - standard error of the difference between two equally replicated means. CV - coefficient of variation.

OSU Soil Fertility Research 1997 Page 31
Table 3. Treatment structure of long-term wheat Experiment 801 and surface (0-6 inches) soil test analyses from samples collected in 1995, Haskell, OK.____________________________________________________________________________
Trt. N P2O5 K2O pH NO3-N P K Total N Organic Clb/ac ppm ppm ppm % %
____________________________________________________________________________1. 0 0 0 5.32 1.6 8 163 0.069 0.7412. 0 120 120 5.15 3.4 71 302 0.075 0.8173. 100 0 0 4.17 300.6 13 118 0.110 0.7484 150 0 0 4.18 312.2 32 199 0.141 0.7245. 100 120 0 4.65 66.5 62 147 0.086 0.7946. 100 120 40 4.80 11.7 88 157 0.087 0.8397. 100 120 80 4.67 31.7 82 193 0.083 0.8008. 100 120 120 4.43 64.6 92 334 0.091 0.8019. 100 0 120 4.21 311.7 15 385 0.111 0.70710. 100 40 120 4.15 203.4 31 359 0.104 0.77111. 100 80 120 4.46 59.4 59 265 0.087 0.81512. 150 120 120 4.19 205.4 95 326 0.108 0.81213. 150* 120 120 4.07 321.8 86 308 0.131 0.806
SED 0.22 59 11 46 0.010 0.030CV, % 7 58 27 26 15 5_____________________________________________________________________________*-N split applied, 100 lb N/ac in the Fall and 50 lb N/ac in the Spring. N applied as 34-0-0, P as 0-46-0, and K as 0-0-60. SED - standard of the difference between two equally replicated means. CV - coefficient of variation.

Page 32 1997 OSU Soil Fertility Research
Wheat Grain Yield Response in Acid Soils to Phosphorus Applications, Experiment 802, Haskell, Oklahoma
ABSTRACTSoils in northeastern Oklahoma are generally acid where winter wheat is grown. Long-term evaluation of wheat grain yield response to fertilizer applications have not been evaluated. Experiment 802 was established in 1977 to evaluate one-time fixed rates of phosphorus fertilizer in continuous winter wheat. All one-time preplant P rates, excluding the 1200 P2O5 rate, became inadequate within 7 years (60-600 lb P2O5 /ac) on this highly acid soil. Soil test P levels were 100 % sufficient for the 600 and 1200 lb P 2O5
rates in 1995, however, the 600 lb P2O5 rate no longer resulted in grain yields near that achieved by the 1200 lb P2O5 treatment. The one-time application of 1200 lb P2O5/ac in 1977 has resulted in near maximum grain yields for 20 years. Although frequency of application was not evaluated in this study, higher rates over less frequent intervals may prove to be advantageous for highly acid soils. Based on high soil test P levels for the 600 lb P2O5/ac rate in 1995 (32.6 ppm or a P soil test index of 65.2 which is 100 % sufficient), and observed decreased yields in recent years, these results also suggest the need for re-calibration of soil test P levels at low pH.
MATERIALS AND METHODS
xperiment 802 was established in the fall of 1977 under conventional tillage on a Taloka silt loam (fine-mixed, thermic Mollic Albaqualf). Wheat has been planted for 19 continuous years in 10 inch rows at seeding rates of 90 pounds per acre
(rates increased when planting was delayed). Fertilization, planting and management dates are listed in Table 1. The experimental design in this continuing experiment employs a randomized complete block with four replications. Fertilizer treatments used in this experiment along with average grain yields for selected periods are reported in Table 2. Individual plots at this site are 17 feet wide and 50 feet long. The center 10 feet are harvested with a conventional combine the entire 50 feet in length. In addition to wheat grain yield measured every year, periodic soil and grain samples were taken for further chemical analyses. Results from surface (0-6 inches) soil samples collected in 1995 are reported in Table 3.
E
RESULTS
From 1978 to 1986, wheat grain yields were maximized from the one-time application of 60 lb P2O5/ac applied in the fall of 1977. From 1987 to 1997, the maximum yield was achieved from applied P at a rate of 1200 lb P 2O5/ac in the fall of 1977. When observing relative wheat grain yields plotted by treatment over time, it is evident that all P treatments, excluding the 1200 P2O5 rate, became inadequate soon after 1985, with little difference between the 240 and 600 lb P2O5 rates (Figure 1). Soil test P levels were 100 % sufficient for the 600 and 1200 lb P2O5 rates in 1995, however, the

OSU Soil Fertility Research 1997 Page 33
600 lb P2O5 rate no longer resulted in grain yields near that achieved by the 1200 lb P2O5 treatment. The one-time application of 1200 lb P2O5/ac in 1977 has resulted in near maximum grain yields for 20 years. Although frequency of application was not evaluated in this study, higher rates over less frequent intervals may prove to be advantageous for highly acid soils. Based on high soil test P levels for the 600 lb P 2O5/ac rate in 1995 (32.6 ppm or a P soil test index of 65.2 which is 100 % sufficient), and observed decreased yields in recent years, these results also suggest the need for re-calibration of soil test P levels at low pH.
Table 1. Treatment applications, and experimental management for continuous winter wheat Experiment 802, Haskell, OK, 1978-1997. _____________________________________________________________________________
Year Variety Fertilizer Planting Date Harvest Seeding RateApplication Date lb/ac
Date 1978 6-26-78 751979 Osage 10-15-78 10-24-78 7-2-79 1001980 TAM W-101 10-15-79 10-17-79 6-30-80 1201981 TAM W-101 10-14-80 10-14-80 6-25-81 901982 TAM W-101 10-28-81 10-30-81 7-19-82 901983 TAM W-101 9-9-82 9-29-82 7-5-83 901984 Vona 11-4-83 11-4-83 6-20-84 901985 Vona 10-3-84 10-8-84 6-18-85 901986 Vona 10-10-85 1-11-86 6-19-86 1501987 Chisholm 9-22-86 9-23-86 6-17-87 901988 Chisholm 10-2-87 10-6-87 6-9-88 901989 Chisholm 10-13-88 10-14-88 6-20-89 901990 Chisholm 10-12-89 10-18-89 6-13-90 901991 Chisholm 10-15-90 10-15-90 6-20-91 901992 Chisholm 10-1-91 10-2-91 6-20-92 901993 Karl 10-5-92 10-6-92 6-18-93 1201994 2163 10-5-93 10-6-93 6-15-94 901995 Tonkawa 10-10-94 10-12-94 6-17-95 901996 Tonkawa 10-6-95 10-12-95 6-18-96 901997 Tonkawa 10-9-96 10-11-96 6-18-97 100____________________________________________________________________________
Table 2. Treatment structure of long-term winter wheat Experiment 802 and average grain yield means, Haskell, Oklahoma, 1978-1997.________________________________________________________________________
---------------------Mean Yield------------------Trt. N P2O5 K2O 1978-86 1987-97 1978-97 lb/ac bu/ac 1. 100 0 100 17.08 2.31 8.952. 100 60 100 29.72 4.31 15.753. 100 120 100 28.40 3.30 14.594 100 240 100 26.17 4.52 14.265. 100 600 100 21.91 8.65 14.616. 100 1200 100 21.02 16.54 18.55
SED 2.66 2.82 3.10CV, % 15 60 30

Page 34 1997 OSU Soil Fertility Research
________________________________________________________________________N applied as 34-0-0, P as 0-46-0, and K as 0-0-60. SED - standard error of the difference between two equally replicated means. CV - coefficient of variation.
Table 3. Treatment structure of long-term winter wheat Experiment 802, and surface (0-6 inches) soil test analyses from samples collected in 1995, Haskell, OK._____________________________________________________________________________
Trt. N P2O5 K2O pH NO3-N P K Total N Organic C
lb/ac ppm ppm ppm % %_____________________________________________________________________________1. 100 0 100 4.04 126 6.9 247 0.086 0.9332. 100 60 100 3.93 162 11.6 248 0.094 0.9833. 100 120 100 3.93 108 8.6 251 0.089 0.9734 100 240 100 4.03 96 14.4 204 0.091 1.0135. 100 600 100 4.35 33 32.6 183 0.083 0.9936. 100 1200 100 4.48 18 84.4 187 0.081 1.004
SED 0.10 20 1.7 24 0.003 0.036CV, % 3 31 9 15 5 5_____________________________________________________________________________N applied as 34-0-0, P as 0-46-0, and K as 0-0-60. SED - standard error of the difference between two equally replicated means. CV - coefficient of variation.
Figure 1. Relative wheat grain yields, by treatment and year, Experiment 802, Haskell, OK, 1978-1997.
0
0.2
0.4
0.6
0.8
1
1.2
1975 1980 1985 1990 1995 2000
Year
Rela
tive
yiel
d
P0
P60
P120
P240
P600
P1200

OSU Soil Fertility Research 1997 Page 35
Wheat Grain Yield Response in Acid Soils to Potassium Applications, Experiment 803, Haskell, Oklahoma
ABSTRACTSoils in northeastern Oklahoma are generally acid where winter wheat is grown. Long-term evaluation of wheat grain yield response to fertilizer applications has not been evaluated. Experiment 803 was established to evaluate nitrogen, phosphorus and potassium fertilizer applications on continuous winter wheat. No response to applied K has been observed in this experiment from one-time K applications in 1977. Soil pH has decreased in this experiment since 1977 and may well be controlling response since all plots are now below 4.7. Soil total N and organic C have largely been unaffected by K fertilization.
MATERIALS AND METHODS
xperiment 803 was established in the fall of 1977 under conventional tillage on a Taloka silt loam (fine-mixed, thermic Mollic Albaqualf). Wheat has been planted for 19 continuous years in 10 inch rows at seeding rates of 90 pounds per acre
(rates increased when planting was delayed). Fertilization, planting and management dates are listed in Table 1. The experimental design in this continuing experiment employs a randomized complete block with four replications. Fertilizer treatments used in this experiment along with average grain yields for selected periods are reported in Table 2. Individual plots at this site are 17 feet wide and 50 feet long. The center 10 feet are harvested with a conventional combine the entire 50 feet in length. In addition to wheat grain yield measured every year, periodic soil and grain samples were taken for further chemical analyses. Results from surface (0-6 inches) soil samples collected in 1995 are reported in Table 3.
E
RESULTS
Since 1978 no response to the one-time application of applied K has been observed in any year, or over the time periods reported in Table 2. Yield levels were higher in the first ten years of the experiment. Decreased yields with time can be attributed to increased soil acidity that has been measured with time. Soil test K levels were below 80% sufficiency in the check plot (treatment 1, Table 3) by 1994, yet no yield differences have been observed when compared to the high K rate treatments. Soil pH has decreased in this experiment since 1977 and may well be controlling response since all plots are now below 4.7. Soil total N and organic C have largely been unaffected by K fertilization.

Page 36 1997 OSU Soil Fertility Research
Table 1. Treatment applications and experimental management for continuous winter wheat Experiment 803, Haskell, OK, 1978-1997. _____________________________________________________________________________
Year Variety Fertilizer Planting Date Harvest Seeding RateApplication Date lb/ac
Date_____________________________________________________________________________1978 6-26-78 751979 Osage 10-15-78 10-24-78 7-2-79 1001980 TAM W-101 10-15-79 10-17-79 6-30-80 1201981 TAM W-101 10-8-80 10-14-80 6-25-81 901982 TAM W-101 10-27-81 10-30-81 7-19-82 901983 TAM W-101 9-9-82 9-29-82 7-6-83 901984 Vona 11-4-83 11-4-83 6-21-84 901985 Vona 10-3-84 10-8-84 6-18-85 901986 Vona 10-10-85 1-11-86 6-19-86 1501987 Chisholm 9-22-86 9-23-86 6-17-87 901988 Chisholm 10-2-87 10-6-87 6-9-88 901989 Chisholm 10-13-88 10-14-88 6-20-89 901990 Chisholm 10-12-89 10-18-89 6-13-90 901991 Chisholm 10-15-90 10-15-90 6-20-91 901992 Chisholm 10-1-91 10-2-91 6-20-92 901993 Karl 10-5-92 10-6-92 6-18-93 1201994 2163 10-5-93 10-6-93 6-15-94 901995 Tonkawa 10-10-94 10-12-94 6-17-95 901996 Tonkawa 10-6-95 10-12-95 6-18-96 901997 Tonkawa 10-9-96 10-11-96 6-18-97 100_____________________________________________________________________________

OSU Soil Fertility Research 1997 Page 37
Table 2. Treatment structure of long-term winter wheat Experiment 803 and average grain yields, Haskell, OK, 1978-1997._____________________________________________________________________________
---------------------Mean Yield------------------Trt. N P2O5 K2O 1978-1986 1987-97 1978-97
lb/ac bu/ac_____________________________________________________________________________1. 100 100 0 31.0 20.5 25.52. 100 100 60 32.1 20.5 26.03. 100 100 120 32.3 24.4 28.14 100 100 240 31.4 22.2 26.65. 100 100 600 31.7 20.7 25.96. 100 100 1200 30.7 18.2 24.1
SED 2.8 3.0 3.1CV, % 13 20 17_____________________________________________________________________________N applied as 34-0-0, P as 0-46-0, and K as 0-0-60. SED - standard error of the difference between two equally replicated means. CV - coefficient of variation.
Table 3. Treatment structure of long-term winter wheat Experiment 803 and surface (0-6 inches) soil test analyses from 1994, Haskell, OK, 1978-1997._____________________________________________________________________________
Trt. N P2O5 K2O pH NO3-N P K Total N Organic Clb/ac ppm ppm ppm % %
_____________________________________________________________________________1. 100 100 0 4.58 14.0 76 66 0.079 0.9692. 100 100 60 4.65 13.6 74 83 0.081 0.9673. 100 100 120 4.73 14.2 85 89 0.084 0.9914 100 100 240 4.68 16.8 74 78 0.083 0.9695. 100 100 600 4.70 15.8 69 116 0.083 0.9926. 100 100 1200 4.65 14.6 81 161 0.080 0.983
SED 0.07 2.0 7.4 17 0.002 0.030CV, % 2 19 14 25 4 4_____________________________________________________________________________N applied as 34-0-0, P as 0-46-0, and K as 0-0-60. SED - standard error of the difference between two equally replicated means. CV - coefficient of variation.

Page 38 1997 OSU Soil Fertility Research
Wheat Grain Yield Response in Acid Soils to Lime Applications, Experiment 804, Haskell, Oklahoma
ABSTRACTSoil acidity has become a serious concern in soils in northeastern Oklahoma, which are generally acid where winter wheat is grown. Long-term evaluation of wheat grain yield response to fertilizer applications has not been evaluated. Experiment 804 was established in 1977 to evaluate lime applications on continuous winter wheat. In the latter years of this experiment, yield increases ranged from 8 to 14 bushels/acre/year as a result of applied lime in the fall of 1977. Relative yields demonstrate that the 1.2 ton ECCE lime was as effective as 2.4 ton ECCE lime up until 1991. Since that time, the 2.4 ton treatment has produced the highest yields. Because soil pH is a limiting production factor at this site, it was important to find that the 1.2 ton ECCE treatment was effective for almost 15 years.
MATERIALS AND METHODS
xperiment 804 was established in the fall of 1977 under conventional tillage on a Taloka silt loam (fine-mixed, thermic Mollic Albaqualf). Wheat has been planted for 19 continuous years in 10 inch rows at seeding rates of 90 pounds per acre
(rates increased when planting was delayed). Fertilization, planting and management dates are listed in Table 1. The experimental design in this continuing experiment employs a randomized complete block with four replications. Fertilizer treatments used in this experiment along with average grain yields for selected periods are reported in Table 2. Individual plots at this site are 24 feet wide and 50 feet long. The center 10 feet are harvested with a conventional combine the entire 50 feet in length. In addition to wheat grain yield measured every year, periodic soil and grain samples were taken for further chemical analyses. Results from surface (0-6 inches) soil samples collected in 1995 are reported in Table 3.
E
RESULTS
Wheat grain yields did not respond to applied lime in the first ten years of the experiment (Table 2) where soil pH was initially at 5.5 and BI was 6.8. However, from 1986 to 1997, yield increases ranged from 8 to 14 bushels/acre/year. Relative yield comparisons show that the 1.2 ton ECCE lime application in 1977 was as effective as the 2.4 ton ECCE lime treatment up until 1991. Since that time, the 2.4 ton treatment applied in 1977 has produced the highest yields. Because soil pH is a limiting production factor at this site, it was important to find that the 1.2 ton ECCE treatment was effective for almost 15 years. Soil test P, K, total N and organic C levels have been unaffected over time (Table 3).

OSU Soil Fertility Research 1997 Page 39
Table 1. Treatment applications and experimental management for continuos winter wheat Experiment 804, Haskell, OK, 1978-1997. _____________________________________________________________________________
Year Variety Fertilizer Planting Date Harvest Seeding RateApplication Date lb/ac
Date 1978 6-26-78 751979 Osage 10-15-78 10-24-78 7-2-79 1001980 TAM W-101 10-15-79 10-17-79 6-30-80 1201981 TAM W-101 10-8-80 10-14-80 6-25-81 901982 TAM W-101 10-27-81 10-30-81 7-19-82 901983 TAM W-101 9-9-82 9-29-82 7-6-83 901984 Vona 11-4-83 11-4-83 6-21-84 901985 Vona 10-8-84 10-8-84 6-18-85 901986 Vona 10-10-85 1-11-86 6-19-86 1501987 Chisholm 9-22-86 9-23-86 6-17-87 901988 Chisholm 10-2-87 10-6-87 6-9-88 901989 Chisholm 10-13-88 10-14-88 6-20-89 901990 Chisholm 10-12-89 10-18-89 6-13-90 901991 Chisholm 10-15-90 10-15-90 6-20-91 901992 Chisholm 10-1-91 10-2-91 6-20-92 901993 Karl 10-5-92 10-6-92 6-18-93 1201994 2163 10-5-93 10-6-93 6-15-94 901995 Tonkawa 10-10-94 10-12-94 6-17-95 901996 Tonkawa 10-6-95 10-12-95 6-17-96 901997 Tonkawa 10-9-96 10-11-96 6-17-97 100____________________________________________________________________________
Table 2. Treatment structure of long-term wheat Experiment 804, Haskell, Oklahoma, 1978-1997._____________________________________________________________________________
--------------------Mean Yield--------------------Trt. N P2O5 K2O Lime 1978-1986 1986-1997 1978-1997 lb/ac t/ac bu/ac 1. 100 60 60 0 34.0 22.9 27.92. 100 60 60 0.6 35.6 31.0 33.13. 100 60 60 1.2 35.8 34.5 35.14 100 60 60 2.4 35.5 37.4 36.5SED 2.8 3.0 2.9CV, % 13 12 13_____________________________________________________________________________N applied as 34-0-0, P as 0-46-0, and K as 0-0-60. SED - standard error of the difference between two equally replicated means. CV - coefficient of variation.

Page 40 1997 OSU Soil Fertility Research
Table 3. Treatment structure of long-term wheat Experiment 804, Haskell, Oklahoma, 1978-1997 and surface (0-6 inches) soil test analyses from samples collected in 1994._____________________________________________________________________________
Trt. N P2O5 K2O Lime pH NO3-N P K Total N Organic C lb/ac t/ac ppm ppm ppm % % 1. 100 60 60 0 4.84 15.5 35.3 204 0.086 1.0442. 100 60 60 0.6 4.89 14.7 33.1 181 0.086 1.0543. 100 60 60 1.2 5.00 15.1 29.9 184 0.089 1.0514 100 60 60 2.4 5.12 14.5 26.5 193 0.088 1.080SED 0.07 1.4 2.1 10.4 0.002 0.033CV, % 2 13 10 8 4 4_____________________________________________________________________________N applied as 34-0-0, P as 0-46-0, and K as 0-0-60. SED - standard error of the difference between two equally replicated means. CV - coefficient of variation.
Figure 1. Relative wheat grain yields, by treatment and year, Experiment 804, Haskell, OK, 1978-1997.
0
0.2
0.4
0.6
0.8
1
1.2
1975 1980 1985 1990 1995 2000
Year
Rela
tive
yiel
d L 0
L 0.6L 1.2
L 2.4

OSU Soil Fertility Research 1997 Page 41
Suppression of Winter Wheat Take-All Disease Using Chloride Fertilizers, Carrier, Oklahoma
ABSTRACTOne experiment was initiated in the fall of 1991 to evaluate the effect of Cl fertilizers on the suppression of take-all (Gaeumannomyces graminis var. tritici Walker) in winter wheat. Preplant and topdress rates of KCl and CaCl2 (0, 30, 60 and 90 lb Cl/acre) were applied each year to the same plots. In 1995, plots were split in half whereby one half received 2 tons of 76% ECCE lime/acre to elevate the pH and potentially increase disease incidence. Since 1992, limited grain yield response to applied Cl fertilizer has been found irrespective of the source. No differences in wheat grain yield have been observed since lime was first applied in 1995.
INTRODUCTION
ake-all, (Gaeumannomyces graminis var. tritici Walker) is a soil-borne disease of wheat. It is caused by a fungal pathogen and is often found in conjunction with other root diseases. Research conducted in other wheat producing regions of the
United States has indicated that application of lime to lower soil pH can favor increased incidence of take-all infection. Few control measures other than crop rotation are available. Much literature is found reporting effects of various fertilizers and soil amendments on crop response to diseases. Research results indicate that take-all depresses wheat grain yields more in dry soil conditions than in wet conditions. As soil pH increases above 4, take-all infection increases substantially. Field trial results in Oregon show take-all suppression by chloride is possibly due to modification of the wheat plant's water potential. However, others state that it is also possibly due to inhibition of nitrification by chloride in unlimed acid soils.
T
In the Pacific Northwest and in North and South Dakota, researchers recommend application of chloride fertilizers to reduce take-all severity. Some recently available fungicide seed treatments appear to decrease the severity of reduction in yield as a result of take-all infection. The objectives of this experiment were to evaluate fungicide seed treatments and chloride fertilizer rates for the suppression of take-all disease.
MATERIALS AND METHODS
One replicated field experiment consisting of various potassium chloride and calcium chloride fertilizer rates has been conducted at the Ray Nelson farm near Carrier since 1992. The treatment structure used since 1992 is reported in Table 1. Wheat variety planted, planting, fertilization and harvest dates are reported in Table 2. Chloride fertilizer rates of 30, 60 and 90 lb Cl/acre using potassium chloride (KCl, 0-0-62) and calcium chloride were broadcast preplant and a topdress rate of 90 lb Cl/acre was also included for both sources. Two completely untreated check plots were included in the experimental design. The plots that received Cl treatment did not receive any fungicide seed treatment. Annual applications of anhydrous ammonia (AA) have traditionally been used as a management practice, and 80 lb N/acre as AA was applied in the fall of each

Page 42 1997 OSU Soil Fertility Research
year. Plots were planted with a conventional grain drill at 75 lb/acre seeding rate. Twenty lb/acre of P2O5 using diammonium phosphate (DAP, 18-46-0) was banded with the seed at planting. Plot size was 16 ft wide x 50 feet in length. The treatments were replicated four times in a randomized complete block experimental design. In 1995, plots were split in half whereby the east half of each plot received 2 tons of 76% ECCE /acre. The center of each plot was harvested with a self propelled conventional combine in June of each year.
RESULTS
Since 1992, a significant wheat grain yield increase as a result of applying Cl has only been observed twice (Table 3). A linear increase in wheat grain yield was found when KCl was applied in 1992. Since that time, no yield increase due to annual applications of KCl have been observed at this site. Grain yields also increased in 1994 as a result of applying CaCl2. A linear increase (0-30-60-90) was observed over all rates evaluated. Differences between preplant incorporated and topdress (3 vs 4 and 7 vs 8 for KCl and CaCl2, respectively) were generally small. However, in 1997, topdress applied CaCl2 was significantly better than preplant, however, neither were significantly better than the check where no Cl was applied.
Over the three years since lime was applied to the east half of each plot, no significant differences in yield have been observed in either the treated or untreated plots. It was hoped that the elevated pH would induce take-all, therefore, allowing better evaluation of Cl treatments where possible suppression could be evaluated. However, the severity of take-all in these plots has been minimal since lime was applied in 1995.
Table 1. Treatment structure used in the take-all suppression experiment since 1992, Carrier, OK (plots split in the fall of 1995, half receiving 2 tons 76%ECCE lime/acre)._______________________________________________________________________________Treatment Cl rate Source Method________________________________________________________________1 30 lbs Cl/acre CaCl2 preplant2 60 lbs Cl/acre CaCl2 preplant3 90 lbs Cl/acre CaCl2 preplant4 90 lbs Cl/acre CaCl2 topdress5 30 lbs Cl/acre KCl preplant6 60 lbs Cl/acre KCl preplant 7 90 lbs Cl/acre KCl preplant8 90 lbs Cl/acre KCl topdress9 0 - -10 0 - -________________________________________________________________

OSU Soil Fertility Research 1997 Page 43
Table 2. Planting and harvest dates, and varieties used, Carrier, OK, 1992-1997._____________________________________________________________________________Year Variety Fertilizer applied Planting date Topdress Harvest
date_____________________________________________________________________________
1992 2163 10-10-91 11-13-91 2-22-92 6-24-921993 2163 9-29-92 10-12-92 3-9-93 6-34-931994 2163 10-16-93 10-93 3-17-94 6-13-941995 2163 10-16-94 10-94 3-6-95 6-21-951996 Jagger 9-4-95 10-95 4-1-96 6-21-961997 Custer 9-4-96 10-96 4-1-97 6-21-97_____________________________________________________________________________Deep and surface soil samples collected on July 3, 1993
Table 3. Treatment structure used in the take-all suppression experiment since 1992, Carrier, OK (plots split in the fall of 1995, half receiving 2 tons 76%ECCE lime/acre)._________________________________________________________________________________________________Treatment Cl rate Source Method 1992 1993 1994 1995 1996 1997
bu/acre_____________________________________________________________________________________1 30 lbs Cl/acre CaCl2 preplant 27.1 44.0 44.9 16.0 39.7 47.42 60 lbs Cl/acre CaCl2 preplant 25.9 43.7 48.0 16.9 40.7 46.73 90 lbs Cl/acre CaCl2 preplant 26.5 41.0 49.0 15.9 40.2 46.34 90 lbs Cl/acre CaCl2 topdress 25.6 39.9 47.3 16.0 39.8 49.05 30 lbs Cl/acre KCl preplant 29.3 41.0 46.2 15.5 38.1 48.06 60 lbs Cl/acre KCl preplant 30.9 42.6 47.5 16.2 38.6 47.87 90 lbs Cl/acre KCl preplant 29.2 39.7 48.6 17.3 38.1 46.48 90 lbs Cl/acre KCl topdress 29.3 41.5 48.0 16.4 38.9 46.49 0 - - 25.7 40.5 45.0 16.8 39.6 47.410 0 - - 26.0 39.2 46.2 16.4 39.1 48.5
SED 0.97 1.92 2.17 1.11 2.00 1.76CV, % 5 7 7 10 7 5
ContrastsCaCl - linear ns ns * ns ns nsCaCl - quadratic ns ns ns ns ns nsKCl - linear ** ns ns ns ns nsKCl - quadratic ** ns ns ns ns ns3 vs 4 ns ns ns ns ns *7 vs 8 ns ns ns ns ns ns_____________________________________________________________________________________

Page 44 1997 OSU Soil Fertility Research
Effect Of Sewage Sludge And Ammonium Nitrate On Wheat Yield And Soil Profile Inorganic Nitrogen Accumulation
Francisco Gavi, William R. Raun, Nicholas T. Basta, and Gordon V. Johnson
ABSTRACTThe beneficial effect of sewage sludge in crop production has been demonstrated, but there is concern regarding its contribution to NO3
leaching. The objectives of this study were to compare N rates of sewage sludge and ammonium nitrate on soil profile (0-180 cm) inorganic N (NH4-N and NO3-N) accumulation, yield and N uptake in winter wheat (Triticum aestivum L.). One field experiment was established in 1993 that evaluated six N rates (0 to 540 kg ha-1 yr-1) as dry anaerobically digested sewage sludge and ammonium nitrate. Lime application in 1993 (4.48 Mg ha-1) with 540 kg N ha-1 yr-1 was also evaluated. A laboratory incubation study was included to simulate N mineralization from sewage sludge applied at rates of 45, 180 and 540 kg N ha-1 yr-1. Treatments did not affect surface soil (0-30 cm) pH, organic C and total N following the first (1994) and second (1995) harvest. Soil profile inorganic N accumulation increased when > 270 kg N ha-1 was applied as ammonium nitrate. Less soil profile inorganic N accumulation was detected when lime was applied. In general, wheat yields and N uptake increased linearly with applied N as sewage sludge, while wheat yields and N uptake peaked at 270 kg N ha -1 when N was applied as ammonium nitrate. Lime did not affect yields or N uptake. Fertilizer N immobilization was expected to be high at this site where wheat was produced for the first time in over 10 years (previously in native bermudgrass (Cynodon dactylon L.)). Estimated N use efficiency using sewage sludge in grain production was 20% (average of two harvests) compared to ammonium nitrate. Estimated plant N recovery was 17% for sewage sludge and 27% for ammonium nitrate.
INTRODUCTION
lthough many studies have reported the effects of land application of sewage sludge on heavy metal accumulation in grain crops and soils, little work has targeted soil profile accumulation of NH4-N and NO3-N. Most of the N in
sewage sludge is in organic forms (> 1%) with smaller amounts (< 0.5%) present as NH4-N and only trace amounts present as NO3-N (Basta, 1995). Under laboratory conditions, N mineralization rates range from 10 to 40% (U.S. EPA, 1983), but field mineralization rates are more variable ranging from 7 to 55% of the organic N mineralized (Fox and Axley, 1985). Federal regulations require land application of sewage sludge based on the “agronomic rate”, which is the amount of sludge that will meet the crop N requirement (U.S. EPA, 1983). Obtaining accurate agronomic rates requires estimating mineralization.
A
Nitrate from sewage sludge or inorganic fertilizer that is not taken up by plants, volatilized as reduced N from plants, immobilized, or denitrified has the potential to

OSU Soil Fertility Research 1997 Page 45
move with the soil water and eventually enter the groundwater (Hue, 1995). Application of sewage sludge at agronomic N rates minimizes the risk of contamination (U.S. EPA, 1993), while excessive sludge application increases the risk of nitrate leaching and potential groundwater contamination. After 2 years, N rates greater than 2600 kg ha-1 yr-
1 as liquid anaerobically digested sewage sludge resulted in significant nitrate accumulation in the 0-120 cm soil profile in a bermudagrass production system (King and Morris, 1972). Results from a 12 year field study recommended application of liquid anaerobically digested sewage sludge at 100 kg N ha-1 every 2 years to avoid soil accumulation of nitrate in a continuous dryland winter wheat production system (Ippolito et al., 1994). Application of 225 kg N ha-1 as anaerobically digested sewage sludge every 3 years did not result in adverse effects on drinking water standards at a 31-year-old forest site (Chron and Haith, 1994). Sewage sludge application with N rates greater than the agronomic rate resulted in high (10 mg L-1) levels of nitrate-N in soil water, but not deep groundwater in a 20-year field study (Clapp et al., 1994). The objectives of this study were to compare N rates of sewage sludge and ammonium nitrate on soil profile (0-180 cm) inorganic N (NH4-N and NO3-N) accumulation, grain and straw yields, N uptake in winter wheat and to estimate the field N mineralization rate of sewage sludge.
MATERIALS AND METHODS
Field StudyOne winter wheat field experiment was established at the Efaw Experiment
Station (Oklahoma State University, Stillwater, OK) in the fall of 1993. Bermudagrass was grown at this site without any fertilization or tillage for more than 10 years prior to starting this experiment. A complete factorial arrangement of treatments consisting of six N rates (0, 45, 90, 180, 270 and 540 kg N ha-1 yr-1) and two N sources (ammonium nitrate, 34-0-0, anaerobically-digested sewage sludge) was evaluated. Two added treatments outside the factorial included lime applied in 1993 (4.48 Mg ha -1) to the high N rate plots (540 kg N ha-1 yr-1) for both N sources. The experimental design was a randomized complete block with three replications. The soil at this location is a Norge loam (fine mixed, thermic Udertic Paleustoll). Baseline soil test levels, elemental analysis and pH of sewage sludge applied for each year are reported in Table 1. Wheat varieties, seeding rates, treatment application, soil sampling and harvest dates are reported in Table 2.
Surface soil samples (0-30 cm) were collected from all plots following wheat harvest in 1994 and 1995. These samples were analyzed for pH, total N and organic C. Following harvest in 1995, soil cores (4.5 cm in diameter) were taken to a depth of 180 cm (0-30, 30-60, 60-90, 90-120, 120-150 and 150-180 cm) and analyzed for NH4-N and NO3-N. Inorganic soil profile N accumulation was determined using inorganic N concentration and measured bulk density to a depth of 180 cm. Total N and organic C was determined using dry combustion (Schepers et al., 1989). Soil samples were extracted using 2M KCl (Bremner, 1965) and analyzed for NH4-N and NO3-N using an automated flow injection analysis system (Lachat, 1989; 1990). Sewage sludge samples were digested with nitric and perchloric acid for determination of total heavy metal content (Burau, 1982). Acid digests were analyzed for Pb, Cd, Mo, As, Se, Ni, Cu, and Zn using inductively coupled plasma atomic emission spectroscopy (ICP). Direct

Page 46 1997 OSU Soil Fertility Research
analysis of acid digests was possible for all elements except As and Se. Arsenic and Se were analyzed as hydride gases by ICP as described by Soltanpour et al. (1982).
Grain yield was determined by harvesting the center 3.05 m of each plot (10 m in length) using a self-propelled combine. Straw yields were determined by collecting all the residue from the same area used for grain yield. Wheat straw was uniformly distributed in all plots after harvest. Grain and straw subsamples were collected and analyzed for total N using dry combustion (Schepers et al., 1989).
Analysis of variance for surface soil analysis and soil profile inorganic N accumulation following the second year harvest was conducted. A split-plot in space analysis of variance model was used to evaluate soil profile inorganic N accumulation. Analysis of variance was performed on grain and straw yields, N uptake in grain and straw. Single degree of freedom non-orthogonal contrasts were used to detect treatment differences. Linear-plateau and linear models for grain yield on N rate as ammonium nitrate and sewage sludge were evaluated.
Laboratory StudyA laboratory study was conducted in a controlled environment to determine the
potential N mineralization of the soil and sewage sludge. This was conducted using soil collected from the field experiment and applying sewage sludge at N rates equivalent to that used in the field experiment. A modification of the aerobic incubation procedure described by Stanford and Smith (1972) and Douglas and Magdoff (1991) was used to determine the potentially mineralizable N. Ten grams of soil (20 mesh) was mixed with perlite at a 1:1 ratio by volume and placed in a 2 x 5 cm tube. Glass wool pads were placed above and below the sludge-soil-perlite mixture to minimize the movement of particles during the leaching process. Three replications of each mixture were incubated at 30°C for 22 weeks. Each column was leached with 30 ml of 0.01M CaCl2 at the beginning of the incubation and at 2, 4, 6, 8, 10, 14, 18 and 22 weeks. Leachate from each tube was analyzed for NH4-N and NO3-N using an automated flow injection analysis system (Lachat, 1989; 1990). Potentially mineralizable N (No) for each treatment was estimated using a cumulative exponential model, Nm=No(1-eb1*week), where Nm is the accumulated inorganic N (NH4-N + NO3-N) with time. Estimates of No, b1 and their respective lower and upper confidence intervals (p<0.05) were obtained using the NLIN procedure (SAS, 1988). For the 1994-1995 crop year, fertilizer plant N uptake was estimated by subtracting grain+straw N uptake in the check from the fertilized treatment. Because straw yield was not determined in 1993-1994, fertilizer plant N uptake was not estimated for this year.
RESULTS AND DISCUSSION
Soil characteristicsThe effects of treatments on surface soil analysis (pH, total N and organic C) and
soil profile inorganic N accumulation from 1995 are reported in Table 3. Similar results were obtained for these surface soil variables in 1994 (data not shown). Lime application did not affect measured pH following the second harvest. Two years of sewage sludge application did not affect soil profile (0-180 cm) inorganic N accumulation (Table 3, Figure 1). However, soil profile inorganic N accumulation increased significantly when

OSU Soil Fertility Research 1997 Page 47
N rates were >= 270 kg N ha-1 as ammonium nitrate. Ammonium nitrate applied at 270 kg N ha-1 resulted in a significant bulge at 30-60 cm and an increase in N accumulation was found at 90-120 cm for 540 kg N ha-1 (Figure 1). Because a bulge at the 270 kg ha-1
N rate was at a depth less than that noted at the 540 kg N ha -1, the soil-plant system was apparently able to buffer against NO3-N leaching (Raun and Johnson, 1995). Nitrogen accumulation bulges would have been present at the same depth (at both the 270 and 540 kg N ha-1 rates) if soil-plant buffering did not occur. Lime applied with ammonium nitrate at the 540 kg N ha-1 rate resulted in lower inorganic N accumulation in the soil profile. Lime may have enhanced microbial activity which in turn immobilized fertilizer N.
Wheat yield and N uptakeGrain and straw yield and N uptake increased with applied N in both years and
for both N sources (Table 4). However, grain yield and grain N uptake peaked at the 270 kg N ha-1 rate using ammonium nitrate. Grain yield and grain N uptake continued to increase up to 540 kg N ha-1 using sewage sludge. Straw yield and straw N uptake peaked at 270 kg N ha-1 using either N source. Although grain yield maximums would have occurred at loading rates > 540 kg N ha-1 using sewage sludge, the 540 kg N ha-1
rate (108 kg available N) exceeded that required for maximum yield (67 kg available N). Similarly, grain yields peaked at 270 kg N ha-1 using ammonium nitrate which would be 203 kg N ha-1 more than the normal recommendation (if 1 kg N ha-1 would produce 30 kg grain ha-1 then 67 kg N ha-1 would have been needed to produce 2004 kg grain ha-1, the average grain yield over years). The high rate of applied N as either ammonium nitrate or sewage sludge for maximum yields was likely due to a very large N-poor organic matter pool in the soil, which depleted soil-solution N. The organic matter build up was from the long-term bermudagrass pasture. Lime with either N source did not affect wheat yields and N uptake (Table 4). In general, maximum grain yields were higher in 1994 than in 1995 due to excessive rain and increased disease pressure.
The relationship between grain yield and N rate as ammonium nitrate was better explained by a linear-plateau model than by a linear model (Table 5). Linear-plateau models estimated maximum grain yields at 225 (+ 115) and 216 (+ 73) kg N ha-1 in 1994 and 1995, respectively. When comparing the linear segment of the linear-plateau models with the linear models obtained for grain yield on N rate as sewage sludge (Table 7), this N source (0 to 540 kg N ha-1) had an estimated relative efficiency of 17% (in 1994) and 22% (in 1995) with respect to ammonium nitrate (0 to 90 kg N ha-1 in 1994 and 0 to 117 kg N ha-1 in 1995). These estimates imply that 1324 (in 1994) and 982 kg of total N ha -1
(in 1995) as sewage sludge would have been needed to obtain maximum grain yields, which were reached with ammonium nitrate at a rate of 225 and 216 kg N ha -1 in 1994 and 1995, respectively. Anaerobically digested sewage sludge applied to perennial ryegrass (Lolium perenne L.)/white clover (Trifolium repens L.) over 2 years was 20% (first year) and 31% (second year) as efficient compared to calcium ammonium nitrate (O’Riordan et al., 1987).
Land application of sewage sludge at agronomic rates requires the use of a mineralization rate to calculate plant available N. Federal guidelines for land application suggest using an N mineralization rate of 20% to calculate plant available N for anaerobic-digested sewage sludge in the first year after application (U.S. EPA, 1983).

Page 48 1997 OSU Soil Fertility Research
The suggested 20% mineralization rate was derived from incubation of sewage sludge with soil under controlled laboratory conditions and may not be an accurate estimate of actual N mineralization under field conditions. The relative N use efficiency for grain in our study or dry matter yield (O’Riordan et al., 1987) provides an accurate estimate of the sewage sludge mineralization under field conditions. However, relative use efficiencies of 17% (in 1994) and 22% (in 1995) were very close to the 20% N mineralization rate suggested by U.S. EPA.
N Available from Sewage Sludge and Fertilizer N UptakeParameters of the model, Nm=No(1-eb1*week), for each treatment and their
respective 95% confidence intervals are reported in Table 6. Using the estimated potentially mineralizable N (No), available N derived from sewage sludge was estimated by difference. Treatments 1 to 4 (Table 6) simulated the fate of N as sewage sludge (1993) in the crop cycle 1993-1994 (year 1). Treatments 5 to 8 simulated the fate of N as sewage sludge applied to the same soil which had been cropped for 1 year without fertilization (year 2, Table 6). Estimated available N from year 2 treatments being much greater than year 1 may be attributed to higher N demand during organic matter decomposition in the first year than in the soil that had been cropped for 1 year. The remaining treatments (9 to 14, Table 6) simulated the amount of N released from sewage sludge following one cropping cycle. Treatments 9-11 received sewage sludge in 1993 but not in 1994. These treatments were designed to evaluate the residual effect of applied sewage sludge. Only the 540 kg N ha-1 rate treatment showed N mineralized during the 1994-1995 crop cycle (year 2r, Table 6). When the same sewage sludge N rates were applied again in 1994, mineralized N rates were similar to that noted for year 2 results. Another mineralization study using four types of sewage sludge at a rate of 250 to 398 kg N ha-1 showed N immobilization during a period of 22 weeks (Sims, 1990).
Incubation results were compared with fertilizer N uptake in grain and fertilizer N uptake in grain+straw (Table 7). Maximum potentially mineralizable N from sewage sludge (potentially available N times 100 and divided by total N rate applied) was 12% in 1993-1994 and 29% in 1994-1995. The potentially mineralizable N average value (21%) of this study is in the range of values (13-49%) determined by incubation for a wide variety of anaerobically digested sewage sludge (Sims, 1995). Relatively low fertilizer grain N uptake was recorded in 1994 with N rates as sewage sludge from 45 to 180 kg ha-1. Low grain N from net N immobilization in 1993-1994 was consistent with low available N shown by the incubation study (Table 6). Low fertilizer grain+straw N uptake was observed for sewage sludge N rates from 45 to 180 kg ha -1 in 1995, however, increased N uptake was observed at N rates > 180 kg ha-1 . The same trend of low fertilizer N uptake in grain (1994) and grain+straw (1995) was observed when a low rate of N was applied as ammonium nitrate. This N source was not evaluated in the incubation study. Lime application with either N source did not affect fertilizer N uptake in grain and grain+straw.
Fertilizer grain+straw N uptake in 1995 showed that wheat N recovery ranged from 6 to 16% with rates from 540 to 45 kg ha -1 as sewage sludge, and from 11 to 27% with rates from 540 to 90 kg ha-1 as ammonium nitrate. Sewage sludge N uptake (recovery) by wheat in our study was in agreement with N recoveries found in other

OSU Soil Fertility Research 1997 Page 49
grain and vegetable studies (8 to 14%, Larsen and Petersen, 1993). However, the N recovery (11 to 27%) when ammonium nitrate was applied was small compared to the 44-57% fertilizer use efficiency for ammonium sulfate (50 and 100 kg N ha -1) applied to winter wheat found by Olson et al. (1979).
In general, the N immobilization found in the incubation study and the low fertilizer N uptake in grain and grain+straw was in agreement with soil profile inorganic N found after harvest in 1995. None of the N rates as sewage sludge resulted in soil profile inorganic N accumulation, which indicates a net N immobilization (Figure 1). Nitrogen rates as ammonium nitrate from 45 to 180 kg ha-1 did not result in residual accumulation of inorganic N, but with 270 and 540 kg N ha-1 significant amounts of soil profile inorganic N accumulation were observed. Leaching was unlikely in these plots as was observed in the soil core analysis performed after harvest 1995 (Figure 1). Soil profile inorganic N was reduced to the same levels observed in the check plot at depths > 120 cm. It is likely that N immobilization played a major role in limiting N availability and at the same time reducing the risk of inorganic N leaching.
CONCLUSIONS
Nitrogen applied as sewage sludge or ammonium nitrate did not affect the soil surface (0-30 cm) pH, organic C and total N after the first and second winter wheat harvest. Lime addition with either source of N did not affect these soil surface variables.
Soil profile inorganic N accumulation (0-180 cm) was present only when N was applied at rates >= 270 kg ha-1 as ammonium nitrate. Less soil profile inorganic N accumulation was detected with lime application, but wheat yields and N uptake were not affected. Lime could have increased microbial N immobilization.
In general, wheat yields and N uptake increased linearly with applied N as sewage sludge while wheat yields and N uptake peaked at 220 kg N ha -1, when N was applied as ammonium nitrate. Sewage sludge application had an estimated relative N use efficiency in grain production of 20% (average of two harvests) with respect to ammonium nitrate. This field observation agrees with the 20% mineralizable N suggested by U.S. EPA for land application of anaerobically digested sewage sludge. Maximum plant N recoveries were 16% for sewage sludge and 27% for ammonium nitrate in 1995.
Net N immobilization from sewage sludge was found under controlled conditions for N rates of 45 to 180 kg ha-1 during the first crop cycle and for 45 kg N ha-1 in the second crop cycle. This was consistent with low fertilizer grain N uptake (1994), fertilizer grain+straw N uptake (1995) and soil profile inorganic N accumulation (following harvest in 1995).
REFERENCESBasta, N.T. 1995. Sewage sludge composition and transformations. p. 5-12. In N.T. Basta (ed.). Land
application of biosolids: A review of research concerning benefits, environmental impacts, and regulations of applying treated sewage sludge. B-808 Oklahoma Agricultural Experiment Station and Center for Agriculture and the Environment. Oklahoma State University, Stillwater, OK.
Bremner, J.M. 1965. Inorganic forms of nitrogen. In C.A. Black et al. (ed.) Methods of soil analysis, Part 2. Agronomy 9:1179-1237. Am. Soc. of Agron., Inc., Madison WI.

Page 50 1997 OSU Soil Fertility Research
Burau, R.G. 1982. Lead. p. 347-365. In A.L. Page et al. (ed.) Methods of soil analysis, Part 2. 2nd ed. Agron Monogr. 9. American Society of Agronomy and Soil Science Society of America, Madison, WI.
Chron, D.M., and D.A. Haith. 1994. A forest site nitrogen dynamics model for land application of sludge. Trans. ASAE 37:1135-1144.
Clapp, C.E., W.E. Larson and R.H. Dowdy. 1994. Crop yields, nutrient uptake, soil and water quality during 20 years on the Rosemount sewage sludge watershed. p. 137-148. In C.E. Clapp, W.E. Larson, and R.H. Dowdy (eds.) Sewage sludge: land utilization and the environment. SSSA Misc. Publication. ASA, CSSA, and SSSA, Madison, WI.
Douglas, B.F., and F.R. Magdoff. 1991. An evaluation of nitrogen mineralization indices for organic residues. J. Environ. Qual. 20:368-372.
Fox, R.H., and J.H. Axley. 1985. Criteria for land spreading of sludges in the northeast: Nitrogen release from sewage sludge. p. 38-39. In D.E. Baker, D.R. Bouldin, H.A. Elliot, and J.R. Miller (eds.) Criteria and recommendations for land application of sludges in the northeast. Peen. Agric. Exp. Stn. Res. Bull. No. 851, The Pensylvania State University, University Park, PA.
Hue, H.V. 1995. Sewage sludge. p. 199-247. In J.E. Rechcigl (ed.) Soil amendments and environmental quality. Lewis Publishers, New York, NY.
Ippolito, J.A., K.A. Barbarick, D.G. Westfall, R.H. Follet, and R. Jepson. 1994. Applications of anaerobically digested biosolids to dryland winter wheat. Colorado Agric Exp. St. TR92-6.
King, D.L., and H.D. Morris. 1972. Land disposal of liquid sewage sludge: III. The effect on soil nitrate. J. Environ. Qual. 1:442-446.
Lachat Instruments. 1989. Quickchem method 12-107-04-1-B. Lachat Instr., Milwaukee, WI.
Lachat Instruments. 1990. Quickchem method 12-107-04-1-B. Lachat Instr., Milwaukee, WI.
Larsen, K.E., and J. Petersen. 1993. Long-term field and lysimeter trials with annual applications of large amounts of heavy metal-containing sewage sludge. SP-Rapport 3:69 p.
Olson, R.V., L.S. Murphy, H. C. Moser, and C.W. Shallow. 1979. Fate of tagged fertilizer nitrogen applied to winter wheat. Soil Sci. Soc. Am. J. 43:973-995.
O’Riordan, E.G., V.A. Dodd, H. Tunney, and G.A. Fleming. 1987. The fertilizer nutrient value of an anaerobically digested sewage sludge under grassland field conditions. Irish Journal of Agricultural Research 26:199-211.
Raun, W.R., and G.V. Johnson. 1995. Soil-plant buffering of inorganic nitrogen in continuous winter wheat. Agron. J. 87:827-834.
SAS Institute. 1988. SAS/STAT User’s guide, Release 6.03 Edition. SAS Institute Inc., Cary NC, USA.
Schepers, J.S., D.D. Francis, and M.F. Thompson. 1989. Simultaneous determination of total C, total N and 15N on soil and plant material. Commun. Soil Sci. Plant Anal. 20:949-959.
Sims, J.T. 1990. Nitrogen mineralization and elemental availability in soils amended with cocomposted sewage sludge. J. Environ. Qual. 19:669-675.
Sims, J.T. 1995. Organic wastes as alternative nitrogen sources. p. 487-535. IN: P.E. Bacon (ed.) Nitrogen fertilization in the environment. Marcel Dekker, Inc. New York, NY.
Soltanpour, P.N., J. B. Jones, Jr., and S.M. Waskman. 1982. Optical Emission Spectroscopy. p. 29-65. In A.L. Page et al. (ed.) Methods of soil analysis, Part 2. 2nd ed. Agron Monogr. 9. American Society of Agronomy and Soil Science Society of America, Madison, WI.
Stanford, G., and S.J. Smith. 1972. Nitrogen mineralization potentials of soils. Soil Sci. Soc. Amer. Proc. 36:465-472.

OSU Soil Fertility Research 1997 Page 51
U.S. Environmental Protection Agency. 1983. Process design manual: Land application of municipal sludge. Municipal Environmental Research Laboratory, Cincinnati, OH. EPA-625/1-83-016.
U.S. Environmental Protection Agency. 1993. Standards for the use and disposal of sewage sludge. 40 CFR Parts 257, 403, and 503 (FRL-4203-3), Washington, D.C.
Table 1. Chemical Characteristics† of Soil (0-30 cm) Prior to Treatment Application and Elemental Analysis of Sewage Sludge.______________________________________________________________________________pH Organic C Total N NH4-N NO3-N K P CEC
--------g kg-1-------- -----------------mg kg-1---------------- cmol kg-1
6.4 11.9 1.1 7.0 5.0 25.3 30.2 13.05
Sewage sludge Total content Year pH N As Cd Cu Mo Ni Pb Se Zn
g kg-1 mg kg-1
1993 6.4 22 6.3 3.7 976 44.5 30.2 916 0.55 11151994 6.9 23 8.7 4.2 752 34.2 25.6 807 0.79 928______________________________________________________________________________† pH, 1:1 soil:deionized water and 1:2 sewage sludge:deionized water; K and P, Mehlich-3; CEC, 1 N NH4OAc pH 7.0.
Table 2. Treatment Application, Soil Sampling and Planting Dates, and Wheat Varieties and Rates.
Treatment application
Planting Varietyand seed rate
Harvest Soil samplingand depth (cm)
6 Oct. 93 7 Oct. 93 Karl,67 kg ha-1
8 June 94 11 Oct. 94, 0-30
13 Oct. 94 14 Oct. 94 Tonkawa,84 kg ha-1
15 June 95 21 June 95, 0-180
16 Aug. 95, 0-30

Page 52 1997 OSU Soil Fertility Research
Table 3. Treatment Means and Analysis of Variance for Soil Surface (0-30 cm) pH, Organic C and Total N, and Total Soil Profile (0-180 cm) Inorganic N Accumulation.________________________________________________________________________N rate N Soil Organic C Total N Profilekg ha-1 source† pH Inorganic N______________________________________________________________________________
--------g kg-1--------- kg ha-1
0 - 6.65 8.20 0.76 16345 SS 6.60 7.13 0.70 13490 SS 7.10 7.07 0.67 92180 SS 6.41 7.98 0.72 167270 SS 6.97 8.13 0.77 183540 SS 6.82 8.46 0.79 139540 SS+L 7.05 9.43 0.77 14945 AN 7.22 7.09 0.67 15490 AN 7.23 7.58 0.68 135180 AN 6.81 8.37 0.75 165270 AN 6.50 7.23 0.65 303540 AN 6.58 7.66 0.72 750540 AN+L 6.99 9.41 0.80 481SED‡ 0.47 0.90 0.06 46
df -------------Mean squares--------------Replication 2 0.97 5.19* 0.048** 31690**Treatment 12 0.24 1.94 0.007 824445** N rate linear (SS) 1 0.07 1.16 0.007 305 N rate quad (SS) 1 0.00 2.18 0.018 586 Lime effect (SS) 1 0.08 1.43 0.001 114 N rate linear (AN) 1 0.38 0.01 0.001 333960** N rate quad (AN) 1 0.56 0.05 0.004 201726** Lime effect (AN) 1 0.26 4.59 0.008 72665**Residual error 24 0.34 1.22 0.006 2139CV, % 8.48 13.83 10.30 20______________________________________________________________________________† SS, sewage sludge; AN, ammonium nitrate; L, lime applied in 1993. ‡ SED, standard error of the difference between two equally replicated means. *,** Significant at the 0.05 and 0.01 probability levels, respectively.

OSU Soil Fertility Research 1997 Page 53
Table 4. Treatment Means and Analysis of Variance for Grain and Straw Yields and N Uptake in Grain and Straw.______________________________________________________________________________
---------------------Grain -------------------- ------Straw-----Yield Yield N N Yield N
uptake uptake uptakeN rate N 1994 1995 1994 1995 1995 1995kg ha -1 source†
kg ha-1
0 - 422 510 9 14 1194 745 SS 527 571 11 16 2101 1290 SS 628 574 13 16 2270 14180 SS 886 569 19 17 2571 16270 SS 1038 611 24 19 2973 22540 SS 1505 1027 31 32 2712 21540 SS + L 1669 1052 38 32 3011 2345 AN 1782 621 39 17 1917 1390 AN 1739 906 38 28 2570 18180 AN 1921 1196 47 36 2361 28270 AN 2588 1419 68 44 3089 33540 AN 2337 1282 69 40 2759 40540 AN + L 2187 1326 62 41 3172 42
SED‡ 174 179 5 6 380 4
Source ofvariation df mean squares
Rep 2 168608* 15554 104 14 1889130** 205**Trt 12 1543352** 340561** 1309** 372** 919882** 349**N rate linear (SS) 1 2230908** 312102* 960** 419** 4730073** 431**N rate quad (SS) 1 151049 132748 56 144 859911* 6Lime effect (SS) 1 40628 954 76 0 134374 8N rate linear (AN) 1 6355922** 1838633** 6634** 2090** 5308459** 2299**N rate quad (AN) 1 971096** 79124 120 71 880753* 1Lime effect (AN) 1 33810 2865 66 2 256587 12Residual error 24 45554 47833 37 46 216160 27CV, % 14 24 17 25 18 24______________________________________________________________________________† SS, sewage sludge; AN, ammonium nitrate; L, lime applied in 1993. ‡ SED, standard error of the difference between two equally replicated means. *,** Significant at the 0.05 and 0.01 probability levels, respectively.

Page 54 1997 OSU Soil Fertility Research
Table 5. Linear and Linear-Plateau Models for Grain Yield (Y) on N Rate as Sewage Sludge and Ammonium Nitrate, and Estimated Joints for N Rate (kg ha -1), Respectively, Stillwater, OK, 1994-1995.______________________________________________________________________Year N source Equation Joint, r2
N rate____________________________________________________________________________1994 AN Y=929.461+6.811(N rate), if N rate < 225
Y = 2462, if N rate > 225 225 0.67
SS Y = 454.609 + 2.015 (N rate) - 0.95
1995 AN Y = 495.836 + 3.965 (N rate), if N rate < 216Y = 1352, if N rate > 216 216 0.81
SS Y = 476.053 + 0.893 (N rate) - 0.49____________________________________________________________________________AN, ammonium nitrate; SS, sewage sludge.
Table 6. Estimates of Potentially Mineralizable N (No) as Affected by Time (0 to 22 weeks), N Rate and Cropping Sequence.______________________________________________________________________________Origin Cropping N rate§ Sewage N available No¶ b1# r2
of soil† sequence‡ sludge from SS______________________________________________________________________________
kg ha-1 kg ha-1 kg ha-1
Check 93 year 1 0 - 441 ± 35 0.106 ± 0.018 0.97Check 93 45 1993 -25 416 ± 35 0.120 ± 0.023 0.95Check 93 180 1993 0 441 ± 24 0.123 ± 0.010 0.98Check 93 540 1993 63 504 ± 27 0.144 ± 0.020 0.97Check 94 year 2 0 - 288 ± 15 0.145 ± 0.019 0.97Check 94 45 1994 -2 286 ± 15 0.165 ± 0.043 0.96Check 94 180 1994 48 336 ± 17 0.155 ± 0.021 0.97Check 94 540 1994 133 421 ± 19 0.173 ± 0.021 0.9745 SS, 94 year 2r 45 - -36 252 ± 15 0.130 ± 0.019 0.97180 SS, 94 180 - 1 289 ± 15 0.139 ± 0.018 0.97540 SS, 94 540 - 30 318 ± 23 0.139 ± 0.025 0.9545 SS, 94 45 1994 36 288 ± 23 0.140 ± 0.028 0.93180 SS, 94 180 1994 45 334 ± 17 0.151 ± 0.020 0.97540 SS, 94 540 1994 129 447 ± 25 0.177 ± 0.027 0.95______________________________________________________________________________† From field study, before planting.‡ year 1, native bermudagrass sod without fertilization and tilled for the first time; year 2, native bermudagrass sod that had been tilled and cropped to wheat without fertilization for 1 yr; year 2r, native bermudagrass sod that had been tilled and cropped to wheat applied with sewage sludge for 1 yr. § Rates for a soil furrow slice of 15 cm depth, so N available and No is expressed in kg N ha-1 for the 0-15 cm soil layer. ¶ Mineralizable N = No(1-eb1*week) and associated 95% confidence interval. # Slope and 95% confidence interval.

OSU Soil Fertility Research 1997 Page 55
Table 7. Treatment Means and Analysis of Variance for Fertilizer N Uptake in Grain (1994) and Grain+Straw (1995).______________________________________________________________________________
Available N† Fertilizer1993- 1994- Grain Grain+straw1994 1995 N uptake N uptake
1994 1995______________________________________________________________________________N rate N source‡kg N ha-1 ----------------------------- kg ha-1 ----------------------------
45 SS -25 0 2 790 SS 3 9180 SS 0 46 9 12270 SS 15 20540 SS 63 159 21 32540 SS + L 28 3445 AN 29 890 AN 29 24180 AN 38 43270 AN 59 55540 AN 59 58540 AN + L 53 62
SED§ 5 8
Source ofvariation dfReplication 2 66 20Treatment 11 1220** 1263**N rate linear (SS) 1 738** 1095**N rate quad (SS) 1 23 140Lime effect (SS) 1 76 9N rate linear (AN) 1 2421** 5214**N rate quad (AN) 1 42 220Lime effect (AN) 1 66 24Residual error 22 40 98______________________________________________________________________________† Potentially available N from incubation study. ‡ SS, sewage sludge; AN, ammonium nitrate; L, lime applied in 1993. § SED, standard error of the difference between two equally replicated means. **,* Significant at the 0.01 and 0.05 probability levels, respectively.

Page 56 1997 OSU Soil Fertility Research
Table 8. Treatment structure and grain yield means, 1994-1997, Stillwater, OK. ______________________________________________________________________________
Treatment N rate N Source 1994 1995 1996 1997 Average kg/ha ------------------------- bu/ac -------------------------- 1 0 - 6.89 7.42 9.11 16.77 10.042 0 - 5.61 7.73 8.55 19.14 10.263 40 SS 7.84 8.49 10.81 23.17 12.584 80 SS 9.17 8.53 9.76 22.53 12.505 160 SS 13.17 8.45 18.35 20.81 15.196 240 SS 15.42 9.08 13.66 20.66 14.707 480 SS 22.37 15.26 12.22 21.68 17.888 40 AN 26.49 9.22 5.03 20.35 15.289 80 AN 25.85 13.46 7.61 26.22 18.2810 160 AN 28.56 17.78 9.89 32.37 22.1511 240 AN 38.48 21.10 7.96 34.95 25.6212 480 AN 34.75 19.06 8.27 38.02 25.0913 480 SS+L 24.82 15.64 13.09 24.24 19.4414 480 AN+L 32.52 19.71 11.62 42.27 26.53
SED 2.62 2.55 2.93 4.74CV 15 24 34 22______________________________________________________________________________L - lime applied at a rate of 8960 kg/ha (4 tons/acre) in the first year of the study, incorporated preplant.
Figure 1. Soil Profile Inorganic N Accumulation as Affected by N Applied as Sewage Sludge or Ammonium Nitrate Following Two Years of Winter Wheat Production (L, lime).
0 50 100 150 200 2500
30
60
90
120
150
180
0
45
90
180
270
540
540+L
Inorganic N, kg ha-1
Dep t
h , c
m
N rate, kg ha-1
0 50 100 150 200 2500
30
60
90
120
150
180
Inorganic N, kg ha-1
Dept
h, c
m
N as Sewage Sludge
SED = 26.6 kg ha-1
N as Ammonium Nitrate
SED = 26.6 kg ha-1
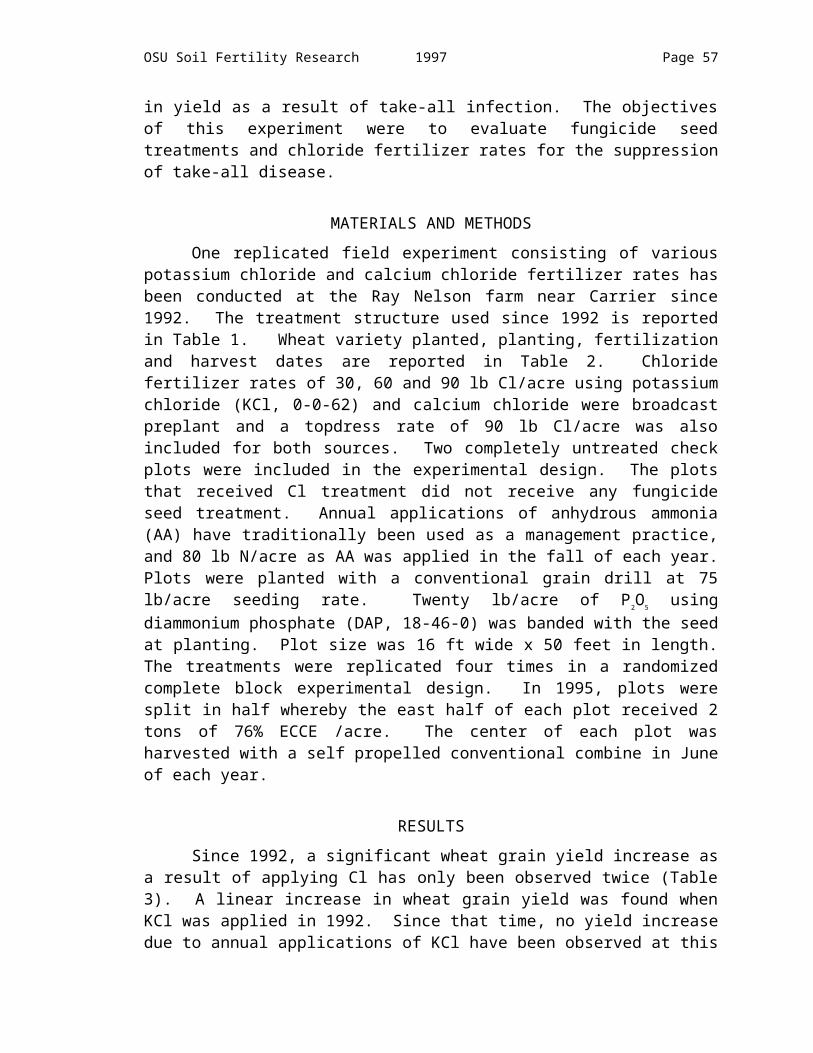
OSU Soil Fertility Research 1997 Page 57

Page 58 1997 OSU Soil Fertility Research
NITROGEN USE EFFICIENCY
Winter Wheat Nitrogen Use Efficiency in Grain and Forage Production Systems
W.E. Thomason, W.R. Raun, G.V. Johnson, S.B. Phillips and R.L. Westerman
ABSTRACTNitrogen use efficiency (NUE) is known to be less than fifty percent in winter wheat production systems. This study was conducted to determine potential differences in NUE when winter wheat (Triticum aestivum L.) is grown strictly for forage or grain. The effects of different nitrogen rates on plant N concentrations at different growth stages and on grain at harvest were investigated in two existing long-term winter wheat experiments near Stillwater, (experiment 222) and Lahoma (experiment 502), Oklahoma. Grain and forage yields for the 1996 harvest were low, due to a dry fall and winter. Harvest data for the 1997 crop year is not yet available, but the potential for high yields exists. Nitrogen content decreased as the plants aged over the season. Nitrogen use efficiencies were much greater for the forage-only systems at both sites when compared to grain-only. The two forage harvests employed here (March and May) were both prior to flowering, and prior to the time when gaseous plant N losses are greatest (flowering to maturity). By harvesting the plant for forage before grain fill, potential gaseous plant N losses were avoided, thus increasing NUE. At both locations, grain-only production systems had estimated NUE's less than 50 percent. With forage-only production systems, NUE's were much greater, exceeding 80% at Lahoma.
INTRODUCTION
itrogen use efficiency (NUE) is an important topic when discussing fertilizer applications and plant growth. Nitrogen use efficiency is defined as production per unit of N available in the soil. This is represented by the amount of grain or
forage produced divided by the amount of N supplied to the plant by the soil. The two components of NUE are efficiency of uptake and efficiency of N utilization to produce grain or forage (Moll et al., 1982). Nitrogen use efficiency depends on the nitrification rate of the soil, the form of N applied and the growth stage of the plant. Farmers must apply N at the ideal time and use the fertilization method which will optimize efficiency. Environmentally, it is important to know how much fertilizer is used by the plant and how much is lost. Scientifically, it is important to understand the plant processes and storage methods for N and other nutrients.
N
In the south-central United States, producers often use winter wheat (Triticum aestivum L.) as a forage crop for cattle, as well as grain. Research indicates that forage

OSU Soil Fertility Research 1997 Page 59
production systems are more efficient users of N than grain production systems. Many research sources are available when discussing NUE in either forage or grain production systems, but there is little information comparing forage-only versus grain-only production systems for the same crop.
Nitrogen is essential for plant growth and is known to be present in proteins, nucleic acids and chlorophyll. Nitrogen is the nutrient most susceptible to loss and recovery of N is usually less than half of that applied (Boswell et al., 1985). Whitehead (1995) found that N concentration tends to decrease as plants age, mostly due to the increase in cell wall material and decrease in cytoplasm. Similar studies by Harper et al. (1987) noted decreased N concentrations in winter wheat with time during the growing season.
Nitrogen is assimilated by plant roots mostly as ammonium and nitrate. Adequate N nutrition is required for full development of tillers and leaves and also enables the plant to operate at peak photosynthetic capacity. Nitrogen use efficiency varies with the growth stage of the plant (Wuest and Cassman, 1992) Gaseous plant N loss has been found to be significant from flowering to physiological maturity (Harper et al., 1987). Recent work has found that the total N content of the grain and straw components is not equal to total N content of plants at flowering. Fertilizer use efficiency, as reflected in grain yield of winter wheat, has also been shown to change with time and rate of application (Ellen and Spiertz, 1980). Increased N rates have resulted in increased N concentrations in leaves of tall fescue and switchgrass (Staley et al., 1991). Grain yield and N content of cereal grain crops increase significantly with applied N (Simonis, 1987).
Much of the loss of N fertilizer efficiency is due to the loss of N to the atmosphere at senescence (Harper et al., 1987). At flowering, N is translocated to the grain and movement at this stage of development causes gaseous N losses to increase and efficiency to decrease (Harper et al., 1987).
Research has indicated that NUE decreases at grain fill in cereals, mostly due to gaseous N loss (Bruno et al., 1987). In the south-central United States, winter wheat is often produced for grain and forage. Little research exists that compares NUE of forage and grain production in a crop, like winter wheat, that can be used for both. The objective of this experiment is to document potential differences in NUE when winter wheat is grown strictly for forage or for grain.
MATERIALS AND METHODS
Experimental sites were selected as sub-plots in two existing long term winter wheat experiments near Stillwater (experiment 222) and Lahoma (experiment 502), Oklahoma where N rates have been applied annually since 1969 and 1970, respectively. Initial soil test characteristics and soil classification are reported in Table 1. Nitrogen rates at Stillwater were 0, 44, 90, and 134 kg N /ha. Nitrogen rates at Lahoma were 0, 22, 45, 67, 90, and 112 kg N /ha. Ammonium nitrate was the N source applied broadcast and incorporated preplant at both sites. In 1995-96 forage sub-plots (1.83 x 1.14 m) were hand harvested at Feekes growth stages six (mid-March) and ten (May) (Large, 1954). Grain yield sub-plots, adjacent to forage sub-plots, were harvested with a combine from a 2.0 x 1.83 m area. In 1996-97 sub-plot sizes were 1.33 x 2.13 m with

Page 60 1997 OSU Soil Fertility Research
the outside 2 rows and 25 cm removed from each end of the plot to negate border effects, giving an actual harvest area of 0.95 x 1.52 m. Forage harvests were taken by hand at Feekes growth stages 4, 7, and 10. Grain was harvested by combine from an area 2.0 x 1.83 m from a paired plot next to the forage area. Forage and grain samples were dried and ground to pass a 140 mesh sieve (100 um) and analyzed for total N content using a Carlo-Erba NA 1500 automated dry combustion analyzer (Schepers et al., 1989).
RESULTS
Analysis of variance and associated means for total forage yield and N uptake, and grain yield and grain N uptake are reported in Tables 2 and 3 for Stillwater and Lahoma, respectively. A significant grain yield and grain N uptake response to N fertilization was found for the grain production system at both sites. Similarly, forage, and forage N uptake responded to applied N at both sites, for the forage-only production system. It was interesting to note that the dry matter production levels were nearly double for forage-only when compared to the grain production system at both sites. Although less pronounced, forage N uptake or removal was nearly double in the forage-only system when compared to grain-only at both locations (Tables 2 and 3).
As a result of increased dry matter production and N removal, N use efficiencies were much greater for the forage-only systems at both sites when compared to grain-only (Tables 4 and 5). Gaseous plant N losses are known to be greatest between flowering and maturity. The two forage harvests employed here (March and May) were both prior to flowering. Regrowth including secondary tillers, following the first March harvest did produce plants with heads by May, however, flowering was not achieved. Only limited growth was observed in the forage-only plots following the May harvest. By harvesting the plant for forage before grain fill, potential losses were avoided, thus increasing NUE. At both locations, grain-only production systems had estimated NUE's less than 50 percent. With forage-only production systems, NUE's were much greater, exceeding 80% at Lahoma.
REFERENCESBoswell, F.C., J.J. Meisinger, and N.L. Case. 1985. Production, marketing , and use of nitrogen fertilizers.
In Fertilizer Technology and Use. pp. 229-292. 3rd ed. SSSA Madison, WI.
Bruno, M., R. Sylvie, and J.Machet. 1987. A comprehensive approach to the fertilizer part of plant nitrogen uptake. In D.S. Jenkinson and K.A. Smith (ed). Nitrogen Efficiency in Agricultural Soils. pp. 85-94. Elsevier Science. 1987
Ellen, J., and J.H.J. Spiertz. 1980. Effects of rate and timing of nitrogen dressings on grain yield formation of winter wheat. Fert. Res. 1:177-190.
Harper, L.A., R.R. Sharpe, G.W. Langdale, and J.E. Evans. 1987. Nitrogen cycling in a wheat crop: soil, plant, and aerial nitrogen transport. Agron. J. 79:965-973.
Large, E.C. 1954. Growth stages in cereals. Plant Pathol. 3:128-129.
Moll, R.H., E.J. Kambrath, and W.A. Jackson. 1982. Analysis and interpretation of factors which contribute to efficiency of nitrogen utilization. Agron. J. 74:562-564.

OSU Soil Fertility Research 1997 Page 61
Schepers, J.S., D.D. Francis, and M.T. Thompson. 1989. Simultaneous determination of total C total N and 15N on soil and plant material. Commun. in Soil Sci. Plant Anal. 20(9&10):949-959.
Simonis, A.D. 1987. Studies on nitrogen use efficiency in cereals. In D.S. Jenkinson and K.A. Smith (ed.) Nitrogen Efficiency in Agricultural Soils. pp.110-124 . Elsevier Science. 1987
Staley, T.E., W.L. Stout, and G.A Jung. 1991. Nitrogen use by tall fescue and switchgrass on acidic soils of varying water holding capacity. Agron. J. 83:732-738.
Whitehead, D.F. 1995. Grasses uptake of nitrogen and effects on morphology and physiology. pp.16. In Grassland Nitrogen. CAB Intl. Publishers, Wallingford UK. 1995.
Wuest, S.B., and K.G. Cassman. 1992. Fertilizer-nitrogen use efficiency of irrigated wheat: I. uptake efficiency of preplant versus late-season application. Agron. J. 84:682-688.

Page 62 1997 OSU Soil Fertility Research
Table 1. Soil chemical characteristics and classification at Stillwater and Lahoma, OK.
Location pHa NH4-N NO3-N Pb Kb Total Nc Organic Cc
--------------mg kg-1--------------- ------mg g-1-----Stillwater 5.7 4.64 2.3 33 159 .09 1.06Classification: Kirkland silt loam (fine-mixed, thermic Udertic Paleustoll)
Lahoma 5.6 5.6 4.0 77 467 .09 1.1Classification: Grant silt loam (fine-silty, mixed, thermic Udic Argiustoll)apH: 1:1 soil:water, bP and K: Meilich III, cOrganic C and total N: dry combustion
Table 2. Analysis of variance and means for total forage yield (sum of harvests in March and May) and N uptake, Stillwater, OK, 1996_______________________________________________________________________
-----------Forage---------- -----------Grain-----------Yield N uptake Yield N uptake
Source of variation df ---------------------------mean squares--------------------------Replication 3 0.690 164 0.037 38N rate 3 1.956* 1995* 0.329* 628*Residual error 9 0.612 396 0.059 108SED 0.553 14.0 0.171 7.3
N rate, kg ha-1 Mg ha-1 kg ha-1 Mg ha-1 kg ha-1
0 2.719 49.58 1.007 28.9544 2.841 59.01 1.274 35.6190 3.553 83.12 1.382 48.49134 4.228 98.52 1.701 56.79_______________________________________________________________________* Significant at the 0.05 probability level.
Table 3. Analysis of variance and means for total forage yield (sum of harvests in March and May) and N uptake, Lahoma, OK, 1996________________________________________________________________
------------Forage----------- -----------Grain------------Yield N uptake Yield N uptake
Source of variation df ---------------------------mean squares--------------------------Replication 3 1.300 1394 0.912* 633*N rate 5 3.197* 4844* 0.695* 1094*Residual error 13 0.520 568 0.184 128SED 0.509 16.8 0.303 8.0
N rate, kg ha-1 Mg ha-1 kg ha-1 Mg ha-1 kg ha-1
0 2.89 57.98 1.40 33.2222 3.61 75.90 2.17 52.6545 3.49 87.32 2.18 57.8767 4.29 113.32 2.19 62.0990 5.24 149.90 2.55 74.37112 4.91 133.93 2.53 80.07______________________________________________________________________________

OSU Soil Fertility Research 1997 Page 63
Table 4. Analysis of variance for N use efficiency over system of production (grain only versus forage only) Lahoma, OK, 1996.__________________________________________Source of Variation df Mean Squares Replication 3 3383N Rate 4 351Rep x N Rate 12 1286System 1 21484**N Rate x System 4 461Residual Error 15 194
N Rate Forage Grain
22 80 4445 95 3667 80 3190 102 37112 68 34
SED 9.8____________________________________________________
Table 5. Analysis of variance for N use efficiency over system of production (grain only versus forage only) Stillwater, OK, 1996.______________________________________________Source of Variation df Mean Squares Replication 3 192N Rate 2 332Rep x N Rate 6 369System 1 938*N Rate x System 2 59Residual Error 9 192
N Rate Forage Grain
45 21 1590 37 22134 36 21
SED 9.7_________________________________________________________

Page 64 1997 OSU Soil Fertility Research
Bermudagrass Forage Yield Response to High Rates of Applied Urea and Ammonium Nitrate
S.L. Taylor, W.R. Raun, G.V. Johnson, J.L. Rogers, W. Altom, S.B. Phillips and C.M. Taliaferro
ABSTRACTExtensive research has not been performed to study the effect of high rates (up to 1344 kg N ha-1) of applied N on bermudagrass forage production and total N, and nitrate content. Two field studies were initiated to evaluate the effects of rate, timing, and source of N on bermudagrass forage production, total N, nitrate concentration, and fertilizer recovery. Nitrogen was applied at rates of 112, 224, 448, 672 and 1344 kg N ha-1 using ammonium nitrate (AN) and urea (UR), applied in early-spring (March) and late-summer (August). Forage yields were maximized at 1344 kg N ha-1 applied in early-spring as AN, and total production from four harvests exceeded 19 Mg ha-1 (8 ton/acre). Early-spring applied N tended to result in higher yields, nitrogen removal, and percent fertilizer recovery as compared to late-summer applied N. Ammonia volatilization from UR was expected, and N recovery was highest for AN fertilizer, especially when N was applied in late-summer. Although estimated fertilizer recovery levels were greatest at the lowest N rates (112 and 224 kg N ha-1 in the early-spring and late-summer, respectively) forage production and N removal were doubled when applying much higher N rates (>672 kg N ha-1) at the N responsive Ardmore site. Nitrate concentration in the forage was significant only immediately following fertilization, with nitrate concentration increasing with N rate. Even under the high N fertilization rates evaluated, forage nitrate levels never approached toxic levels for animal consumption.
INTRODUCTION
Bermudagrass has generally been used as a source of roughage since forage protein levels are known to be low. This work was initiated to better evaluate the effects of high N rates on bermudagrass forage yield, protein and nitrate concentrations. High rates of applied N (> 600 kg N ha-1) have not been thoroughly evaluated in bermudagrass forage production systems. Mathias et al. (1978) found that bermudagrass yields and N concentration increased while percent recovery decreased with increasing N up to 448 kg N ha-1. Morris and Celecia (1962) found increased N removal in bermudagrass when N was applied in the spring compared to fall application. Prine and Burton (1956) found that increasing the annual N rate from 0 to 1008 kg N ha-1 increased yield and percent protein, but decreased N recovery. Mathias et al. (1973) found increasing dry matter yield with increasing N rate up to 672 kg ha-1 yr-1, but percent N recovery was highest at 224 kg N ha-1. Fisher and Caldwell (1959) found that Coastal bermudagrass produced 0.6 Mg ha-1 and 8% protein with no fertilization and 2.9 Mg ha -1 and 13% protein at an N rate of 1120 kg ha-1. Hanson et al. (1978) concluded that increasing applied N on perennial

OSU Soil Fertility Research 1997 Page 65
grasses resulted in increased fertilizer N recovery at rates up to 448 kg N ha -1 for all times of application (split compared to early-spring) and that a split application resulted in the highest percent recovery. Work by Staley et al. (1991) on tall fescue and switchgrass noted that increasing applied N increased N concentration and they also reported 47% fertilizer N recovery at a 180 kg ha-1 N rate. Power (1980) reported that the amount of fertilizer N in plant tops, roots and soil inorganic N was linearly correlated with the amount of fertilizer N applied. Bermudagrass forage yields and total N were positively correlated with increased N applied, up to 224 kg N ha -1, and the highest N concentration occurred with the highest yields, indicating that N removal was not diluted at high yields (Wiedenfeld, 1988). Work by Burton et al. (1963) found that increased N rates up to 1008 kg ha-1 significantly increased total dry matter production up to 15.2 Mg ha-1 and 18.5% crude protein. In a rye-wheat-ryegrass forage production system, nitrogen use efficiency was >60% for all rates of N up to 224 kg ha -1 (Altom et al., 1996). Eichhorn (1989) found that maximized forage yields occurred at 448 kg N ha-1
while N removal and crude protein concentration continued to increase at N rates up to 672 kg N ha-1. Percent fertilizer recovery decreased as N rates increased from 224 to 672 kg N ha-1.
The major factors that affect nitrate accumulation in forages were investigated by Crawford et al. (1961). Stage of growth, level of N fertilization, plant part and light intensity all influenced nitrate-N concentration. Factors that did not affect nitrate-N concentration were variety, time, source and placement of N fertilizer. Hojjati et al. (1972) concluded that high nitrates in bermudagrass forage occurred only with high total N content, but high total N did not always result in high nitrate content. Although increasing N fertilizer rates increased nitrate concentration in the tissue, N rates as high as 2240 kg N ha-1 did not result in bermudagrass forage nitrate accumulation levels that would be toxic to animals (Worker and Peterson, 1962). Murphy and Smith (1967) found that increased nitrate-N concentration in sudangrass above the toxic level (0.7%) was a direct result of increased N fertilization up to 896 kg N ha-1, while advancing plant maturity was indirectly related. Accumulation of nitrate-N in forage crops was directly related to N rate and decreased with advancing plant maturity (Murphy and Smith, 1967). Work by Lovelace et al. (1968) indicated that nitrate accumulation in ‘NK-37’ was twice that of Coastal bermudagrass and that soil texture had a greater influence on tissue nitrate levels than did fertilizer nitrogen rates. Wright and Davison (1964) indicated that forages with over 0.34 to 0.45% nitrate-N are considered toxic to cattle, and when fed, should be mixed with safer feeds lower in nitrate-N.
In an Oklahoma study, bermudagrass yields and N removal were generally lower for urea compared to urea-ammonium-nitrate (UAN), while N use efficiency was higher for UAN than urea (Westerman et al., 1983). Brejda et al. (1995) concluded from a comparison of urea, ammonium nitrate and ammonium sulfate that forage yield and percent protein was greater for ammonium nitrate as compared to other sources and that each resulted in a linear increase in yield with N rate up to 235 kg N ha -1. Nitrogen rate had a greater influence on dry matter production than did N source. Anderson and Kunkel (1983) found that bermudagrass fertilized with urea compared to ammonium nitrate and urea-ammonium nitrate resulted in higher yields, with no differences in N removal. Nitrogen recovery and bermudagrass forage yield were less for liquid fertilizer as compared to solid ammonium nitrate (Walker et al., 1979).

Page 66 1997 OSU Soil Fertility Research
The objectives of this study were to evaluate the effects of application timing and N source on bermudagrass forage production and N use efficiency, and to determine the seasonal relationship between total forage N and tissue nitrate.
MATERIALS AND METHODS
Two field experiments were established at Ardmore and Burneyville OK. Both sites were established ‘Midland’ bermudagrass pastures. Initial soil test characteristics and soil classification are reported in Table 1. A randomized complete block experimental design with three replications was used at both locations. Plots were 4.8 m x 7.6 m at Ardmore and 2.4 m x 7.6 m at Burneyville. Nitrogen treatments were applied as either ammonium nitrate (AN) or urea (UR) in August (late-summer cycle) or March (early-spring cycle). Nitrogen rates for the late-summer cycle were 224, 448, 672 and 1344 kg N ha-1, while early-spring cycle rates were 112, 672 and 1344 kg N ha-1. Nitrogen treatments applied in late-summer and early-spring were analyzed independently. Therefore, the late-summer cycle represented all harvests after N fertilization in August but prior to the August fertilization for the following year. Early-spring cycles included all harvests after March fertilization but prior to March fertilization the following year. Since interest was in the total cycle production and total N removal, analysis of variance was performed on the sum of late-summer and/or early-spring harvests, by year. There were two complete cycles for each location and each cycle (late-summer and early-spring) with the exception of the late-summer cycle for Ardmore, which had a total of three complete cycles. Single-degree-of-freedom non-orthogonal contrasts were used to determine treatment differences. Fertilization dates are reported in Table 2. Phosphorus and potassium were broadcast applied to the entire experimental area (both locations) at 48.9 kg P ha-1 as triple superphosphate and 186 kg K ha-1 as potassium chloride in early March 1993, late May 1995 and again in late May of 1996. In order to eliminate the effects of low soil pH, lime was applied at a rate of 6.7 Mg ha-1 in late May 1995 to each location. ‘Weedmaster’ [2, 4-D (dimethylamine salt) + dicamba 3, 6-(dichloro)-2-(methoxybenzioc acid)] 48.1% active ingredient was applied to all plots at a rate of 0.47 liters ha-1, in early March of each year.
Forage yield was collected throughout the growing season and harvest dates are reported in Table 2 for each location. Forage yield was determined by harvesting a 0.96 m x 7.6 m area from each plot using a self propelled John Deere 256 rotary mower at a height of 0.1 m. Plot weights were recorded and sub-sampled for moisture and chemical analysis. Sub-samples were dried for 120 hr in a forced-air oven at 70 oC and ground to pass a 100 mesh screen. Total N was determined on all forage samples using dry combustion (Schepers et al., 1989). Forage nitrate was determined by extracting 0.2 g forage samples with 20 ml of 0.01 M CaSO4, shaken for 30 minutes, filtered, and analyzed by Cd reduction using an automated flow injection analysis system (Lachat, 1989). Nitrogen removal was estimated by multiplying total N analysis and dry forage biomass. The difference method was used to estimate fertilizer recovery, by year using total production (N removal in check plot subtracted from N removal in fertilized plots and divided by the rate applied).

OSU Soil Fertility Research 1997 Page 67
RESULTS AND DISCUSSION
Results of analysis of variance and single-degree-of-freedom-contrasts by cycle for total forage yield, N removal and fertilizer recovery are reported in Tables 3-6. A significant linear and/or quadratic response to applied N was observed for forage yield and N removal in the late-summer and early-spring cycles for both N sources at both locations.
Ardmore (late-summer) Total forage yield was maximized at the 672 kg N ha -1 rate for AN, however,
yields continued to increase at the high N rate (1344 kg N ha-1) when UR was applied (late-summer, 1993-1994, Table 3). Forage N removal continued to increase at the high N rates for both N sources (Table 3). For the late-summer cycle of 1994-1995 and 1995-1996, forage yields peaked at the 448 kg N ha-1 rate for both AN and UR, while increases in N removal continued to take place at the 672 kg N ha-1 rate (Table 3). Continued N removal at N rates in excess of that required for maximum yield was consistent with work in wheat by Wuest and Cassman (1992), and Rasmussen and Rohde (1991). Similar to previous work by Westerman et al. (1983) and Brejdi et al. (1995), AN produced significantly higher yields and N removal when applied in late-summer as compared to UR (AN vs UR over N rate contrast). Increased production from AN could possibly be attributed to the immediate availability of NO3 and NH4 as compared to UR. Also, ammonia volatilization from urea was expected to be significant considering the daily high temperatures (38.3 and 31.0oC in 1993-1994 and 1994-1995, respectively), at the time of application, lack of incorporation and presence of surface residues high in urease. At this site no rainfall was received until ten days after fertilizers were applied in all three years. In the ten days following fertilization, average surface air temperatures were 30.7, 26.7, and 26.8oC in 1993-1994, 1994-1995, and 1995-1996, respectively, which enhanced the potential for ammonia volatilization as shown by Ernst and Massey, (1960). Total production levels were lower for the 1994-1995 periods when compared to 1993-1994 (Tables 3 or 4) which was largely due to decreased rainfall (551mm vs 937mm, respectively). The low production in 1995-1996 was due to drought conditions during the months of June and July, which cut the total number of harvest per cycle to only three compared to four and five in 1993-1994 and 1994-1995 respectively (Table 2). However, forage yield and N removed for AN continued to be significantly greater than UR for all three cycles (AN vs UR over N rates, Table 3).
Ardmore (early-spring) Total early-spring forage production was maximized (19.8 Mg ha -1) at the
highest N rate in 1994 (Table 4). Total N removed exceeded 600 kg N ha -1 for this same year. Some tissue salt-burn was observed in the high N rate plots soon after fertilization that delayed N response. Unlike data from late-summer applied production cycles, no differences were found in forage yield between N sources (Tables 3 and 4). However, N removal was significantly higher for AN when compared to UR in both 1994 and 1995 (Table 4). The lack of differences between N sources in total forage production suggests that ammonia volatilization losses from UR were not a factor for early-spring applied N. However, N removal was significantly higher for AN compared to UR at the high N rate

Page 68 1997 OSU Soil Fertility Research
in both years (Table 4). It is possible that immediate availability and preferential assimilation of nitrate by bermudagrass from AN could have increased N removal when compared to UR. Alternatively, biuret toxicities from UR may have decreased growth and thus, N removal.
Burneyville (late-summer) Only two complete cycles of late-summer applied N data was obtained at this site.
A significant response to applied N was observed for forage yield and N removed from both N sources (Table 5). Total forage yield was maximized at the 448 kg N ha -1 rate for AN when N was applied in late-summer 1994-1995 at this site (Table 5). However, yields continued to increase at higher N rates for urea. Similar to results at Ardmore, forage N removal showed slight increases at N rates in excess of that required for maximum yields (Table 5). It was important to note that forage yields were high for the first harvest following fertilization and all subsequent harvests were roughly half that obtained in late-September of 1994. Total N removed at this site was much less than that removed at Ardmore in the same year (1994-95, Tables 3 and 5) and under similar climatic conditions. Differing results were in part due to one less harvest obtained at Burneyville over the same time period. Unlike late-summer cycle results at Ardmore, 1994-1995, no significant differences were observed between AN and UR sources. This could be due to rainfall (.25 mm) received at Burneyville soon after fertilization (within 8 hours). The second late-summer cycle resulted in lower yields (half that obtained in the 1994-1995) with no yield to response to applied N, but a significant linear response for N removal (Table 5). No differences were detected when comparing the different N sources.
Burneyville (early-spring) In both 1994 and 1995, applied N increased forage yield and N removed for both
N sources (Table 6). In general, yields peaked at the low N rate (112 kg N ha-1) while significant increases in N removed were noted at the higher 672 kg N ha -1 rate (both 1994 and 1995). Similar to results from early-spring applied N at Ardmore, no differences were found between N sources for total forage yield or N removed in either 1994 or 1995. Unlike Ardmore, the yield increases relative to the check (no N applied) were generally small at this site (2-4 Mg ha-1). Organic carbon and total N in the surface 0-15 cm were roughly two times greater at Burneyville compared to Ardmore (Table 1). Because of this, less response to applied N was expected at this site. Using OSU soil test recommendations, P and K were roughly 80% sufficient at Burneyville and 100% at Ardmore (Table 1). Because of this, preplant P and K fertilization rates may not have been adequate at Burneyville, which could be reflected in the lower production levels. However, the check plot yields at Ardmore were less than half that found at Burneyville for both late-summer and early-spring cycles. Because yield levels at Burneyville never approached that found at Ardmore (very similar climatic conditions), some other nutrient or growth factor may have been controlling response.
Fertilizer Recovery Fertilizer recoveries were generally higher for AN compared to UR over N rates
at both locations and cycles, although this was only consistently seen at N rates < 224 kg

OSU Soil Fertility Research 1997 Page 69
N ha-1 (Tables 3-6). Fertilizer recoveries decreased with increased N rates for all cycles, application times, sources and years. Higher percent fertilizer recovery for AN as compared to UR was observed for all late-summer and early-spring cycles at both locations excluding the early-spring cycle at Ardmore, 1995 and late-summer cycle at Burneyville, 1995-1996. Estimated fertilizer recovery exceeded 85% for AN applied at 112 kg N ha-1 in early-spring at both locations in 1994 and 1995 (Tables 4 and 6). At N rates > 112 kg N ha-1 fertilizer recovery decreased dramatically in early-spring cycles (Tables 4 and 6). Unfortunately, the 112 kg N ha-1 rate was not included in the late-summer cycles thus, restricting comparisons at this rate. Although estimated fertilizer recovery levels were greatest at the lowest N rates (112 and 224 kg N ha-1 in the early-spring and late-summer, respectively) forage production and N removal were doubled when applying much higher N rates (>672 kg N ha-1) at the N responsive Ardmore site. Fertilizer N uptake increased with increasing N applied in all post fertilization harvests (especially the final harvest 345 days after the late-summer fertilization, Figure 1). This could indicate that substantial immobilization had taken place soon after fertilization. This is plausible since over 142, 225, 276, and 361 kg N ha -1 was available from the 224, 448, 672, and 1344 kg N ha-1 rates, respectively, in the four harvests after fertilization. The first harvest was 35 days after fertilizers were applied. Assuming that the balance was leached, 37, 50, 59, and 74% of the total N applied would have been lost via this process at the 224, 448, 672 and 1344 kg N ha-1 rates, respectively. By the fourth harvest (following 347 days where N could have been potentially leached) fertilizer N removed was near 10% of the total N applied for all rates (Table 7).
Bermudagrass Forage Nitrate-NBermudagrass tissue nitrate increased significantly as a result of applying N
(Figure 1). However, this was only observed immediately following fertilization. Increased availability of nitrate from AN resulted in an increase in tissue nitrate for all cycles at Ardmore as compared to UR. At the Burneyville site the higher N rates resulted in higher nitrate levels for UR compared to AN treatments, similar with N removal and fertilizer recovery. At all fertilization rates, sources and dates, forage nitrate levels were not found to be toxic (<0.7%) for cattle consumption (Worker and Peterson, 1962, Murphy and Smith, 1967 and Wright and Davison, 1964).
CONCLUSIONS
Forage production was maximized at the 672 kg N ha-1 rate in the late-summer cycles, with increased N removal at higher N rates. In 1994, 1344 kg N ha-1 as AN applied in early-spring at Ardmore, resulted in a yield of 19.8 Mg ha-1 and total N removed exceeded 600 kg N ha-1. Nitrogen removal increased at N rates in excess of that required for maximum yield, while fertilizer recoveries decreased. Nitrogen applied at 112 kg N ha-1 in early-spring resulted in fertilizer recoveries in excess of 90%, while 1344 kg N ha-1 resulted in < 20% recovery. Ammonium nitrate application resulted in increased yields, N removal and fertilizer recovery greater than UR at Ardmore, but not at Burneyville. Increased forage yields and N removal for AN compared to UR was possibly due to increased ammonia volatilization from UR at Ardmore. At Burneyville, rainfall immediately following fertilization may have helped to decrease ammonia

Page 70 1997 OSU Soil Fertility Research
volatilization losses. Although estimated fertilizer recovery levels were greatest at the lowest N rates (112 and 224 kg N ha-1 in the early-spring and late-summer, respectively) forage production and N removal were doubled when applying much higher N rates (>672 kg N ha-1) at the N responsive Ardmore site.
REFERENCES Altom, W., J.L. Rogers, W.R. Raun, G.V. Johnson and S.L. Taylor. 1996. Long-term rye-wheat-ryegrass
forage yields as affected by rate and date of N application. J. of Prod. Agric. 9:510-516.
Anderson, W.B., and T.E. Kunkel. 1983. The effects of various nitrogen fertilizers on yield and N uptake of bermudagrass. Tex. Agric. Exp. Stn. Bull-4141 p. 174-177.
Brejda, John J., James R. Brown, and Calvin L. Hoenshell. 1995. Indiangrass and caucasian bluestem responses to different nitrogen sources and rates in the Ozarks. J. Range Manage. 48:72-180.
Burton, Glenn W., J.E. Jackson and R.H. Hart. 1963. Effects of cutting frequency and nitrogen on yield, in-vitro digestibility, and protein, fiber, and carotene content of Coastal bermudagrass. Agron. J. 55:500-502.
Crawford, R.F., W.K. Kennedy, and W.C. Johnson. 1961. Some factors that affect nitrate accumulation in forages. Agron. J. 53:159-162.
Eichhorn, M.M. Jr. 1989. Effect of fertilizer nitrogen rates and sources on Coastal bermudagrass grown on Coastal Plain soil. LSU Agr. Exp. Sta. Bull. No. 797.
Ernst J.W., and H.F. Massey. 1960. The effects of several factors on volatilization of ammonia formed from urea in the soil. Soil Sci. Soc. Am. Proc. 24:87-90.
Fisher, F.L., and A.G. Caldwell. 1959. The effects of continued use of heavy rates of fertilizers on forage production and quality of Coastal bermudagrass. Agron. J. 51:99-102.
Hanson, C.L., J.F. Power, and C.J. Erickson. 1978. Forage yield and fertilizer recovery by three irrigated perennial grasses as affected by N fertilization. Agron. J. 70:373-375.
Hojjati, S.M., T.H. Taylor, and W.C. Templeton, Jr. 1972. Nitrate accumulation in rye, tall fescue, and bermudagrass as affected by nitrogen fertilization. Agron. J. 64:624-627.
Lachat Instruments. 1989. Quickchem method 12-107-04-1-B. Lachat Instr. Milwaukee, WI.
Lovelace, Dale A. Ethan C. Holt and W.B. Anderson. 1968. Nitrate and nutrient accumulation in two varieties of bermudagrass (Cynodon dactylon (L.) Pers.) as influenced by soil applied fertilizer nutrients. Agron. J. 60:551-554.
Mathias, E.L., O.L. Bennett, and P.E. Lundberg. 1973. Effect of rate of nitrogen on yield, nitrogen use, and winter survival of Midland bermudagrass (Cynodon dactylon (L.) Pers.) in Appalachia. Agron. J. 65:67-68.
Mathias, E.L., O.L. Bennett, and P.E. Lundberg. 1978. Fertilization effects on yield and N concentration of Midland bermudagrass. Agron. J. 70:973-976.
Morris, H.D., Juan F. Celecia. 1962. Effect of time of fertilizer application on yield and nutrient uptake of Coastal bermudagrass on Cecil sandy loam. Agron. J. 54:335-338.
Murphy, L.S., and G.E. Smith. 1967. Nitrate accumulation in forage crops. Agron. J. 59:171-174.
Prine, Gordon M., and Glenn W. Burton. 1956. The effect of nitrogen rate and clipping frequency upon the yield, protein content and certain morphological characteristics of a Coastal bermudagrass (Cynodon Dactylon, (L) Pers.). Agon. J. 48:296-301.

OSU Soil Fertility Research 1997 Page 71
Power, J.F. 1980. Response of semiarid grassland sites to nitrogen fertilization: II fertilizer recovery. Soil Sci. Soc. Am. J. 44:550-555.
Rasmussen, P.E., and C.R. Rohde. 1991. Tillage, soil depth, and precipitation effects on wheat response to nitrogen. Soil Sci. Soc. Am. J. 55:121-124.
Sartain, J.B. 1985. Effect of acidity and N source on the growth and thatch accumulation of Tifgreen bermudagrass and on soil nutrient retention. Agron. J. 77:33-36.
Schepers, J.S., D.D. Francis and M.T. Tompson. 1989. Simultaneous determination of total C, total N and 15N on soil and plant material Commun. Soil Sci. Plant Anal. 20:949-959.
Staley, T.E., W.L.Stout, and G.A. Jung. 1991. Nitrogen use by tall fescue and switchgrass on acidic soils of varying water holding capacity. Agron. J. 83:732-738.
Walker, M.E., T.C. Keisling, and W.H. Marchant. 1979. A comparision of solid and liquid fertilizer for Coastal bermudagrass hay production. Soil Sci. Soc. Am. J. 43:597-601.
Westerman, R.L. J. O. O’Hanlon, G.L. Fox, and D.L. Minter. 1983. Nitrogen fertilizer efficiency in bermudagrass production. Soil Sci. Soc. Am. J. 47:810-817.
Wiedenfeld, Robert P. 1988. Coastal bermudagrass and Renner lovegrass fertilization responses in a subtropical climate. J. Range Manage. 41:7-12.
Worker, G.F., Jr., and M.L. Peterson. 1962. Nitrogen fertilizer effects on yield and composition of Coastal bermudagrass forage. California Agr. 16(11):14.
Wright, Madison J., and Kenneth L. Davison. 1964. Nitrate accumulation in crops and nitrate poisoning in animals. Adv. in Agron. 16:197-217.
Wuest, S.B., and K.G. Cassman. 1992. Fertilizer-nitrogen use efficiency of irrigated wheat: I. uptake efficiency of preplant versus late-season application. Agron. J. 84:682-688.
Table 1. Initial surface (0-15 cm) soil test characteristics and soil classification at Ardmore and Burneyville, OK._______________________________________________________________________________________Location pH BI Total N Org. C NH4-N NO3-N P K
-------- g kg -1 -------- --------------- mg kg -1 ----------------_______________________________________________________________________________________Ardmore 5.2 6.33 0.69 9.9 10.9 1.8 59 247Classification: Wilson silt loam (fine, montmorillonitic, thermic Vertic Ochraqualfs)
Burneyville 5.6 6.79 1.48 20.8 7.6 1.9 26 179Classification: Minco fine sandy loam (coarse-silty, mixed thermic Udic Haplustoll)_______________________________________________________________________________________pH - 1:1 soil:water, BI - Buffer Index, Total N and Organic C - dry combustion, NH 4-N and NO3-N - 2M KCl extract, P and K - Melich III extraction.

Page 72 1997 OSU Soil Fertility Research
Table 2. Harvest and fertilization dates, by cycle and climatic conditions at the time of fertilization, Ardmore and Burneyville, OK.______________________________________________________________________________ -------------------Ardmore------------------- ----------------------Burneyville--------------------Fertilization Harvest Fertilization Harvest______________________________________________________________________________
1993-1994 Late-summer8-27-93 10-3-93 - -
5-26-94 -6-29-94 -
8-9-94 -
1994-1995 Late-summer8-9-94 9-26-94 8-9-94 9-27-94
3-22-95 5-23-955-23-95 6-27-956-28-95 8-10-958-11-95
1995-1996 Late-summer8-11-95 8-10-95 9-28-95
5-28-96 5-28-966-27-96 6-27-96
8-8-96 8-8-96
1994 Early-spring3-31-94 5-26-94 3-31-94 5-26-94
6-28-94 6-29-948-9-94 8-9-94
9-26-94 9-27-94
1995 Early-spring3-22-95 5-23-95 3-22-95 5-23-95
6-28-95 6-27-958-11-95 8-10-95
9-28-95______________________________________________________________________________ --------Temperature oC--------- -------------Total Rainfall, mm--------------
Daily High Average surface 0-24 hr 24-48 hr 48-72 hr______________________________________________________________________________Ardmore Late-summer1993-1994 38.3 30.7 0 0 01994-1995 31.0 26.7 0 0 01995-1996 33.3 26.8 0 0 0
Early-spring1994 19.9 10.2 0 0 4.81995 28.9 20.8 0 0 0
Burneyville Late-summer1994-1995 33.2 26.0 .25 0 01995-1996 32.9 26.4 0 0 0
Early-spring1994 22.3 12.4 0 0 2.51995 30.1 20.8 0 0 4.3______________________________________________________________________________Average surface and daily high temperatures, and total rainfall were obtained from Mesonet stations located at Ardmore and Burneyville, respectively, for 24 hour time periods.

OSU Soil Fertility Research 1997 Page 73

Table 3. Analysis of variance, treatment means and single-degree-of-freedom-contrasts for forage yield, N removal and percent fertilizer recovery, late-summer applied N, Ardmore, OK, 1993-94, 1994-95 and 1995-96._________________________________________________________________________________________________________________________________________________
Forage yield, Mg ha-1 N removal, kg ha-1 Fertilizer recovery, %Source df 1993-94 1994-95 1995-96 df 1993-94 1994-95 1995-96 df 1993-94 1994-95 1995-96_________________________________________________________________________________________________________________________________________________
--------------------------------------------------------------------------------------------Mean Squares-------------------------------------------------------------------------------------Rep 2 0.1 0.2 1.7 2 803.2 311.8 1006.5 2 88.5 752.8 ** 61.6Trt 9 32.3 ** 43.1 ** 19.2 ** 9 41133.6 ** 49372.3 ** 17103.1 ** 7 726.4 ** 1415.7 ** 279.6 **Contrast
AN linear 1 128.2 ** 141.6 ** 53.5 ** 1 197895.5 ** 179324.7 ** 62711.8 ** 1 1980.2 ** 3843.7 ** 706.8 **AN quadratic 1 42.0 ** 94.9 ** 39.4 ** 1 31240.5 * 95572.0 ** 24977.1 ** 1 135.2 218.1 25.5 UR linear 1 80.9 ** 69.7 ** 56.6 ** 1 95171.8 ** 62993.0 ** 42856.9 ** 1 605.5 ** 1265.3 ** 24.4UR quadratic 1 1.9 27.1 * 9.1 ** 1 2708.9 26380.9 ** 3080.9 * 1 278.2 * 20.9 15.3AN vs UR
(over N rate) 1 73.8 ** 79.1 ** 13.3 ** 1 57512.9 ** 108873.6 ** 22498.2 ** 1 2072.5 ** 4447.8 ** 1140.3 **Error 18 0.9 1.7 0.7 18 697.6 906.4 479.7 13 50.6 80.9 50.6SED 0.8 1.1 0.7 21.6 24.6 17.9 5.8 7.3 5.8
N Rate Source -------------------------------------------------------------------------------------------Treatment Means-----------------------------------------------------------------------------------0 - 4.66 4.09 1.10 80.7 72.7 15.8 - - -0 - 4.72 4.70 1.01 87.8 86.4 14.2 - - -224 AN 9.58 7.34 4.44 226.2 254.1 95.7 63.4 74.9 34.9448 AN 11.69 12.88 6.99 308.9 357.5 173.0 50.1 60.5 36.6672 AN 13.75 13.52 7.77 360.3 395.2 210.3 41.1 46.0 29.91344 AN 14.51 13.91 7.34 445.7 402.0 216.8 26.9 23.5 16.4224 UR 7.94 6.85 3.13 175.8 178.7 57.5 40.9 41.2 16.6448 UR 8.75 9.87 4.34 203.8 246.5 82.1 26.7 35.7 15.0672 UR 9.21 10.45 6.11 226.8 271.8 139.6 21.2 27.6 18.51344 UR 12.45 11.58 6.97 331.4 311.3 171.6 18.4 16.7 12.5
AN (over N rates) 12.38 11.91 6.64 335.3 352.2 173.9 36.5 40.6 29.5UR (over N rates) 9.59 9.69 5.14 234.5 252.1 112.7 22.4 25.7 15.7_________________________________________________________________________________________________________________________________________________**, * - significant at the 0.01 and 0.05 probability levels, respectively, SED - standard error of the difference between two equally replicated means, df - degree of freedom, AN - ammonium nitrate, UR - urea.

OSU Soil Fertility Research 1997 Page 75
Table 4. Analysis of variance, treatment means and single-degree-of-freedom-contrasts for forage yield, N removal and percent fertilizer recovery, early-spring applied N, Ardmore, OK, 1994 and 1995._________________________________________________________________________________________________________________________________________________
Forage yield, Mg ha-1 N removal, kg ha-1 Fertilizer recovery, %Source df 1994 1995 df 1994 1995 df 1994 1995_________________________________________________________________________________________________________________________________________________ ----------------------------------------------------------------Mean Squares----------------------------------------------------------------------Rep 2 1.6 1.1 2 1728.1 804.1 2 322.8 499.8Trt 7 140.4 ** 19.2 ** 7 166690.4 ** 27750.8 ** 5 1493.5 ** 498.2Contrast
AN linear 1 488.6 ** 59.2 ** 1 616405.9 ** 105987.9 ** 1 758.7 45.5AN quadratic 1 66.3 ** 18.4 ** 1 56108.8 ** 25202.8 ** 1 321.6 374.3UR linear 1 332.6 ** 51.9 ** 1 387804.5 ** 52892.2 ** 1 1268.4 * 821.8UR quadratic 1 98.3 ** 13.2 ** 1 100931.0 ** 8939.1 ** 1 613.8 22.2-AN vs UR
(over N rate) 1 6.1 1.5 1 25398.8 * 11963.4 ** 1 1280.0 * 361.9Error 14 2.7 0.6 14 3211.6 634.2 10 174.2 195.4SED 1.4 0.6 46.3 20.6 10.8 11.4
N Rate Source ----------------------------------------------------------Treatment Means-------------------------------------------------------0 - 4.29 2.83 77.7 49.8 - -0 - 4.62 3.45 89.9 62.4 - -112 AN 9.16 5.16 192.1 108.0 96.8 46.3672 AN 17.80 8.89 511.1 280.7 63.6 33.41344 AN 19.84 8.83 614.4 287.1 39.5 17.2112 UR 8.92 4.66 163.2 96.3 71.0 35.9672 UR 17.80 8.20 504.9 203.0 62.7 21.91344 UR 17.29 8.33 481.6 221.9 29.6 12.3
AN (over N rate) 15.60 7.63 439.2 225.3 52.9 25.2UR (over N rate) 14.67 7.06 383.2 173.7 49.6 17.5_________________________________________________________________________________________________________________________________________________**, * - significant at the 0.01 and 0.05 probability levels, respectively, SED - standard error of the difference between two equally replicated means, df - degree of freedom, AN - ammonium nitrate, UR - urea.

Page 76 1997 OSU Soil Fertility Research
Table 5. Analysis of variance, treatment means and single-degree-of-freedom-contrasts for forage yield, N removal and percent fertilizer recovery, late-summer applied N, Burneyville, OK, 1994-1995._________________________________________________________________________________________________________________________________________________
Forage yield, Mg ha-1 N removal, kg ha-1 Fertilizer recovery, %Source df 1994-95 1995-96 df 1994-95 1995-96 df 1994-95 1995-96_________________________________________________________________________________________________________________________________________________
----------------------------------------------------------------Mean Squares----------------------------------------------------------------------Rep 2 1.9 3.2 2 958.4 1028.6 2 39.4 379.5Trt 9 13.3 ** 2.3 9 14515.1 ** 4247.9 * 7 357.9 ** 157.9 **Contrast
AN linear 1 25.9 ** 0.2 1 35529.8 ** 9771.2 * 1 1616.1 ** 340.9 **AN quadratic 1 7.9 * 0.1 1 10630.1 ** 723.4 1 328.5 * 89.0UR linear 1 50.8 ** 7.7 1 54161.3 ** 22291.6 ** 1 248.3 * 361.1 **UR quadratic 1 4.5 0.2 1 5894.9 * 239.5 1 11.8 60.8AN vs UR
(over N rate) 1 0.1 3.3 1 1101.8 1187.1 1 236.5 * 206.7Error 17 1.2 2.4 17 836.1 1242.0 13 43.5 34.2SED 0.9 1.3 23.6 28.8 5.4 4.8
N Rate Source ----------------------------------------------------------Treatment Means-------------------------------------------------------0 - 7.67 5.56 120.0 89.8 - -0 - 6.38 4.92 92.5 83.3 - -224 AN 10.03 5.84 212.5 118.2 47.4 22.1448 AN 11.45 5.78 252.2 139.2 32.6 18.8672 AN 11.06 5.87 249.5 140.8 21.3 8.51344 AN 12.20 5.96 288.1 170.9 13.5 7.7224 UR 9.28 6.64 161.8 130.3 24.8 29.1448 UR 10.77 5.02 229.5 120.0 27.5 21.1672 UR 11.68 7.02 251.3 168.9 21.6 17.61344 UR 13.27 7.73 299.4 205.9 14.4 12.7
AN (over N rate) 11.19 5.86 250.6 142.3 21.5 14.3UR (over N rate) 11.25 6.60 235.5 156.3 19.2 20.1_________________________________________________________________________________________________________________________________________________**, * - significant at the 0.01 and 0.05 probability levels, respectively, SED - standard error of the difference between two equally replicated means, df - degree of freedom, AN - ammonium nitrate, UR - urea.

OSU Soil Fertility Research 1997 Page 77
Table 6. Analysis of variance, treatment means and single-degree-of-freedom-contrasts for forage yield, N removal and percent fertilizer recovery, early-spring applied N, Burneyville, OK, 1994 and 1995._________________________________________________________________________________________________________________________________________________
Forage yield, Mg ha-1 N removal, kg ha-1 Fertilizer recovery, %Source df 1994 1995 df 1994 1995 df 1994 1995_________________________________________________________________________________________________________________________________________________ ----------------------------------------------------------------Mean Squares----------------------------------------------------------------------Rep 2 3.9 4.1 * 2 2145.1 1836.7 2 94.2 127.9Trt 7 5.8 * 9.3 ** 7 172496.0 ** 19071.2 ** 5 2321.0 ** 1706.9 **Contrast
AN linear 1 4.8 7.7 * 1 47978.0 ** 37622.0 ** 1 5917.1 ** 3783.9 **AN quadratic 1 3.4 5.0 ** 1 1646.6 * 5442.5 ** 1 3265.0 ** 3112.9 **UR linear 1 20.3 ** 27.9 ** 1 56562.6 ** 63635.6 ** 1 802.1 ** 6.0UR quadratic 1 1.1 0.1 1 406.4 ** 529.1 1 952.4 ** 116.2AN vs UR
(over N rate) 1 1.5 0.1 1 116.2 601.9 1 668.6 ** 1515.6 **Error 14 1.5 1.0 14 747.2 583.6 10 33.9 90.0SED 1.0 0.8 22.3 19.7 4.8 7.7
N Rate Source ----------------------------------------------------------Treatment Means-------------------------------------------------------0 - 11.44 7.22 182.9 122.0 - -0 - 10.93 5.89 165.3 94.7 - -112 AN 13.65 10.10 269.7 210.7 85.4 91.2672 AN 13.70 10.09 322.4 279.4 22.1 25.51344 AN 13.09 9.22 349.7 257.7 13.1 11.1112 UR 12.16 7.32 226.3 131.4 46.6 21.0672 UR 14.90 10.55 332.2 260.2 23.5 22.71344 UR 14.41 10.69 352.3 296.2 13.3 14.0
AN (over N rate) 13.60 9.87 316.5 251.0 21.2 21.2UR (over N rate) 13.82 9.52 303.6 229.3 19.3 18.0_________________________________________________________________________________________________________________________________________________**, * - significant at the 0.01 and 0.05 probability levels, respectively, SED - standard error of the difference between two equally replicated means, df - degree of freedom, AN - ammonium nitrate, UR - urea.

Table 7. Percent fertilizer removed by harvest from ammonium, nitrate N rate treatments, late-summer applied N, Ardmore, OK, 1993-1994 and 1994-1995.________________________________________________________________________Harvest Days after 224 448 672 1344date fertilization ---------------------------kg N ha -1--------------------------------________________________________________________________________________1993-199410-3-93 35 45.1 23.3 16.8 7.25-26-94 272 7.8 13.6 7.3 4.46-29-94 306 4.2 4.4 5.6 4.38-9-94 347 6.3 8.8 11.4 10.9
1994-19959-26-94 50 56.3 36.9 20.1 8.45-23-95 287 5.9 7.4 6.3 4.06-28-95 323 3.6 9.8 8.6 6.98-11-95 367 5.1 6.3 8.3 4.7________________________________________________________________________

OSU Soil Fertility Research 1997 Page 79
Figure 1. Bermudagrass forage nitrate-N over time, late-summer and early-spring applied N, Ardmore, OK, 1994-1995 and 1994 respectively.
0 50 100 150 200 250 300 350 4000
500
1000
1500
2000
25000
224 AN
224 UR
448 AN
448 UR
672 AN
672 UR
1344 AN
1344 UR
Days after fertilization
1994-1995SED = 105.1
Nitr
ate-
N, m
g kg
-1
0 20 40 60 80 100 120 140 160 180 2000
500
1000
1500
2000
25000
112 AN
112 UR
672 AN
672 UR
1344 AN
1344 UR
Days after fertilization
Nitr
ate-
N, m
g kg-1
1994 SED =110.2
Late-summer
Early-spring

Page 80 1997 OSU Soil Fertility Research
Nitrogen Use Efficiency In Irrigated Corn Production
D.A. Keahey, S.B. Phillips, G.V. Johnson, J.A. Hattey, Hailin Zhang, T.L. Springer and W.R. Raun
ABSTRACTNitrogen use efficiency (NUE) seldom exceeds 50% in most grain production systems, yet little research has been performed to find ways of improving NUE in grain crops. One study was initiated in 1995 at the Oklahoma Panhandle Research and Extension Center near Goodwell, OK on a Richfield clay loam soil (fine, montmorillonitic, mesic Aridic Argiustoll). This research project was conducted to estimate total nitrogen (N) uptake as a function of N rate, method of application, N management and crop residue incorporation. No grain yield response to applied N was observed in 1995 or 1996. This was attributed to large amounts of residual N in the soil. Grain protein ranged from 81 to 158 g kg-1 in 1995, and from 78 to 87 g kg-1 in 1996. Before any response to N is seen, the residual N in the soil must be depleted.
INTRODUCTION
nefficient use of N contributes to greater use of energy resources, increased production costs and possible environmental pollution of water (Sharpe et al. 1988). As these issues become a greater concern, we must examine different ways to
improve N use efficiency. Since N is the most frequently deficient nutrient in crop production, it is common to find that most nonlegume cropping systems require N inputs (Tisdale et al. 1993). Moll et al. (1982) defined N use efficiency as grain production per unit of N available in the soil. In grain production systems, N use efficiency seldom exceeds 50%. Variables which influence N use efficiency include variety, N source, N application method, time of N application, tillage, N rate, production system (grain or forage), plant N loss, and soil type. Nitrogen use efficiency consists of both the efficiency of absorption (uptake) and the efficiency with which the N absorbed is utilized to produce grain. Raun et al. (1989) reported that preplant N broadcast and anhydrous ammonia injected below the soil surface (90 and 180 kg N ha-1) were both found to maximize grain yield. Mengel et al. (1982) stated that N use efficiency increased using anhydrous ammonia injected below the soil surface compared to urea, ammonium nitrate and urea ammonium nitrate broadcast without incorporation in a no-tillage corn production system. Nitrogen availability during grain fill can be increased by adding N fertilizer when in coordination with irrigation. Efficiency varies considerably depending on native soil N supply, previous N uptake, developmental stage of the plant when supplemental N is applied, and yield potential. Optimizing fertilizer N use, achieving acceptable yield levels, and achieving adequate grain protein require knowledge of expected N uptake efficiency and utilization within the plant in relation to the rate and timing of N addition (Wuest and Cassman, 1992). Olson (1980) reported that grain yields obtained by applying 150 kg N ha-1 were no higher than yields obtained by
I

OSU Soil Fertility Research 1997 Page 81
applying 50 kg N ha-1, but resulted in much greater crop removal, gaseous loss, and downward movement of N into the soil profile in irrigated corn.
Calculations for N fertilizer use efficiencies are typically based on the amount of N found in the crop at maturity. However, it is more typical for maximum N accumulation of many grain crops to be reached sometime between pollination and maturity. Under favorable growing conditions, many corn hybrids achieve maximum N accumulation between silking and the milk stage. During kernel fill, large amounts of N can be translocated from vegetative tissue to the grain (Francis, 1993). This results in a requirement for N uptake during grain fill, indicating a potential advantage of ammonium nutrition for grain production. This advantage is due to the fact that ammonium-N is not subject to leaching or denitrification losses, thus ammonium maintained in the soil should be available for late-season uptake (Tsai et al. 1992). Timing of residue incorporation and method of N application are important factors that affect plant N availability and N uptake. When residue incorporation is delayed until prior to planting, soil N is immobilized by enhanced microbial activity. (Johnson, 1982). Sharpe et al. (1988), found that placement of fertilizer N below the surface soil layer decreased immobilization and increased plant uptake of N. Elliot et al. (1981), noted that N uptake and wheat yields were increased when N was incorporated into the soil and not applied to the soil surface. The objective of this study was to estimate total N uptake as a function of N rate, method of application, N management and crop residue incorporation.
MATERIALS AND METHODS
One field experiment was initiated in the spring of 1995 at the Oklahoma Panhandle Research and Extension Center near Goodwell, OK on a Richfield clay loam soil (fine, montmorillonitic, mesic Aridic Argiustoll). Initial soil test characteristics are reported in Table 1. An incomplete factorial arrangement of treatments was used to evaluate N rate, N method of application, N management and residue management (Table 2). Urea (45-0-0) and anhydrous ammonia (82-0-0) were used as the sources of N fertilizer and were applied at the rates of 0, 118, 235 and 353 kg ha -1. Methods of application included N as urea broadcast after harvest, N as anhydrous ammonia injected preplant and N as urea broadcast preplant. Management of N included N as urea incorporated after harvest and N as urea incorporated preplant. Corn stover was either incorporated following harvest or it was left in the field and incorporated prior to planting. A randomized complete block design with three replications was used for this experiment. Plot size consisted of four rows(0.76 m spacing) by 12.12 m.Pioneer brand 3299 corn hybrid was planted at a rate of 74,000 plants ha -1 in 1995 and 1996, respectively. Harvest area consisted of the center two rows (0.76 m spacing) by 3 m in length. Harvesting and shelling were performed by hand. Plot weights were recorded and subsampled for moisture and chemical analysis. Subsamples were dried in a forced-air oven at 65 0C and ground to pass through a 140 mesh screen. Total N was determined on all grain samples using dry combustion (Schepers et al., 1989). Protein N was derived by multiplying %N by 6.25 (personal communication, University of Nebraska,1997). Data analysis was performed using SAS (SAS Institute Inc. 1988). Weeds were controlled by annual broadcast applications of atrazine [6-chloro-N-ethyl-N’-(1-methylethyl)-1,3,5-triazine-2,4-diamine] at 2.24 kg ai ha-1, and metolachlor [2-

Page 82 1997 OSU Soil Fertility Research
chloro-N-(2-ethyl-6-methylphenyl)-N-(2-methyloxy-1-methylethyl)acetamide] at 383.1 ml ha-1 immediately following planting.
RESULTS AND DISCUSSION
Analysis of variance, associated single-degree-of-freedom-contrasts and treatment means for grain yield and protein are reported in Tables 3 and 4. No grain yield response to applied N was observed in 1995 or 1996 (Figure 2). This was attributed to large amounts of residual N in the soil (Table 1). The large grain yield differences between the the years was due to a corn volunteer problem in 1995. Grain protein ranged from 81 to 158 g kg-1 in 1995, and from 78 to 87 g kg-1 in 1996 (Figure 1). In 1996, a linear response in grain protein were observed when urea was broadcast applied followed by incorporation after harvest, and when urea was broadcast preplant and incorporated prior to planting. Residue management (treatment 1 vs 2), nitrogen source (treatments 9, 10, 11 vs 12, 13, 14) and nitrogen method had no significant effect on grain yield or protein in 1995 or 1996. Before any response to N is seen in grain yield the residual N in the soil must be depleted. Therefore, more data needs to be collected.
REFRENCESFrancis, D. 1993. Nitrogen loss from corn plants during grain fill. Better crops. pp. 16-19.
Elliott, L.F., V.L. Cochran, and R.I. Papendick. 1981. Wheat residue and nitrogen placement effects on wheat growth in the greenhouse. Soil Sci. 131:48-52.
Johnson, G.V. 1982. Available nitrogen and small grain production. Oklahoma State University. OSU Extension Facts No. 2232.
Mengel, D.B., D.W. Nelson, and D.M. Huber. 1982. Placement of nitrogen fertilizers for no-till and conventional till corn. Agron. J. 74:515-518.
Moll, R.H., E.J. Kamprath, and W.A. Jackson. 1982. Analysis and interpretation of factors which contribute to efficiency of nitrogen utilization. Agron. J. 74:562-564.
Olson, R.V. 1980. Fate tagged nitrogen fertilizer applied to irrigated corn. Soil Sci. Soc. Am. J. 44:514-517.
Raun, W.R., D.H. Sander, and R.A. Olson. 1989. Nitrogen fertilizer carriers and their placement for minimum till corn under sprinkler irrigation. Agron. J. 81:280-285.
SAS Institute, INC. SAS/STAT User’s Guide, Release 6.03 edition. Cary, NC: SAS Institute Inc., 1988.
Schepers, J.S., D.D. Francis, and M.T. Thompson. 1989. Simultaneous determination of total C, total N and 15N on soil and plant material. Commun. Soil Sci. Plant Anal. 20:949-959.
Sharpe, R.R., L.A. Harper, J.E. Giddens, and G.W. Langdale. 1988. Nitrogen use efficiency and nitrogen budget for conservation tilled wheat. Soil Sci. Soc. Am. J. 52:1394-1398.
Tisdale, , S.L., W.L. Nelson, J.D. Beaton, and J.L. Havlin. 1993. Soil Fertility and Fertilizers. 5 th ed. Macmillan Publishing Company, New York, NY.
Tsai, C.Y., I. Dweikat, D.M. Huber, and H.L. Warren. 1992. Interrelationship of nitrogen nutrition with maize (Zea mays) grain yield, nitrogen use efficiency and grain quality. J. Sci. Food Agric. 58:1-8.
Wuest, S.B., and K.G Cassman. 1992. Fertilizer-nitrogen use efficiency of irrigated wheat: I. Uptake efficiency of preplant versus late-season application. Agron. J. 84:682-688.

OSU Soil Fertility Research 1997 Page 83
Table 1. Initial surface (0-15 cm) soil test characteristics and soil classification near Goodwell, OK.
Location pH Total N Org. C NH4-N NO3-N P K--------g kg-1-------- -------mg kg-1------- -------mg kg-1-------
Goodwell 7.5 1.3 11 36 26 37 590
Classification: Richfield clay loam (fine, montmorillonitic, mesic Aridic Argiustoll)
pH - 1:1 soil:water, Total N and Organic C - dry combustion, NH4-N and NO3-N - 2M KCl extraction, P and K - Mehlich III extraction
Table 2. Treatment structure including N rate, N source, N method, N management and residue management.
TrtN Ratekg ha-1
NSource
N Method
N Management
Residuemanagement
1 0 - - - RIAH2 0 - - - RIPP3 118 UR NBAH NIAH RIAH4 235 UR NBAH NIAH RIAH5 353 UR NBAH NIAH RIAH6 118 UR NBAH NIPP RIPP7 235 UR NBAH NIPP RIPP8 353 UR NBAH NIPP RIPP9 118 AA NAAI NKPP RIPP
10 235 AA NAAI NKPP RIPP11 353 AA NAAI NKPP RIPP12 118 UR NBPP NIPP RIPP13 235 UR NBPP NIPP RIPP14 353 UR NBPP NIPP RIPP
NBAH - N as urea broadcast after harvest, NAAI - N as anhydrous ammonia injected, NBPP - N as urea broadcast preplant, NIAH - N as urea incorporated after harvest, NIPP - N as urea incorporated preplant, NKPP - N as anhydrous ammonia, knifed preplant, RIAH - Residue incorporated after harvest, RIPP - Residue incorporated preplant

Page 84 1997 OSU Soil Fertility Research
Table 3. Analysis of variance and single-degree-of-freedom-contrasts for grain yield and protein content, 1995-1996.
Source of variation df 1995 1996 1995 1996 Grain yield, kg ha-1 Protein g kg-1
-------------------------Mean Squares------------------------Replication 2 4593220 2380990 90.8 19.6Treatment 13 1038384 2082307 731.3 17.0Error 26 1025028 2956465 815.9 12.3
Contrasts N linear Urea NIAH (1,3,4,5) 1 9322 815027 873.8 10.3 N quadratic Urea NIAH (1,3,4,5) 1 468018 717239 262.9 11.9 N linear Urea NIPP (2,6,7,8) 1 25088 2300204 2.9 70.4* N quadratic Urea NIPP (2,6,7,8) 1 1474502 5217067 25.4 15.5 N linear AA NKPP (2,9,10,11) 1 79102 275404 10.7 5.1 N quadratic AA NKPP (2,9,10,11) 1 2396582 3514934 0.3 30.5 N linear Urea NIPP (2,12,13,14) 1 101149 2938128 1.4 41.8@
N quadratic Urea NIPP (2,12,13,14) 1 69012 52246 7.0 0.4 RIAH vs RIPP (1 vs 2) 1 1963264 1877 11.7 23.5 AA vs Urea (9,10,11 vs 12,13,14) 1 673827 2405152 40.4 1.5 NBAH,RIAH vs NBAH,RIPP (3,4,5 vs 6,7,8) 1 34592 6502911 24.5 0.7 NBAH,RIPP vs NBPP,RIPP (6,7,8 vs 12,13,14) 1 2239720 6545468 7.8 15.9SED 826 1403 23.3 2.8
@, *, ** significant at 0.10, 0.05 and 0.01 probability levels, respectively. NIAH - N as urea incorporated after harvest. NIPP - N as urea incorporated preplant. NKPP - N as anhydrous ammonia, knifed preplant. RIAH - residue incorporated after harvest. RIPP - residue incorporated preplant. AA - anhydrous ammonia. SED - standard error of the difference between two equally replicated means.
Table 4. Treatment means for grain yield and protein content for 1995 and 1996 crop years.
------------------------Treatment means------------------------ Grain yield, kg ha-1 Protein, g kg-1
Treatment 1995 1996 1995 19961 2869 10732 110.5 84.82 1725 10767 113.3 80.83 2846 9262 81.0 84.04 2350 10151 158.4 80.15 3117 9659 110.2 83.36 3695 11782 110.8 78.57 1893 11259 120.0 83.98 2461 9636 111.7 86.29 2388 10234 116.4 84.710 2915 9693 114.4 85.111 1791 11325 116.8 82.712 1922 9606 115.1 84.713 2059 10440 109.4 82.514 1953 9014 114.2 87.1
SED 826 1403 23.3 2.9SED - standard error of the difference between two equally replicated means.

OSU Soil Fertility Research 1997 Page 85
Figure 1. Grain protein for 1995 and 1996 (118, 235 and 353 - N rate in kg ha-1
for 1995 and 1996, respectively, UR - urea, AA - anhydrous ammonia, NBAH - N asurea broadcast after harvest, NAAI - N as anhydrous ammonia injected, NBPP - N as urea broadcast preplant, NIAH - N as urea incorporated after harvest, NIPP - N as urea incorporated preplant, NKPP - N as anhydrous ammonia (knifed preplant),RIAH - residue incorporated after harvest, RIPP - residue incorporated preplant. SED - standard error of the differences between two equally replicated means).
Figure 2. Grain yield for 1995 and 1996 (118, 235 and 353 - N rate in kg ha -1 for 1995 and 1996, respectively, UR - urea, AA - anhydrous ammonia, NBAH - N as urea broadcast after harvest, NAAI - N as anhydrous ammonia injected, NBPP - N as urea broadcast preplant, NIAH - N as urea incorporated after harvest, NIPP - N as urea incorporated preplant, NKPP - N as anhydrous ammonia (knifed preplant), RIAH - residue incorporated after harvest, RIPP - residue incorporated preplant. SED - standard error of the differences between two equally replicated means).
0, RIAH0, RIPP
118, UR, NBAH, NIAH, RIAH
235, UR, NBAH, NIAH, RIAH353, UR, NBAH,NIAH,RIAH
118, UR, NBAH, NIPP, RIPP
235, UR, NBAH, NIPP, RIPP353, UR, NBAH, NIPP, RIPP118, AA, NAAI, NKPP, RIPP
235, AA, NAAI, NKPP, RIPP
353, AA, NAAI, NKPP, RIPP118, UR, NBPP, NIPP, RIPP
235, UR, NBPP, NIPP, RIPP
353, UR, NBPP, NIPP, RIPP0 50 100 150 200
1995 SED = 23.3
1996 SED = 2.9
Protein, g kg-1
Trea
tmen
ts
0, RIAH
0, RIPP
118, UR, NBAH, NIAH, RIAH
235, UR, NBAH, NIAH, RIAH
353, UR, NBAH,NIAH,RIAH
118, UR, NBAH, NIPP, RIPP
235, UR, NBAH, NIPP, RIPP
353, UR, NBAH, NIPP, RIPP
118, AA, NAAI, NKPP, RIPP
235, AA, NAAI, NKPP, RIPP
353, AA, NAAI, NKPP, RIPP
118, UR, NBPP, NIPP, RIPP
235, UR, NBPP, NIPP, RIPP
353, UR, NBPP, NIPP, RIPP0 2000 4000 6000 8000 10000 12000 14000
1995 SED = 826
1996 SED = 1403
Tre a
tmen
ts
Grain yield, kg ha-1

Page 86 1997 OSU Soil Fertility Research
Seasonal and Long-Term Changes in Nitrate-Nitrogen Content of Well Water in Oklahoma
S.B. Phillips, W.R. Raun, and G.V. Johnson
ABSTRACTTo ensure that NO3-N concentrations in groundwater do not exceed the maximum contaminant level (MCL; 10 mg L-1), drinking water supplies are continuously sampled and analyzed. Water sampling and analytical methods have changed over the past 40 yr, and failure to apply the errors associated with those methods places researchers at risk of reporting invalid NO3-N changes. The objectives of this research were to compare analytical procedures, seasonal samplings, and storage methods for well water NO3-N analyses using historical and recent well water data, to identify where changes in NO3-N concentrations have taken place and possible reasons for the changes, and to determine if age of water, well depth, and NO3-N concentration are related. Benchmark NO3-N analyses were obtained for 46 water wells which were then sampled each season (fall, winter, spring, and summer) over a 2-yr period. For each sampling, 4 samples were taken from each well; 2 were frozen immediately (common today) and 2 were stored at ambient temperature (benchmark procedure). Nitrate-N was determined on subsamples from all 4 samples using phenoldisulfonic acid (benchmark procedure) and automated Cd reduction (common today). Changes in NO3-N over time were determined for each well; 46% of the wells showed no change, 39% showed an increase, and 15% showed a decrease. No relationships were detected among depth to aquifer, age of water, and well water NO3-N. This work suggests that a minimum difference of 6.15 mg NO3-N L-1 is required before declaring significant differences between historical and current well water NO3-N levels.
INTRODUCTION
nterest in nitrate-N contamination of groundwater is attributable to possible health risks (methemoglobinemia) associated with consumption of water containing high NO3-N by infants under 3 mo of age. This concern prompted the USEPA to set the
maximum contaminant level (MCL) or public health standard for NO3-N in drinking water at 10 mg L-1. To ensure that NO3-N concentrations in groundwater do not exceed the MCL, possible sources of pollution are continuously scrutinized. Groundwater can be contaminated by both point and nonpoint sources of pollution. Some point sources include livestock feedlots, improper well construction and locations, and domestic septic disposal systems. Agricultural chemicals, particularly N fertilizers, are commonly cited as major contributors to nonpoint pollution. However, data collected in the early 1950s report a number of wells having NO3-N concentrations in excess of 10 mg L-1. This was at a time when fertilizer use was uncommon (Johnson et al., 1995), suggesting that sources other than N fertilizers were responsible for the high NO3-N levels. This may also be true in current well samplings having high NO3-N concentrations. Determination
I

OSU Soil Fertility Research 1997 Page 87
of well water age aids in determining whether NO3-N concentrations are due to leaching of fertilizers applied in recent years or whether they are remnants from a pre-fertilizer era.
Because most NO3-N sources are at the soil surface, shallow aquifers should logically be more susceptible to contamination than deeper ones, however, many factors exist which affect NO3-N movement in soils. Nitrate-N contamination of deeper groundwater can occur where a hydraulic connection and a hydraulic gradient exist between shallow and deep aquifers (Fedkiw, 1991). This results in recharge of the deeper aquifer with NO3-N rich water from the shallower aquifer. High capacity pumping of deep wells can also draw water downward from overlying aquifers, thus resulting in contamination of the deeper wells. Migration of water through the unsaturated zone of many soils can be quite slow, resulting in inputs of N requiring many years to reach the groundwater reservoir. Therefore, N sources present at one time, although now obliterated, could still result in NO3-N contamination of deep wells.
Many hydrogeologic and source-related factors exist which control the amount, position, and timing of NO3-N concentration in groundwater. Complex interactions of those factors make it difficult to draw any general inferences about the potential for NO3-N contamination of groundwater in a particular region. The direct approach to determine where NO3-N contamination exists is sampling and analysis of well water. Fedkiw (1991) noted that NO3-N sample variances within and between wells in the same locale and between years or seasons is very large. In Minnesota, Anderson (1989) found that NO3-N concentrations ranged from 4.06 to 16.3 mg L -1 within the same well during the year. This clearly identifies a weakness associated with seasonal sampling and indicates that one sample is insufficient to provide conclusive evidence of groundwater quality and that recurrent monitoring of water wells is necessary. Anderson (1989) also found that seasonal fluctuations in mean concentrations during the 1982 through 1984 period were greater than the apparent historical increase in NO3-N concentration. This generated doubt as to whether or not a real increase had taken place or whether errors stemming from seasonal variation obscured the long-term concentration changes.
Methods used to analyze groundwater samples for NO3-N can also be a source of error when comparing historical data. Since the 1950s, several analytical methods have been used to determine NO3-N in groundwater. Each method has its own inherent random and bias errors. Direct numerical comparisons between data analyzed using two different procedures (without assessing their proper errors) could be inaccurate. Research studies have reported increases in groundwater NO3-N concentrations spanning time periods of up to 30 yr without addressing the effects of changing analytical methods on those estimates. Another possible source of error when comparing historical data is storage of the sample. Current protocol requires that water samples being analyzed for NO3-N be cooled at 4 to 10° C for transport or analyzed immediately in the field (Scalf et al., 1981). Recommended maximal holding time for samples is 48 h. This protocol is intended to minimize any biological transformations that may take place. Data compiled years ago which provide the benchmark levels for historical comparisons may include samples taken without observing those guidelines. Unless the statistical parameters associated with an independent estimate are adequately assessed, researchers are at risk of making invalid conclusions about changes in NO3-N concentrations.

Page 88 1997 OSU Soil Fertility Research
The primary objectives of this research were to use historical and recent data from north-central Oklahoma to compare analytical procedures, seasonal samplings, and storage methods for well water NO3-N analyses and to identify where changes have taken place. Additional objectives were to estimate the approximate age of water from selected wells using tritium/helium-3 groundwater dating techniques to determine if age of water, well depth, and NO3-N concentration are related and to identify possible reasons for changes in well water NO3-N.
MATERIALS AND METHODS
Seventy-five water wells in Garfield, Grant, and Kingfisher counties in north-central Oklahoma were selected for comprehensive sampling. Those wells were chosen because NO3-N data collected from 1953 through 1972 were available to serve as benchmark levels (Bingham and Bergman, 1980; Dover, 1953; unpubl. records from the files of the U.S. Geol. Survey office in Oklahoma City, OK). The major groundwater basins underlying these counties are alluvium and terrace deposits. The deposits are found along rivers and streams as unconfined aquifers and consist of interfingerings of sand, sandy clay, clay, and gravel. Water quality is affected by nearby streams, however, overall water quality is good and the water can be used for domestic, irrigation, industrial, and municipal purposes. Average annual precipitation for this area ranges from 711 to 864 mm while the average annual evaporation potential ranges from 1500 to 1600 mm. This relationship results in evapotranspiration removing about 80% of Oklahoma’s water from availability for use (Okla. Water Resour. Board, 1984). These counties also have substantial agricultural activity associated with continuous wheat production and N fertilization.
Tax records obtained from the three counties were used to determine current ownership of the property on which each well was located. The owners were contacted and informed about the proposed experiment. Due to changes since the original data were compiled, several wells no longer existed. In many cases, verification of well authenticity was also difficult. The wells sampled during the benchmark period were identified by legal description only. This indicated a 0.65 to 2.59 km2 area on which the well was located. Many of these areas of land contained numerous water wells. Several cooperators were able to verify the source of earlier samplings based on personal knowledge, family records, or inquiries of previous land owners. Information regarding the age of particular wells made proper well selection possible at most locations. Consequently, the number of wells to be sampled was reduced to 46; and permission was obtained from the well owners or operators to begin sampling in the fall of 1993. The well sites represented an array of soil types and land uses. Wells had an average total depth of 14.6 m and an average depth to water of 6.4 m and included both dug and drilled wells. Water samples were obtained each season (fall, winter, spring, and summer) from September 1993 through July 1995.
To obtain a representative groundwater sample, the sample should be taken directly from the aquifer. However, 37 of the 46 wells contained in-place, semipermanent, mounted pumps which limited the options available for sampling. Those wells were pumped for a period of time adequate to remove several bore volumes of water from the well so that samples collected reasonably represented that of the aquifer

OSU Soil Fertility Research 1997 Page 89
(Scalf et al., 1981). Of the remaining wells, 6 were collected via windmills; and 3 were collected using a teflon bailer. The bailer was rinsed in the field with deionized water following each use (Davis et al., 1993). All samples were handled using established sampling protocol (Barcelona et al., 1987). Each season, four samples were collected from each well in 250-ml plastic bottles; two were stored by freezing the samples immediately using an ice chest containing dry ice, and two were stored at ambient temperatures for 1 to 2 days until analyses were performed. Frozen samples were thawed to room temperature before analyses.
Frozen and nonfrozen samples were analyzed using the phenoldisulfonic acid method (Bremner, 1965; Chapman and Pratt, 1961) and by a “Lachat-Quickchem” automated flow injection system which employs Cd reduction of NO3 to NO2 and measurement of NO2 by the Griess-Ilosvay method (Henriksen and Selmer-Olsen, 1970; Jackson et al., 1975; Keeney and Nelson, 1982). Phenoldisulfonic acid was the method of choice when most of the benchmark data were analyzed. This colorimetric procedure is tedious, time consuming, and is subject to several interferences. Cadmium reduction is currently used by many industrial and public laboratories.
Statistical analyses of data were performed using procedures outlined by SAS (1990). A split-plot in space and time ANOVA model was used to assess the effects of sampling times (4 seasons * 2 yr), methods of storage (frozen vs. nonfrozen), methods of analysis (phenoldisulfonic acid vs. Cd reduction), and their interactions.
Ten water wells were selected from the 46 and sampled in January 1996 for age determination using tritium/helium-3 groundwater dating techniques (Solomon et al., 1992). Only 10 were selected due to the restrictive cost of analyses. These 10 wells were categorized into one of four groups, i.e., (1) wells <12 m deep with NO3-N concentrations >15 mg L-1, (2) wells <12 m deep with NO3-N concentrations <15 mg L-
1, (3) wells >12 m deep with NO3-N concentrations >15 mg L-1with high NO3-N, and (4) wells >12 m deep with NO3-N concentrations <15 mg L-1. Two samples were collected from each of the 10 wells on the same date. One sample was analyzed for helium-3, and the other for tritium. The helium-3 sample was collected using an apparatus which consisted of a 46-cm long piece of 6.35-mm copper tubing capped on each end by a piece of tygon tubing. The copper tube was held in a vertical position with the lower tygon tube attached to the well discharge via an air-tight connection. The upper tygon tube remained open to allow water to flow through the copper tube. When no air bubbles were observed in either tygon tube, they were closed using pinch clamps. The ends of the copper tube were then crimped using refrigerator clamps, trapping the water sample within the copper tubing. The tygon tubes were removed, and the ends of the copper tubing were capped. Caution was taken during this step to avoid trapping air bubbles in the copper tube and contaminating the sample. The tritium sample was collected in a 500-ml glass bottle with a polypropylene cap leaving no airspace within the bottle. The samples were forwarded to the Univ. of Rochester, Rochester, NY, for analyses and age estimation by the Dep. of Earth and Environ. Sci.
RESULTS AND DISCUSSION
Highly significant sampling time by method of analysis and sampling time by storage interactions were observed (Table 1). These interactions among sampling time,

Page 90 1997 OSU Soil Fertility Research
storage, and method of analysis restrict the reliability with which individuals can make direct numerical comparisons between different sets of NO3-N data. The overlapping errors associated with combining interdependent variables implied that the benchmark data would have had a different statistical error associated with it than data collected from the same wells in the last 2 yr.
A standard deviation estimate for the benchmark data was derived using the MSE from an ANOVA of NO3-N values obtained from the nonfrozen samples analyzed using phenoldisulfonic acid. A similar estimate was made for the frozen samples analyzed using Cd reduction. Our analyses indicated that the nonfrozen samples
Table 1. Split-plot in space and time ANOVA for well water NO3-N, 1993-1995._________________________________________________Source df Mean squares_____________________________________________________
Well 38 618.87**Sampling time 7 10.85Well*Sampling (a) 202 24.11Storage of samples 1 1.18Sampling*Storage 7 13.89**Well*Storage(Sampling) (b) 240 2.58Method of analysis 1 43.74*Sampling*Method 7 81.21**Storage*Method 1 15.33Sampling*Storage*Method 7 7.18Error (c) 472 6.36_____________________________________________________*,** significant at the 0.01 and 0.0001 probability levels respectively.
analyzed using phenoldisulfonic acid and the frozen samples analyzed using Cd reduction had standard deviations of ± 2.48 mg L-1 and ± 3.67 mg L-1, respectively. This would suggest that a minimum difference of 6.15 mg L-1 be used to make direct comparisons between historical (nonfrozen samples analyzed using phenoldisulfonic acid) and current water samples. For this study, the standard deviation (±2.48 mg L-1) was assigned to benchmark NO3-N values, and tests on independent means comparing benchmark and current data were performed for each well. Changes in NO3-N between benchmark and current data are reported in Table 2. Seven of the 46 wells were excluded from all ANOVAs because they were determined to be point-source contaminated; however, changes over time within these wells are included in the discussion.

OSU Soil Fertility Research 1997 Page 91
Table 2. Comparisons of well water NO3-N between benchmark samples (nonfrozen, phenoldisulfonic acid) and current samples (frozen, Cd reduction) from the same wells._________________________________________________________________Well no. Benchmark † Current ‡ Significance ------------------------mg NO3-N L-1-----------------------
1 20.70 19.28 NS2 0.77 8.68 NS3 0.02 11.52 ++4 42.75 2.50 **5 0.11 10.33 +6 0.18 2.78 NS7 0.02 14.67 ++8 0.14 11.03 ++9 6.75 9.20 NS
10 8.78 10.82 NS11 0.00 0.71 NS12 0.15 11.00 ++13 0.31 34.64 ++14 0.29 15.33 ++16 11.25 15.14 NS18 5.85 13.72 ++19 36.00 11.10 **20 3.83 11.91 +21 0.29 4.76 NS23 2.70 10.38 +24 1.31 16.55 ++25 67.50 21.09 **26 38.25 20.90 **28 2.25 4.47 NS29 4.50 6.17 NS30 3.60 3.51 NS31 5.85 16.74 ++32 0.77 3.27 NS33 2.70 99.43 ++34 1.91 7.58 +35 2.00 7.24 NS36 1.13 4.46 NS37 1.24 5.38 NS38 22.50 1.31 **39 1.40 44.27 ++41 6.98 15.68 +42 6.75 1.32 *43 0.38 1.20 NS44 2.25 16.79 ++45 1.76 6.49 NS46 3.38 4.44 NS48 0.02 1.35 NS49 1.91 0.69 NS50 3.38 92.92 ++51 13.50 12.70 NS52 5.85 0.61 *
________________________________________________________________________*, ** Significant decrease at the 0.05 and 0.01 probability levels.+, ++ Significant increase at the 0.05and 0.01 probability levels.Measured and reported from 1953 through 1972.

Page 92 1997 OSU Soil Fertility Research
Determined over eight sampling dates from 1993 through 1995.Direct comparisons of historical vs. current estimates for each well, disregarding the statistical analyses, would have detected increases in 35 of the 46 wells (76%). Using the appropriate statistics, significant increases in well water NO3-N over time were found in only 18 wells (39%) while 7 (15%) showed decreases and 21 (46%) exhibited no change (p < 0.05). The average NO3-N concentrations for the wells over the past 2 yr ( including those determined to be point-source contaminated) ranged from 0.61 to 99.4 mg L-1 and had a mean of 14.0 mg L-1. Increases in NO3-N concentration ranged from 5.67 to 96.7 mg L-1 and had a mean of 23.1 mg L-1. Decreases ranged from 5.24 to 46.4 mg L-1 and had a mean of 22.9 mg L-1. Assignment of the appropriate standard deviation to benchmark data is crucial when making historical comparisons involving well water NO3-N, and the chance of incorrectly declaring changes without proper statistical treatment of the data is apparent.
Of the 18 wells which showed historical increases, 7 were identified as being likely contaminated by point-source pollution. Wells 13, 14, 24, and 44 were all located on highly vulnerable farmsteads. The soil texture for these sites ranged from a fine sand to a sandy loam, and the average depth to groundwater was 5.2 m. All of these wells were located near livestock corrals which were frequently used. These factors made these particular wells prime candidates for point-source animal waste NO3-N contamination. The water from well 13 was estimated to have entered the aquifer from 3 to 5 yr ago (Table 3). This supports the hypothesis that recent land management practices can contribute to contamination of recharge water at the ground surface. Water from well 14 was 18 yr old (Table 3), placing its recharge within a time frame when animal waste could have been a source of NO3-N contamination. Well 24 contained water which was 15 yr old (Table 3). In addition to being vulnerable to animal waste run-off, the casing of well 24 was damaged. The length of time this problem existed was unknown; however, this introduced another factor which tends to support point-source contamination at the site.
Wells 33, 39, and 50 were probably contaminated as a result of poor well construction. Well 33 was located near several oil pumping units and drilling rigs. Originally drilled to discover oil, its initial bore size was 20 cm in diameter. When no oil was found, a 13- cm casing was installed to use the site as a water well. The remaining 7 cm was neither packed nor sealed, allowing any surface contamination to have direct access to the groundwater system. This well was also located in the immediate vicinity of an excessively manure-fertilized garden and a septic system. Thus, indicating that recent point source contamination (not associated with aquifer recharge) may have caused this high NO3-N level. Well 39 was a large diameter, hand-dug well. This type of well is vulnerable to contamination because of its design and shallow depth to aquifer (5.5 m, Table 3). This well was located at an urban residence and was not associated with any type of agricultural production; however, the water, which was 3 yr old (Table 3), contained the third largest mean NO3-N concentration of all wells sampled. Well 50 was a 15-m drilled well, but it had only been cased to a depth of 6 m. The well was also located on a down slope gradient from a residence septic system and a corral. Wells 33 and 50 had the largest NO3-N concentrations of all wells sampled (99 and 93

OSU Soil Fertility Research 1997 Page 93
Table 3. Benchmark and current NO3-N in well water, type of location, depth to aquifer, and age for 10 wells selected.________________________________________________________________________
Well ---------NO3-N--------- Type of Depth toWater
no. Benchmark † Current ‡ location aquifer age ______________________________________________________________________________
---------- mg L-1 ---------- --- m --- --- yr ---1 20.70 12.58 farmstead 5.1 1003 0.02 8.62 farmstead 5.7 10
11 0.00 1.01 farmstead/corral 3.0 2213 0.31 49.31 farmstead/corral 4.5 3-514 0.29 13.66 farmstead/corral 5.1 1824 1.31 17.40 farmstead/corral 4.8 1533 2.70 86.52 rural residence 11.5 50-7539 1.40 50.43 urban residence 5.5 341 6.98 13.09 farmstead 5.4 1350 3.38 39.02 farmstead/corral 7.9 not determined
______________________________________________________________________________Measured and reported from 1953 through 1972.Sampled on 15 Jan. 1996. Determined using tritium/helium-3 dating techniques.
mg L-1 respectively) (Table 2). Water samples from wells 33 and 50 represented a mixing of old and young waters. Well 33 contained mostly older water which could have entered the aquifer as long as 100 yr ago. The best estimate of its approximate age was from 50 to 75 yr (Table 3). Since the benchmark NO3-N concentration for this well was 2.70 mg L-1, the recently recharged portion of the water probably contained most of the NO3-N determined. Well 50 provided a sample mixed to the point that an age determination could not be made. Analysis of water from other wells in the vicinity (within 1.60 km) of wells 33 and 50 failed to show any signs of contamination (4.75 to 7.65 mg L-1), supporting the conclusion that NO3-N levels in these wells were due to point sources.
Of the other four wells tested for age (Table 3), wells 1 and 11 showed no significant changes, whereas wells 3 and 41 showed increases over time (p < 0.05; Table 2). Well 1 was a shallow well with a NO3-N concentration of 19.3 mg L-1 (Table 2). The water in this well was estimated to be about 100 yr old (Table 3); however, pure old water (low or no tritium) is very difficult to age with certainty. Well 11 was also a shallow well, but its concentration and age were 0.71 mg L-1 (Table 2) and 22 yr (Table 3). Well 3, a deep well, and 41, a shallow well, contained water that was 10 and 13 yr old, respectively. This lack of relationship between depth and age supports the hypothesis that factors exist which affect the rate of water movement through soils. Because no evidence suggested point-source contamination of these wells, increases were probably due to nonpoint sources.
Surface-applied N fertilizer is commonly cited as the major source of nonpoint NO3-N. Leaching of excessively-applied N fertilizer provides a source of nonpoint NO3-N under certain circumstances, however if leaching was a source of NO3-N for wells 1 and 11, an opposite relationship between age and NO3-N concentration would be expected. Since fertilizer use was uncommon 100 yr ago, the older water should have

Page 94 1997 OSU Soil Fertility Research
minimal NO3-N, and the younger water should have the greatest concentrations. Likewise, no relationship between NO3-N and average aquifer depth existed for all wells showing increases (excluding those contaminated by point sources; Fig. 1), or for all wells sampled (excluding those contaminated by point sources) in either the benchmark years or the past 2 yr (Fig. 2). Although leaching of surface-applied N fertilizer may have been the cause of increased NO3-N for some wells in the study, the lack of relationship between concentration and depth (Figs. 1 and 2) indicate that this cause was not widespread, and nonpoint sources of NO3-N other than those found at the soil surface must exist.
Of the seven wells showing decreases over time, two have been identified as prior sites of point-source contamination. Well 4 was located on a site used for poultry production when the benchmark data were collected. It has since become a residence well, without poultry, which may explain the decrease in NO3-N values. Well 38 was a hand-dug well when sampled in the 1950s. Since that time, it has been properly cased and secured, and the concentration of NO3-N in the water has decreased. Wells 25 and 26 were both located on the same section of land. The land was irrigated cropland overlying a shallow aquifer which may explain why the NO3-N levels have remained considerably >10 mg L-1. However, no information was obtainable regarding the history of the area to
Fig. 1. Linear relationship of changes in NO3-N on the average depth to aquifer for water wells showing significant increases over time (excluding those point-source contaminated).
10 15 20 25 30 35 406
8
10
12
14
16Wells showing significant increases
2
Average Depth to Aquifer, m
Cha
nge
in W
ell W
ater
NO
3 -N
, mg/
L
Y = 8.25 + 0.10X R = 0.14

OSU Soil Fertility Research 1997 Page 95
Fig. 2. Linear relationship of NO3-N on the average depth to aquifer for benchmark and current data from water wells (excluding those point-source contaminated).
determine the source of high benchmark levels of NO3-N. No historical information was available for wells 19, 42, and 52. Wells 19, 25, and 26 probably were point-source contaminated, improperly sampled, or inaccurately analyzed as their NO3-N concentrations grossly exceeded the average for that time period.
The average NO3-N concentration for the wells in this study over the past 2 yr (excluding those which were point-source contaminated) was 8.40 mg L -1. The average benchmark NO3-N concentration (excluding previously point-source contaminated wells) was 2.90 mg L-1. The average time span between benchmark and current sampling dates for all wells was 38 yr. Assuming continuous and constant accumulation, this would represent an average increase of 0.14 mg L-1 yr-1. This figure closely agrees with that of Chen and Druliner (1988) who found NO3-N concentrations in Nebraska groundwater to be increasing at a rate of 0.12 mg L-1 yr-1.
CONCLUSIONS
Significant interactions were detected among seasonal sampling, sample storage, and method of analysis for well water NO3-N. Consequently, there is considerable risk of drawing incorrect conclusions about NO3-N changes when making direct numerical comparisons between historical levels (obtained from analyzing nonfrozen samples using phenoldisulfonic acid) and current levels (obtained from analyzing frozen samples using Cd reduction). By estimating the statistical errors associated with independent samples, more reliable determinations about changes in NO3-N can be made. The standard deviation for historical NO3-N values (nonfrozen analyzed using phenoldisulfonic acid) used in these experiments was ± 2.48 mg L-1. The current samples (frozen samples analyzed using Cd reduction) had a standard deviations of ± 3.67 mg L -1. This would suggest that a minimum difference of 6.15 mg L-1 be used to make direct comparisons between historical (nonfrozen samples analyzed using phenoldisulfonic acid) and current
0 3 6 9 12 150
5
10
15
202
2
Average Depth to Aquifer, m
Wel
l Wat
er N
O3
-N, m
g/L
Benchmark Data Y = 2.29 + 0.03X R = 0.005
Current Data Y = 7.38 + 0.05X R = 0.008
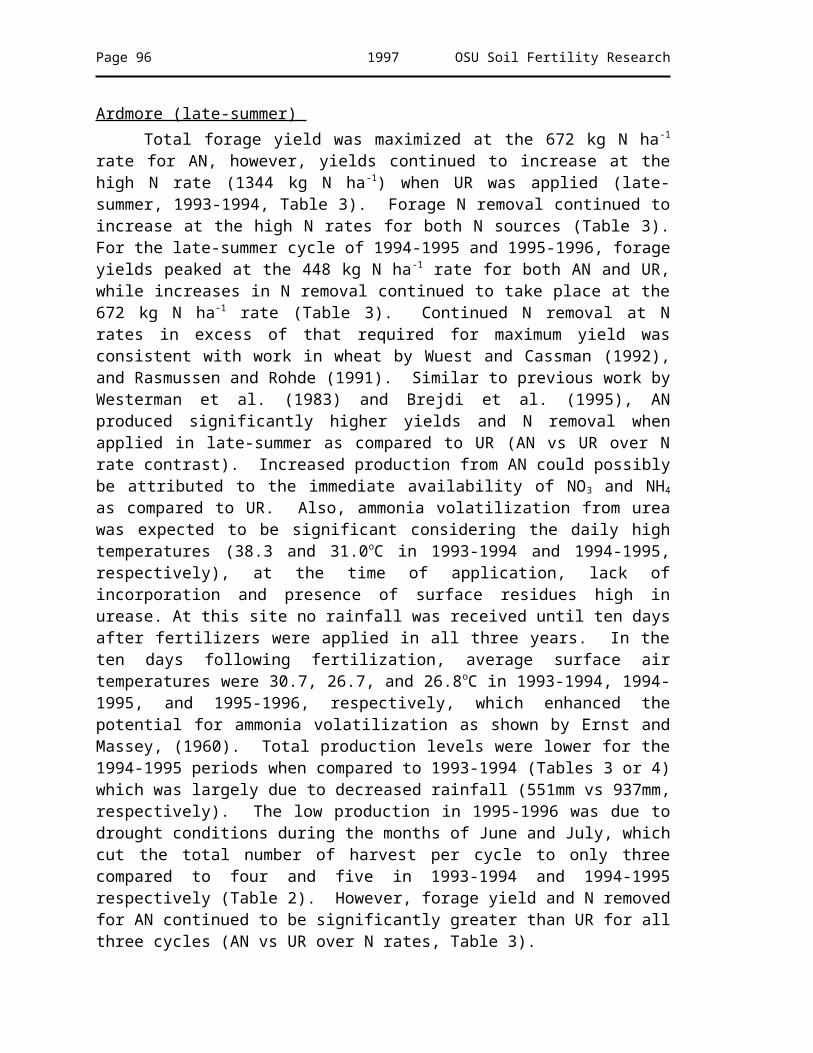
Page 96 1997 OSU Soil Fertility Research
water samples. Increases in well water NO3-N over time were found in only 18 wells (39%) while 7 (15%) showed decreases and 21 (46%) exhibited no change (p < 0.05). No relationship was detected among depth to aquifer, age of water, and well water NO3-N for the benchmark population, the current population, or the wells which showed increases.
REFERENCESAnderson, H.W., Jr. 1989. Effects of agricultural quality of water in surficial sand-plain aquifers in Douglas,
Kandiyohi, Pope, and Sterns counties. 52 p. U.S. Geol. Survey, St. Paul, MN.
Barcelona, M., J.F. Keely, W.A. Pettyjohn, and A. Wehrmann. 1987. Handbook: Ground water. p.107-126. USEPA, Office of Res. and Development; U.S. Gov. Print. Office, Washington, DC. Center for Environ. Res. Information, Cincinnati, OH; and Robert S. Kerr Environ. Res. Lab., Ada, OK. EPA/625/6-87/016.
Bingham, R.H., and D.L. Bergman. 1980. Reconnaissance of the water resources of the Enid quadrangle in north central Oklahoma. U.S. Geol. Survey, Oklahoma City, OK. Map HA-7.
Bremner, J.M. 1965. Inorganic forms of nitrogen. p. 1179- 1237. In C.A. Black et al. (ed.) Methods of soil analysis. Part 2. Chemical and microbiological properties. Agron. Monogr. 9. ASA, Madison, WI.
Chapman, H.D., and P.F. Pratt. 1961. Methods of analysis for soils, plants, and waters. p. 153-157. Univ. of Calif. Div. of Agric. Sci., Riverside.
Chen, H.H., and A.D. Druliner. 1988. Agricultural chemical contamination of ground water in six areas of the High Plains aquifer, Nebraska. p. 103-106. National water summary,1986 - Hydrologic events and ground water quality, U.S. Geol. Survey Water Supply Paper 2325. U.S. Gov. Print. Office, Washington, DC.
Davis, M., D. Peterson, and E. Giles. 1993. Groundwater bulletin. 15 p. Dec. issue. Ill. Groundwater Consortium, Carbondale.
Dover, T.B. 1953. Chemical character of public water supplies in Oklahoma. 45 p. Div. of Water Resour., Okla. Planning and Resour. Board, U.S. Geol. Survey, Oklahoma City. Bull. 8.
Fedkiw, J. 1991. Nitrate occurrence in U.S. waters (and related questions): A reference summary of published sources from an agricultural perspective. 35 p. USDA. Unnumbered Publ. U.S. Gov. Print. Office, Washington, DC.
Henriksen, A., and A.R. Selmer-Olsen. 1970. Automatic methods for determining nitrate and nitrite in water and soil extracts. Analyst 95:514-518.
Jackson, W.A., C.E. Frost, and D.M. Hildreth. 1975. Versatile multirange analytical manifold for automated analysis of nitrate-nitrogen. Soil Sci. Soc. Am. Proc. 39:592-593.
Johnson, G.V., W.R. Raun, and E.R. Allen. 1995. Oklahoma Soil Fertility Handbook. 3rd ed. p. 95- 98. Oklahoma Plant Food Educational Soc. Dep. of Agron., Okla. State Univ., Stillwater.
Keeney, D.R., and D.W. Nelson. 1982. Nitrogen-inorganic forms. p. 643-698. In A.L. Page et al. (ed.) Methods of soil analysis. Part 2. Chemical and microbiological properties. 2nd ed. Agron. Monogr. 9. ASA and SSSA, Madison, WI.
SAS Institute Inc. 1990. SAS/STAT user’s guide, release 6.03 ed. SAS Inst. Inc., Cary, NC.
Scalf, M.R., J.F. McNabb, W.J. Dunlap, R.L. Cosby, and J.S. Fryberger. 1981. Manual of ground-water quality sampling procedures. p. 43-82. USEPA Rep. 600/2-81-160. U.S. Gov. Print. Office, Washington, DC.

OSU Soil Fertility Research 1997 Page 97
Solomon, D.K., R.J. Poreda, S.L. Schiff, and J.A. Cherry. 1992. Tritium and helium-3 as groundwater age tracers in the Borden aquifer. Water Resour. Res. 28:741-755.

OSU Soil Fertility Research 1997 Page 98
Effect of Nitrogen Fertilizer Source on Bermudagrass Yield
J.M. LaRuffa, Bob Woods, G.V. Johnson, and W.R. Raun
ABSTRACTNitrogen fertilization is important for optimum yield in bermudagrass. This study was conducted to determine the amount of forage production with fall fertilization and the effect of ammonium nitrate versus urea on bermudagrass yield. The trials were conducted at Cherokee, Craig, Delaware, Lincoln, Muskogee, and Wagoner Counties, Oklahoma. Statistical analysis indicated significant differences among treatments with respect to yield in 4 of the 6 counties. No differences were found between ammonium nitrate and urea with respect to bermudagrass yield at any location when fertilized in the fall.
INTRODUCTION
itrification, immobilization, and volatilization of applied nitrogen can affect plant uptake and yield. Volatilization is a major factor to consider when comparing nitrogen fertilizer source. The benefits of ammonium nitrate and
urea fertilizers are generally considered to be the same. Upon application, the availability of ammonium nitrate and urea are essentially equal. However, gaseous losses of N as ammonia gas (NH3) are possible with the use of urea (Johnson et al., 1997). Losses of N as NH3 generally occur on high pH (>7.0) soils (Raun et al., 1993) and where surface soil temperatures are high (Johnson et al., 1997). Murphy and Ferguson (1997) found climatic conditions following fertilization to be the primary factors influencing crop response to urea-containing fertilizers in their study of ridge-till corn. They concluded that the potential for volatilization was reduced when precipitation moved urea into the soil soon after application. Similarly, Tisdale et al. (1993) state that the ideal conditions for the surface application of urea are cold or dry soils at the time of application and the occurrence of significant precipitation (>0.1 in) within 3 to 6 days of fertilizer application. The objectives of this study were to determine if bermudagrass responded differently to fall applied ammonium nitrate and urea and to determine the amount of forage that could be produced with fall fertilization in eastern Oklahoma.
N
MATERIALS AND METHODS
Forage yield and treatment data was collected from six counties in Oklahoma; Cherokee, Craig, Delaware, Lincoln, Muskogee, and Wagoner. Five treatments were replicated three times at each location. Treatments were surface applied between August 22 and August 30 and the plots were harvested between October 23 and November 19.

OSU Soil Fertility Research 1997 Page 99
RESULTS
A linear yield response to nitrogen was found at Cherokee, Craig, Lincoln, and Muskogee counties (4 of the 6 locations). Average bermudagrass forage yield (lb/acre) for each treatment at each location is given in Table 1.
Statistical analysis of the treatment and yield data was performed using SAS (SAS Institute Inc., 1988). The GLM (General Linear Models) procedure was used to specify interactions among treatments and yield and also, to contrast the use of ammonium nitrate versus urea. Statistical analysis was based on two tailed t-tests. A null hypothesis of no differences among treatments with respect to yield was tested versus the alternative hypothesis of significant differences among treatments with respect to yield (p<0.05). Results varied in the counties where experiments were conducted. In Cherokee, Craig, Lincoln, and Muskogee counties, significant differences were found among treatments with respect to yield; however, no differences were found in Delaware and Wagoner counties. For responsive sites, fall fertilization can produce one-half to one ton of good quality forage. Table 2 reports soil pH and rainfall which are known to influence the potential for ammonia volatilization from urea. The potential for volatilization was minimal since every county received significant precipitation and/or soil pH was <7.0 at all locations. At the four sites where there was a linear response to nitrogen, a trend for increased yield was found for ammonium nitrate compared to urea. However, no significant differences were detected in the statistical analysis between ammonium nitrate and urea with respect to yield at any location when fertilized in the fall.
Table 1. Bermudagrass forage yield as affected by nitrogen rate and source at six locations in Oklahoma._____________________________________________________________________________________
Cherokee Craig Delaware Lincoln Muskogee Wagoner Grand Meandf __________________________Mean Squares___________________ ____
Rep 2 197674 108374 29485 140442 52317 78913Trt 4 2944564** 393016* 684760 1287736** 638593* 473674UR vs. AN 1 140 35883 1148 242808 17067 64067AN linear 1 9034192** 775889** 2982 2816233** 2110500** 1143744Residual 8 98790 68125 718944 96669 166395 418895CV 13 22 54 11 20 44SED 257 213 692 254 333 528
Treatment ___________________Average Yields (lb/acre)____________________ ____ CCLM 0-75-75 888 692 1726 1675 1330 856 1195 1147 50-75-75† 1939 1132 1092 2591 1945 1297 1666 1902100-75-75† 2690 1084 1540 2900 2184 1681 2013 2215150-75-75† 3224 1466 1623 3017 2501 1649 2247 2552150-75-75†† 3215 1621 1596 3419 2608 1855 2386 2716_____________________________________________________________________________________
*,** - Significant at the 0.05 and 0.01 probability levels, respectively, CV - Coefficient of variation, %, SED - Standard error of the difference between two equally replicated means, † - Urea (UR), †† - Ammonium Nitrate (AN), CCLM - Average yields for Cherokee, Craig, Lincoln, and Muskogee counties where there was a linear yield response to nitrogen.

Page 100 1997 OSU Soil Fertility Research
Table 2. Rainfall received within 6 days of fertilizer application and surface soil pH._________________________________________
County Rainfall (in) pH Cherokee 1.67 5.7Craig 2.00 6.5Delaware 2.33 5.0 Lincoln 0.00 4.7 Muskogee 0.01 5.3 Wagoner 0.00 6.2
_____________________________________________
REFERENCESMurphy, T.L. and R.B. Ferguson. 1997. Ridge-till corn and urea hydrolysis response to NBPT. J. Prod.
Agric. 10:271-282.
Johnson, G.V., W.R. Raun, H. Zhang, and J.A. Hattey. 1997. Oklahoma Soil Fertility Handbook. 4 ed. Oklahoma State University, Stillwater, OK.
Raun, W.R., G.V. Johnson, R.K. Boman, S.L. Taylor, E.R. Allen, M.E. Jojola, E.N. Ascencio, E.A. Guertal, and R.L. Westerman. Soil Fertility Research Highlights 1993. Oklahoma State University, Stillwater, OK.
SAS Institute Inc. 1988. SAS/STAT User’s Guide. 6.03 ed. SAS Institute Inc., Cary, NC.
Tisdale, S.L., W.L. Nelson, J.D. Beaton, and J.L. Havlin. 1993. Soil Fertility and Fertilizers. 5 ed. Macmillan Publishing Company, New York.

OSU Soil Fertility Research 1997 Page 101
Effect of N Rate, Source, and Timing of Application on Soybean Yield
S.B. Phillips, W.R. Raun, and G.V. Johnson
ABSTRACTSoybeans (Glycine max L. Merr.) are one of the most important legume crops in the world today. Soybean meal is an exceptional source of crude protein(CP) (approximately 45% CP) and also provides a high quality edible oil. Although legumes meet their N requirement through rhizobial symbiosis, some producers prefer to use small amounts of N as starter fertilizer when establishing soybeans. Despite the many advantages of starter fertilizers, there is evidence to suggest that inorganic N applied at planting can effectively inhibit N2 fixation. Application of N at early flowering, when N is needed most, may provide the same benefits as starter N without adversely affecting rhizobium populations. The objectives of this study were to evaluate the effects of N rate, source, and timing of application on soybean yield. One study was initiated in the summer of 1996 in eastern Oklahoma. Three N rates (22, 44, and 67 kg ha -
1) were evaluated using ammonium nitrate (34-0-0) and anhydrous ammonia (82-0-0). The fertilizer was applied either preplant (early June) or at flowering (early August). No increases in grain yield for either N source were found to exist in the first year of the study. A significant decrease in yield was observed when 67 kg N ha-1 as anhydrous ammonia was applied at flowering. This yield reduction was not observed at other N rates applied at flowering or when ammonium nitrate was the N source. This study will be continued for three more years.
INTRODUCTION
oybeans (Glycine max L. Merr.) are one of the most important legume crops in the world today. Soybean meal is an exceptional source of protein (approximately 45% CP) and also provides a high quality edible oil. Soybeans are used for human
consumption, processed foods, and livestock products. Oklahoma soybean production has primarily been limited to the eastern one-third of the state. Currently, more soybeans are being produced in the central and western regions of the state as part of crop rotations or in double-cropping systems with winter wheat (Triticum aestivum L.). Soybeans are popular for these types of systems because they are legumes which can provide a residual N source for subsequent crops. Although legumes meet their N requirement through rhizobial symbiosis, some producers prefer to use small amounts of N as starter fertilizer when establishing soybeans. Suggested advantages of early seedling stimulation using N fertilizer include increased resistance to insects and diseases, increased competitiveness with weeds, and early maturity. In addition, various researchers, including Soon and Miller (1977), have reported the presence of NH4
+ ions in the soil to be associated with increased P uptake, resulting in higher yields. Despite the many advantages of this practice, there is evidence to suggest that inorganic N applied at planting can effectively inhibit N2 fixation. Application of N at early flowering, when N is needed most, may
S

Page 102 1997 OSU Soil Fertility Research
provide the same benefits as starter N without adversely affecting rhizobium populations. Alternative methods of N application, in terms of timing, have not been thoroughly evaluated. The objectives of this study were to evaluate the effects of N rate, source, and timing of application on soybean yield.
MATERIALS AND METHODS
One study was initiated in the summer of 1996 at the Oklahoma State University Eastern Research Station, Haskell, Oklahoma, on a Taloka silt loam. Initial soil test characteristics are reported in Table 1. The experimental design was a randomized complete block with three replications. Plot size was four 76-cm rows by 7.6 m. Three N rates (22, 44, and 67 kg ha-1) were evaluated using ammonium nitrate (34-0-0) and anhydrous ammonia (82-0-0). Fertilizer N was applied either preplant (early June) or at flowering (early August) as per the treatment structure reported in Table 2. Ammonium nitrate was broadcast using a conventional dry fertilizer spreader. Anhydrous ammonia was injected to a 15-cm depth using a custom-built applicator equipped with three knives spaced 76 cm apart. Phosphorus and potassium were applied at rates of 34 and 90 kg ha-
1, respectively, to the entire experimental area at the time of establishment. A maturity group VI variety ‘Choska’ was planted in 76-cm rows at a rate of 43 kg ha -1. The experiment was cultivated as needed for weed control. The center two rows from individual plots were harvested using a Massey-Ferguson 8XP grain combine. Subsamples were collected from each plot for total N and total P analysis. Analyses of variance and single degree of freedom contrasts were performed using SAS (SAS, 1990).
RESULTS AND DISCUSSION
No treatments resulted in significant yield increases as compared to the checks (no N applied) in the first year of the study. Adverse weather conditions resulted in a delayed planting date which could have been partly responsible for all treatments having low yields (Figures 1 and 2). Riley and Barber (1971) demonstrated that NH4
+ is often superior to NO3
- in stimulating P uptake, thus increasing yields. However, no increases in grain yield due to N source when applied at planting were found to exist in the first year of the study (Figure 1). A significant decrease in yield was observed when the high sidedress N rate of 67 kg ha-1 as anhydrous ammonia was applied at flowering (Figure 2). This yield reduction was not observed at other rates of anhydrous ammonia applied at flowering or when ammonium nitrate was the N source (Figure 2). An optimum planting date was achieved in 1997, thus greater yield response to fertilizer treatments is expected. This study will be continued for three more years.
REFERENCESRiley, D. and S.A. Barber. 1971. Effect of ammonium and nitrate fertilization on phosphorus uptake as
related to root-induced pH changes at the root-soil interface. Soil Sci. Soc. Amer. Proc. 35:301-306.
SAS Institute. 1990. SAS/STAT user’s guide. Release 6.03 ed. SAS Inst., Cary, NC.
Soon, Y.K. and M.H. Miller. 1977. Changes in the rhizosphere due to NH4+ and NO3
- fertilization and phosphorus uptake by corn seedlings (Zea mays L.). Soil Sci. Soc. Am. J. 41:77-80.

OSU Soil Fertility Research 1997 Page 103
Table 1. Initial soil test characteristics for Haskell, OK.__________________________________________________________
%C %N NH4-N NO3-N P K pH__________________________________________________________
----------- mg kg-1------------0.81 0.06 21.9 7.91 29.6 124 6.3
__________________________________________________________%C (organic C), %N (total N) - dry combustion; NH4-N, NO3-N - 2M KClextract; P, K - Mehlich III; pH - 1:1 soil-water.
Table 2. Treatment structure employed at Haskell, OK.______________________________________________________________
Treatment N Rate (kg ha-1) N Source Time of Application______________________________________________________________
1. 0 -- --2. 22 AA Planting3. 45 AA Planting4. 67 AA Planting5. 22 AA Flowering6. 45 AA Flowering7. 67 AA Flowering8. 22 AN Planting9. 45 AN Planting10. 67 AN Planting11. 22 AN Flowering12. 45 AN Flowering13. 67 AN Flowering14. 0 -- --
______________________________________________________________AN-ammonium nitrate (34-0-0), AA-anhydrous ammonia (82-0-0)

Page 104 1997 OSU Soil Fertility Research
0
.25
.50
.75
1.00
1.25
1.50Ammonium NitrateAnhydrous Ammonia
SED = 0.14 Mg ha-1YI
ELD
, Mg
ha-1
N APPLIED AT PLANTING, kg ha-1
CHECK 22 45 67
Figure 1. Soybean yield response to N fertilizer applied at planting, 1996.
0
.25
.50
.75
1.00
1.25
1.50 Ammonium NitrateAnhydrous Ammonia
YIEL
D, M
g ha
-1
N APPLIED AT FLOWERING, kg ha-1
CHECK 22 45 67
SED = 0.14 Mg ha-1
Figure 2. Soybean yield response to N fertilizer applied at flowering, 1996.

OSU Soil Fertility Research 1997 Page 105
Bluestem Forage Yield Response to Source, Rate, and Timing of Applied N, and Spring Burning
S.B. Phillips, W.R. Raun, G.V. Johnson and R.L. Gillen
ABSTRACTPlains bluestem (Bothriochloa ischaemum L.) is one of the primary grass species used for pastureland in Oklahoma. Plains bluestem is popular due to its high forage and beef production potential. It is also used for soil conservation on highly erodible areas. Despite the current importance of this species, N fertilizer sources, rates, and timing have not been thoroughly evaluated. The objective of this study was to evaluate the response of bluestem forage production as a function of source, rate, and timing of applied N and spring burning. Two established bluestem pastures in Stillwater and Bessie, Oklahoma, were selected as experimental sites. A randomized complete block design with three replications was employed at both locations. Urea and ammonium nitrate were evaluated at rates of 56, 112, 224, and 448 kg N ha-1. The effects of spring burning and time of application were also evaluated. Dry matter yield, protein, and N uptake response to applied N were linear up to 224 kg N ha-1 for both sources with the maximum average (3-yr) yields being 4.6 Mg ha-1 and 3.8 Mg ha-1 at Stillwater and Bessie, respectively. No significant effects on production were found to exist due to N source or burning. Forage yields increased when N was applied in May vs. April. Nitrogen use efficiency rates were greatest when 112 kg N ha-1 was applied in May (35.6% and 20% at Stillwater and Bessie, respectively). Economic analysis indicated that applying 112 kg N ha-1 in May resulted in net profits at both locations.
INTRODUCTION
lains bluestem (Bothriochloa ischaemum L.) is one of the primary grass species being used for pastureland in Oklahoma. Plains bluestem is an erect, tufted, perennial, warm-season grass. Plains bluestem is popular due to its
aggressiveness, persistence, and drought tolerance, as well as high beef and forage production potential. Plains bluestem has also been established on highly erodible land as part of the USDA Conservation Reserve Program. In many instances, farmland which has been seeded to grass is N deficient due to several years of cultivation and erosion. The external supply rates of limiting soil nutrients, such as N, have a major influence on primary productivity, species composition, and species diversity in terrestrial ecosystems (Wedin and Tilman, 1990). Berg (1990) found N fertilization to substantially increase forage production resulting in an average of 30 kg of forage being produced per kg N applied. Berg and Sims (1995) reported that N applied at 34 kg N ha -1 resulted in steer gains ranging from 2.3 to 4.3 kg yr-1. Beef gain response to N fertilization may result not only from higher forage production, but also from higher quality forage. Various researchers including Berg and Sims (1995) and Stallcup et al. (1987) have found crude protein levels in bluestem hay to increase with increasing N fertilization. Spring burning
P

Page 106 1997 OSU Soil Fertility Research
is a pasture management practice used when substantial amounts of standing dead forage are present. Mitchell et al. (1994) reported increased quality and quantity of big bluestem (Andropogon gerardi Vitman) as a result of spring burning. One concern of pasture burning is that the rise in surface soil pH can increase N losses due to volatilization when N is applied as urea, thus lowering forage yields. However, the effect of spring burning has been found to lower bluestem forage yields regardless of N source used (Berg, 1993). This was attributed to creating drier growing conditions by using fire. Berg (1990) and Brejda et al. (1995) have both reported fertilizer N recovery in bluestem to average approximately 35%. The objective of this study was to evaluate the response of bluestem forage production as a function of source, rate, and timing of applied N and spring burning.
MATERIALS AND METHODS
Two established bluestem pastures in Oklahoma were selected as experimental sites. One location was the Oklahoma State University Animal Science Experiment Station west of Stillwater, Oklahoma, on a Darnell loam soil. The second site was at the Klemme Range Research Station west of Bessie, Oklahoma, on a St. Paul silt loam soil. Initial soil test characteristics for both locations are reported in Table 1. A randomized complete block experimental design with three replications was employed at both sites. Plot size was 3.0 m by 7.6 m. Two N sources, urea and ammonium nitrate, were evaluated at rates of 56, 112, and 224 kg N ha-1. An additional rate of 448 kg N ha-1 for each source was added to the treatment structure at both locations in the spring of 1995. The interaction of N rate (56 and 112 kg N ha-1) by source (urea and ammonium nitrate) and management (burning in early spring vs. no burning) was also evaluated. The effect of N timing was examined using two treatments (56 and 112 kg N ha -1 as urea) applied in May. All other treatments were broadcast in April. Treatment structure employed at both locations is reported in Table 2. Dead forage in non-burned plots was mowed prior to fertilizer application using a custom-built forage harvester (Norton et al., 1995) and collected biomass was removed from the experimental area. Burning was not accomplished at Bessie in any year due to lack of biomass present. However, standing dead forage was removed from all plots using the forage harvester. Nitrogen applications were made using a conventional fertilizer spreader. Treatment application and harvest dates for both locations are reported in Table 3. Weed control was administered at Bessie using 2,4-D at the time of the April 1995 fertilizer applications. Weed control at Stillwater was not required. A total of seven and five harvests were collected at Stillwater and Bessie, respectively, over a 3-yr period. A 7.30 m2 area was harvested at a height of 7.62 cm from each plot using the forage harvester and subsampled for moisture and total N analysis. Total N in the forage was determined using a ‘Carlo-Erba 1500’ dry combustion analyzer. Total N uptake was subsequently calculated in order to evaluate nitrogen use efficiency for each treatment. Significant treatment differences were determined using analyses of variance and single degree of freedom non-orthogonal contrasts (SAS, 1990).
RESULTS AND DISCUSSION
Stillwater

OSU Soil Fertility Research 1997 Page 107
Analysis of variance and treatment means for yield, protein, and total N uptake are reported in Table 4. No significant differences in bluestem forage yield could be attributed to source of fertilizer N. The effect of spring burning on total production was also found to be non-significant. A highly significant dry matter yield response to applied N up to 224 kg N ha-1 was found (Figure 1). The maximum yielding treatment (3-yr average) was 224 kg N ha-1 as urea applied in April on non-burned plots (4.6 Mg ha-1). The addition of a 448 kg ha-1 rate resulted in decreased yields (Figure 1). This indicates that 448 kg N ha-1 is beyond the rate required for maximum yield by bluestem. Yield levels were significantly greater at the 56 and 112 kg N ha-1 rates when urea was applied to non-burned plots in May as compared to April (Figure 2). Protein levels also increased with increasing N rate (Figure 3). Total N uptake was also significantly affected by N rate (Figure 4). Total N uptake was significantly greater when N was applied in May vs. April (Figure 4). No weeds were observed at Stillwater in the plots receiving N rates greater than 56 kg ha-1. However, weed presence in the surrounding pasture was evident. This suggests that fertilizer use in bluestem can result in suppression of undesirable weed species by increasing the competitiveness of the grass. Nitrogen use efficiency was greatest when 112 kg N ha-1 was applied in May (35.6%).
Bessie Results at Bessie were similar to those at Stillwater. Analysis of variance and
treatment means for yield, protein, and total N uptake are reported in Table 5. Non-burned plots showed a significant response to applied N up to 224 kg N ha -1 for both sources with the highest yielding treatment being 224 kg N ha-1, as urea applied in April, which produced an average of 3.8 Mg ha-1 over the 3-yr period (Figure 1). As was the case at Stillwater, the addition of the 448 kg ha-1 rate resulted in a yield decrease. Results from Bessie also indicated a significant increase in yield due to application of 112 kg N ha-1 in May vs. April (Figure 2). Total annual rainfall at Bessie was less than the normal average (76.6 cm) in both 1994 (65.2 cm) and 1996 (72.2 cm). A very dry growing season in 1994 (19.3 cm) contributed to the low average yields compared with those of Stillwater which received annual rainfall close to or exceeding normal each year of the study (94.3 cm). No significant difference in yield was found to exist due to source of applied N. The effect on protein content was consistent with that found at Stillwater (Figure 3). Applying N in May at the 112 kg ha-1 rate resulted in significantly higher protein levels vs. April applications (Figure 3). Total N uptake at Bessie was also significantly affected by N rate with no regard to source (Figure 4), but resulted in much lower amounts compared with Stillwater. This resulted in Bessie having lower N use efficiency rates than Stillwater. Nitrogen use efficiency at Bessie was greatest when 112 kg N ha-1 was applied in May (20%).
ECONOMIC ANALYSIS
Cost analysis for each location was performed to determine if any of these treatments would be economically feasible. A selling price for bluestem hay was determined to be $55.13 Mg-1. Bale weight was presumed to be 454 kg. Costs associated with bluestem hay production were fertilizer (ammonium nitrate-$.533 kg N -1, urea-$.573 kg N-1), application ($4.94 ha-1), swathing ($24.69 ha-1 cutting-1), and baling ($10

Page 108 1997 OSU Soil Fertility Research
bale-1). The Stillwater location resulted in both May applications (56 and 112 kg N ha -1
as urea) resulting in net returns of $91.36 and $76.54 ha -1, respectively. Check plots (0 N applied) averaged a net return of $58.02 ha-1. At Bessie, the 112 kg N ha-1 as urea in May was the only treatment, including checks, resulting in a net return ($9.88 ha-1). Fertilization of bluestem also increased protein levels, resulting in a higher quality hay being produced.
CONCLUSIONS
Applications of N fertilizer to bluestem increased yield, protein, and N uptake up to 224 kg N ha-1. Nitrogen use efficiency rates were greatest when 112 kg N ha-1 was applied in May. Maximum efficiency rates at Stillwater and Bessie were 35.6% and 20%, respectively. Fertilizer applied in May (56 and 112 kg N ha-1) at Stillwater resulted in net returns of $91.36 and $76.54 ha-1, respectively. A May application of 112 kg N ha-
1 at Bessie resulted in a net return of $9.88 ha -1. Although these returns were based on commercial hay production, and would be much greater in a pasture situation, increased fertility of bluestem pastures can be beneficial in other ways. Reduced weed pressure was observed in plots receiving N rates greater than 56 kg N ha -1. However, weed presence in the surrounding pasture was evident. This suggests that fertilizer use in bluestem can result in suppression of undesirable weed species by increasing the competitiveness of the grass. Increased N uptake and protein levels in bluestem hay were also shown to be a result of N fertilization.
REFERENCESBerg, William A. 1990. Old world bluestem response to nitrogen fertilization. J. Range Manage.
43:265-270.
Berg, William A. 1993. Old world bluestem response to fire and nitrogen fertilizers. J. Range Manage. 46:421-425.
Berg, William A. and Phillip L. Sims. 1995. Nitrogen fertilizer use efficiency in steer gain on old world bluestem. J. Range Manage. 48:465-469.
Brejda, John J., James R. Brown, and Calvin L. Hoenshell. 1995. Indiangrass and caucasian bluestem responses to different nitrogen sources and rates in the Ozarks. J. Range Manage. 48:172-180.
Mitchell, Robert B., Robert A. Masters, Steven S. Waller, Kenneth J. Moore, and Lowell E. Moser. 1994. Big bluestem production and forage quality responses to burning date and fertilizer in tallgrass prairies. J. Prod. Agric. 7:355-359.
Norton, S.L., W.E. Thomason, S.B. Phillips, S.E. Taylor, and W.R. Raun. 1995. Modification of a self propelled rotary mower for bermudagrass, alfalfa, and wheat forage harvest. In Agronomy abstracts. ASA, Madison, WI.
SAS Institute. 1990. SAS/STAT user’s guide. Release 6.03 ed. SAS Inst., Cary, NC.
Stallcup, O.T., K.E. Harrison, P. Bayley, D.L. Kreider, Z. Johnson, and L.B. Daniels. 1987. Responses in nutritive characteristics of plains bluestem (Bothriochloa ischaemum) to varying levels of nitrogen fertilization. Proc. Forage Grassl. Conf. 285-292.

OSU Soil Fertility Research 1997 Page 109
Wedin, David A. and David Tilman. 1990. Species effects on nitrogen cycling: a test with perennial grasses. Oecologia. 84:433-441.
Table 1. Initial soil test characteristics for Stillwater and Bessie, OK.______________________________________________________Location %C %N NH4-N NO3-N P K pH______________________________________________________
------------mg kg-1------------Stillwater 1.70 0.16 7.30 1.61 6.03 222 6.3Bessie 0.95 0.10 8.27 1.73 5.04 233 7.7______________________________________________________%C (organic C), %N (total N) - dry combustion; NH4-N, NO3-N - 2M KClextract; P, K - Mehlich III; pH - 1:1 soil-water.
Table 2. Treatment structure employed at Bessie and Stillwater, OK._____________________________________________________________________
Treatment N Rate (kg ha-1) N Source Time of Application Spring Burning_____________________________________________________________________
1. 0 -- -- --2. 54 AN April --3. 112 AN April --4. 224 AN April --5. 54 UR April --6. 112 UR April --7. 224 UR April --8. 0 -- April Yes9. 54 UR April Yes10. 112 UR April Yes11. 54 AN April Yes12. 112 AN April Yes13. 54 UR May --14. 112 UR May --15. 448 AN April --16. 448 UR April --
____________________________________________________________________AN-ammonium nitrate (34-0-0), UR-urea (46-0-0)
Table 3. Dates for fertilizer N applications and forage harvests at Bessie and Stillwater,OK._____________________________________________________________________________Location Year Burned April N applied May N applied Forage Harvests_____________________________________________________________________________Bessie 1994 -- 4-20 5-1 6-23Bessie 1995 -- 5-2 5-18 7-20, 10-5Bessie 1996 -- 4-25 5-15 7-2, 10-16
Stillwater 1994 3-29 4-25 5-9 6-17, 8-8, 10-16Stillwater 1995 3-31 4-28 5-15 7-6, 10-4Stillwater 1996 3-30 4-29 5-16 7-1, 9-23_____________________________________________________________________________

Page 110 1997 OSU Soil Fertility Research
Table 4. Analysis of variance, associated contrasts, and average treatment means (1994-1996) for yield, protein, and total N uptake, Stillwater, OK._______________________________________________________________
Source of df Yield, Protein, N uptake,variation Mg ha-1 % kg ha-1
_______________________________________________________________ ----------------Mean Squares----------------------
Rep 2 22290.60 0.61 26.19Trt 15 1447374.70*** 10.34** 406.90***Error 28 128776.40 4.34 21.83
ContrastsAN_lin 1 5132787.93*** 15.71*** 1166.37***UR_lin 1 4212373.86*** 10.56*** 688.39***burn_noburn 1 8540.92 0.07 3.62AN vs UR 1 250947.55 1.47 20.84April vs May 1 873341.21** 0.55 172.63**
----------------------------------------Treatment Means-----------------------------------Treatment Yield, Protein, N uptake,
Mg ha-1 % kg ha-1
______________________________________________________________1 2.1 6.8 24.22 2.9 7.2 35.03 3.5 8.0 47.24 3.8 9.2 56.85 2.8 7.2 32.86 3.7 7.9 48.27 4.6 8.5 65.18 2.1 6.8 22.59 3.0 7.3 34.810 3.7 7.8 46.511 2.3 7.2 26.712 3.9 7.8 50.713 2.1 9.6 50.714 4.2 8.8 55.415 2.1 9.6 50.716 2.9 9.5 59.6
______________________________________________________________***, **- significant at the 0.001 and 0.01 probability levels respectively.

OSU Soil Fertility Research 1997 Page 111
Table 5. Analysis of variance, associated contrasts, and average treatment means (1994-1996) for yield, protein, and total N uptake, Bessie, OK.
_______________________________________________________________Source of df Yield, Protein, N uptake,variation Mg ha-1 % kg ha-1
_______________________________________________________________----------------Mean Squares----------------------
Rep 2 554147.20 22.96* 18.10Trt 15 1141344.40*** 21.34*** 244.57***Error 28 268723.20 7.07 39.93
ContrastsAN_lin 1 5123373.52*** 20.53*** 678.12***UR_lin 1 1004852.58*** 31.95*** 237.40***burn_noburn 1 54761.81 0.09 9.47AN vs UR 1 131555.09 7.34* 1.14April vs May 1 833604.62* 7.37* 113.59*
----------------------------------------Treatment Means-----------------------------------Treatment Yield, Protein, N uptake,
Mg ha-1 % kg ha-1
______________________________________________________________1 1.2 6.1 11.52 1.7 7.0 17.13 2.7 7.5 31.14 2.9 9.4 39.35 1.9 7.2 19.86 2.2 6.6 22.57 3.8 8.1 47.08 1.4 6.0 14.39 1.7 6.8 16.210 2.5 7.6 27.311 2.4 6.9 24.512 2.4 8.0 28.413 2.0 7.5 20.814 3.3 7.5 35.415 3.0 9.8 64.016 2.5 8.9 51.5
______________________________________________________________________________***, **, *- significant at the 0.001, 0.01, and 0.05 probability levels respectively.

Page 112 1997 OSU Soil Fertility Research
CHECK 56 112 2240
1.5
3.0
4.5
6.0A
VER
AG
E YI
ELD
, Mg
ha-1
N APPLIED, kg ha-1
448
STILLWATER SED = 0.33 Mg ha-1
BESSIE SED = 0.47 Mg ha-1
Figure 1. Average bluestem forage yield response to applied N fertilizer at Stillwater and Bessie, OK, 1994 to 1996.
56 112 560
1.5
3.0
4.5
6.0
AVE
RA
GE
YIEL
D, M
g ha
-1
N APPLIED, kg ha-1
112
STILLWATER SED = 0.33 Mg ha-1
BESSIE SED = 0.47 Mg ha-1
APRIL MAY
Figure 2. Bluestem forage yield response to time of fertilizer application (April vs. May).

OSU Soil Fertility Research 1997 Page 113
CHECK 56 112 2240
3.0
6.0
9.0
12.0
AVE
RA
GE
PRO
TEIN
, %
N APPLIED, kg ha-1
448
STILLWATER BESSIE
56 112MAY MAY
Figure 3. Average protein content of bluestem forage, 1994 to 1996.
CHECK 56 112 2240
20
40
60
80
AVE
RA
GE
N U
PTA
KE,
kg
ha-1
N APPLIED, kg ha-1
448
STILLWATER SED = 4.3 kg ha-1 BESSIE
56 112MAY MAY
SED = 5.8 kg ha-1
Figure 4. Average nitrogen uptake, Stillwater and Bessie, OK, 1994 to 1996.

Page 114 1997 OSU Soil Fertility Research
Use of Reflectometry for Determination of Nitrate-Nitrogen in Well Water
S.B. Phillips, N.T. Basta, and W.R. Raun
ABSTRACTRecurrent monitoring of water wells is necessary to ensure that NO3-N concentrations in groundwater do not exceed 10 mg L -1, the maximum contaminant level set by the U.S. Environmental Protection Agency. Continuous chemical analysis is often a time consuming and expensive process. A recently developed ‘Reflectoquant Analysis System’, which employs reflectometry techniques, may offer a simple and accurate method for NO3-N analysis. The objective of this study was to evaluate the ‘Reflectoquant Analysis System’ as an alternative method for determination of NO3-N in well water. Water samples were collected from forty two wells in Oklahoma. The samples were analyzed using the ‘Reflectoquant Analysis System’, automated cadmium reduction (Griess-Ilosvay), ion chromatography, and phenoldisulfonic acid procedures. The linear range of the ‘Reflectoquant Analysis System’ is 1.1 to 50.6 mg L -1
NO3-N. Samples exceeding this range must be diluted before analysis is performed. Simple correlation was high (r2 > 0.96) among the four procedures evaluated and linear regression equations resulted in non-significant differences among slopes. Population means obtained using the four methods were very similar. For this sample of wells, the ‘Reflectoquant Analysis System’ was precise and provided NO3-N analysis of water samples equivalent to standard methods. Other advantages of the ‘Reflectoquant Analysis System’ are short analytical times, reduced operator training period, and competitive costs compared to standard methods.
INTRODUCTION
itrate-nitrogen (NO3-N) contamination of groundwater is of local, regional, and national concern. Due to possible health risks associated with consumption of NO3-N contaminated water, the U.S. Environmental Protection Agency has set
the maximum contaminant level for NO3-N in drinking water at 10 mg L-1 (Fedkiw, 1991). Recurrent monitoring of water wells is necessary in order to ensure that NO 3-N concentrations do not exceed this limit. This is accomplished by chemical analysis of well water by using one of several standard analytical procedures. A new technology for NO3-N analysis is the ‘Reflectoquant Analysis System’ developed by E. Merck of Darmstadt, Germany. This system employs reflectometry, a procedure that currently has not been correlated with other methods of NO3-N determination, and which offers fast, simple, portable, and cost effective NO3-N analysis data in the field. The objective of this study was to evaluate the use of the ‘Reflectoquant Analysis System’ as an alternative method for determining NO3-N concentration in groundwater.
N

OSU Soil Fertility Research 1997 Page 115
MATERIALS AND METHODS
Forty-two water wells in Grant, Garfield, and Kingfisher counties in Oklahoma were selected for sampling. These wells were located on sites that represented a variety of land uses and the groundwater beneath these locations provided a large range of NO3-N concentrations. Duplicate samples were taken from each water well in December, 1994, via hydrants, windmills, and/or a teflon bailer. All water samples were collected and handled according to proper sampling protocol (Scalf et al., 1981). Samples were stored in 250 ml plastic bottles at -1°C until analysis was performed. Nitrate-N in the water samples was determined using four analytical methods. One method utilized was phenoldisulfonic acid (Bremner, 1965; Chapman and Pratt, 1961; Snell and Snell, 1949), one of the earliest detection methods used for NO3-N analysis. This colorimetric procedure is tedious, time consuming, and has been found to be subject to several interferences. Nitrate-N concentration was also determined using the ‘Lachat-Quickchem’ automated flow injection system which employs automated cadmium reduction of nitrate to nitrite and measurement of nitrite by the Griess-Ilosvay method (Henrickson and Selmer-Olsen, 1970; Jackson et al., 1975; Keeney and Nelson, 1982). This procedure is currently used by many industrial and public laboratories. In addition to NO3-N, chloride and sulfate were also determined by ion chromatography using U.S. EPA method 300.0 (U.S.EPA, 1993). Ion chromatography allowed simultaneous determination of potential Cl- or SO4
-2 interferences. Iron was also analyzed as a possible interfering ion with the ‘Reflectoquant’ method by atomic absorption. The fourth method used to determine NO3-N in the samples was the ‘Reflectoquant Analysis System’. This method features a portable, hand held, battery operated instrument which is calibrated using a preprogrammed bar code. In this method, a chemically treated test strip is dipped into the sample. Nitrate in the sample is reduced to nitrite by a reduction agent. This nitrite reacts with an aromatic amine to form a diazonium salt. The salt then reacts with N-(1-naphthyl)-ethylene-diamine to form a red-violet dye. The concentration of the dye is then determined reflectometrically. The precision of the ‘Reflectoquant Analysis System’ was also evaluated in this study by determining NO3-N concentration, replicated five times on three randomly selected samples. Analysis of variance, correlation analysis, and mean separation were performed using procedures outlined by the SAS institute (SAS, 1990).
RESULTS AND DISCUSSION
The data were analyzed as an entire population including all 42 wells and excluding wells 33 and 50 which had extremely high NO3-N concentrations. This was performed because the concentrations for these wells were separated from the rest of the observations by an amount great enough to cause an extraordinary influence on the mean. A comparison of the mean and standard deviation obtained for the population of samples tested by each method is reported in Table 1. The error term associated with the mean for samples tested using the ‘Reflectoquant Analysis System’ was lower than those generated with the other methods with the exception of phenoldisulfonic acid. However, this term contains both random and bias errors in unknown quantities. The ‘Reflectoquant Analysis System’ was found to be extremely precise as is reported in Table 2.

Page 116 1997 OSU Soil Fertility Research
Linear regression equations were developed and correlation of the ‘Reflectoquant Analysis System’ with automated cadmium reduction, ion chromatography, and phenoldisulfonic acid was determined. Regression equations for combinations among the four procedures are reported in Table 3. Coefficients of determination (r2) for all regression equations were highly significant (p < .0001). All methods exhibited highly significant positive correlation with one another, thus, demonstrating the feasibility of interchanging methods. Slopes for automated cadmium reduction predicting the ‘Reflectoquant Analysis System’ and automated cadmium reduction predicting phenoldisulfonic acid were not different, indicating that a direct relationship between the ‘Reflectoquant Analysis System’ and phenoldisulfonic acid exists.
The literature accompanying the Reflectoquant states that the instrument is subject to interfering ions including Cl- (>500 mg L-1), NO2
- (>0.50 mg L-1), and Fe2+
(>10 mg L-1). While the phenoldisulfonic acid procedure is subject to similar interferences (Chapman and Pratt, 1961), neither ion chromatography nor cadmium reduction (Keeney and Nelson, 1982) is subject to organic matter or ion interference. Interferences due to chloride, sulfate, and iron concentrations in the samples were not detected for all methods evaluated. As would be expected, the largest differences among procedures were found in those wells where NO3-N concentrations were extremely high (>50 mg L-1).
Operating costs excluding labor for the ‘Reflectoquant Analysis System’ were determined to be approximately $89.90/100 samples. In comparison, costs associated with the automated cadmium reduction and phenoldisulfonic acid procedures were $50.00/100 samples and $17.50/100 samples, respectively. Ion chromatography rendered the highest cost/sample analysis at $100.00/100 samples. When expense is the only limiting factor, the phenoldisulfonic acid procedure provides the lowest cost/sample analysis. However, when time, labor, or revenue is to be considered, the ‘Reflectoquant Analysis System’ is the more economical method. The number of samples that can be analyzed in a day using the ‘Reflectoquant Analysis System’ exceeds that of the other methods by an amount large enough to justify its use, despite the higher cost.
CONCLUSIONS
The ‘Reflectoquant Analysis System’ was found to be highly correlated with phenoldisulfonic acid, ion chromatography, and automated cadmium reduction procedures for NO3-N analysis of well water samples. It is also faster and easier to operate than the wet chemistry procedures evaluated, and requires minimal preparation or handling of chemicals by the user. Water samples with NO3-N greater than 50.6 mg L-
1exceed the linear range of the test strips (1.1 to 50.6 mg L-1 NO3-N). These samples have to be diluted before analysis using the ‘Reflectoquant Analysis System’. The precision of the ‘Reflectoquant Analysis System’ was found to be exceptional. Regression equations reflecting the capability of one method to predict the output of another were highly correlated. The ‘Reflectoquant Analysis System’ is not the least expensive procedure, but when time and revenue are factors, it is the most economical. Therefore, the ‘Reflectoquant Analysis System’ could be an effective alternative to using ion chromatography, automated cadmium reduction or phenoldisulfonic acid for determining NO3-N concentration in groundwater.

OSU Soil Fertility Research 1997 Page 117
REFERENCESBremner, J.M. 1965. Inorganic forms of nitrogen. p. 1179-1237. In C.A. Black et al. (ed.) Methods of soil
analysis. Part 2. Agron. Monogr. 9. ASA and SSSA, Madison, WI.
Chapman, H.D., and P.F. Pratt. 1961. Methods of analysis for soils, plants, and waters. Univ. of California Div. of Agric. Sci., Riverside, CA.
Fedkiw, John. 1991. Nitrate occurrence in U.S. waters (and related questions) A reference summary of published sources from an agricultural perspective. USDA, Washington, D.C. Sept. 1991.
Henrikson, H., and A.A. Selmer-Olsen. 1970. Automatic methods for determining nitrate and nitrite in water and soil extracts. Analyst 95:514-518.
Jackson, W.A., C.E. Frost, and D.M. Hildreth. 1975. Versatile multi-range analytical manifold for automated analysis of nitrate-N. Soil Sci. Soc. Am. Proc. 39:592-593.
Keeney D.R., and D.W. Nelson. 1982. Nitrogen-inorganicforms. p. 643-698. In A.L. Page (ed.) Methods of soil analysis. Part 2. 2nd ed. Agron. Monogr. 9. ASA and SSSA, Madison, WI.
SAS Institute. 1990. SAS/STAT user’s guide. Release6.03 ed. SAS Inst., Cary, NC.
Scalf, M.R., J.F. McNabb, W.J. Dunlap, R.L. Cosby. 1981. Manual of groundwater quality sampling procedures. USEPA Rep. 600/2-81-160 U.S. Gov. Print. Office, Washington DC.
Snell, F.D., and C.T. Snell. 1949. Colorimteric methods of analysis, Vol. 2. 3rd ed. D. Van Nostrand Co., NY.
U.S. Environmental Protection Agency. 1993.Determination of inorganic anions by ion chromatography-Method 300.0, U.S. EPA Environmental Monitoring and Systems Laboratory, Cincinnati, OH.
Table 1. Population means and standard deviations by method for all wells, and allwells excluding numbers 33 and 50. ______________________________________________
Method Mean NO3-N SD(mg L-1)
-----------------------------All Wells----------------------------------Reflectoquant 12.82 17.91Phenoldisulfonic acid 12.44 14.57Ion chromatography 13.72 19.92Cadmium reduction 14.06 18.42
----------All wells excluding numbers 33 and 50--------------Reflectoquant 9.11 5.90Phenoldisulfonic acid 9.55 5.90Ion chromatography 9.62 6.57Cadmium reduction 10.31 6.85______________________________________________

Page 118 1997 OSU Soil Fertility Research
Table 2. Estimated precision of the four procedures used to determine NO3-N in well water (replicated analysis on the same sample).______________________________________________
Well Mean NO3-N SD %CV (mg L-1)
------------------------- Reflectoquant-----------------------------
11 1.00 0.11 11.2017 28.30 1.80 6.3029 5.50 0.28 5.00
--------------------- Cadmium Reduction-------------------------
11 1.55 0.04 2.5017 29.04 0.23 0.7929 5.96 0.21 3.50
---------------------Phenoldisulfonic Acid-----------------------
11 1.71 0.56 32.7017 22.02 0.72 3.2029 4.82 1.00 20.70
----------------------Ion Chromatography------------------------
11 1.00 0.02 1.7017 30.10 0.19 0.6029 5.48 0.08 1.50
______________________________________________
Table 3. Linear regression equations and correlation among the four procedures used to determine well water NO3-N.________________________________________________________________________
standard error of Equation df r2 slope / intercept RAS dependent on PDA
RAS = -2.11 + 1.2 (PDA) 76 .96** .026 / .528
RAS dependent on ACR
RAS = -.74 + .97 (ACR) 76 .99** .013 / .316
RAS dependent on IC
RAS = .52 + .90 (IC) 76 .99** .007 / .189

OSU Soil Fertility Research 1997 Page 119
PDA dependent on ACR
PDA = 1.44 + .78 (ACR) 76 .97** .015 / .372______________________________________________________________________________ ** - significant at .0001 probability level, RAS-Reflectoquant Analysis System, PDA - phenoldisulfonic acid, ACR - automated cadmium reduction, IC - ion chromatography
Effect of Nitrogen Rate on Plant Nitrogen Loss in Winter Wheat Varieties
Fred K. Kanampiu, William R. Raun, Gordon V. Johnson and M.P. Anderson
ABSTRACTGaseous nitrogen (N) loss from winter wheat (Triticum aestivum L.) plants has been identified but has not been simultaneously evaluated for several genotypes grown under different N fertility. Two field experiments were initiated in 1993 and 1994 at the Agronomy Research Station in Stillwater and Perkins to estimate plant N loss from several cultivars as a function of N applied and to characterize N use efficiency (NUE). A total of five cultivars were evaluated at preplant N rates ranging from 30 to 180 kg ha -
1. Nitrogen loss was estimated as the difference between total forage N accumulated at anthesis and the total (grain + straw) N at harvest. Forage, grain, straw yield, N uptake, and N loss increased with increasing N applied at both Stillwater and Perkins. Significant differences were observed among varieties for yield, N uptake, N loss and components of NUE in forage, grain, straw and grain + straw. Estimates of N loss over this two year period ranged from 4.0 to 27.9 kg ha-1 (7.7 to 59.4 % of total forage N at anthesis). Most N losses occurred between anthesis and 14 days post-anthesis. Avoiding excess N application would reduce N loss and increase NUE in winter wheat varieties. Varieties with high harvest index (grain yield/total biomass) and low forage yield had low plant N loss. Estimates of plant loss suggest N balance studies should consider this variable before assuming that unaccounted N was lost to leaching and denitrification.
INTRODUCTION
orldwide interest associated with increasing cereal grain protein has focused added attention on improving the utilization of N in cereals (Desai and Bhatia, 1978). The effectiveness with which N is used by wheat and other
cereals has become increasingly important because of increased costs associated with the manufacture and distribution of N fertilizer. Increased use of fertilizer N in agricultural production has raised concerns because of the potential for groundwater contamination. This concern has pressured farmers to use N more efficiently.
WNitrogen use efficiency is defined as grain production per unit of N available in
the soil (Moll et al., 1982; Van Sanford and Mackown, 1986). Nitrogen uptake and partitioning between straw and grain are the two major components of N economy in plants (Desai and Bhatia, 1978). Partitioning N between grain and straw is important in

Page 120 1997 OSU Soil Fertility Research
cereal crops that are grown in areas with depleted soil N and moisture during the grain filling period. Uptake efficiency (total shoot N/soil N supply) and utilization (grain yield/total shoot N) of N in the production of grain requires that the processes of uptake, translocation, assimilation, and redistribution of N operate effectively. The relative contribution of these processes to genotypic differences in NUE is unknown and varies among genetic populations and among environments, including N supply. Moll et al. (1982) observed an interaction between corn hybrids and N levels for all traits except grain yield. At low N supply, differences among hybrids for NUE were largely due to variation in utilization of accumulated N, but with high N they were largely due to variation in uptake efficiency. They concluded that variation of NUE appeared to result from differences among genotypes and levels of N supplied.
Wuest and Cassman (1992) found recovery of N applied at planting ranged from 30 to 55 %, while recovery of N applied at anthesis ranged from 55 to 80 % in irrigated wheat. The amount of fertilizer N applied at anthesis had the greatest influence on post-anthesis N uptake, which ranged from 17 to 77 kg N ha-1. This shows that late N application can be efficiently taken up by plants. Grain protein levels may increase with late-season N applications (Wuest and Cassman, 1992). Fertilizer N use efficiency varies considerably depending upon the native soil N supply, previous N uptake, developmental stage of the plant when supplemental N is applied, and yield potential (Wuest and Cassman, 1992). Optimizing fertilizer N use, achieving acceptable grain yield, and maintaining adequate grain protein requires knowledge of expected N uptake efficiency and utilization within the plant in relation to the rate and timing of N applied.
Calculation of N fertilizer use efficiency is typically based on the amount of N found in the crop at maturity. It is commonly perceived that maximum accumulation of N by plants occurs at maturity; however, it is more typical for maximum N accumulation of grain crops to be reached sometime between pollination and maturity (Francis, 1993a). Dhugga and Waines (1989) found differences among wheat genotypes for shoot N accumulation before and after anthesis at the highest soil N level. At this level, some genotypes either stopped accumulating or showed a net loss of shoot N between anthesis and maturity, which appeared to be associated with superior preanthesis N accumulation capacity and reduced grain N yield of such genotypes.
Plant shoots may be a significant source of N loss in crops. Volatile N has been found to be released from plant tissue with NH3 being the prevalent form of post-anthesis N loss (Harper et al., 1987). Francis et al. (1993b) found maximum net N accumulation in corn to occur during early reproductive development (R1 - R3) followed by a subsequent decline. They found plant N loss could account for 52 to 73 % of the unaccounted N in 15N balance calculations. Ammonia loss rates on a leaf-area basis from wheat were found to be similar for low and high N plants despite significantly high N concentrations in high N plants (Parton et al., 1988). They found twice the leaf area was attained by the high N plants, resulting in NH3 volatilization rates roughly twice those observed in the low-N plants. Nitrogen loss from wheat plants through aerial NH3
transport has also been found during periods of adequate available soil N (Harper et al., 1987) and during plant senescence (Harper et al., 1987; Parton et al., 1988). Harper et al. (1987) found largest aerial loss to occur during a 20-day period after fertilizer application (11.4 % of the applied fertilizer) while additional losses (9.8 %) were observed from anthesis to harvest. The former aerial NH3 losses could have been due to overloading of

OSU Soil Fertility Research 1997 Page 121
plant N as NH4+ whereas the latter could be due to plant senescence and inefficient
redistribution of N within the plant. High N fertility levels often increase leaf area indices, but the greatest difference during maturation is the ability to maintain a larger number of green leaves late in the season as compared with low N fertility levels. Plant N losses could account for much of the N losses found in soil N balance studies and certainly influence calculations involving fertilizer N efficiency (Daigger et al., 1976). Failure to include direct plant N losses when calculating an N budget can lead to overestimation of losses from the soil by denitrification, leaching, and ammonia volatilization (Francis et al., 1993b). Proper accounting for volatile plant N losses may play an important role in developing cropping systems that have improved N fertilizer use efficiencies and reduced environmental impact.
Remobilization of vegetative N during grain fill in wheat contributes significantly to final grain N content. Van Sanford and Mackown (1987), working with soft red winter wheat, detected significant cultivar differences in N remobilization from the flag leaf, peduncle, and lower culm. The proportion of N accumulated by the spike ranged among cultivars from 51 to 91 %. They also found 83 % of the total above ground N at maturity to be present in the plant at anthesis. An analysis of cultivar differences indicated that all of the cultivar variation in final spike N could be associated with variation in total N uptake. Higher post-anthesis N uptake was associated with lower N utilization efficiency (spike weight/total plant N), higher grain N concentration, and lower grain yields (Van Sanford and Mackown, 1987).
Although soil fertility research programs have been successful in establishing fertilizer N optimums for selected wheat varieties, little work has been done to improve genetic NUE in wheat. Therefore, plant breeders need to develop cultivars that can absorb N more efficiently from the soil and effectively partition absorbed N to the grain. Such cultivars could minimize loss of N from the soil and make more economic use of the absorbed N (Dhugga and Waines, 1989). Because crop fertilizer recovery seldom exceeds 50%, the potential for increasing NUE has stimulated new research. It is the unaccounted portion in the crop that is currently being addressed in research. Effective use of applied N by the crop will reduce input costs per unit of product harvested. Identification of N use efficient wheat varieties could decrease N fertilizer requirements and limit the potential for NO3-N leaching losses. More studies are required to identify wheat varieties which maintain high yield potential with lower N fertilizer requirements.The objective of this research was to estimate plant N loss from several wheat cultivars and experimental populations as a function of N applied and to characterize nitrogen use efficiency.
MATERIALS AND METHODS
Two field experiments were initiated in October 1993 and 1994 at the Agronomy Research Station in Stillwater and Perkins, OK to estimate plant N loss from several wheat cultivars as a function of N applied, and to characterize NUE as affected by time of N fertilization. Four wheat varieties (Karl, 2180, TAM W-101, and Chisholm) were evaluated at both locations. In addition to these four, ‘Longhorn’ was also evaluated at Perkins. At both locations, plot sizes were 1.13 x 15.2 m (5 rows/plot). All cultivars and experimental populations were evaluated at preplant N rates of 0, 30, 60 and 120 kg ha-1

Page 122 1997 OSU Soil Fertility Research
(Stillwater) and 0, 45, 90 and 180 kg ha-1 (Perkins). Urea ammonium nitrate (UAN, 28-0-0) was used as the N source applied at planting for all N treatments. A complete factorial arrangement of treatments was used (N rate x genotype) in a randomized complete block experimental design with four and three replications for Stillwater and Perkins, respectively. Soil classification, initial soil characteristics, harvest areas and harvest dates are reported for Stillwater and Perkins in Tables 1 and 2. Sufficient area was available in each plot to accommodate forage harvest and grain yield in separate areas of each plot. Forage harvests were obtained by hand clipping all plants 2 cm above the ground at anthesis. Subsamples from each respective harvest were collected for moisture and total N analysis. All forage and grain samples were ground in a large Wiley mill and later in an automated grinding unit to obtain finely ground forage, grain and straw subsamples. Total N was determined on forage, grain and straw samples using a Carlo-Erba NA 1500 dry combustion analyzer (Schepers et al., 1989). Nitrogen use efficiency was analyzed according to an expanded model of Moll et al. (1982). Nitrogen use efficiency for grain yield was partitioned into various components as follows:
Gw/Ns = grain weight/N supplyGw/Ns = (Nt/Ns)(Gw/Nt), whereNt/Ns = uptake efficiency = ratio of total plant to N supply per unit area,Nt = (grain yield)(grain N) + (dry wt of stem and leaves)(N in stem and leaves),Gw/Nt = utilization efficiency = (Gw/Ng)(Ng/Nt), whereGw/Ng = grain weight/grain N andNg/Nt = translocation efficiency = proportion of total plant N in the grain.
Nitrogen loss was estimated as the difference between total forage N accumulated at anthesis and the total (grain + straw) N at harvest. Data analysis was performed using SAS (SAS Institute Inc., 1988). Means were compared using Student-Newman-Keuls’ (SNK) test at the 5% significance level.
RESULTS AND DISCUSSION
At both locations, forage, grain and straw yield, and forage, grain, straw and grain + straw N uptake increased with increasing N applied (Tables 3 and 4). The exception to this was noted for straw yield at Stillwater. Interpretation of N rate and variety main effects was simplified at Stillwater since no N rate by variety interactions were found for any of the measured dependent variables (Table 3). At Perkins a highly significant N rate by variety interaction was found for grain and straw yield, and straw and grain + straw N uptake, thus restricting interpretation of main effect means (Table 4). At both locations there were differences among varieties for forage, grain and straw yield and forage, grain, straw and grain + straw N uptake. The cultivars Chisholm and TAM W-101 both had high yield and N uptake in forage, grain and grain + straw compared with other varieties at Stillwater. At Perkins, Chisholm, Karl, 2180 and Longhorn (which was not included at Stillwater) had high yield and N uptake in forage and grain.
Excluding NUE at Perkins, no N rate by variety interactions were found for N use efficiency variables (Tables 5 and 6). Increased fertilizer N generally decreased NUE, N uptake efficiency, N utilization efficiency, fraction of N translocated to grain and grain yield per grain N, but increased protein content and N loss (Tables 5 and 6). However,

OSU Soil Fertility Research 1997 Page 123
the increase in fraction of N translocated to the grain with increased fertilizer N at Perkins was not significant. Generally, percent protein and N loss were lower at Stillwater when compared to Perkins. The opposite was observed for other NUE components. Nitrogen loss ranged from 4.0 to 17.1 and 21.8 to 27.9 kg ha-1 (averaged over N rates) at Stillwater and Perkins, respectively. In terms of the proportion of N accumulated in the plants at anthesis, N loss ranged from 7.7 to 30.0 % and 53.2 to 59.4 % at Stillwater and Perkins, respectively. Similar results of N loss from wheat plants through aerial NH3 transport have also been found during periods when there is adequate available soil N (Harper et al., 1987).
Except for percent protein, grain yield per grain N and N loss at Stillwater and N utilization efficiency and N loss at Perkins, the varieties evaluated showed differences in NUE components (Tables 5 and 6). At Stillwater, Chisholm and TAM W-101 had higher NUE, N uptake efficiency and N utilization efficiency whereas at Perkins 2180 and Longhorn had higher N use and N uptake efficiency compared to other varieties evaluated. These results agree with the work of Daigger et al. (1976) and Dhugga and Waines (1989) who found differences among wheat genotypes for shoot N accumulation before and after anthesis. Differences between varieties were also found at various N rates for grain and straw yield, and straw and grain + straw N uptake and N use efficiency at Perkins (Table 7). Similar differences were found for NUE at Stillwater. All evaluated varieties showed a decrease in N uptake between anthesis and maturity at Perkins (Figure 1). Longhorn and 2180 had the highest N loss and Karl had the lowest. The loss was greater between anthesis and 14 days post-anthesis as compared to 14 days post-anthesis and maturity. This suggests that most N losses occurred prior to and early in the grain filling period when N is rapidly translocated from other plant parts to the head. During anthesis, protein in stems and leaves is degraded to its constituent amino acids and/or NH3. Ammonia assimilation occurs to incorporate the released N into amino acids. Depending on various factors such as temperature, light, wind, moisture, pH among others, NH3 formed during protein degradation can be lost from the plant by volatilization. Results from response surface modeling suggest that N loss increases with increasing forage yield and percent forage N. This indirectly suggests that cultivars with a high harvest index (grain yield/total biomass) and low forage yield will have low plant N loss. Estimates of plant N loss in this work also suggest that N balance studies should consider this variable before assuming that all unaccounted N was lost to leaching or denitrification.
It is important to note that estimates of plant N loss in this work have likely been underestimated since soil N uptake and plant N loss are dynamic processes which occur as the plant grows towards maturity. This is because our work did not identify the exact date (physiological stage) where N accumulated in wheat was at a maximum. Based on the literature cited, flowering was the best estimate for maximum N accumulation in wheat (Daigger et al., 1976). In addition, plant N loss as estimated here assumes that no added soil N uptake took place beyond flowering. This is somewhat unrealistic since we know that the wheat plant continues to assimilate soil N beyond flowering (Harper et al., 1987). Therefore continued plant loss of additional assimilated soil N (beyond flowering) would not be accounted for using our methods.

Page 124 1997 OSU Soil Fertility Research
CONCLUSIONS
Forage, grain, straw, total yield and N uptake, and N loss were significantly increased with increasing N applied. Nitrogen loss ranged from 4.0 to 26.3 and 11.2 to 27.9 kg ha-1 (averaged over N rates) at Stillwater and Perkins, respectively. Avoiding excess N application could reduce N losses and increase NUE in winter wheat varieties. Estimates of plant N loss from anthesis to 14 days post-anthesis were greater than that from 14 days post-anthesis to maturity. Results from response surface modeling suggest that N loss increased with increasing forage yield and percent forage N. This indirectly indicates that varieties with a high harvest index and low forage yield may have low plant N loss. Estimates of plant loss in this work suggest N balance studies should consider this variable before assuming that all unaccounted N was lost to leaching and denitrification.
REFERENCESDaigger, L.A., D.H. Sander, and G.A. Peterson. 1976. Nitrogen content of winter wheat during growth
and maturation. Agron. J. 68:815-818.
Dhugga, K.S. and J.G. Waines. 1989. Analysis of nitrogen accumulation and use in bread and durum wheat. Crop Sci. 29:1232-1239.
Desai, R.M. and C.R. Bhatia. 1978. Nitrogen uptake and nitrogen harvest index in durum wheat cultivars varying in their grain protein concentration. Euphytica. 27:561-566.
Francis, D. 1993a. Nitrogen loss from corn plants during grain fill. Better crops. p.16-19.
Francis, D.D., J.S. Schepers, and M.F. Vigil. 1993b. Post-anthesis nitrogen loss from corn. Agron. J. 85:659-663.
Harper, L.A., R.R. Sharpe, G.W. Langdale, and J.E. Giddens. 1987. Nitrogen cycling in a wheat crop: soil, plant, and aerial nitrogen transport. Agron. J. 79:965-973.
Moll, R.H., E.J. Kamprath, and W.A. Jackson. 1982. Analysis and interpretation of factors which contribute to efficiency of nitrogen utilization. Agron. J. 74:562-564.
Parton, W.J., J.A. Morgan, J.M. Allenhofen, and L.A. Harper. 1988. Ammonia volatilization from spring wheat plants. Agron. J. 80:419-425.
SAS Institute Inc. 1988. SAS procedures guide for personal computers, version 6 Edition. SAS institute Inc., Cary, NC, USA.
Schepers, J.S., D.D Francis, and M.T. Thompson. 1989. Simultaneous determination of total C, total N, and 15N on soil and plant material. Commun. in Soil Sci. Plant Anal. 20:949-959.
Van Sanford, D.A. and C.T. Mackown. 1986. Variation in nitrogen use efficiency among soft red winter wheat genotypes. Theor. Appl. Genet. 72:158-163.
Van Sanford, D.A. and C.T. Mackown. 1987. Cultivar differences in nitrogen remobilization during grain fill in soft red winter wheat. Crop Sci. 27:295-300.
Wuest, S.B. and K.G. Cassman. 1992. Fertilizer-nitrogen use efficiency of irrigated. wheat: I. Uptake efficiency of preplant versus late-season application. Agron. J. 84:682-688.

OSU Soil Fertility Research 1997 Page 125
Table 1. Soil Chemical Characteristics and Classification at Stillwater and Perkins, OK.
____________________________________________________________________________________Location pH NH4-N NO3-N P K Total N Organic C____________________________________________________________________________________
--------------------mg kg-1 --------------- --------- g kg-1 --------
Stillwater 5.5 10.2 5.5 38 20.9 0.67 6.4Classification: Kirkland silt loam (fine-mixed, thermic Udertic Paleustoll)
Perkins 6.0 19.1 6.5 11.8 29.5 0.66 7.4Classification: Teller sandy loam (fine-loamy, mixed, thermic Udic Argiustoll)____________________________________________________________________________________pH - 1:1 soil:water, K and P - Mehlich III, Organic C and Total N - dry combustion.
Table 2. Planting and Harvest Dates, Stillwater and Perkins, OK.___________________________________________________________________________
Stillwater Perkins___________________________________________________________________________Planting date: October 27, 1993 October 24, 1994
Forage at anthesis:harvest area 0.91 x 4.6 m 0.45 x 3 mharvest date May 12th, 1994 April 24th, 1995
Forage at post-anthesis:harvest area NA 0.45 x 3 mharvest date NA May 8th, 1995
Grain:harvest area: 1.14 x 10.6 m 1.13 x 9 mharvest date: June 20th, 1994 June 14th, 1995
Straw:harvest area: 1.14 x 10.6 m 1.13 x 9 mharvest date: June 20th, 1994 July 14th, 1995___________________________________________________________________________

OSU Soil Fertility Research 1997 Page 126
Table 3. Analysis of Variance, Means and Comparisons for Yield and Nitrogen Uptake, Stillwater, OK 1994._________________________________________________________________________________________________________________________
Forage Grain Straw Forage Grain Straw (Grain + Straw)-------------------yield, Mg ha-1 ----------------- ----------------------- nitrogen uptake, Mg ha-1 ----------------------
Source of variation df --------------------------------------------------------------- mean squares ------------------------------------------------------------------Replication 3 21.2** 0.3ns 0.1ns 0.008** 0.0002ns 0.0002** 0.0008*N rate 3 11.1** 1.8** 0.3ns 0.004** 0.001** 0.00002* 0.002**Variety 3 4.2** 4.4** 0.8* 0.001* 0.0005** 0.00008* 0.0003**N rate * variety 9 0.9ns 0.5ns 0.2ns 0.0004ns 0.00005ns 0.00001ns 0.00008nsResidual error 45 0.8 0.1 0.2 0.0003 0.0001 0.00001 0.0001
N rate, kg ha-1 ------------------------------------------------------------ means, Mg ha -1 ---------------------------------------------------------------- 0 3.51 1.50 1.99 0.050 0.032 0.011 0.043 30 3.97 1.84 1.74 0.059 0.041 0.010 0.051 60 4.68 2.05 1.77 0.071 0.047 0.012 0.059120 4.93 2.16 1.74 0.088 0.053 0.013 0.066
SED 0.32 0.14 0.15 0.006 0.004 0.001 0.004
Variety:Chisholm 4.68 2.23 1.79 0.073 0.049 0.010 0.059Karl 4.06 1.69 1.55 0.066 0.040 0.10 0.0502180 3.48 1.58 2.10 0.056 0.037 0.015 0.052TAM W-101 4.85 2.05 1.81 0.074 0.047 0.010 0.057
SED 0.32 0.14 0.15 0.006 0.004 0.001 0.004
Contrasts:N rate linear 1 ** ** ns ** ** ** **N rate quadratic 1 ns ns ns ns ns ns ns_________________________________________________________________________________________________________________________*, ** Significant at 0.05 and 0.01 probability levels, respectively. SED - standard error of the difference between two equally replicated means, ns - not significant.

OSU Soil Fertility Research 1997 Page 127
Table 4. Analysis of Variance, Means and Comparisons for Yield and Nitrogen Uptake, Perkins, OK 1995._________________________________________________________________________________________________________________________
Forage Grain Straw Forage Grain Straw (Grain + Straw)
-------------------yield, Mg ha-1 ----------------- ------------------------- nitrogen uptake, Mg ha-1
------------------------Source of variation df -------------------------------------------------------------- mean squares -------------------------------------------------------------------------Replication 2 2.5ns 0.04ns 0.1ns 0.002* 0.00004ns 0.00006ns 0.0002*N rate 3 1.9ns 0.2** 0.8** 0.003** 0.0004** 0.0002** 0.001**Variety 4 1.7ns 0.3** 5.2** 0.0003ns 0.00006* 0.0004** 0.0004**N rate * variety 12 1.0ns 0.06* 0.5** 0.0004ns 0.00004ns 0.00008* 0.0002**Residual error 34 0.8 0.03 0.1 0.0003 0.00002 0.00003 0.00006
N rate, kg ha-1 ------------------------------------------------------------------- means, Mg ha -1
----------------------------------------------------------------- 0 2.96 0.83 1.50 0.052 0.021 0.014 0.036 45 3.56 0.93 1.46 0.066 0.026 0.016 0.042 90 3.40 0.88 1.57 0.071 0.027 0.018 0.045180 3.80 1.12 1.98 0.087 0.034 0.023 0.057SED 0.34 0.07 0.13 0.007 0.002 0.002 0.003
Variety:Chisholm 3.31 0.90 1.28 0.063 0.026 0.016 0.041Karl 3.19 0.87 1.17 0.065 0.026 0.012 0.0392180 3.82 1.07 1.21 0.075 0.032 0.015 0.047TAM W-101 2.92 0.86 1.68 0.066 0.024 0.018 0.042Longhorn 3.95 1.02 2.80 0.077 0.027 0.028 0.055
SED 0.38 0.08 0.15 0.008 0.002 0.002 0.003Contrasts:N rate linear 1 * ** ** ** ** ** **N rate quadratic 1 ns ns ns ns ns ns ns_________________________________________________________________________________________________________________________*, ** Significant at 0.05 and 0.01 probability levels, respectively. SED - standard error of the difference between two equally replicated means, ns - not significant.

Page 128 1997 OSU Soil Fertility Research
Table 5. Analysis of Variance, Means and Comparisons for Nitrogen Use Efficiency Components, Stillwater, OK 1994._________________________________________________________________________________________________________________________
Protein N-use N-uptake N-utilization Fraction of Grain yield/ N loss% efficiency efficiency efficiency N translocated grain N (kg ha-1)
(Gw/Ns) (Nt/ Ns) (Gw/Nt) to grain(Ng/Nt) (Gw/Ng) (Na-Nh) Source of variation df -------------------------------------------------------------------- mean squares -----------------------------------------------------------------Replication 3 102.1** 48.8ns 0.20** 366.9** 0.01** 442.4** 3233.8**N rate 3 36.6** 7713.4** 5.47** 24.7ns 0.01** 109.3** 710.3*Variety 3 10.0ns 515.6** 0.11* 159.1** 0.04** 38.3ns 572.6nsN rate * variety 9 11.4ns 105.4ns 0.03ns 11.9ns 0.002ns 11.6ns 372.3nsResidual error 45 2.1 46.5 0.04 15.2 0.003 20.6 258.4
N rate, kg ha-1 ----------------------------------------------------------------------- means -----------------------------------------------------------------------0 12.1 0 0 35.4 0.74 47.6 7.730 12.9 61.5 1.7 36.2 0.80 45.3 8.260 13.1 34.2 1.0 35.7 0.80 44.6 12.9120 14.1 18.0 0.5 33.4 0.81 41.2 22.1SED 0.51 2.41 0.07 1.38 0.02 1.61 5.68
Variety:Chisholm 12.5a 46.2 1.2 38.2 0.8 46.5a 13.9Karl 13.4a 34.0 1.0 34.3 0.8 43.1a 15.92180 13.5a 31.5 1.0 31.1 0.7 43.8a 4.0TAM W-101 12.9a 39.8 1.1 37.1 0.8 45.3a 17.1SED 0.51 2.41 0.07 1.38 0.02 1.61 5.68
Contrasts:N rate linear ** ** ** ns ** ** **N rate quadratic ns ** ** ns * ns ns_________________________________________________________________________________________________________________________*, ** Significant at 0.05 and 0.01 probability levels, respectively. Gw = grain weight; Ns = N supply; Na = N accumulated in plant at anthesis; Nt = total N in plant at maturity; Ng = N accumulated in grain at harvest; Nh = N accumulated in plant at harvest. SED - standard error of the difference between two equally replicated means, ns - not significant.

OSU Soil Fertility Research 1997 Page 129
Table 6. Analysis of Variance, Means and Comparisons for Nitrogen Use Efficiency Components, Perkins, OK 1995._________________________________________________________________________________________________________________________
Protein N-use N-uptake N-utilization Fraction of Grain yield/ N loss% efficiency efficiency efficiency N translocated grain N (kg ha-1)
(Gw/Ns) (Nt/ Ns) (Gw/Nt) to grain(Ng/Nt) (Gw/Ng) (Na-Nh)
Source of variation df ------------------------------------------------------------------- mean squares -----------------------------------------------------------------------Replication 2 48.4** 18.0ns 0.10* 138.** 0.004ns 224.4** 655nsN rate 3 18.5** 995.6** 1.66** 36* 0.003ns 90.6** 551.4nsVariety 4 13.2** 47.0** 0.11** 23ns 0.069** 63.0** 85.2nsN rate * variety 12 0.9ns 21.8* 0.03ns 8.5ns 0.009ns 5.3ns 168.6nsResidual error 32 1.1 8.9 0.02 9 0.006 5.6 295.3N rate, kg ha-1 ------------------------------------------------------------------------ means ---------------------------------------------------------------------------0 14.8 0 0 23.2 0.60 38.8 16.445 15.9 23.3 1.0 22.9 0.63 36.5 25.090 17.4 11.0 0.6 20.2 0.61 33.2 25.8180 17.6 7.0 0.4 20.5 0.62 33.5 31.4SED 0.40 1.1 0.05 1.12 0.03 0.89 6.74
Variety:Chisholm 16.3 11.8 0.5 22.4 0.6 35.3 21.8aKarl 17.5 13.1 0.6 23.0 0.7 33.0 26.6a2180 17.4 18.1 0.8 22.7 0.7 33.4 27.9aTAM W-101 15.5 11.7 0.6 21.4 0.6 37.4 24.7aLonghorn 15.0 14.7 0.8 19.5 0.5 38.5 22.3aSED 0.45 1.5 0.07 1.27 0.04 1.18 7.33
Contrasts:N rate linear ** ** ** ** ns ** *N rate quadratic ns ** * ns ns ns ns_________________________________________________________________________________________________________________________*, ** Significant at 0.05 and 0.01 probability levels, respectively. Gw = grain weight; Ns = N supply; Na = N accumulated in plant at anthesis; Nt = total N in plant at maturity; Ng = N accumulated in grain at harvest; Nh = N accumulated in plant at harvest. Means followed by same letter are not significantly different at 0.05 probability level. SED - standard error of the difference between two equally replicated means.

OSU Soil Fertility Research 1997 Page 130
Table 7. Means for Yield and Components of Nitrogen Use Efficiency at various Nitrogen Rates, Perkins, OK 1995._____________________________________________________________________________________
Grain yield Straw yield Straw N Grain + Straw N N-useuptake uptake efficiency
------------------------------------- Mg ha-1 --------------------------------------- (Gw/Ns)
0 kg N ha -1 Chisholm 0.89 1.47 0.019 0.042 -Karl 0.86 1.19 0.011 0.035 -2180 0.64 0.87 0.011 0.030 -TAM W-101 0.87 1.85 0.017 0.038 -Longhorn 0.81 1.89 0.014 0.033 -
45 kg N ha -1 Chisholm 0.93 1.34 0.013 0.040 23Karl 0.78 0.72 0.001 0.032 192180 1.28 1.49 0.017 0.052 32TAM W-101 0.76 1.28 0.016 0.037 19Longhorn 0.91 2.46 0.026 0.048 23
90 kg N ha -1 Chisholm 0.76 0.85 0.011 0.034 10Karl 0.91 1.44 0.016 0.044 112180 1.10 1.16 0.014 0.050 14TAM W-101 0.79 1.74 0.019 0.042 10Longhorn 0.91 3.22 0.035 0.061 11
180 kg N ha -1 Chisholm 1.01 1.50 0.018 0.049 6Karl 0.95 1.44 0.017 0.046 62180 1.13 1.19 0.016 0.051 73TAM W-101 1.03 1.83 0.022 0.055 6Longhorn 1.41 3.78 0.039 0.078 9
SED 0.16 0.29 0.004 0.006 2.4_____________________________________________________________________________________Gw = grain weight; Ns = N supply; Na = N accumulated in plant at anthesis; Nt = total N inplant at maturity; Ng = N accumulated in grain at harvest; Nh = N accumulated in plant at harvest.

OSU Soil Fertility Research 1997 Page 131
Figure 1. Change in total nitrogen uptake from anthesis to maturity in several winter wheat varieties, Perkins, OK 1995.
180 185 190 195 200 205 210 215 220 225 230 23535
40
45
50
55
60
65
70
75
80
85
ChisholmKarlLonghorn2180TAM W-101
anthesis post anthesis maturity
Days after planting
Nitr
oge n
upt
a ke ,
kg
ha-1

Page 132 1997 OSU Soil Fertility Research
Effect of Long-Term Nitrogen Fertilization on Soil Organic Carbon and Total Nitrogen in Continuous Wheat
W.R. Raun, G.V. Johnson, S.B. Phillips and R.L. Westerman
ABSTRACTThe effects of long-term nitrogen (N) applications in continuous winter wheat (Triticum aestivum L.) production systems on total N and organic C in soils has not previously been studied. Deep soil cores were taken from four long-term winter continuous wheat experiments to evaluate differences in total N and organic carbon (C) as affected by more than 23 years of annual N applications. When N was applied at rates > 90 kg ha-1, surface soil (0-30 cm) organic C was either equal to that of the check (no N applied) or slightly greater. Total soil N (0-30 cm) increased at the high N rates at all locations. However, at two locations, total soil N decreased at low N rates, indicating the presence of priming (increased net mineralization of organic N pools when low rates of fertilizer N are applied). At these same two sites, soil-plant inorganic N buffering (amount of N that could be applied in excess of that needed for maximum yield without resulting in increased soil profile inorganic N accumulation) was greater compared to the other two sites where no evidence of priming was found. In general, C:N ratios increased at the low rates of applied N and then decreased to levels below that found in check plots at high N rates (134 kg N ha-1 yr-1). Combined surface (0-30 cm) soil analyses of total N and organic C were useful in detecting where priming had taken place and where soil-plant inorganic N buffering was expected to be high in these long-term N fertilization experiments. Predictability of the priming effect combined with soil-plant inorganic N buffering should assist us in establishing environmentally safe N rates. N applied at rates in excess of that required for maximum yield tended to increase surface (0-15 cm) soil organic C. Nitrogen use efficiencies for the 45 kg N /ha/yr treatment found at three sites applied for more than 23 years were all less than 37%. NUE tended to be higher at those sites where surface organic C exceeded 6.0 g/kg.
INTRODUCTION
nalyses of total nitrogen (N) and organic C in soils has been reported in numerous articles dealing with continuous cropping production systems. However, few have assessed changes in total N and organic C in soils over time.
In addition, the resultant effect of annual applications of N in continuous wheat production systems on total soil N and organic C has not been monitored.
ABlevins et al. (1983) found a 37 and 12% increase in soil organic C under no-
tillage (NT) and conventional tillage (CT) corn, respectively after 10 yr of applying 84 kg N ha-1 yr-1 at the 0-5 cm depth. In continuous corn experiments conducted by Havlin et al. (1990), high N rates (252 kg N ha-1) were found to increase surface soil (0-30 cm) organic C levels.

OSU Soil Fertility Research 1997 Page 133
MacVicar et al. (1951) found that the lowest 15N recoveries were associated with a low level of soil organic matter and a high level of nitrogen addition. Most of the soil nitrogen was maintained in a reduced state as bacterial cellular nitrogen in soils with a high C:N ratio (MacVicar et al., 1951). When the soil C:N ratio was small, free nitrogen, including nitrate, accumulated and denitrification was assumed to occur (MacVicar et al., 1951).
Varvel and Peterson (1990a) indicated that the differences in estimating fertilizer N recovery using isotopic and difference methods were due to synchronization problems between N mineralization and crop N use. This was probably due to cropping system, previous crop, amount and type of residue and other environmental factors. However, Varvel and Peterson (1990a) did indicate that either method is satisfactory within a specific cropping system, but that neither method does well across diverse cropping systems where differences in immobilization could occur. Nitrogen removal in the grain accounted for 50% of the applied N in continuous grain sorghum and corn systems at low N rates of 34 and 90 kg N ha-1, respectively (Varvel and Peterson, 1990b). At higher N rates of 68 and 180 kg N ha-1 for grain sorghum and corn systems, only 20 to 30% of the applied N was accounted for by N removal in the grain. This difference in percent fertilizer N removed in the grain was noted to be a function of immobilization by crop residues and soil organic matter and not due to N leaching (Varvel and Peterson, 1990b). This was supported by observations made for NH4-N and NO3-N concentrations from soil profile analysis (0-150 cm), whereby no differences were observed from samples taken four years apart.
Olson (1982) found that 81.9% of the fertilizer N remaining in a 0-150 cm soil profile had been immobilized by harvest time in a winter wheat experiment. In addition, 70% of the fertilizer N remained in the 0-10 cm profile of a silt loam soil at all sampling dates (October 1979 through June, 1980). Immobilization of the fertilizer N in the 0 to 10 cm layer limited downward movement, plant uptake and losses. Most of the N not immobilized was used by the crop when N was applied at a rate of 80 kg ha -1. At maturity, only 18% of the fertilizer N in the 150cm profile was present as inorganic N. Groot and de Willigen (1991) suggested that N can be immobilized almost immediately after application, without increased metabolic activity of the microbial biomass.
The objective of this study was to evaluate the effects of long-term N applications in continuous winter wheat on total soil N and organic C in surface horizons.
MATERIALS AND METHODS
Four long-term (>23 years) continuous winter wheat fertility experiments were sampled in 1993 to determine total N, organic C, NH4-N and NO3-N within the soil profile. The four experiments are identified as 222, 406, 502 and 505. Experiments 502 and 505 were separate studies conducted at the same location. Soil types were Kirkland silt loam (fine-mixed thermic Udertic Paleustoll), Tillman clay loam (fine, mixed, thermic Typic Paleustoll) and Grant silt loam (fine-silty, mixed, thermic Udic Argiustoll) for experiments 222, 406, and 502 and 505, respectively. Additional site information is provided in Table 1. Fertilizer treatments and surface (0-30 cm) soil test analyses at the time all trials were sampled in 1993 are reported by location in Table 2. Fertilizer treatments reported in Table 2 were applied preplant in the fall of each year and

Page 134 1997 OSU Soil Fertility Research
incorporated prior to planting. Winter wheat was planted in 25.4 cm rows at seeding rates of 67 kg ha-1 at all locations. All sites were managed under conventional tillage (disk incorporation of wheat straw residues following harvest and prior to planting) with a maximum tillage depth ranging from 15 to 25 cm.
Three soil cores 4.45 cm in diameter, were taken from each plot to a depth of 240 cm and sectioned in increments of 0 to 15, 15 to 30, 30 to 45, 45 to 60, 60 to 90, 90 to 120, 120 to 150, 150 to 180, 180 to 210 and 210 to 240 cm. Soil samples were air dried at ambient temperature and ground to pass a 100-mesh sieve (<0.15 mm) for total N and organic C analyses (Tabatabai and Bremner, 1970). Soils were analyzed for total nitrogen and organic C (non-calcareous soil) using a Carlo-Erba (Milan, Italy) NA 1500 dry combustion analyzer (Schepers et al., 1989). For experiment 406, soil organic C was determined by digestion with an acidified dichromate (K2Cr2O7-H2SO4) solution (Yeomans and Bremner, 1988) due to the presence of free CaCO3 in surface horizons. Duplicate soil samples were also extracted using 2M KCl (Bremner, 1965) and analyzed for NH4-N and NO3-N using an automated flow injection analysis system. Soil pH was determined using a glass electrode and a soil/water ratio of 1:1.
The center 3.05 m of each plot was harvested for grain yield using a conventional self-propelled combine, and wheat straw was uniformly redistributed in all plots each year. Fertilizer N recovery in the grain was determined by multiplying treatment grain yield x grain N, subtracting check (no N fertilization) grain yield x grain N and dividing by the rate of N applied.
RESULTS
Previous StudiesThis manuscript is an extension of work on the same long-term winter wheat
experiments reported by Westerman et al. (1994), Raun and Johnson (1995) and Johnson and Raun (1995). Initial work by Westerman et al. (1994) documented accumulation of NH4-N and NO3-N in the soil profiles following long term annually applied fertilizer N rates in winter wheat. This work concluded that no accumulation of NH4-N and NO3-N occurred in soil profiles at recommended N rates where maximum yields were obtained. Raun and Johnson (1995) and Johnson and Raun (1995) proposed a soil-plant buffering concept to explain why soil profile inorganic N did not begin to increase until N rates in excess of that required for maximum yield were applied. Loss of N from the soil-plant system can take place via plant N volatilization, denitrification and surface volatilization when N rates exceed that required for maximum yield. Also, increased grain N, straw N, organic N and C in the soil are found when N rates exceed that needed for maximum yields. The soil-plant buffering concept helped to explain why unaccounted N should not be immediately attributed to leaching in studies where these biological mechanisms remained active. Grain yield optimums over the 23+ year period included in each of these experiments were found at 56, 47, 62 and 43 kg N ha-1yr-1 for experiments 222, 406, 502 and 505, respectively (Raun and Johnson, 1995). Significant increases in soil profile inorganic N were not found until N was applied at rates of 104, 75, 85 and 99 kg ha-1yr-1 at these same respective locations (Raun and Johnson, 1995). The difference between the observed N rate where soil profile inorganic N accumulation became significant and the N rate where maximum yields were obtained is an estimate of the

OSU Soil Fertility Research 1997 Page 135
soil-plant buffering capacity or the ability of the soil-plant system to limit inorganic N accumulation when N rates exceed that required for maximum yield. Therefore, on an annual basis, 48, 28, 23 and 55 kg of N fertilizer ha -1 could have been applied in excess of requirements for maximum yield in experiments 222, 406, 502 and 505 without increasing inorganic N accumulation or the risk of NO3-N leaching.
The expression of treatment on total soil N and organic C was expected to be different in the surface soil profile (0-15 cm) compared to soil at other depths, largely due to annual disking to a depth of 15 cm, which led to mechanical mixing and aeration. The extent of root proliferation was expected to be greatest within the top 0-30 cm. The combined effects of increased microbial activity, root proliferation and cultivation in the surface 0-30 cm led us to select this depth for more detailed analyses. Results were consistent with this approach, since few differences in total soil N or organic C were noted at depths > 60 cm (data not reported).
Total soil NNitrogen fertilization significantly increased (linear and/or quadratic) total soil N
in the surface 30 cm at all locations (Table 3 and Figure 1). This was most apparent when the high rate was compared to the check (no N fertilization). Although this significant linear increase (over all rates) was found, total soil N tended to decrease at the low N rates in experiments 222 and 505. However, when N was applied at rates in excess of that needed for maximum yield, total soil N increased in all experiments.
Organic CSimilar to observations for total soil N, soil organic C increased with increasing N
applied at three of the four sites (Table 3 and Figure 2). This was consistent with work by Blevins et al. (1983) and McAndrew and Malhi (1992) who demonstrated increases in soil organic C with increasing N applied. At experiments 222 and 505, soil organic C did not increase until at least 67 kg N ha-1yr-1 was applied (Table 3 and Figure 2). A tendency for increased soil organic C when N was applied at rates in excess of that required for maximum yield was noted at all locations.
Carbon Nitrogen RatioIn experiments 222, 502 and 505, applied N significantly affected C:N ratios
(Table 3 and Figure 3). In these experiments, C:N ratios increased at the low to moderate N rates but then decreased to levels below that observed in the check in experiments 222 and 502. (Figure 3). We hypothesize that, similar to the work of Westerman and Kurtz (1973), applied N at rates <= 67 kg ha -1 was expected to have a 'priming effect' resulting in increased net mineralization of N from the soil organic matter pool. This was evident in the higher C:N ratios at the low N rates, largely due to decreased total soil N since organic C levels were in general unaffected within this same range (annual N <= 67 kg N ha-1). Several authors have found that N rates which exceed that required for maximum yields generally result in decreased harvest indices and associated higher straw yields in wheat. This would aid in explaining why organic C levels increased at the higher N rates used in these trials. However, in order for total soil N levels to be significantly lower at the low to moderate N rates, applied N was expected to have a different effect on the organic N pool. Westerman and Kurtz (1973) suggested

Page 136 1997 OSU Soil Fertility Research
that increased crop soil N uptake was due to stimulation of microbial activity by N fertilizers which increased mineralization of soil N, thus making more soil N available for plants. Similarly, what could be a 'priming effect' in these experiments occurred at the low to moderate applications of fertilizer N.
Fertilizer recovery in the grainEstimates of fertilizer N recovery in the grain using the difference method are
reported in Table 4. At the low N rates, 30-60% of the N applied could be accounted for in the grain. Annual N rates in excess of 90 kg N ha -1 resulted in fertilizer N recovery in the grain of less than 28% at all locations. Varvel and Peterson (1990a) have indicated that problems of estimating N recovery in crop production using the difference method include the assumption that mineralization, immobilization and other N transformations are the same for both fertilized and unfertilized soils.
DISCUSSION
At experiments 222 and 505 a significant decrease in surface soil total N was noted when N was applied at annual rates between 45 and 90 kg ha-1. Therefore, continued microbial breakdown of soil organic matter may have caused the decrease in total soil N with no corresponding change in organic C since increased growth and straw biomass (via priming) would have been present. At the higher N rates which exceeded that required for maximum yields (>90 kg N ha-1), organic C levels were equal to or somewhat greater than the check. We think that evidence of priming (increased net mineralization of organic N pools when low rates of fertilizer N are applied) observed here took place within the first five years in these long-term studies.
It was interesting to find that estimates of soil-plant inorganic N buffering (rate of N that can be applied in excess of that needed for maximum yield without resulting in increased soil profile inorganic N accumulation) were greatest in experiments 222 and 505 (Raun and Johnson, 1995) where evidence of the priming effect was also observed. As indicated earlier, we hypothesize that priming took placed since decreased total soil N at low rates in two of these long-term experiments was observed. Consistent with this, it is thought that soil-plant buffering will be greater in soils where priming is observed, a result of increased N from easily mineralizable N pools. Therefore, these soil-plant environments are also capable of immobilizing excess mineral N. However, it should be mentioned that differences in total soil N that were due to treatment reported here would not likely be detected in short-term (3-5 year) studies given the precision at which total N can be determined using dry combustion methods (±0.01% or 0.10 g kg-1)
The combined use of total N and organic C in relation to N applied in these long-term trials provided reasonable evidence of the priming effect proposed by Westerman and Kurtz (1973). Analyses for surface soil organic C alone was useful in detecting increases at the high N rates (site specific) but provided little information when compared across locations (no relationship with soil-plant inorganic N buffering or total soil N). The combined use of total organic C and lignin (highly stable) content may be a more useful tool since the easily mineralizable N fractions will depend on organic C stability. This work further suggests that the quantity of easily mineralizable N should be

OSU Soil Fertility Research 1997 Page 137
a reliable predictor of soil-plant inorganic N buffering since total N decreased at low N rates (easily mineralized N), at both locations where soil-plant inorganic N buffering was large. If easily mineralizable N could be determined on a routine basis, it may provide an index for determining environmentally safe N rates for winter wheat production.
REFERENCES Blevins, R.L., G.W. Thomas, M.S. Smith, W.W. Frye and P.L. Cornelius. 1983. Changes in soil properties
after 10 years of continuous non-tilled and conventionally-tilled corn. Soil Tillage Res. 3:135-136.
Bremner, J.M. 1965. Inorganic forms of nitrogen. In C.A. Black et al. (ed.) Methods of soil analysis, Part 2. Agronomy 9:1179-1237. Am. Soc. of Agron., Inc., Madison WI.
Groot, J.J.R., and P. de Willigen. 1991. Simulation of the nitrogen balance in the soil and a winter wheat crop. Fertilizer Research 27:261-272.
Havlin, J.L., D.E. Kissel, L.D. Maddux, M.M. Claassen and J.H. Long. 1990. Crop rotation and tillage effects on soil organic carbon and nitrogen. Soil Sci. Soc. Am. J. 54:448-452.
Johnson, G.V., and W.R. Raun. 1995. Nitrate leaching in continuous winter wheat: use of a soil-plant buffering concept to account for fertilizer nitrogen. J. Prod. Agric. 8:486-491.
MacVicar, R., W.L. Garman and R. Wall. 1951. Studies on nitrogen fertilizer utilization using 15N. Soil Sci. Soc. Am. Proc. 15:265-268.
McAndrew, D.W., and S.S. Malhi. 1992. Long-term N fertilization of a solonetzic soil: effects on chemical and biological properties. Soil Biol. Biochem. 24:619-623.
Olson, R.V. 1982. Immobilization, nitrification, and losses of fall-applied, labeled ammonium-nitrogen during growth of winter wheat. Agron. J. 74:991-995.
Raun, W.R., and G.V. Johnson. 1995. Soil-plant buffering of inorganic nitrogen in continuous winter wheat. Agron. J. 87:827-834.
Schepers, J.S., D.D. Francis, and M.T. Thompson, 1989. Simultaneous determination of Total C, Total N, and 15N on Soil and Plant Material. Commun. In Soil Sci. Plant Anal. 20,949-959
Tabatabai, M.A and J.M. Bremner, 1970. Use of the Leco Automatic 70-Second Carbon Analyzer for total Carbon Analysis of soils. Soil Sci. Soc. Amer. Proc. 34,608-610.
Varvel, G.E., and Todd Andrews Peterson. 1990a. Nitrogen fertilizer recovery by corn in monoculture and rotation systems. Agron. J. 82:935-938.
Varvel, G.E., and Todd Andrews Peterson. 1990b. Residual soil nitrogen as affected by continuous, two-year, and four-year crop rotation systems. Agron. J. 82:958-962.
Westerman, R.L., and L.T. Kurtz. 1973. Priming effect of 15N-labeled fertilizers on soil nitrogen in field experiments. Soil Sci. Soc. Amer. Proc. 37:725-727.
Westerman, R.L, R.K. Boman, W.R. Raun and G.V. Johnson. 1994. Ammonium and nitrate nitrogen in soil profiles of long-term winter wheat fertilization experiments. Agron. J. 86:94-99.
Yeomans, J.C., and J.M. Bremner. 1988. A rapid and precise method for routine determination of organic carbon in soil. Commun. Soil Sci. Plant Anal. 19:1467-1476.

Page 138 1997 OSU Soil Fertility Research
Figure 1. Surface (0-30 cm) soil total N as affected by annual applications of fertilizer N, experiments 222, 406, 502 and 505 (SED -standard error of the difference between two equally replicated means).
Figure 2. Surface (0-30 cm) soil organic C as affected by annual applications of fertilizer N, experiments 222, 406, 502 and 505 (SED -standard error of the difference between two equally replicated means).
0 50 100 150 200 250 3000.65
0.7
0.75
0.8
0.85222 SED=0.057406 SED = 0.058502 SED = 0.029505 SED = 0.065
N rate, kg ha-1
Tot
al N
, g k
g-1
0 50 100 150 200 250 3005
5.5
6
6.5
7
7.5
8
8.5222 SED=0.52406 SED=0.70502 SED=0.32505 SED=1.08
N rate, kg ha-1
Org
anic
Car
bon,
g k
g-1

OSU Soil Fertility Research 1997 Page 139
Figure 3. Surface (0-30 cm) soil organic C:total N ratios as affected by annual applications of fertilizer N, experiments 222, 406, 502 and 505 (SED -standard error of the difference between two equally replicated means).
Table 1. Long-term experiment included in the analysis, year established, soil core sampling date, crop years prior to sampling, annual average rainfall and range in annual rainfall (all sites were continuous winter wheat under conventional tillage).______________________________________________________________________________Exp. Long., Lat. Year Number of Dates Crop Years Annual avg. Mean Annual
Est. Replications Sampled Prior to Rainfall Range TemperatureSampling
_____________________________________________________________________________________ ----------- mm ----------- °C
222 36° 7' 7"N 1969 4 July 1993 24 922 606-1493 15.097° 5' 30" W
406 34° 36' 34" N 1965 4 July 1993 28 670 295-1141 17.199° 20' 0" W
502 36° 23' 13" N 1970 4 July 1993 23 771 503-1314 15.698° 6' 29" W
505 36° 23' 13" N 1970 3 July 1993 23 771 503-1314 15.698° 6' 29" W
_____________________________________________________________________________________-obtained from the years each study was conducted up until soil profile sampling and analyses was performed.
0 50 100 150 200 250 3007
8
9
10
11
12
13222 SED=0.31406 SED=1.17502 SED=0.28505 SED=1.50
N rate, kg ha-1
C:N

Page 140 1997 OSU Soil Fertility Research
Table 2. Surface soil test characteristics (0-30 cm) in 1993 for experiments 222, 406, 502 and 505.__________________________________________________________________________Experiment Fertilizer Applied Soil Test Level
N P K pH P K__________________________________________________________________________
--------- kg ha-1 yr-1--------- mg kg-1 mg kg-1
222 0 29 38 5.85 51 21845 29 38 5.84 38 20090 29 38 5.80 34 155134 29 38 5.73 26 130
SED 0.08 11 36
406 0 0 0 7.29 9 40945 20 38 7.13 32 44590 20 38 7.38 25 432134 20 38 7.12 24 445179 20 38 6.79 23 442
SED 0.18 3 14
502 0 20 56 5.95 70 48822 20 56 5.83 66 43845 20 56 5.76 71 46767 20 56 5.67 75 45590 20 56 5.60 72 468112 20 56 5.49 83 457
SED 0.14 17 38
505 0 29 56 5.74 119 42034 29 56 5.43 94 34367 29 56 5.24 103 340134 29 56 5.04 121 413269 29 56 4.85 93 366
SED 0.10 14 28______________________________________________________________________________pH, 1:1 soil:water; K and P, Mehlich III, SED - standard error of the difference between two equally replicated means.

OSU Soil Fertility Research 1997 Page 141
Table 3. Analysis of variance, mean squares and associated contrasts for total soil N, organic C and Carbon:Nitrogen ratios, experiments 222, 406, 502 and 505 for the 0-30 cm soil depth, 1993.______________________________________________________________________________Source of Variation df Total N Organic C C:N______________________________________________________________________________
------------------ Mean Squares --------------------#222
Rep 3 0.0087 1.176 1.109**Trt 3 0.0133 0.217 0.526Error 25 0.0065 0.537 0.193
Single degree of freedom contrastsN Rate linear 1 0.0074 0.374 0.006N Rate quadratic 1 0.0314* 0.220 1.568*0 vs 134 1 0.0085 0.431 0.009
#406Rep 3 0.0112 2.903* 10.162*Trt 4 0.0055 1.320 1.871Error 32 0.0068 0.986 2.759
Single degree of freedom contrastsN Rate linear 1 0.0195** 4.408* 1.175N Rate quadratic 1 0.0005 0.012 0.7340 vs 134 1 0.0036 2.182@ 2.992
#502Rep 2 0.0003 0.592* 1.435**Trt 5 0.0094** 0.332 0.497**Error 28 0.0013 0.154 0.123
Single degree of freedom contrastsN Rate linear 1 0.0317** 0.800* 0.371@N Rate quadratic 1 0.0025 0.844* 0.512*0 vs 112 1 0.0220** 0.527@ 0.262
#505Rep 2 0.03604* 1.175 2.262Trt 4 0.00763 2.694 1.014Error 23 0.00644 1.750 3.399
Single degree of freedom contrastsN Rate linear 1 0.01903@ 5.549@ 0.832N Rate quadratic 1 0.00241 0.002 0.6260 vs 134 1 0.01153 7.000* 3.316______________________________________________________________________________**,*,@ - significant at the 0.01, 0.05 and 0.10 probability levels, respectively.

Page 142 1997 OSU Soil Fertility Research
Table 4. Total soil profile inorganic N, average annual grain yield, total N removed in the grain and estimates of fertilizer N recovery, experiments 222, 406, 502 and 505.______________________________________________________________________________Treatment Total soil profile Total N Average Total N Fertilizer N NUE
inorganic N Applied annual grain removed in removed inyield grain grain
-----------------------------------kg ha-1-----------------------------------------______________________________________________________________________________#222 (0-240 cm) 24 years0-29-38 424 0 1329 692 0 045-29-38 413 1080 1751 1046 354 0.3390-29-38 432 2160 1882 1156 464 0.21134-29-38 608 3216 1933 1401 708 0.22
#406 (0-210 cm) 28 years0-0-0 503 0 1416 900 0 045-20-38 487 1260 1972 1363 463 0.3790-20-38 509 2520 2095 1589 689 0.27134-20-38 622 3752 1899 1483 583 0.16179-20-38 745 5012 1907 1447 547 0.11
#502 (0-240 cm) 23 years0-20-56 314 0 1727 844 0 022-20-56 294 506 2240 1133 289 0.5745-20-56 322 1035 2381 1221 377 0.3667-20-56 310 1541 2668 1399 555 0.3690-20-56 344 2070 2749 1460 616 0.30112-20-56 502 2576 2655 1435 590 0.23
#505 (0-300 cm) 23 years0-29-56 384 0 1615 809 0 033.6-29-56 387 772 2406 1261 451 0.5867.3-29-56 375 1545 2645 1460 650 0.42134.5-29-56 517 3091 2721 1677 867 0.28269-29-56 1023 6182 2541 1624 814 0.13______________________________________________________________________________

OSU Soil Fertility Research 1997 Page 143
Estimating Gaseous N Losses From Winter Wheat Using 15N
H.L. Lees, W.R. Raun, J. Chen, D.A Cossey and J.L. Dennis
ABSTRACTThe primary focus in this study was plant N loss, and its impact on nitrogen use efficiency. By enriching fertilizer with 15N, the amount of N present in plant and soil fractions due to fertilizer can be quantified. Labeled ammonium nitrate (11.8881% atom excess 15NH4
15NO3) was applied preplant (0, 45, 90, and 135 kg N ha-1) to microplot areas at Stillwater and (0, 23, 45, 67, 90, 112 kg N ha-1) at Lahoma, OK. Forage at flowering, grain, straw and soil samples were taken from each microplot. Analysis was conducted for percent 15N atom excess using a Carlo Erba model NA 1500 dry combustion unit interfaced to a stable isotope ratio mass spectrometer. N loss at experiment 222 ranged from a net gain of 12.05 kg N ha-1 to a loss of 14.67 kg N ha-1 for the 45 and 135 kg N ha-1 rates, respectively. N loss at experiment 502 ranged from a gain of 20.48 kg N ha-1 to a loss of 41.55 kg N ha-1. Correlation between wheat forage tissue NO3:NH4 ratios determined at flowering and N loss at maturity was low at experiment 222 in 1996, but was high (R2 = 0.47) in 1997. At experiment 502 in 1997 the ratio of NO3:NH4 was also correlated with N loss (R2= 0.29). As the NO3:NH4 increased, N loss increased.
INTRODUCTION
itrogen (N) fertilizer is generally the most costly input for winter wheat (Triticum aestivum L.) production. Therefore, it is important to maximize fertilizer use efficiency and minimize nitrogen losses to the environment. These
losses occur from the soil plant system via denitrification, volatilization (both from the plant and the soil), and leaching. By understanding N movement in the soil, we can characterize how these losses occur and seek to increase nitrogen use efficiency (NUE). One of the mechanisms responsible for decreased NUE is plant N loss.
NNitrogen movement through the soil over time is difficult to measure without the
use of 15N. By enriching fertilizer with 15N, researchers can quantify the amount of N present in soil and plant fractions due to the fertilizer. The percent natural abundance of 15N is 0.3663, while that of 14N is 99.634% (Schepers et al., 1989, Vose, 1980 and Hauck and Bremner, 1976). Therefore, an enriched 15N fertilizer material contains more than 0.3663% 15N atom excess (Vose, 1980).
Work by Raun and Johnson (1995) indicates that the soil-plant system can buffer against soil profile inorganic N accumulation when N rates exceed that required for maximum yield. Plant N loss is one of the buffering mechanisms (Raun and Johnson, 1995). Francis et al. (1993) found plant N loss was responsible for 52-73% of the undetermined N loss. In addition, Harper et al. (1987) found 21% of applied fertilizer N was lost as volatile ammonia during senescence in wheat.
Nitrogen use efficiency (NUE) is equal to grain weight divided by the nitrogen supply (Moll et al., 1982). Moll et al. (1982) found significant differences in NUE

Page 144 1997 OSU Soil Fertility Research
between all N rates. Lower NUE was found at higher N rates. Wuest and Cassman (1992) showed 30-55% recovery of N applied at planting and 55-80% recovery of N applied at anthesis for irrigated hard red spring wheat. Furthermore, post-anthesis N uptake was not increased by greater preplant fertilizer N levels (Wuest and Cassman, 1992). The objectives of this experiment were 1) To determine fertilizer N recovery in winter wheat when produced for forage and grain, 2) To quantify potential plant N losses from flowering to maturity in winter wheat, and 3) To estimate residual fertilizer effects.
REVIEW
Nitrogen 15 (15N) is often used to label fertilizers because it allows the researcher to trace fertilizer N movement in the soil. It was applied here to further investigate N buffering mechanisms and nitrogen use efficiency (NUE). First, one must understand the basic soil processes occurring and 15N’s application.
15 N labeled fertilizers Research has been conducted on 15N techniques and analysis methods. This
includes the use of microplots, comparison of N recovery methods, and analysis with a mass spectrometer. Due to the high cost of 15N fertilizer, microplots are used for 15N experiments. 15N research is valuable because it allows the researcher to trace specific N sources’ movement and behavior in the soil. Fertilizer applied to microplots is confined to the plot by using a sheet metal cylinder or square inserted into the soil surface (Carter et al., 1967; Olson et al., 1979; Kowalenko, 1989; Harris et al., 1994). This method enables researchers to confine lateral fertilizer movement (Carter et al., 1967).
There are two methods for determining nitrogen recovery, the difference method and the isotope-ratio analysis method. Walters and Malzer (1990) found that when they used the difference method, fertilizer N leaching losses in corn were three times greater than under isotope-ratio analysis. They attributed this difference to isotope dilution with indigenous soil N due to microbial activity. Varvel and Peterson (1990) found significantly different nitrogen recovery percentages between the two methods. Despite the difficulties encountered with the use of either method, both remain valuable tools.Hauck and Bremner (1976) outline the assumptions under both methods. The difference method assumes that mineralization, immobilization, and other N transformations are the same for fertilized and unfertilized soils. The isotope-ratio analysis method assumes that isotope compositions in tracers are static, living organisms cannot differentiate between isotopes of the same element, and isotope dilution does not occur in biochemical processes. N loss during drying and preparation of wet soil samples could result in error (Hauck and Bremner, 1976). They state the only significant errors encountered with mass spectrometer analysis are N2, N2O, CO2, and volatile amine contamination during sample preparation.
Westerman and Kurtz (1972) noted past methods for measuring residual effects were normal difference and/or linear regression. However, these only measure total N and are not capable of identifying which atoms come from native soil N and those coming from applications of fertilizer N. Therefore, 15N techniques are necessary to effectively characterize soil N.

OSU Soil Fertility Research 1997 Page 145
Isotopic nitrogen samples may be analyzed using Carlo Erba model NA 1500 automatic N analyzer interfaced to a mass spectrometer (Schepers et al., 1989). Schepers et al. (1989) did not find a memory effect in between samples. The memory effect is associated with the formation of nitric acid and its adsorption to the inner surfaces of the dry combustion unit and mass spectrometer. (Schepers et al., 1989). Calculations can made based on the equation from Vose (1980).
RecoveryWesterman et al. (1972) conducted experiments on Sorghum sudanense over two
years to study N recoveries from urea and oxamide fertilizers. In the first year, with urea fertilizer, 51% of the applied N was recovered in the crop and 28% of applied fertilizer N remained in the top 25 cm of the soil profile; while with oxamide fertilizer, 52% was recovered in the crop and 31% in the soil. In the following year, when planting and fertilizer (unlabeled) application were delayed due to weather conditions, recoveries for the crop were 93% for urea and 99% for oxamide. Soil recoveries in the second year were not measured. Toward the end of the season, little or no response in yield was found due to fertilizer use. Furthermore, the amount of fertilizer N remaining in the soil after cropping, increased significantly as rates of N increased, except at urea rates of 112 to 168 kg N ha-1. Unaccountable N loss was attributed to possible leaching and denitrification.
Carter et al. (1967) found total fertilizer recovery, eight weeks into the growing season, to be between 88 and 96%. Greater recovery, and greater plant uptake, was found from ammonium than from nitrate sources. Carter et al. (1967) found no significant difference in recovery of the fertilizer N due to the percent of excess 15N in the fertilizer, size of plot, exposure to natural rainfall, cropping, N source, or the time of application of fertilizer. Thus, 15N is ideal for use in tracer experiments. However, recovery of excess 15N varied widely with core sampling (Carter et al., 1967). Further experimentation by Reddy and Reddy (1993) found that corn used three to six times more soil N than fertilizer N and hence concluded that extensive turnover through immobilization and mineralization was occurring. N losses ranged from 11 to 48% depending on the level of fertilizer application. After the growing season, they found most of the soil N in the organic fraction. Westerman and Kurtz (1972) found residual N in the soil at the end of the second cropping season of sudangrass to be 22%.
Of the surface applied fertilizer N, 71 to 77% remained in the 0 to 0.1 m soil profile (Olson and Swallow, 1984). Carter et al. (1967) also found most of the applied N at the beginning of the growing season was in the top 0 - 15 cm of the soil profile, and 9.6 to 11.5% of that remained in the inorganic state. Also according to Olson and Swallow (1984) fertilizer N in the soil profile (1.8 m) increased each year. At the end of five years, 54% of applied fertilizer N remained in the 50 kg ha-1 treatments and 47% in the 100 kg ha-1 treatments. Olson et al. (1979) found 70-75% of the total fertilizer N was in the top 10 cm of the soil profile, while 70-91% was in the top 20 cm.
Other research examined the issue of applied N retention in the soil. Harris et al. (1994) stated that 17% of the applied fertilizer N was retained in the soil. Carter et al. (1967) found most of the applied N was either taken up into the plant or kept in the top 15 cm of the soil profile. Webster et al. (1986) found 22% of the fertilizer applied in the first soil remained in the soil at the end of the growing season; slightly more than half of

Page 146 1997 OSU Soil Fertility Research
which was found in the upper 15 cm. Walters and Malzer (1990) found the soil contained 31% applied fertilizer N.
Westerman and Kurtz (1972) looked at residual effects of fertilizer. In the second cropping season after 15N labeled fertilizer had been applied, 1.5% and 1.7% of total N in the plant tops from the second harvest was from applications the previous year of urea and oxamide, respectively. Amount of residual N increased in the 0 - 25 cm soil profile with increasing N application rate. With all of the rates averaged, residual N values at the end of the second cropping season for urea and oxamide were 16 and 20%, respectively. Two-thirds of the residual N was in the 0-10 cm layer (Westerman and Kurtz, 1972). Moreover, Reddy and Reddy (1993) found the first 15 cm of the soil profile contained one-half of the residual N.
Various researchers measured other parameters related to the use of 15N in fertilizer studies. Reddy and Reddy (1993) discovered that in the organic N fraction labeled N recovery decreased with increasing depth. Follet et al. (1991) applied liquid 15N enriched fertilizer (sprayed) to microplots and granular fertilizer (broadcast) to the area outside of the microplots. They found plant responses to both forms of fertilizer to be the same. Webster et al. (1986) discovered the crop contained more labeled N after a period of waterlogging than did the freely drained treatments. Harris et al. (1994) found the microbial biomass recovered between 3 and 6% applied fertilizer N. The nonbiomass organic fraction contained 14% of the applied fertilizer N.
Movement of N through the soil profile did not reach beyond the sampling zone during a growing season that received 208 mm of rainfall (Carter et al., 1967). Webster et al. (1986) observed little leaching loss (less than 1% in the first year and 1.3 and 3.9% over the 5 and 6 year time periods). In the three winters following the first, a total of 3% of the fertilizer applied in the first year appeared in the leachate for the sandy loam, while only 1% did for the clay soil. Percentage in the leachate from the first year’s fertilizer application declined with each succeeding year, presumably due to dilution and nutrient cycling (Webster et al., 1986). Walters and Malzer (1990) found the leachate collected 1.2 m beneath the surface contained 10% applied fertilizer N. Kowalenko’s (1989) research in Canada showed that all of the residual nitrate is leached during the winter months.
Westerman et al. (1994) investigated NH4-N and NO3-N in soil profiles in long-term winter wheat experiments. At fertilizer rates equal to or below that required for maximum yield, NH4-N and NO3-N levels did not vary significantly from that of the check. However, at levels greater than that necessary for maximum yield, NH4-N accumulated in the 0-15 cm section of the soil profile, while NO3-N levels accumulated in the subsurface soil profile. Sharpe et al. (1988) found plant uptake and immobilization accounted for the rapid decrease in fertilizer N levels in the 0-75 cm soil profile. During the elongation stage of wheat, fertilizer N was immobilized and the plant stopped taking up fertilizer N. At this time, the plant received NH3 from the atmosphere, until mineralization of fertilizer N began about one month later (Sharpe et al., 1988).
Most of the 15N research done shows that the plant removes between 40 and 58% of the applied fertilizer N in the growing season that the fertilizer was applied in, while the grain removes 27 to 33% (Olson and Swallow, 1984). Research done on clay and sandy loam soils indicated 46 and 58% of applied fertilizer N, respectively, had been taken up by winter wheat shoots by harvest during the first growing season (Webster et

OSU Soil Fertility Research 1997 Page 147
al., 1986). Further, studies in corn by Walters and Malzer (1990) showed the plant removed 52% of applied fertilizer N. Reddy and Reddy (1993), also examining corn, found applied fertilizer N recoveries of 43 to 57% and 17 to 20% in the grain. Webster et al. (1986) found after five and six years had passed, total recoveries were 49 and 62%. Harris et al. (1994) stated that 40% of applied fertilizer N was removed by the crop. Webster et al. (1986) concluded 50 to 60% of applied fertilizer N is recovered by the crop. They also found the shoots contained between one and two percent of the labeled fertilizer in subsequent years.
Shearer and Legg (1975) and Kohl et al. (1973) found a consistent decline in the delta 15N with increasing rates of N application. The decline in delta 15N was consistent with increasing contributions of fertilizer N to the plants when the rate of fertilizer N had a lower delta 15N content than the soil N.
Plant N LossWork by Raun and Johnson (1995) indicates the soil-plant system can buffer
against soil profile nitrate accumulation which would normally occur when N rates exceed that necessary for maximum yield. Using linear-plateau models, it was discovered that maximum yields occurred at N rates less than that required to increase inorganic N accumulation in the soil profile. If the N did not increase yield, and it was not leached, where was it going? Grain N uptake and plant N volatilization increased at N rates in excess of that needed for maximum yield. Increased straw yield, straw N, grain protein and soil organic carbon also occurred.
Plant N loss is one mechanism the plant has for buffering against nitrate accumulation when N rates exceed those necessary for maximum yield (Raun and Johnson, 1995). Ammonia volatilization can remove excess inorganic N equivalent to 50% of the maximum yield requirement (Johnson and Raun, 1995). Harper et al. (1987) reported that plant N concentration reached its maximum point during the vegetative stage in wheat. The plant continued to take up N, although the total plant N declined until maturity. The leaves translocated more N to the grain than did the stem. Daigger et al. (1976) found total N losses from 25 to 80 kg ha -1 in winter wheat. In their research, the stem lost 73 to 75% of the N. Stutte et al. (1979) discovered that soybeans lost more N during early vegetative growth stages than during flowering and pod fill. Morgan and Parton (1989) found grain fill produced the highest rates of ammonia volatilization in spring wheat, with especially high levels of ammonia volatilization occurring after anthesis and prior to maturity. Work by Altom et al. (1996) also demonstrated a constant NUE (60 to 70%) across a range of N rates (56 to 263 kg N ha-1) in a rye-wheat-ryegrass forage production system. Kanampiu et al. (1997) showed decreased NUE with increasing rates of N fertilizer in wheat.
Francis et al. (1993) investigated plant N loss from corn. They found 7-34 kg ha -1
was lost from aboveground plant biomass. Plant N loss was responsible for 52-73% of the undetermined loss. Moreover, they found most plant N losses occurred after anthesis, and plant N loss was significantly greater at higher rates of N (Francis et al., 1993). Harper et al. (1987) found 21% of applied fertilizer N was lost as volatile ammonia during senescence in wheat. Also, Harper et al. (1987) noted approximately 11 % of the potential N available for redistribution from stems and leaves was lost as volatile ammonia. Between 40 and 50% of grain N is taken up from the soil after anthesis

Page 148 1997 OSU Soil Fertility Research
(Francis et al., 1993). Plant N loss was maximized at the N fertilization rate where the greatest leaf area occurred. Finally, in corn plants, post-anthesis N losses from aboveground biomass ranged from 10 - 20% of the fertilizer applied (Francis et al., 1993).
Daigger et al. (1976) also found total N losses in winter wheat increased with increasing rates of N application. Total N losses in that study were between 25 and 80 kg N ha-1. Work done at Oklahoma State University by Kanampiu et al. (1997) documented plant N losses in winter wheat that ranged from 8 to 26 kg N ha -1. Like the present study showed, he found losses increased with increasing rates of N application. Kanampiu et al. (1997) showed 16.31 kg N ha-1 lost from check plots in low yielding years. Other research in irrigated corn production estimated plant N losses as high as 90 kg N ha -1. Furthermore, plant N losses in corn accounted for 52 to 73% of the unaccounted N using 15N balance (Francis et al, 1993). Research by Wuest and Cassman (1992) found post-anthesis N uptake was not increased by greater preplant fertilizer N levels. Contrary to this, Raun and Johnson (1995) found grain N uptake and plant N volatilization increased at N rates in excess of that needed for maximum yield.
Several researchers commented on other factors which may be contributing to N loss, including the type of fertilizer used, N rate, and climatic conditions. Harris et al. (1994) found more applied fertilizer ((NH4)2SO4) N loss during a drought year than during a normal one, although they note that this is not usually the case. Olson et al. (1979) found 100 kg ha-1 rate plots had twice as much fertilizer N that was unaccounted for as did the 50 kg ha-1 rate plots. They also found most of the fertilizer remaining in the soil was in the top 0 - 10 cm layer of soil, with no sign of N below 50 cm. Thus, Olson et al. (1979) concluded N losses were not due to leaching, but to gaseous losses. Carter et al. (1967) stated that during drying procedures, N as ammonia was lost from samples where ammonium sulfate had been applied. Carter et al. (1967) concluded N was lost in the gaseous form throughout the year, but was more intense in the warmer months.
Researchers found varying levels of N loss. Harris et al. (1994) state that over a two year period, 39% of the total N applied was lost. Walters and Malzer (1990) found 7% of the applied fertilizer N was unaccounted. Reddy and Reddy (1993) found unaccounted N losses were 11 to 18% at 100 kg N ha-1 and 34 to 48% for 200 kg N ha-1. The unaccounted N was that not found in the plant or in the organic and inorganic fractions of the soil. This finding is consistent with the findings of Raun and Johnson (1995) where the soil-plant continuum buffers against nitrate accumulation in the soil profile. Hence, one would expect higher unaccountable N losses with higher N rates.
Carter et al. (1967) contributed some additional explanations for unaccounted N loss. Gaseous losses of N were higher during the warmer periods of the year (Carter et al., 1967). Carter et al. (1967) explained some unaccounted losses by movement of nitrate into lower horizons where anaerobic conditions are more probable. Carter et al. (1967) also found that when ammonium sulfate was used, significant losses of ammonia occurred when the samples were dried.
Unaccountable fertilizer N losses have been attributed to volatilization (both from the soil and from the plant), denitrification, and leaching. Webster et al. (1986) blamed denitrification processes for unaccounted N losses of 11% in the first year. Olson and Swallow (1984) attributed losses to leaching and denitrification; however, since only

OSU Soil Fertility Research 1997 Page 149
small amounts of fertilizer N were found in the lower depths, the researchers concluded that leaching was not a significant factor. Olson et al. (1979) found little evidence of leaching; therefore, they concluded that N losses must be from gaseous losses and not from leaching. They also found a direct relationship between the amount of fertilizer nitrate present in the topsoil and the amount of N unaccounted for. Olson et al. (1979) found no evidence of fertilizer applications causing a priming effect on mineralization rates. However, work by Westerman and Kurtz (1973) states the opposite.
MATERIALS AND METHODS
Two long-term soil fertility experiments were selected for further study, #222 at Stillwater and #502 at Lahoma, Oklahoma. In the first year of this study, only experiment 222 was used. Experiment 222 was conducted on a Kirkland silt loam (fine, mixed, thermic Udertic Paleustoll). Experiments 222 and 502 are both long-term fertility trials that receive annual applications of N, P and K incorporated preplant in a conventional tillage continuous winter wheat production system. The treatments selected for 15N microplots were those where N rates varied, but annual P and K rates were constant. In the second year of this study, experiment 222 was continued and another was initiated, experiment 502 at Lahoma (Grant silt loam, fine, mixed thermic Typic Paleustoll), OK. Soil test levels at the initiation of each experiment are reported in Table 1.
The experimental design was a randomized complete block with 3 replications. Each plot measured 6.1 x 18.3 m. The area contained within the microplots was 32.8 x 76.2 cm. ‘Tonkawa’ winter wheat (Triticum aestivum L.) was sown at 31.8 kg ha-1. After the wheat stand was established, 32.8 x 76.2 cm microplot metal frames were installed in the center of each plot. Each frame spanned four rows of wheat.
Microplots were fertilized using 11.8881 percent atom excess 15NH415NO3 at
experiment 222 in November of 1995 and at experiment 502 in November of 1996. Experiment 222 was fertilized with non-labeled ammonium nitrate fertilizer in October of 1996. Fertilizer N was applied at rates of 0, 45, 90, and 135 kg N ha-1 at experiment 222. Phosphorus and potassium were applied to all plots at fixed rates of 29 and 38 kg ha-1, respectively. Fertilizer N was applied at rates of 0, 22, 45, 67, 90, and 112 kg N ha-1
in experiment 502 with fixed rates of 20 kg P ha-1 and 56 kg K ha-1.Soil cores, 2.22 cm in diameter, were taken to a depth of 250 cm in 1996 and to a
depth of 120 m in 1997, and sectioned into 0-15 cm, 15-30 cm, 30-45 cm, 45-60 cm, 60-90 cm, 90-120 cm, 120-150 cm, 150-180 cm, 180-210 cm, and 210-240 cm. The soil cores were refrigerated at 10°C prior to processing. Soil samples were ground to pass a 2 mm mesh sieve.
Forage at flowering and grain and straw samples were taken from each plot. NO3-N and NH4-N were determined in the forage samples following a 0.01 M calcium sulfate extraction using an automated flow injection analysis system (Lachat, 1989, 1990). The dilution factor was 100 for NH4
+ and 10 for NO3-. Harvest was conducted by
hand due to the small size of the microplots. Main plots were harvested using a Massey Ferguson 8XP research combine. Yield was calculated for the forage, grain, and straw samples. Total N in the soil, forage, grain and straw was determined using a Carlo Erba model NA 1500 dry combustion analyzer. 15N in the soil, forage, grain and straw was

Page 150 1997 OSU Soil Fertility Research
determined using a stable isotope ratio mass spectrometer. 15N atom percent excess was calculated, correcting for natural abundance. N loss was calculated as (total N accumulated at flowering) minus (total N accumulated in the grain and straw at harvest). Only the first 7 soil depths, down to 150 cm, were used to determine percent fertilizer N recovery in experiment 222 for 1996 as the latter depths contained insignificant amounts of 15N. Nitrogen use efficiency was determined following the calculations outlined in Moll et al. (1982). Statistical analysis was performed using SAS (SAS Institute, 1985) and Steel and Torrie (1980). The 5% significance level was used in all comparisons.
Two methods are commonly used to determine percent fertilizer recovery, both of which were used in this study. Using the difference method, percent fertilizer recovery is equal to total N uptake in the fertilized plot minus total N uptake in the check plot divided by the rate of fertilizer applied. When using the isotope method, percent fertilizer recovery = (100P(c-b))/(f(a-b)); where P= total N in the plant part or soil in kg ha-1, f= rate of 15N fertilizer applied, a= atom percent 15N in labeled fertilizer, b= atom percent 15N in the plant part or soil receiving no 15N, and c= atom percent 15N in the plant part or soil that did receive 15N.
RESULTS AND DISCUSSION
Average monthly maximum and minimum temperatures and rainfall are reported for experiments 222 and 502 in Tables 2 and 3. Grain yield and fertilizer response are reported in Table 4 for both experiments. A significant linear increase in grain yield was observed at both sites and both years (experiment 222) with increasing N rate. Fertilizer response (kg grain per kg N applied) decreased with increasing N rate for experiment 222 in 1996 and experiment 502 in 1997.
Fertilizer N recoveries in wheat forage collected at flowering are reported in Table 5 for the isotope method. Using the isotope method, percent fertilizer N recovery was not significant at experiment 222 in 1996 or at experiment 502 in 1997. A linear trend was observed in 1997 at experiment 222 whereby fertilizer N recovery increased with increasing N rate.
Plant N loss was calculated by subtracting grain and straw N uptake from forage N uptake determined at flowering (Table 6). N loss at experiment 222 ranged from a net gain of 12.05 kg N ha-1 to a loss of 14.67 kg N ha-1 for the 45 and 135 kg N rates, respectively, in 1996. In the following year, N losses ranged from a net gain of 11.82 kg N ha-1, to a loss of 5.10 kg N ha-1 for the 0 and 135 kg N ha-1 plots, respectively. N loss at experiment 502 ranged from a gain of 20.48 to a loss of 41.55 kg N ha -1. A linear trend was noted for N uptake in the grain, straw and forage for both years and experiments (Table 6). Increased loss (e.g., plant N volatilization) with increasing N applied supports the buffering concept as proposed by Raun and Johnson (1995) and Kanampiu et al. (1997) since losses other than leaching increased at the N rates greater than that required for maximum yield.
Percent fertilizer N recoveries from the isotope method were also used to calculate plant N loss (Table 7). Fertilizer N recovery in the grain and straw was subtracted from fertilizer N recovery in the forage to determine loss. Loss increased with increasing N rate at experiment 222 in 1996, but was inconsistent for both experiments in

OSU Soil Fertility Research 1997 Page 151
1997 (Table 7). This method is probably an inaccurate estimate of plant N loss, because it does not account for N that has been mineralized from the soil organic pool.
Total fertilizer N recovery was estimated by summing the amounts found in the grain and straw from 1996 and 1997 at experiment 222 and from 1997 at experiment 502 and that found in the soil in 1997. This estimate does not account for N potentially lost via leaching, denitrification or through the plant as gaseous NH3. Even still, estimated total fertilizer N recovery was 86 and 66% at experiments 222 and 502, respectively (Table 8).
Fertilizer N recovery was not affected by N rate for the grain at experiment 222 in 1996 nor for the grain and straw in 1997 at experiment 222 and 502 (Table 8). A linear trend for fertilizer N recovery to decrease with increasing N rate was observed for straw in 1996 at experiment 222. Fertilizer N recovery in the soil (sum of amounts found within individually analyzed depths) decreased with increasing N applied at both locations.
Total fertilizer N recovery was higher for experiment 222 than 502 when evaluated for the same N rates (45 and 90 kg N ha-1). This contradicts other research done at Oklahoma State University where total fertilizer N recovery was higher in 502 than 222 (unpublished data). However, this may be due to only one year of data present for experiment 502 in the current study.
Total fertilizer N recovery by the isotope method does not account for N potentially lost via leaching, denitrification, or though the plant as gaseous ammonia. The lowest fertilizer N recovery, both overall and in the soil, was found in the 90 kg N ha-1. Figures 1 and 2 depict fertilizer N recovery in the soil by depth for experiment 222 and 502, respectively. In all cases, more than half of the fertilizer was found in the first 30 cm. At those depths beyond 30 cm, all had accumulated about the same amount of fertilizer. At depths >150 cm, very little 15N above natural abundance was present at experiment 222 in 1996.
Harper et al. (1987) documented that approximately 21% of applied fertilizer N was lost from wheat plants as NH3. Because of this we were interested in analyzing forage tissue at flowering for the presence of NH4
+. Combined with NO3- it was thought
that the relationship between the two inorganic N forms would demonstrate whether or not the plant had an excess and if reduction was taking place. The ratio of NO3
- to NH4+
was significant for N rate at experiment 222 in 1996 and at experiment 502 in 1997. Correlation between NO3
-:NH4+ and N loss at maturity was low at experiment 222 in
1996, but was highly correlated (R2 = 0.47) in 1997. At experiment 502 in 1997 the NO3
-:NH4+ ratio was also correlated with N loss (R2 = 0.29). In 1997 at both
experiments, NO3- concentration at flowering was related to N loss at maturity. As the
NO3-:NH4
+ increased, N loss increased (Figure 3). This indicates that the ratio of NO3- to
NH4+ at flowering could possibly be used to predict N loss.
CONCLUSIONS
Plant N loss plays a significant role in the efficiency of use of fertilizer N. In grain production systems, plant N loss is tied closely to N rate. As such, efforts should be made to minimize the amount of N fertilizer applied beyond the plant’s needs.

Page 152 1997 OSU Soil Fertility Research
Maximum nitrogen use efficiency generally takes place at low N rates and prior to the rate required for maximum yield.
This work showed that loss of N from the plant and soil increased with increasing N applied in two studies employing the use of 15N. Fertilizer N recovery accounting for 15N removed in the grain and straw and that remaining in the soil at the end of the experiment decreased with increasing N applied, which was consistent with increased N loss (plant volatilization and denitrification) with increasing N applied. Wheat was found to accumulate up to 190 kg N ha-1 in the forage by flowering, yet only 150 kg N ha-1 could be accounted for in the grain and straw at maturity. The ratio of NO3
- to NH4+
in wheat forage at flowering was found to be correlated with estimated plant N loss. This may serve as a method of identifying potential plant N loss in order to increase N use efficiency via alternative management strategies.

OSU Soil Fertility Research 1997 Page 153
Table 1. Treatments and surface soil test characteristics (0-15 cm) for experiments 222 and 502.Experiment Fertilizer Applied Soil Test Level
N P K pH P K Organic C Total N
---------------kg ha-1 yr-1------------------ mg kg-1 mg kg-1 g kg-1 g kg-1
222 0 29 38 6.0 57 221 8.2 0.645 29 38 5.7 65 283 8.9 0.790 29 38 5.4 57 253 9.8 0.8135 29 38 5.2 56 220 9.7 0.8
502 0 20 56 5.7 57 417 4.6 0.923 20 56 5.7 50 373 5.1 0.945 20 56 5.6 65 409 4.3 0.767 20 56 5.5 58 389 4.5 0.990 20 56 5.4 52 426 4.3 0.7112 20 56 5.3 55 455 5.1 0.9
pH, 1:1 soil:water, K and P, Mehlich III; Organic C (carbon) and Total N, dry combustion.

OSU Soil Fertility Research 1997 Page 154
Table 2. Average maximum and minimum temperatures and monthly rainfall for experiment 222, 1995-1997.Month Maximum,
CMinimum,C
Rainfall,mm
1995-1996September 39 3 111October 31 -1 16November 26 -7 2December 23 -12 50January 24 -17 1February 34 -28 5March 28 -14 24April 31 -4 10May 33 7 48Total 267
1996-1997September 35 6 128October 28 2 66November 26 -7 74December 24 -12 0January 26 -18 6February 22 -8 89March 33 -4 23April 29 -4 137May 33 3 62Total 585
Table 3. Average maximum and minimum temperatures and monthly rainfall for experiment 502, 1996-1997.Month Maximum,
CMinimum,C
Rainfall,mm
1996-1997September 35 7 155October 29 3 69November 23 -6 66December 22 -13 7January 23 -15 5February 21 -6 86March 29 -6 14April 27 -6 163May 33 5 92Total 657

OSU Soil Fertility Research 1997 Page 155
Table 4. Grain yield from experiment 222, 1995-1997 and experiment 502, 1996-1997Experiment Fertilizer Applied Grain Yield Fertilizer Response
N P K 1996 1997 1996 1997----------------------kg ha-1 yr-1----------------------
-------------kg ha-1---------------
222 0 29 38 815.90 942.85 - -45 29 38 1006.18 888.32 22.36 19.7490 29 38 1139.69 1135.40 12.66 12.62135 29 38 1235.64 1927.44 9.15 14.28
SED 62.96 128.10N rate linear *** ***N rate quadratic ns **
502 0 20 56 1342.39 -23 20 56 1969.17 85.6245 20 56 2271.61 50.4867 20 56 2590.99 38.6790 20 56 3169.02 35.21112 20 56 4009.41 35.80
SED 582.33N rate linear ***N rate quadratic ns
kg grain per kg N applied*, **, *** Significant at the 0.05, 0.01, and 0.001 probability levels, respectively. SED = standard error of the difference between two equally replicated treatment means.

OSU Soil Fertility Research 1997 Page 156
Table 5. Fertilizer N recovery in wheat forage collected at flowering for experiments 222 and 502, 1995-1997, isotope method.
Fertilizer Applied Fertilizer N Recovery
1996 1997Experiment N P K Forage Forage
------------------kg ha-1 yr-1------------------- ---------------%---------------222 0 29 38 - -
45 29 38 19.43 1.2790 29 38 21.51 3.24135 29 38 25.68 3.35
SED 4.17 0.46N rate linear ns *N rate quadratic ns ns
502 0 20 56 - -23 20 56 17.4145 20 56 24.6967 20 56 28.1190 20 56 27.19112 20 56 25.52
SED 3.82N rate linear nsN rate quadratic ns
*, **, *** significant at the 0.05, 0.01, and 0.001 probability levels, respectively. SED = standard error of the difference between two equally replicated treatment means. forage samples collected at flowering

OSU Soil Fertility Research 1997 Page 157
Table 6. Forage, grain and straw N uptake and estimated plant N loss, experiments 222, 1996-1997, and 502, 1997Location Fertilizer Applied Total N Uptake
1996 1997N P K Forage Grain Straw Loss/
GainForage Grain Straw Loss/
Gain
----------------kg ha-1 yr-1-------------
-------------------------------------------------------kg N ha-1--------------------------------------------------
222 0 29 38 29.40 23.47 12.74 -6.81 18.76 22.54 8.04 -11.8245 29 38 38.59 32.10 18.54 -12.05 42.81 23.13 21.43 -1.7590 29 38 70.72 40.63 27.50 2.59 96.62 31.01 55.02 -6.32135 29 38 102.49 48.41 39.41 14.67 143.61 51.69 71.93 5.1
SED 8.20 4.40 2.79 19.91 2.90 11.91N rate linear *** ** *** ** *** **N rate quadratic ns ns ns ns ** ns
502 0 20 56 29.46 32.83 11.08 -14.4523 20 56 56.21 50.01 26.68 -20.4845 20 56 127.96 57.05 47.54 23.3767 20 56 132.12 63.56 40.15 28.4190 20 56 182.29 90.54 63.05 28.70112 20 56 191.84 105.39 44.90 41.55
SED 24.79 14.65 9.55N rate linear *** *** ***N rate quadratic ns ns *
Loss/gain determined by subtracting forage N uptake at flowering from total N in the grain and straw at maturity.*, **, *** significant at the 0.05, 0.01, and 0.001 probability levels, respectively. SED = standard error of the difference between two equally replicated treatment means.

Page 158 1997 OSU Soil Fertility Research
Table 7. Forage, grain and straw N uptake and estimated plant N loss by percent fertilizer recovery, isotope method, experiments 222, 1996-1997, and 502, 1997Location Fertilizer Applied Fertilizer N Recovery
1996 1997N P K Forage Grain Straw Loss/
GainForage
Grain Straw Loss/Gain
----------------kg ha-1 yr-1----------
--------------------------------------------------------------%----------------------------------------------
222 0 29 38 - - - - - - -45 29 38 19.43 12.89 5.85 0.69 1.27 0.70 0.56 0.0190 29 38 21.51 9.71 4.55 7.25 3.24 1.07 1.87 0.30135 29 38 25.68 12.04 3.49 10.15 3.35 1.23 1.84 0.28
SED 4.17 2.06 0.78 0.46 0.27 0.59N rate linear ns ns * * ns nsN rate quadratic ns ns ns ns ns ns
502 0 20 56 - - - -23 20 56 17.41 11.72 7.39 -1.745 20 56 24.69 9.56 9.77 5.3667 20 56 28.11 11.99 7.62 8.590 20 56 27.19 10.59 7.36 9.24112 20 56 25.52 12.32 5.26 7.94
SED 3.82 2.43 2.79N rate linear ns ns nsN rate quadratic ns ns ns
Loss/gain determined by subtracting forage N uptake at flowering from total N in the grain and straw at maturity.*, **, *** significant at the 0.05, 0.01, and 0.001 probability levels, respectively. SED = standard error of the difference between two equally replicated treatment means.

OSU Soil Fertility Research 1997 Page 159
Table 8. Fertilizer N recovery in the grain, straw and soil for experiments 222 and 502, 1996-97, isotope method.Experiment
Fertilizer Applied Fertilizer N Recovery
1996 1997 1997N P K Grain Straw Grain Straw Total
Grain + Straw (2yrs)
Soil Total
-----------------kg ha-1 yr-1------------
----------------------------------------------------------%-----------------------------------------------
222 0 29 38 - - - - - - -45 29 38 12.89 5.85 0.70 0.56 20.0 66.02 86.0290 29 38 9.71 4.55 1.07 1.87 17.2 34.70 51.9135 29 38 12.04 3.49 1.23 1.84 18.6 25.04 43.64
SED 2.06 0.78 0.27 0.59 14.95N rate linear ns * ns ns *N rate quadratic ns ns ns ns ns
502 0 20 56 - - - - -23 20 56 11.72 7.39 19.11 47.29 66.4045 20 56 9.56 9.77 19.33 33.49 52.8267 20 56 11.99 7.62 19.61 28.61 48.2290 20 56 10.59 7.36 17.95 21.50 39.45112 20 56 12.32 5.26 17.58 22.03 39.61
SED 2.43 2.79 8.25N rate linear ns ns *N rate quadratic ns ns ns
*, **, *** significant at the 0.05, 0.01, and 0.001 probability levels, respectively. SED = standard error of the difference between two equally replicated treatment means.

OSU Soil Fertility Research 1997 Page 160
Figure 1. Fertilizer N recovery in the soil by depth and N rate, experiment 222, 1996 and 1997 (SED - standard error of the difference between two equally replicated means)
Percent nitrogen fertilizer recovery in soil, experiment 502, 1996-1997
0
20
40
60
80
100
120
0 5 10 15 20 25 30
Dept
h, c
m
23 kg N/ha
45 kg N/ha
67 kg N/ha
90 kg N/ha
112 kg N/haSED = 2.71
Figure 2. Fertilizer N recovery in the soil by depth and N rate, experiment 502, 1997 (SED - standard error of the difference between two equally replicated means)
0
20
40
60
80
100
120
140
160
0 5 10 15 20 25 30
Percent nitrogen fertilizer recovery in soil, experiment 222, 1995-1996
Dept
h, c
m
45 kg N/ha
90 kg N/ha
135 kg N/haSED = 3.60
Percent nitrogen fertilizer recovery in soil, experiment 222, 1996-1997
0
20
40
60
80
100
120
0 5 10 15 20 25
Dept
h, c
m
45 kg N/ha
90 kg N/ha
135 kg N/haSED = 7.51

OSU Soil Fertility Research 1997 Page 161
Figure 3. NO3:NH4 ratio versus N loss for experiments 222, 1996-1997, and 502, 1997
-30
-20
-10
0
10
20
30
40
50
0 0.2 0.4 0.6 0.8 1 1.2
NO3:NH4
N Lo
ss, k
g ha
-1
Exp. 222, 1996
Exp. 222, 1997
Exp. 502, 1997

Page 162 1997 OSU Soil Fertility Research
REFERENCESAltom, W., J.L. Rogers, W.R. Raun, G.V. Johnson, and S.L. Taylor. 1996. Long-term rye-wheat-ryegrass
forage yields as affected by rate and date of applied nitrogen. J. Prod. Agric. 9(4):510-516.
Carter, J.N., O.L. Bennett, and R.W. Pearson. 1967. Recovery of fertilizer nitrogen under field conditions using nitrogen-15. Soil Sci. Am. Proc., 31:50-56.
Daigger, L.A., D.H. Sander, and G.A. Peterson. 1976. Nitrogen content of winter wheat during growth and maturation. Agron J. 68:815-818.
Follett, R.F., L.K. Porter, and A.D. Halvorson. 1991. Border effects on nitrogen-15 fertilized winter wheat microplots grown in the Great Plains. Agron. J. 83:608-612.
Francis, D.D., J.S. Schepers, and M.F. Vigil. 1993. Post-anthesis nitrogen loss from corn. Agron. J. 85:659-663.
Harper, L.A., R.R. Sharpe, G.W. Langdale, and J.E. Giddens. 1987. Nitrogen cycling in a wheat crop: soil, plant, and aerial nitrogen transport. Agron. J. 79:965-973.
Harris, G.H., O.B. Hesterman, E.A. Paul, S.E. Peters, and R.R. Janke. 1994. Fate of legume and fertilizer nitrogen-15 in a long-term cropping systems experiment. Agron. J. 86:910-915.
Hauck, R.D. and J.M. Bremner. 1976. Use of tracers for soil and fertilizer nitrogen research. In N.C. Brady (ed.) Advances in Agronomy 28:219-266.
Johnson, G.V. and W.R. Raun. 1995. Nitrate leaching in continuous winter wheat: Use of a soil-plant buffering concept to account for fertilizer nitrogen. J. Prod. Agric. 8:486-491.
Kanampiu, F.K., W.R. Raun, and G.V. Johnson. 1997. Effect of nitrogen rate on plant nitrogen loss in winter wheat varieties. J. Plant Nutr. 20:389-404.
Kohl, D.H., G.B. Shearer, and B. Commoner. 1973. Variation in 15N in corn and soil following application of fertilizer nitrogen. Soil Sci. Soc. Amer. Proc. 37:888-892.
Kowalenko, C.G. 1989. The fate of applied nitrogen in a Fraser Valley soil using 15N in field microplots. Can. J. Soil Sci. 69:825-833.
Lachat Instruments. 1989. Quickchem method 12-107-04-1-B. Lachat Instr., Milwaukee, WI.
Lachat Instruments. 1990. Quickchem method 12-107-06-1-B. Lachat Instr., Milwaukee, WI.
Moll, R.H., E.J. Kamprath, and W.A. Jackson. 1982. Analysis and interpretation of factors which contribute to efficiency of nitrogen utilization. Agron. J. 74:562-564.
Morgan, J.A. and W.J. Parton. 1989. Characteristics of ammonia volatilization from spring wheat. Crop Sci. 29:726-731.
Olson, R.V., L.S. Murphy, H.C. Moser, and C.W. Swallow. 1979. Fate of tagged fertilizer nitrogen applied to winter wheat. Soil Sci. Am. J. 43:973-975.
Olson, R.V. and C.W. Swallow. 1984. Fate of labeled nitrogen fertilizer applied to winter wheat for five years. Soil Sci. Soc. Am. J. 48:583-586.
Raun, W.R., and G.V. Johnson. 1995. Soil-plant buffering of inorganic nitrogen in continuous winter wheat. Agron. J. 87:827-834.
Reddy, G.B. and K.R. Reddy. 1993. Fate of nitrogen-15 enriched ammonium nitrate applied to corn. Soil Soc. Am. J. 57:111-115.
SAS Institute Inc. 1985. SAS procedures guide for personal computers. 6 th ed. SAS Institute Inc., Cary, NC, USA.

OSU Soil Fertility Research 1997 Page 163
Schepers, J.S., D.D. Francis, and M.T. Thompson. 1989. Simultaneous determination of total C, total N, and 15N on soil and plant material. Commun. in Soil. Sci. Plant Anal. 20(9&10):949-959.
Sharpe, R.R., L.A. Harper, J.E. Giddens, and G.W. Langdale. 1988. Nitrogen use efficiency and nitrogen budget for conservation tilled wheat. Soil Sci. Am. J. 52:1394-1398.
Shearer, G. and J.O. Legg. 1975. Variations in the natural abundance of 15N of wheat plants in relation to fertilizer nitrogen applications. Soil Sci. Am. Proc. 39:896-901.
Steel, R.G.D. and J.H. Torrie. 1980. Principles and procedures of statistics: a biometrical approach. 2 nd
ed. McGraw-Hill Book Company, New York, NY.
Stutte, C.A., R.T. Weiland, A.R. Blem. 1979. Gaseous nitrogen loss from soybean foliage. Agron. J. 71:95-97.
Varvel, G.E. and Todd Andrews Peterson. 1990. Nitrogen fertilizer recovery by corn in monoculture and rotation systems. Agron. J. 82:935-938.
Vose, P.B. Introduction to Nuclear Techniques in Agronomy and Plant Biology. Pergamon Press, NY: 1980.
Walters, D.T. and G.L. Malzer. 1990. Nitrogen management and nitrification inhibitor effects on nitrogen-15 urea: I. Yield and fertilizer use efficiency. Soil Sci. Soc. Am. J. 54:115-122.
Walters, D.T. and G.L. Malzer. 1990. Nitrogen management and nitrification inhibitor effects on nitrogen-15 urea: II. Nitrogen leaching and balance. Soil Sci. Soc. Am. J. 54:122-130.
Webster, C.P. R.K. Belford, and R.Q. Cannell. 1986. Crop uptake and leaching losses of 15N labelled fertilizer nitrogen in relation to waterlogging of clay and sandy loam soils. Plant and Soil 92:89-101.
Westerman, R.L., R.K. Bowman, W.R. Raun, and G.V. Johnson. 1994. Ammonium and nitrate nitrogen in soil profiles of long-term winter wheat fertilization experiments. Agron. J. 86:94-99.
Westerman, R.L. and L.T. Kurtz. 1972. Residual effects of 15N-labeled fertilizers in a field study. Soil Sci. Amer. Proc., 36:91-94.
Westerman, R.L. and L.T. Kurtz. 1973. Priming effect of 15N-labeled fertilizers on soil nitrogen in field experiments. Soil Sci. Am. Proc., 37:725-727.
Westerman, R.L., L.T. Kurtz, and R.D. Hauck. 1972. Recovery of 15N-labeled fertilizers in field experiments. Soil Sci. Am. Proc., 36:82-86.
Wuest, S.B. and K.G. Cassman. 1992. Fertilizer-nitrogen use efficiency of irrigated wheat: I. Uptake efficiency of preplant versus late-season application. Agron. J. 84:682-688.
Procedures for adding 15 N stock solution in the field.
Make-up stock solution of 15NH415NO3 containing 22.5000g of N/liter (64.3185 g of 15NH4
15NO3/liter).Pipette the correct aliquot of 15N stock solution into a 1 liter volumetric flask.Bring up to final volume with double-distilled H2O (1000ml).Pour the 15N solution into a receiving vessel.Rinse the l liter volumetric with 2 - 250ml rinses of double-distilled H2O and pour into receiving vessel.Final volume in receiving vessel is 1000ml.Broadcast the 1000ml 15N solution uniformly over the 0.25m2 area. Use sprayer.Exercise extreme caution to prevent cross contamination of plots and to insure all of the 15N material is
applied uniformly.The metal rectangle (76.2 x 32.8cm = 0.25m2) must be inserted prior to application of 15N. Each rectangle
must be equally placed across 4 drill rows in the center of each plot.All other areas outside the 15N-fertilizer area should be treated with non-labeled fertilizer.

Page 164 1997 OSU Soil Fertility Research
Fertilizer Nitrogen Recovery in Long-Term Continuous Winter Wheat
W. R. Raun, G.V. Johnson, R.L. Westerman, H.L. Lees and J. Chen
ABSTRACTFertilizer N recovery in crop production systems seldom exceeds 50%. Two continuous long-term (>20 years) winter wheat (Triticum aestivum L.) nitrogen (N) rate fertility experiments were selected to evaluate 15N fertilizer recovery in the grain, straw and soil. Ammonium nitrate enriched with 11.888 atom % 15N (15NH4
15NO3) was applied in the first year to microplots within main plots. Conventional ammonium nitrate containing natural abundance (0.366% 15N) was added to the microplots the second and third year to allow measurement of residual effects of the enriched fertilizer added the first year. This also provided an estimate of total fertilizer N recovery over a three year period. Following three years of continuous winter wheat, deep soil cores (0.025 m in diameter) were taken to a depth of 1.20 m and partitioned into 0-0.15, 0.15-0.30, 0.30-0.45, 0.45-0.60, 0.60-0.90 and 0.90-1.20 m. From all microplots, percent 15N recovered at flowering, in the grain and straw at harvest and in the soil was determined whereby all 15N was expressed as atom % excess corrected for background abundance. Total fertilizer N recovery decreased with increasing N applied at both locations. Fertilizer N recovery was greater where there was no evidence of priming (increased net mineralization of organic N pools when low rates of fertilizer N are applied), less easily mineralizable N in organic pools and reduced soil-plant buffering (N that can be applied in excess of that needed for maximum yield without resulting in increased soil profile inorganic N accumulation) were previously found. Increased fertilizer N recovery at experiment 502 was thought to be associated with decreased microbial activity, possibly due to increased lignin within the organic matter and decreased immobilization. This work also suggests that increasing fertilizer N recovery may actually increase the potential for NO3-N leaching.
INTRODUCTION
ecovery of fertilizer N in crop production systems has been investigated for years, however, N balance studies seldom account for more than 50% of the fertilizer N applied (Rasmussen and Rohde, 1991). Early work by MacVicar et
al. (1950) reported fertilizer N recovery levels less than 47% when evaluating sudangrass (Sorghum sudanense) and oats (Avena sativa L.). Their work, which employed the use of 15N labeled fertilizer, considered denitrification to be a significant sink for unaccounted N. Similar studies with sudangrass by Carter et al. (1967) attributed unrecovered 15N to gaseous loss since potential leaching losses were accounted for. More recent N balance studies have attributed sizable losses of fertilizer N to denitrification (Fredrickson et al., 1982, Owens, 1960; Chichester and Smith, 1978; Olson, 1980). Unaccounted fertilizer N has also been attributed to immobilization in surface soil horizons (Fredrickson et al., 1982; Webster et al., 1986). Nitrogen balance in
R

OSU Soil Fertility Research 1997 Page 165
agricultural production systems continues to focus on NO3-N leaching (Jokela and Randall, 1989 and Olson and Swallow, 1984). However, little evidence exists to document leaching losses from non-point sources of fertilizer N in crop production systems (Westerman and Kurtz, 1972; Varvel and Peterson, 1990).
Recent work has focused increased attention on gaseous N loss from plants. Plant NH3 losses have been observed in wheat (Parton et al., 1988, Harper et al., 1987) while similar results have also been found in corn (Francis et al., 1993). In experiments conducted by Sharpe et al. (1988), it was estimated that 21% of the applied N fertilizer was lost from the wheat plant and soil as volatilized NH3 in an experiment that also reported no NO3-N leaching. Without exception, pre 1980’s 15N balance work which attributed unaccounted N loss to leaching and denitrification, did not consider plant N loss as a potential sink. Because of this, past 15N balance studies which documented crop removal, leaching and fertilizer N remaining in the soil can now be used to estimate combined losses from denitrification and plant volatilization.
The objectives of this experiment were a) to determine the efficiency of N fertilizer applications in continuous winter wheat; and b) to determine the residual effect of 15N fertilizer applications on winter wheat in soils that have had the same annual applications of fertilizers over the last 11 to 24 years.
MATERIALS AND METHODS
Two continuing long-term winter wheat fertility experiments were selected for additional study (Table 1). Both experiments employ a randomized complete block experimental design and are identified as 222 and 502. Winter wheat was planted in 0.25 m rows at seeding rates of 67 kg ha-1 and grown under conventional tillage (disk incorporation of wheat straw residues following harvest and prior to planting) in all years, at both locations. Ammonium nitrate (N-P-K, 34-0-0), triple superphosphate (0-20-0), and potassium chloride (0-0-50) were broadcast and incorporated prior to planting. Annual fertilizer treatments and initial surface (0-0.3 m) soil test results for each experiment are reported in Table 2.
Microplots (0.33 x 0.76 m) were established in the center of the existing large plots at each site. Using 0.25 m row spacing, three rows were included in the 0.76 m wide microplots. Metal squares 0.15 m high were driven into the soil 0.07 m deep to prevent surface runoff and lateral contamination. Ammonium nitrate enriched with 11.888 atom % 15N (15NH4
15NO3) was applied the first year (1988) in the microplots at the same N rate as the remainder of the large plot (Table 2). Conventional ammonium nitrate containing normal abundance (0.366 % 15N) was added to the microplots the second and third year to allow measurement of residual effects of the enriched fertilizer added the first year. This also provided an estimate of total fertilizer N recovery over a three year period. Microplots were established in only three of four replications at each site. Following the first, second and third harvest, soil cores (0.025 m in diameter) were taken to a depth of 1.20 m and partitioned into 0-0.15, 0.15-0.30, 0.30-0.45, 0.45-0.60, 0.60-0.90 and 0.90-1.20 m. Immediately following core sampling, core holes were filled and packed with previously collected soil. Soil samples were air-dried at ambient temperature and ground to pass a 100-mesh screen.

Page 166 1997 OSU Soil Fertility Research
Each year, the entire above ground biomass was removed from microplots at harvest and separated into grain and straw. Grain and straw samples were subsequently dried at 70°C in a forced air oven, weighed, ground and analyzed for total N and N isotope ratio with an automated N analyzer and isotope ratio mass spectrometer (Schepers et al., 1989). Unlike the way main plots have been treated in each of these long-term experiments, the straw removed was not returned and incorporated. From all microplots, percent nitrogen in the grain and straw at harvest and in the soil was determined as per the work of Hauck and Bremner (1976), whereby all 15N was expressed as atom % excess corrected for background abundance.
Analysis of variance for all dependent variables evaluated was conducted by-year due to heterogeneity of error (over years). Non-orthogonal single degree of freedom contrasts were used to estimate linear and quadratic response to applied fertilizer N.
RESULTS AND DISCUSSION
Previous StudiesData reported here is an extension of work on two (222 and 502) of the four long-
term winter wheat experiments reported by Westerman et al. (1994), Raun and Johnson (1995) and Johnson and Raun (1995). Initial work by Westerman et al. (1994) documented accumulation of NH4-N and NO3-N in the soil profiles following long-term annually applied fertilizer N rates in winter wheat. This work concluded that no accumulation of NH4-N and NO3-N occurred in soil profiles at recommended N rates where maximum yields were obtained, at either experiment 222 or 502. Raun and Johnson (1995) and Johnson and Raun (1995) proposed a soil-plant buffering concept to explain why soil profile inorganic N did not begin to increase until N rates in excess of that required for maximum yield were applied. Their work noted that loss of N from the soil-plant system can take place via plant N volatilization, denitrification and soil surface volatilization when N rates exceed that required for maximum yield. Also, increased grain N, straw N, and organic N and C in the soil are found when N rates exceed that needed for maximum yields. The soil-plant buffering concept helped to explain why unaccounted N should not be immediately attributed to leaching in studies where these biological mechanisms remained active.
Fertilizer N RecoveryAverage maximum and minimum temperatures and monthly rainfall are reported
from 1988 to 1991 in Table 3. Fertilizer N recovery in the grain and straw for 1989, 1990 and 1991 is reported in Table 4. Recovery of fertilizer N in the soil at the end of the experiment in 1991 is also included in Table 4 along with the total fertilizer N recovery (grain + straw in all three years, plus that remaining in the soil).
Differences in fertilizer N recovery were inconsistent from year to year when observing results in the grain and straw (Table 4). At experiment 222, fertilizer N recovery was not affected by N rate in either the grain or straw in 1989 and 1990. However, a linear trend for fertilizer N recovery to decrease with increasing N applied was observed in 1991. Similar results were noted in experiment 502 where applied N did not affect fertilizer N recovery in the grain or straw in 1989. However, unlike results

OSU Soil Fertility Research 1997 Page 167
noted in experiment 222, fertilizer N recovery increased with N rate for both the grain and straw in 1990 (significant N rate linear contrast). By 1991, fertilizer N recovery decreased with increasing N applied in the grain and straw in experiment 502, similar to that noted in experiment 222 (Table 4). Fertilizer N recovery in the soil (sum of amounts found within individually analyzed depths) decreased with increasing N applied at both locations.
Total fertilizer N recovery was estimated by summing the amounts found in the grain and straw from 1989 to 1991 and that found in the soil at the end of the experiment. This estimate does not account for N potentially lost via leaching, denitrification or through the plant as gaseous NH3. Without accounting for leaching, denitrification and plant gaseous N loss, estimated total fertilizer N recovery at the lowest N rate was 68 and 90% at experiments 222 and 502 (Table 4). Similar work by Olson et al. (1979) in winter wheat could not account for over 20% of the 15N fertilizer applied.
Total fertilizer N recovery decreased with increasing N applied at both locations. However, total fertilizer N recovery was higher in experiment 502 compared to 222 when evaluating the same N rates (45 and 90 kg N ha-1, Table 4). This was also observed when looking at recovery in the grain + straw and soil components individually. Work by Raun et al. (1997) suggested that priming (increased net mineralization of organic N pools when low rates of fertilizer N are applied) occurred in experiment 222 since decreased total surface (0-0.30 m) soil N at low rates was found in experiment 222, but not in experiment 502. Priming was proposed by Westerman and Kurtz (1973) as the stimulation of microbial activity by N fertilizers (at low N rates) which could increase mineralization of soil N, thus making more soil N available for plants. Raun et al. (1997) further suggested that soil-plant buffering (N that can be applied in excess of that needed for maximum yield without resulting in increased soil profile inorganic N accumulation) will be greater in soils where priming is observed, a result of increased N from easily mineralizable N pools. They also noted that these soil-plant environments will be capable of immobilizing excess mineral N. Combined, these results help explain why fertilizer N recovery was greater in experiment 502 (no priming, less easily mineralizable N, and less soil-plant buffering). It is hypothesized that less fertilizer N was immobilized in stable organic pools and more fertilizer N remained in inorganic N forms at experiment 502 which ultimately led to increased fertilizer N recovery. Furthermore, this could suggest that the increased fertilizer N recovery at experiment 502 was associated with decreased microbial activity which would be expected in soils where the organic matter was composed of high quantities of lignin (personal communication, J.Q. Lynd, 1996). However, consistent with work by Johnson and Raun (1995), increased fertilizer use efficiency (decreased soil-plant buffering) will likely increase the risk for NO3-N leaching. As discussed in their work, the consequences of the buffering mechanisms (increased gaseous plant N loss, increased grain protein, increased denitrification, increased immobilization, and increased ammonia volatilization from soils when N fertilizer rates exceed that required for maximum yield) are the poor N use efficiencies obtained in crop production (often below 50%). They may, however, be desirable considering their potential to decrease NO3-N leaching (Johnson and Raun, 1995).
Fertilizer N recovery in the soil, by depth for all treatments is reported in Figure 1 for experiments 222 and 502, respectively. Following three years of continuous wheat

Page 168 1997 OSU Soil Fertility Research
during which wet periods were present when soils were saturated, it was surprising to find such large recovery of 15N in the surface 0.15 m horizon. These results indicate that the potential for NO3-N leaching was very small at both sites since little 15N was found at depths > 0.30 m. At the same corresponding N rates in each experiment (45 and 90 kg N ha-1) fertilizer N recovery in the soil was greater in experiment 502 compared to experiment 222. At experiment 502, significantly greater quantities of NH4-N were found in surface horizons when compared to NH4-N in experiment 222 (data not reported). Stevenson (1994) noted that the greater the degree of humification, the higher the CEC. If the percent lignin content was greater in experiment 502 compared to 222, and this was largely a result of increased weathering, it is possible that the increased fertilizer N recovery in the soil was from the exchangeable fraction.
It was interesting to find detectable levels of 15N at depths > 20 cm (Figure 1). However, at both locations 15N was found at concentrations just slightly above background. If leaching was the mechanism resulting in subsoil accumulation of 15N, accumulation patterns similar to that found by Westerman et al. (1993) should have been observed. Because this data represents recovery at the end of a three year period, it is thought that surface cracks led to small quantities of soil organic matter being broken off at the surface (where large quantities of 15N remained, even after three years) and left to accumulate at the depth where cracking stopped.
Differences in fertilizer recovery were inconsistent from year to year, and appear related to crop response to fertilizer. In the first year following addition of 15N, grain yield response to fertilizer was relatively poor at experiment 222 and good at 502. At 222, the 45 kg N ha-1 rate resulted in 8.4 kg grain produced per 1 kg N. The 90 kg N ha-1
rate produced only 4.2 kg grain per 1 kg N, but, the 134 kg N ha -1 rate yielded 9.8 kg grain per 1 kg N (Table 5). Whatever the reason for the low, but positive grain response to fertilizer N, we believe fertilizer N recovery as identified using 15N should parallel yield response. At 502 the yield from 45 kg N ha -1 resulted in 34.5 kg grain per 1 kg N compared to the yield for the control. The yield from 45 kg N ha -1 was 81% of maximum and 277% of the control at 502, but only 64% of maximum and 130% of the control at 222.
The relatively good yields and poor response to fertilizer N at 222 indicate a more active soil biology (in 1989) capable of mineralizing more indigenous soil N than at 502. Consequently, lower percent 15N fertilizer recovery at 222 may be a result of lower crop demand for fertilizer than at 502. Greater mineralization of indigenous soil N and lower yield potential at 222 results in comparable rates providing a richer soil N environment at 222 than 502. Subsequent N losses from the soil-plant system have been shown to be positively related to available soil N (Raun and Johnson, 1995) and would be expected to be greater at 222. This is shown to be the case as total fertilizer recovery is less at 222 than 502. Conservation of fertilizer N that is not used by crops results primarily from net soil immobilization of N, which apparently was more active in the first year at 502, and led to higher fertilizer N recovery in the second year and total soil recoveries at the end of the three year period.
Fertilizer N recovery by the crop was very small in the second year for both sites and small relative to the total recovered from the soil after three years, evidence that much of the 15N not used by the crop or lost from the soil in the first year becomes an integral part of a somewhat large stable soil-N. Significant differences in 15N recovered

OSU Soil Fertility Research 1997 Page 169
from the soil, related to fertilizer N rate, result primarily from first year 15N losses. It is interesting to note the significant increasing recovery of fertilizer N with rate in the second year at 502. This apparently results from more active N turnover (mineralization-immobilization) at the higher rates providing better opportunity for plant uptake. A similar trend was not present at 222 and may be related to generally lower microbial activity and/or a smaller organic N pool.
It is of interest to note the strong linear relationship between total 15N fertilizer recovered and N fertilizer rate, especially when considering N leaching. Nitrogen leaching should be a function of rainfall amounts and intensities, soil permeability, and soil water depletion by the crop. We expect the first three of these factors to be independent of N rate. The last factor should be inversely related to rate (e.g. as N rate increases, more crop is grown and soil water is depleted). Higher N rates should therefore lessen potential N leaching. Nitrogen losses were calculated by subtracting the total amount recovered (grain + straw in 1989, 1990 and 1991 + the amount remaining in the soil following the three years of removal) from 100 (Table 4 and Figure 2). We believe increasing N loss with increasing N rate is largely a result of plant ammonia losses when available N exceeds that which the plant system can utilize. Plant utilization is a function of potential yield. Greater N losses at 222 were likely a result of lower yield levels causing rates to be in greater excess than comparable rates at 502.
REFERENCESCarter, J.N., O.L. Bennett and R.W. Pearson. 1967. Recovery of fertilizer nitrogen under field conditions
using nitrogen-15. Soil Sci. Soc. Amer. Proc. 31:50-56.
Chichester, F.W. and S.J. Smith. 1978. Disposition of 15N-labeled fertilizer nitrate applied during corn culture in field lysimeters. J. Environ. Qual. 7:227-233.
Francis, D.D., J.S. Schepers and M.F. Vigil. 1993. Post-anthesis nitrogen loss from corn. Agron. J. 85:659-663.
Fredrickson, J.K., F.E. Koehler and H.H. Cheng. 1982. Availability of 15N labeled nitrogen in fertilizer and in wheat straw to wheat in tilled and no-till soil. Soil Sci. Soc. Am. J. 46:1218-1222.
Harper, L.A., R.R. Sharpe, G.W. Langdale and J.E. Giddens. 1987. Nitrogen cycling in a wheat crop: soil, plant and aerial nitrogen transport. Agron. J. 79:965-973.
Hauck, R.D., and J.M. Bremner. 1976. Use of tracers for soil and fertilizer nitrogen research. Adv. Agron. 28:219-266.
Johnson, G.V., and W.R. Raun. 1995. Nitrate leaching in continuous winter wheat: use of a soil-plant buffering concept to account for fertilizer nitrogen. J. Prod. Agric. 8:486-491.
Jokela, W.E., and G.W. Randall. 1989. Corn yield and residual soil nitrate as affected by time and rate of nitrogen application. Agron. J. 81:720-726.
MacVicar, Robert, William L. Garman and Robert Wall. 1950. Studies on nitrogen fertilizer utilization using 15N. Soil Sci. Soc. Proc. 15:265-268.
Olson, R.V., and C.W. Swallow. 1984. Fate of labeled nitrogen fertilizer applied to winter wheat for five years. Soil Sci. Soc. Am. J. 48:583-586.
Olson, R.V. 1980. Fate of tagged nitrogen fertilizer applied to irrigated corn. Soil Sci. Soc. Am. J. 44:514-517.

Page 170 1997 OSU Soil Fertility Research
Olson, R.V., L.S. Murphy, H.C. Moser and C.W. Swallow. 1979. Fate of tagged fertilizer nitrogen applied to winter wheat. Soil Sci. Soc. Am. J. 43:973-975.
Owens. L.D. 1960. Nitrogen movement and transformations in soils as evaluated by a lysimeter study utilizing isotopic nitrogen. Soil Sci. Soc. Am. Proc. 24:372-376.
Parton, W.J., J.A. Morgan, J.M. Altenhofen and L.A. Harper. 1988. Ammonia volatilization from spring wheat plants. Agron. J. 80:419-425.
Rasmussen, P.E., and C.R. Rohde. 1991. Tillage, soil depth, and precipitation effects on wheat response to nitrogen. Soil Sci. Soc. Am. J. 55:121-124.
Raun, W.R., G.V. Johnson, S.B. Phillips and R.L. Westerman. 1997. Effect of long-term nitrogen fertilization on soil organic carbon and total nitrogen in continuous wheat. J. Soil and Tillage Res. (in press)
Raun, W.R., and G.V. Johnson. 1995. Soil-plant buffering of inorganic nitrogen in continuous winter wheat. Agron. J. 87:827-834.
Sharpe, R.R., L.A. Harper, J.E. Giddens and G.W. Langdale. 1988. Nitrogen use efficiency and nitrogen budget for conservation tilled wheat. Soil Sci. Soc. Am. J. 52:1394-1397.
Schepers, J.S., D.D. Francis, and M.T. Thompson, 1989. Simultaneous determination of total C, total N, and 15N on soil and plant material. Commun. In Soil Sci. Plant Anal. 20:949-959.
Stevenson, F.J. 1994. Humus chemistry, genesis, composition, reaction. John Wiley & Sons, Inc. New York,NY.
Varvel, G.E., and Todd Andrews Peterson. 1990. Residual soil nitrogen as affected by continuous, two-year and four-year crop rotation systems. Agron. J. 82:958-962.
Webster, C.P., R.K. Belford and R.Q. Cannell. 1986. Crop uptake and leaching losses of 15N labelled fertilizer nitrogen in relation to waterlogging of clay and sandy loam soils. Plant and Soil. 92:89-101.
Westerman, Robert L., Randal K. Boman, William R. Raun and Gordon V. Johnson. 1994. Ammonium and nitrate nitrogen in soil profiles of long-term winter wheat fertilization experiments. Agron J. 86:94-99.
Westerman, R.L., and L.T. Kurtz. 1972. Residual effects of 15N-labeled fertilizers in a field study. Soil Sci. Soc. Am. Proc. 36:91-94.
Westerman, R.L., and L.T. Kurtz. 1973. Priming effect of 15N-labeled fertilizers on soil nitrogen in field experiments. Soil Sci. Soc. Amer. Proc. 37:725-727.

OSU Soil Fertility Research 1997 Page 171
Figure 1. Fertilizer N recovery in the soil by depth and N rate, experiments 222 and 502, 1991 (SED - standard error of the difference between two equally replicated means).
Figure 2. Estimated fertilizer N loss as a function of N applied, experiments 222 and 502.
y = 0.25x + 19.31R2 = 0.99
y = 0.26x - 1.05R2 = 0.97
0
10
20
30
40
50
60
0 50 100 150N rate, kg/ha
Fert
ilize
r N lo
ss, %
Exp. 222Exp. 502
0 10 20 30 40 500
20
40
60
80
100
120
140
456790112
Fertilizer N Recovery in Soil, %
Dept
h, c
m
502, 1991SED = 3.54
0 10 20 30 40 500
20
40
60
80
100
120
140
4590135
Fertilizer N Recovery in Soil, %
Dept
h, c
m
222, 1991SED = 4.05

Page 172 1997 OSU Soil Fertility Research
Table 1. Year established and soil core sampling dates for long-term experiments 222 and 502.___________________________________________________________________________________________Experiment Year Number of Dates Plot size
Established Replications Sampled_________________________________________________________________________
Kirkland silt loam (fine, mixed, thermic Udertic Paleustoll)
222 1969 4 Sept. 1989 6.1 x 18.3 mSept. 1990Sept. 1991
Grant silt loam (fine-silty, mixed, thermic Udic Argiustoll)
502 1970 4 Sept. 1989 4.9 x 18.3 mSept. 1990Sept. 1991
_________________________________________________________________________
Table 2. Treatments and surface soil test characteristics (0-30 cm) for experiments 222 and 502._____________________________________________________________________________________________________________Experiment Fertilizer Applied Soil Test Level
N P K pH P K Organic C╪ Total N╪____________________________________________________________________________________________________
----------- kg ha-1 yr-1 ----------- mg kg-1 mg kg-1 g kg-1 g kg-1
222 0 29 38 5.85 51 218 6.15 0.7945 29 38 5.84 38 200 6.16 0.7590 29 38 5.80 34 155 6.14 0.75134 29 38 5.73 26 130 6.48 0.84
SED 0.08 11 36 0.31 0.05
502 0 20 56 5.95 70 488 5.34 0.7045 20 56 5.76 71 467 5.88 0.7267 20 56 5.67 75 455 5.94 0.8090 20 56 5.60 72 468 5.98 0.78112 20 56 5.49 83 457 5.76 0.79
SED 0.14 17 38 0.44 0.02____________________________________________________________________________________________________pH, 1:1 soil:water; K and P, Mehlich III; Organic C (carbon) and Total N, dry combustion, ╪ average of 0-15 and 15-30 cm profiles, SED - standard error of the difference between two equally replicated means.

OSU Soil Fertility Research 1997 Page 173
Table 3. Average maximum and minimum temperatures and monthly rainfall for experiments 222 and 502, 1988-1991.__________________________________________________________________________________________ 222 502Month Maximum Minimum Rainfall Maximum Minimum Rainfall
oC oC mm oC oC mm__________________________________________________________________________________________
1988-1989September 30 15 197.6 30 12 107.2October 21 7 39.6 20 7 65.0November 17 2 87.6 16 1 38.1December 12 3 24.4 12 20 7.6January 12 4 42.2 12 4 31.5February 11 6 43.4 4 -7 18.3March 17 3 95.0 17 1 54.6April 22 9 4.4 23 8 4.1May 26 14 171.7 26 13 97.0June 29 17 138.7 29 16 184.2Total 844.6 607.6
1989-1990September 27 13 123.4 27 13 63.5October 24 9 71.6 24 7 59.7November 18 1 0 17 -1 0.3December 5 -10 12.7 4 -9 1.5January 3 -3 47.0 13 -2 41.1February 13 -1 97.0 13 -1 69.6March 16 4 182.1 15 3 83.1April 21 7 149.4 20 6 89.2May 24 13 121.9 25 12 61.7June 33 21 25.7 36 19 22.9Total 830.8 492.6
1990-1991September 32 17 97.3 31 14 58.7October 23 9 31.5 23 6 25.7November 21 6 44.5 18 4 51.6December 9 -4 25.1 7 -6 7.9January 6 -6 24.6 6 -7 2.8February 17 -1 1.5 17 0 0March 19 4 24.9 18 3 45.2April 23 9 79.5 23 8 41.5May 28 16 178.8 28 14 404.6June 31 20 101.6 33 19 110.0Total 609.3 748.0___________________________________________________________________________________________
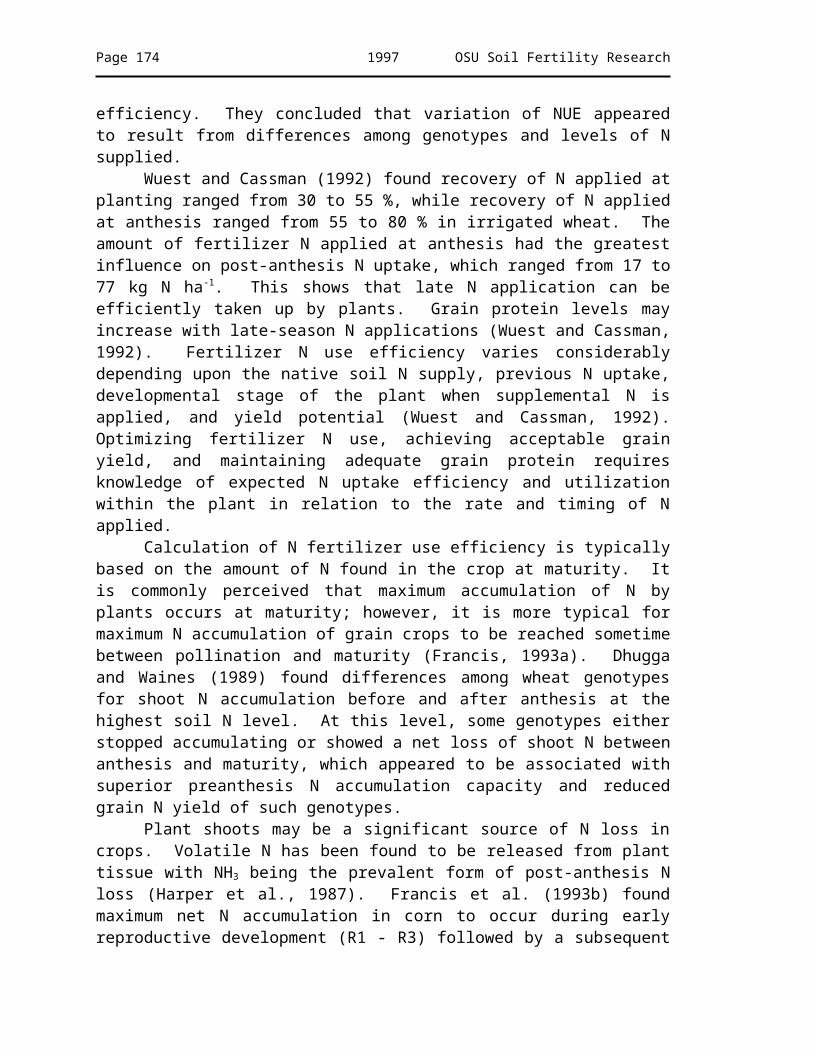
Page 174 1997 OSU Soil Fertility Research
Table 4. Fertilizer N recovery in the grain, straw and soil for experiments 222 and 502, 1989-1991.____________________________________________________________________________________________________Experiment Fertilizer Applied Fertilizer N Recovery _____
N P K Grain Straw Grain Straw Grain Straw Total Soil ╪ Total1989 1990 1991 Grain+Straw
____________________________________________________________________________________________________--------- kg ha-1 ------- ------------------------------------------------- % ---------------------------------------------------------
222 0 29 38 - - - - - - - -45 29 38 10.76 5.85 1.44 1.50 0.78 1.14 21.47 47.46 68.9390 29 38 10.97 4.87 1.84 2.17 0.69 0.89 21.43 37.85 59.28134 29 38 14.02 4.37 1.27 1.485 0.42 0.58 22.13 24.57 46.70
SED 3.05 0.94 0.32 0.35 0.16 0.20 10.42
N rate linear ns ns ns ns @ * @N rate quadratic ns ns ns @ ns ns ns
502 0 20 56 - - -45 20 56 18.05 8.38 1.95 1.78 0.87 0.95 31.98 58.52 90.5067 20 56 15.22 7.22 2.15 2.23 0.77 0.80 28.39 54.30 82.6990 20 56 16.45 8.22 2.29 2.49 0.59 0.59 30.63 45.83 76.46112 20 56 12.57 6.66 2.75 3.12 0.51 0.47 26.08 47.17 73.25
SED 1.87 1.04 0.30 0.46 0.14 0.13 9.24N rate linear ns ns ** * * * **N rate quadratic * ns ns ns ns ns @____________________________________________________________________________________________________pH, 1:1 soil:water; K and P, Mehlich III; Organic C (carbon) and Total N, dry combustion, ╪ 15N recovery determined at the end of the experiment, 0-120 cm, 1991, SED - standard error of the difference between two equally replicated means.
Table 5. Grain and straw yields, experiments 222 and 502, 1989-1991._________________________________________________________________________________________________________Experiment N rate Grain Fertilizer* Grain Fertilizer Grain Fertilizer Total Fertilizer
yield response yield response yield response responsekg ha-1 kg ha-1 kg ha-1 kg ha-1
1989 1990 1991_______________________________________________________________________________________________222 0 1275 - 1290 - 1453 - -
45 1653 8.4 2487 26.6 1453 0.0 11.790 1653 4.2 2702 15.7 1710 2.9 7.6134 2590 9.8 2516 9.1 1251 -1.5 5.8
SED 486 331 317
502 0 875 - 1948 - 1651 - -45 2427 34.5 2636 15.3 1475 -4.0 6.667 2089 18.1 3233 19.2 1204 -6.7 -0.190 2985 23.4 3296 15.0 1219 -4.8 3.6112 2487 14.4 3658 15.3 1290 -3.2 -0.2
SED 259 346 299________________________________________________________________________________________________SED - standard error of the difference between two equally replicated means, * kg grain produced per kg N applied
Wheat Production in the Great Plains of North America
William R. Raun, Gordon V. Johnson, Robert L. Westerman and Jeffory A. Hattey
ABSTRACTWheat (Triticum aestivum L.) production occupies the greatest land area of any commercial crop in the world. In the USA, wheat is second only to

OSU Soil Fertility Research 1997 Page 175
maize for area planted. The most important dryland cropping system in the Great Plains has been wheat-fallow (WF) rotation (one crop in 2 years). However, continuous wheat with no rotation remains as an important production system in this region. The use of grain sorghum (Sorghum bicolor L.) in the wheat-sorghum-fallow (WSF) system (two crops in 3 years) has become increasingly popular in the Great Plains region. Additional cropping systems in this area include sorghum-fallow (SF) and continuous sorghum (SS). Winter wheat grown solely for grazing cattle has increased in the last two decades. Considering the wide range of wheat production systems, many authors have indicated that more intensive cropping systems than the traditional crop-fallow system are needed to make more efficient use of water supplies under dryland conditions in the Great Plains. Current environmental and economic concerns dictate that emphasis needs to be directed to combining high yields with increased input use efficiency, especially for nitrogen which represents, in many cases, the most expensive input used by farmers for their wheat production. In this regard, research and development of varieties with improved water use efficiency will be needed to feed a global population of 10 billion people by the year 2050.
INTRODUCTION
he Great Plains encompass portions of 13 states (Iowa, Kansas, Missouri, Nebraska, Oklahoma, Texas, New Mexico, Colorado, Wyoming, North Dakota, South Dakota, Montana and Minnesota), and three Canadian Provinces
(Manitoba, Saskatchewan and Alberta) (http://www.epa.gov/ecoplaces/part1/site9.html). This area is bound by the Rocky Mountains to the west and the Mississippi River valley on the east. The Great Plains area was once the largest grassland in the world and covered over 2.6 million square kilometers.
TDescription of Wheat Production Systems
More land is devoted worldwide to the production of wheat than to any other commercial crop (Briggle and Curtis, 1987). It is also the number one food grain consumed by humans and its production is greater than rice, maize and potatoes. Dhuyvetter et al. (1996) reported that the most important dryland cropping system in the Great Plains has been wheat-fallow (WF) rotation (one crop in 2 years). They also found that between 1991 and 1993, the harvested area of dryland winter wheat in western Kansas, western Nebraska and eastern Colorado ranged from 2.5 to 2.9 million hectares annually. Most of the 2.8 million hectares of wheat grown in Oklahoma is continuous winter wheat without fallow or rotation. Norwood, (1994) noted that the use of grain sorghum in the wheat-sorghum-fallow (WSF) system (two crops in 3 years) has become increasingly popular in the Great Plains region. Additional cropping systems in this area include sorghum-fallow (SF) and continuous sorghum (SS).
Winter wheat grown solely for grazing cattle has increased in the last two decades. Krenzer et al. (1992) reported that 35 to 55% of the winter wheat is used as a dual-purpose crop in the southern Great Plains, whereby the winter wheat is grazed in the fall and winter followed by grain harvest in late spring. In these winter wheat forage/grain production systems, cattle are generally removed between February and late

Page 176 1997 OSU Soil Fertility Research
March, from the southern to northern regions, respectively. Christiansen et al. (1989) reported that straw yields were lowered by grazing, therefore, the harvest index (grain weight/grain + straw weight) was higher for grazed versus non-grazed wheat.
Halvorson (1988) concluded that more intensive cropping systems than the traditional crop-fallow system are needed to make more efficient use of water supplies under dryland conditions in the Great Plains. Later work by Halvorson and Reule (1994) indicated that more intensive dryland cropping systems needed to be adopted in the Central Great Plains to increase water use efficiency and better maintain soil quality.
Planting datesWinter wheat in the Great Plains is generally planted from early September to late
November. Earlier planting dates have been encouraged when wheat is grown primarily for forage, however, early planting dates significantly increase the risk of frost damage in the spring and increased severity of some soil borne diseases. Work conducted in Kansas indicated that the optimum planting date for winter wheat produced for grain ranged from September to early October in the Central Great Plains (Witt, 1996). This work also reported that March 1 was the last planting date for winter wheat where heads and grain could be produced, although grain yield levels were significantly reduced when compared to fall planting dates. Winter and Musick (1993) indicated that planting date of winter wheat grown in the southern High Plains of Texas varied from August to November. They further reported that planting in August as compared to October did not increase soil water extraction at anthesis and grain yield was reduced. Dahlke et al. (1993) suggested that for the northern region of the Great Plains, maximum grain yield occurred when planting winter wheat on September 3 using 301 seeds per m2. Planting delayed until late September required a seeding rate of 449-599 seeds per m2 to maximize yield. Grain yield decreased with a planting date in October, and kernel weight and heads per unit area decreased as well.
Main characteristics of wheat planted in the Great PlainsFive main classes of wheat are grown: hard red winter, hard red spring, soft red
winter, white and durum (Briggle and Curtis, 1987). Most of the hard red winter wheat is grown in the central and southern Great Plains states while hard red spring is grown in the northern Great Plains. Most of the durum wheat grown in the USA is in North Dakota. In recent years, an increase in soft red winter wheat production has been observed in Illinois and Missouri (Briggle and Curtis, 1987).
Fertilizer Management: Immobile and Mobile NutrientsFor immobile nutrients like phosphorus, plants can only extract the nutrient from
soil close to the root surface. Very little of the nutrient is moved to the root by capillary water movement because soil solution concentrations are small (< 0.05 ug g-1 for phosphate compared to as much as 100 ug g-1 for nitrate-N). As a plant grows and roots extend out into the soil, roots come in contact with “new” soil from which they can

OSU Soil Fertility Research 1997 Page 177
extract phosphate. The amount extracted is limited by the concentration at (or very near) the root-soil interface. If the concentration of phosphate available to the plant at the root-soil interface is inadequate to meet the needs of the plant, then the plant will be deficient in P throughout its development. The deficiency will always be present, and plant growth and crop yield will be limited by the degree to which the immobile nutrient is deficient. Another, perhaps more common way of expressing this nutrient limitation is to state that yield will be obtained according to the sufficiency of the nutrient supply. When this is expressed as a percentage of the yield possibility then the term percent sufficiency may be applied. Whenever the percent sufficiency is less than 100, plant performance is less than the yield possibility provided by the growing environment. Consequently, it does not matter whether the yield possibility is 2 or 3 Mg ha -1, if the percent sufficiency is 80, then the actual yield obtained (theoretically) will only be 80% of the yield possibility.
The soil test for mobile nutrients is an indicator of the total amount available. If this amount is enough to produce 2 Mg ha-1, more N would have to be added to the total pool to produce 3 Mg ha-1. With immobile nutrients such as P and K, an index is developed that is independent of the environment. If the crop year was good, roots would expand into more volume of soil that had the same level of nutrient supplying capacity. Sufficiency is independent of the environment since increased root growth will expand into areas where diffusion transport and contact exchange uptake is the same (total amount present in the soil is not greatly lessened by more growth).
Yield Goals and Soil TestingYield goals apply to all mobile nutrients, while the sufficiency approach is used
for immobile nutrients. Yield response to immobile nutrients is not related to the total amount of the “available form” present in the soil, but instead is a function of the concentration of available form at, or very near, the root surface.
For wheat production in the Great Plains, nitrogen is often the most limiting nutrient. Westerman, (1987) indicated that 33 kg N Mg-1 (2 lb N/bu) is required for grain yield goals up to 3360 kg ha-1 (50 bu/Ac) and an additional 30 kg N Mg-1 (60 lb N/ton) of dry matter forage removed by pasturing. The 33 kg is calculated from the protein or N content (on average) of a megagram of wheat, with the added assumption that measured soil nitrate-N and added fertilizer N will be only 70% utilized.
Halvorson et al. (1987) reported that in most states, residual NO3-N in the surface 60-120 cm of soil is considered to be 100% available and if soil testing is available, this amount is subtracted from the N fertilizer recommended for a particular yield goal. Westfall et al. (1996) reported that the quantification of residual soil NO3-N is the main component of soil testing for determining N needs. Some states have recently considered the addition of NH4-N to the soil test. As a result the sum of NH4-N and NO3-N is subtracted from the N fertilizer requirement determined for a given yield goal. Soil organic matter is also considered in some laboratories whereby the recommendation is altered based and predicted N mineralization and N availability over the growing season (Follett et al., 1991).
Soil test potassium levels in the Great Plains are generally sufficient. Alternatively, phosphorus deficiencies can be commonly found where wheat is grown in this region. Response to applied sulfur has been observed on soils with low soil organic

Page 178 1997 OSU Soil Fertility Research
matter and coarse texture, however, this nutrient is not considered to be deficient to a large extent. Other work has documented increased wheat grain yields as a result of chloride applications, however, much of the response has been associated with reduced incidence of take-all, (Gaeumannomyces graminis)(Christensen and Brett, 1985), powdery mildew (Erysiphe graminis), and leaf rust (Puccinia recondita)(Engel et al., 1994). Alternatively, Brennan (1993) indicated that wheat grain yield losses from take-all were most severe where plants were N deficient. He further noted that chloride containing fertilizers are unlikely to control take-all disease.
Halvorson et al. (1987) reported that water is the factor most often limiting dryland wheat yields in the semiarid regions, therefore, estimating potential grain yield requires consideration of both the amount of soil water at planting and the expected growing season precipitation. They further noted that a number of factors can affect the yield goal, including availability of capital to spend on fertilizer, however, the yield goal should probably be close to the maximum yield obtained in the area. The main reason for fertilizing for maximum yields is that unused nutrients can be available for subsequent crops if not used (Dahnke et al., 1983). Maximum yields may require slightly more N to produce a unit of grain and maintain quality due to decreased N-use efficiency with increasing yield level (Halvorson et al., 1987).
How the wheat is used will also affect N requirements, and an example of this change is in the central Great Plains where grazing wheat is a common practice. Removal of forage can increase N needs and should be considered when formulating N recommendations (Halvorson et al., 1987). Oklahoma recommends 30 kg of N for every 1000 kg of forage produced. In the past, 7 kg N/animal/month has been used as a rough estimate for N requirements in a wheat forage production system (Billy Tucker, personal communication, 1997). Halvorson et al. (1987) indicated that on an animal gain basis, about 1 kg of N will be required to replace that removed in 3 kg of animal gain.
Nitrogen Source and TimingThe common N source for winter wheat production in the Great Plains is
anhydrous ammonia. Anhydrous ammonia (AA) is generally injected prior to planting at a depth of 15 cm with a shank spacing of 75 cm. The majority of farmers who inject AA preplant, apply all of the seasonal N requirement at this time. However, occasionally weather conditions restrict N applications at planting (extremely wet or dry conditions in the fall that prevent good soil closure behind knife applicators). Because of this, alternative mid-season topdress N applications have become popular. Topdress N has generally been applied as urea ammonium nitrate (UAN) in winter months. Recently, Boman et al., (1995a) injected AA into established wheat stands and found no significant grain yield reduction when compared to UAN topdress. Because the cost of AA is half that of UAN, this method/source of mid-season N application may become increasingly popular. Other work by Boman et al. (1995b), evaluating time of application, found that N topdressed from December to January resulted in equivalent forage yields when compared to N broadcast and incorporated before planting. Their work further noted that the optimum time of N application for maximum spring forage and wheat grain yields was mid-November and early January, respectively. It should be noted that delayed N applications generally have a greater effect on grain protein than on yield.

OSU Soil Fertility Research 1997 Page 179
Halvorson et al. (1987) noted that N fertilizers placed with the seed at planting should not exceed 20 kg N ha-1. They further reported that rates of N applied with the seed should be lower on sandy soils when soil moisture conditions at seeding are poor or when soil pH is greater than 7.3. Westfall et al. (1996) indicated that while producers appear to have greater flexibility in choosing fertilizer N placements, N rate is the more critical management decision.
Urea fertilizers should not be applied on the surface of soils without incorporation, especially when soil pH is > 7.0 and/or when surface residues are present, due to increased potential for ammonia volatilization. Ammonia volatilization losses from surface applied urea without incorporation will also occur when soil surfaces are wet, temperatures are high and there is little chance for rain soon after application
Environmental Impact of Nitrogen Fertilizers in Winter WheatWork by Johnson and Raun (1995) and Raun and Johnson (1995) reported that
applying more fertilizer N than that required for maximum wheat grain yield did not immediately pose a risk to groundwater quality. This conclusion was the product of four long-term winter wheat experiments grown under dryland conditions and where average annual rainfall ranged from 765 to 1057 mm. Their data suggested that the soil-plant system was able to buffer (prevent) against soil accumulation of inorganic N. The major buffering mechanisms included documented research where reports of increased plant protein, plant N volatilization, denitrification and immobilization were found when N rates exceeded that required for maximum yield. Much of the central Great Plains region where wheat is grown is nonirrigated and precipitation generally controls yield level. Because of this, NO3-N leaching from non-point source fertilizer applications in these rain-fed production areas has had little impact on groundwater quality. However, it should be noted that soil testing, especially subsoil analysis for NO3-N should be an important input for managing fertilizer N since high subsoil NO3-N may be an indication of past excess N input and a signal that future inputs of N be decreased (Johnson and Raun, 1995).
Straw ResidueWesterman (1987) discussed the effect of straw removal of bases on soil pH.
Wheat straw contains significant quantities of bases, therefore, when it is removed, the potential exists for increasing soil acidity. This is also true when grazing is employed considering the cation content in the forage. For a grain only production system, compared to grain + straw or forage + grain, it is apparent why the potential for increased acidity is much lower.
Decomposition of wheat residue results in soil acidification. Carbon dioxide is released from organic residues during decomposition and combines with water to form carbonic acid (H2CO3). Carbonic acid dissociates into H+ and HCO3
-, resulting in another source of H+ for increasing soil acidity. Root activity and metabolism may also serve as a source of CO2 (Westerman, 1987).
Crop Protection Strategies Against WeedsLyon et al. (1996) reported that herbicides have played an important role in
dryland agriculture since their introduction in the late 1940's. Since their introduction

Page 180 1997 OSU Soil Fertility Research
they have significantly reduced the amount of tillage required for crop production. As a result, reduced-tillage systems have been possible (largely because of the availability of herbicides). Recent trends, however, include declining introduction of new herbicides, potential loss of older herbicides, increased herbicide resistance in weeds, and rising public concern about the effects of pesticides in the environment. All of these may lead to a reduction in herbicide use in the future (Lyon et al., 1996). Although the use of atrazine has proven to be successful for preemergence control of some annual grasses and broadleaf weed species in maize and sorghum production systems, its persistence has been a problem in winter wheat-fallow rotations.
In recent years, cheat (Bromus secalinus L.) has become a significant problem in continuous winter wheat production systems. Wheat grain yield losses can exceed 40% in fields heavily infested with cheat. A consistent suppression of cheat in wheat has not been found using narrow row spacing (7-14 cm), however, in some years this practice can result in a significant reduction in cheat yield (John B. Solie, 1997, personal communication). The decreased use of rotations has created problems with winter annuals like cheat in continuous winter wheat production systems. This weed problem signals the need for alternative fallow and/or rotation production practices. Lyon et al. (1996) noted that the more dissimilar the crops and their management practices are in a rotation, the less opportunity an individual weed species has to become dominant.
Holt and LeBaron, (1990) reported that many herbicide resistant biotypes are resistant to the triazine herbicides (atrazine and simazine). Because of this, some of the newer, environmentally safe herbicides may become ineffective due to weed resistance to herbicides (Lyon et al., 1996). This work further noted that in order to retain herbicides as effective tools in sustainable crop production, strategies need to be developed that include the use of crop rotation, fertilizer placement, tillage, biological control and precision application technology. Precision application technologies (e.g., spraying only those weeds present using sensor based systems) have the potential of reducing from 1/10 to 1/1000 the total amount applied when using fixed rates.
Importance of Wheat Production, Climate and SoilsAs reported by Peterson (1996), the Great Plains of North America are
recognized around the world for their wheat production and fertile Mollisol soils which dominate landscapes from Canada to Texas. Average annual rainfall in the Great Plains region varies considerably, ranging from 25 cm in the western Great Plains states (Montana, Wyoming, Colorado and New Mexico) to as much as 120 cm in the eastern Great Plains states (Minnesota, Iowa, and Missouri). In general, average annual rainfall is lowest in the western Great Plains states, increases in the central region (North Dakota, South Dakota, Nebraska, Kansas, Oklahoma and Texas) and is greatest in the eastern Great Plains states.
Peterson et al. (1996) reported that modern no-till wheat-fallow (WF) systems, even with maximum fallow efficiencies (stored moisture), had average grain water use efficiency (46 kg ha-1 cm-1 of rainfall for spring wheat and 62 kg ha-1 cm-1 of rainfall for winter wheat). This was important considering they reported much higher water use efficiencies of 108 and 99 kg ha-1 cm-1 of rainfall for individual crops within systems for corn and grain sorghum, respectively.

OSU Soil Fertility Research 1997 Page 181
Krall and Schuman, (1996) reported that soil organic carbon levels have declined on many Great Plains soils since the start of cultivation. This decline in soil organic carbon in cultivated soils has been documented by many soil scientists. Work by Raun et al. (1997) found that when N was applied at rates > 90 kg ha-1, surface soil (0-30 cm) organic C was either equal to that of the check (no N applied) or slightly greater following more than 20 years of continuous winter wheat production under conventional tillage. Their work also demonstrated that high rates of applied N had the beneficial effect of increasing soil organic C over the 20 + year time period evaluated.
Tillage and RotationIn order to increase water storage capacity in areas where precipitation was
limiting, substantial research has been aimed at evaluating improved management practices. Because of the wind and water erosion associated with soil tillage, alternative sweeps that would leave the land with more cover (versus a plow or disk) even after tillage were developed, thus leading to what is now referred to as stubble mulching (Peterson, 1996). Early work by Staple et al. (1960) reported that 37% of winter precipitation was conserved as stored soil water in untilled wheat stubble, compared with only 9% when the soil surface did not have stubble.
Dhuyvetter et al. (1996) noted that the fallow period increases stored moisture and weed control in the central Great Plains. In seven of eight studies, net returns were greater from a more intensive crop rotation than from WF when reduced-tillage (RT) or no-till (NT) were used after wheat harvest but prior to planting in the summer (Dhuyvetter et al., 1996). Cropping systems using more intensive rotations with less tillage had higher production costs than WF, but also had increased net returns and reduced financial risk (Dhuyvetter et al., 1996). Halvorson et al. (1994) reported that if costs or application rates of herbicides could be reduced, NT would be more economically competitive with other tillage systems. Because cost variations between tillage systems are minimal, the added benefits of increased moisture storage and decreased erosion with RT and NT must be considered (Halvorson et al., 1994). Norwood (1994) reported twice as much available water was stored prior to sorghum planting in a wheat-sorghum-fallow production system using no-tillage compared to conventional tillage.
LeMahieu, and Brinkman (1990) reported that double-cropping soybean (Glycine max L.) after harvesting winter wheat, winter rye (Secale cereale L.) or spring barley (Hordeum vulgare L.) as forage is feasible in the north central USA. Double cropping soybeans and/or sorghum following wheat has become increasingly popular in the eastern portions of the Great Plains where precipitation is sufficient for an added summer crop. Black and Unger (1987) reported sustained success of dryland agriculture depends upon a unique blend of agricultural sciences, all based on the underlying principle of conserving the soil while using available water efficiently. In this regard, successful implementation of soil conservation practices (fallow, reduced tillage and rotation) in the Great Plains has had a significant impact on present and long-term productivity in the region.
Technological Factors Increasing Grain Yields in this Century

Page 182 1997 OSU Soil Fertility Research
Briggle and Curtis (1987) noted greater use of fertilizer (25% increase in global fertilizer N use from 1974 to 1981) coupled with a significant increase in irrigation in some areas has contributed significantly to yield increases in this century. Their work also highlights the widespread adoption of improved high-yielding, semidwarf wheat cultivars which have greatly increased global genetic potential for higher wheat yields. Breeding efforts for tolerance to acid soils, heat, drought and certain insects have played an important role in increasing wheat grain yields. However, efforts in these areas cannot replace the need for a sound fertility program, regardless of the wheat production system.The development of dwarf spring wheat via an intensive shuttle breeding program by Dr. Norman Borlaug stands as one of the most important agricultural achievements of the century. Easterbrook, (1997) stated 'Norman Borlaug is responsible for the fact that except in sub-Saharan Africa, food production has expanded faster than the human population, averting the mass starvations that were widely predicted.' Pandey et al. (1996) reported that one-fifth of the total U.S. wheat acreage was sown to varieties with CIMMYT (International Maize and Wheat Improvement Center in Mexico founded by Norman Borlaug and others in cooperation with the Rockefeller Foundation) ancestry by the early 1990's. Dwarf-lines from the spring wheat breeding efforts in Mexico were ultimately incorporated into the hard red winter wheat lines in the USA. In the late 1970's, the variety 'Vona' was released by Colorado State University. This was the first hard red winter wheat released in the USA that included the semi-dwarf gene (from CIMMYT germplasm) and high yield potential (Art Klatt, 1997, personal communication)
Transformation of Wheat Production Systems In The FutureWheat production in the last century has seen dramatic changes in variety, tillage,
rotation, fertilization, and weed-disease-insect management. Because of this, we expect to see more and more specialized diversity for wheat production systems in the future, however, adoption of improved practices will continue to be a problem. Dhuyvetter et al. (1996) inferred that even though production benefits of alternative dryland cropping systems have been documented, producers have been slow to adopt these technologies. Because of the relatively low labor and management requirements of a wheat-fallow rotation, producers may be hesitant to change to a more intensive cropping system. Consistent with other authors, they further noted that government program rigidity and producers' attitudes have most likely been major reasons for the slow adoption of alternative crop rotations.
Nitrogen use efficiencies (NUE) in virtually all grain crops seldom exceed 50% (Olson and Swallow, 1984, and Wuest and Cassman, 1992). This means that 50% of the fertilizer nitrogen that is applied is not removed in the grain or straw. The unaccounted N is often assumed to be lost to leaching (Jokela and Randall, 1989), denitrification (Olson et al., 1979) and as NH3 volatilized from the leaves of senescing plants (Sharpe et al., 1988). Nitrogen that is applied but not used by the crop represents a sizeable economic loss to the farmer as well as a possible source of contamination to the environment. Current environmental and economic concerns identify the need to combine high yields with increased input use efficiency, especially for nitrogen which represents, in many cases, the most expensive input used by farmers for their wheat

OSU Soil Fertility Research 1997 Page 183
production. In this regard, we feel that production systems and wheat varieties with improved water and nitrogen use efficiency will be developed to assist us in feeding a global population of 10 billion people expected by the year 2050.
REFERENCESBlack, A.L., and Paul W. Unger. 1987. Management of the wheat crop. p. 330-339. In . E.G. Heyne (ed.)
Wheat and wheat improvement. 2nd ed. Agron. Monogr. 13. ASA, CSSA and SSSA, Madison, WI.
Boman, R.K., R.L. Westerman, W.R. Raun, and M.E. Jojola. 1995a. Spring-applied nitrogen fertilizer influence on winter wheat and residual soil nitrate. J. Prod. Agric. 8:584-589.
Boman, R.K., R.L. Westerman, W.R. Raun and M.E. Jojola. 1995b. Time of nitrogen application: effects on winter wheat and residual soil nitrate. Soil Sci. Soc. Am. J. 59:1364-1369.
Brennan, R.F. 1993. Effect of ammonium chloride, ammonium sulphate and sodium nitrate on take-all and grain yield of wheat grown on soils in south-western Australia. J. Plant Nutr. 16:349-358.
Briggle, L.W., and B.C. Curtis. 1987. Wheat worldwide. p. 1-32. In . E.G. Heyne (ed.) Wheat and wheat improvement. 2nd ed. Agron. Monogr. 13. ASA, CSSA and SSSA, Madison, WI.
Christensen, N.W., and Marcia Brett. 1985. Chloride and liming effects on soil nitrogen form and take-all of wheat. Agron. J. 77:157-163.
Christiansen, S., T. Svejcar, and W.A. Phillips. 1989. Spring and fall cattle grazing effects on components and total grain yield of winter wheat. Agron. J. 81:145-150.
Dahlke, B.J., E.S. Oplinger, J.M. Gaska and M.J. Martinka. 1993. Influence of planting date and seeding rate on winter wheat grain yield and yield components. J. Prod. Agric. 6:408-414.
Dahnke, W.C., L.J. Swenson and R.J. Goos. 1983. Choosing a crop yield goal. P. 69-70. In 1984 Crop production guide. North Dakota State Univ., Fargo ND.
Dhuyvetter, K.C., C.R. Thompson, C.A. Norwood and A.D. Halvorson. 1996. Economics of dryland cropping systems in the great plains: A review. J. Prod. Agric. 9:216-222.
Easterbrook, Gregg. 1997. Forgotten benefactor of humanity. Atlantic Monthly. Jan. 75-82.
Engel, R.E., J. Eckhoff and R.K. Berg. 1994. Grain yield, kernel weight, and disease responses of winter wheat cultivars to chloride fertilization. Agron. J. 86:891-896.
Follett, R.H., P.N. Soltanpour, D.G. Westfall and J.R. Self. 1991. Soil test recommendations in Colorado. Colorado Agric. Ext. Serv. XCM-37.
Halvorson, A.D., M.M. Alley and L.S. Murphy. 1987. Nutrient requirements and fertilizer use. p. 345-383. In . E.G. Heyne (ed.) Wheat and wheat improvement. 2nd ed. Agron. Monogr. 13. ASA, CSSA and SSSA, Madison, WI.
Halvorson, A.D. 1988. Role of cropping systems in environmental quality: Saline seep control. P. 179-191. In W.L. Hargrove (ed.) Cropping strategies for efficient use of water and nitrogen. ASA Spec. Publ. 51. ASA, CSSA, and SSSA, Madison, WI.
Halvorson, A.D., R.L. Anderson, N.E. Toman and J.R. Welsh. 1994. Economic comparison of three winter wheat-fallow tillage systems. J. Prod. Agric. 7:381-385.
Halvorson, Ardell.D., and Curtis A. Reule. 1994. Nitrogen fertilizer requirements in an annual dryland cropping system. Agron. J. 86:315-318.
Holt, J.S., and H.M. LeBaron. 1990. Significance and distribution of herbicide resistance. Weed Technol. 4:141-149.

Page 184 1997 OSU Soil Fertility Research
Johnson, G.V., and W.R. Raun. 1995. Nitrate leaching in continuous winter wheat: use of a soil-plant buffering concept to account for fertilizer nitrogen. J. Prod. Agric. 8:486-491.
Jokela, W.E., and G.W. Randall. 1989. Corn yield and residual soil nitrate as affected by time and rate of nitrogen application. Agron. J. 81:720-726.
Krall, James M. and Gerald E. Schuman. 1996. Integrated dryland crop and livestock production systems on the Great Plains: extent and outlook. J. Prod. Agric. 9:187-191.
Krenzer, E.G. Jr., J.D. Thompson and B.F. Carver. 1992. Partitioning of genotype x environment interactions of winter wheat forage yield. Crop Sci. 32:1143-1147.
LeMahieu, P.J., and M.A. Brinkman. 1990. Double-cropping soybean after harvesting small grains as forage in the north central USA. J. Prod. Agric. 3:385-389.
Lyon, D.J., S.D. Miller and G.A. Wicks. 1996. The future of herbicides in weed control systems of the Great Plains. J. Prod. Agric. 9:209-215.
Norwood, Charles. 1994. Profile water distribution and grain yield as affected by cropping system and tillage. Agron. J. 86:558-563.
Olson, R.V., L.S. Murphy, H.C. Moser and C.W. Swallow. 1979. Fate of tagged fertilizer nitrogen applied to winter wheat. Soil Sci. Soc. Am. J. 43:973-975.
Olson, R.V., and C.W. Swallow. 1984. Fate of labeled nitrogen fertilizer applied to winter wheat for five years. Soil Sci. Soc. Am. J. 48:583-586.
Pandey, Philip G., Julian M. Alston, Jason E. Christian and Shenggen Fan. 1996. Hidden harvest: U.S. benefits from international research aid. International Food Policy Research Institute, Washington DC.
Peterson, G.A. 1996. Cropping systems in the Great Plains. J. Prod. Agric. 9:179.
Peterson, G.A., A.J. Schlegel, D.L. Tanaka and O.R. Jones. 1996. Precipitation use efficiency as affected by cropping and tillage systems. J. Prod. Agric. 9:180-186.
Raun, W.R., and G.V. Johnson. 1995. Soil-plant buffering of inorganic nitrogen in continuous winter wheat. Agron. J. 87:827-834.
Raun, W.R., G.V. Johnson, S.B. Phillips and R.L. Westerman. 1997. Effect of long-term nitrogen fertilization on soil organic carbon and total nitrogen in continuous wheat. (in press, Soil and Tillage Res.)
Sharpe, R.R., L.A. Harper, J.E. Giddens and G.W. Langdale. 1988. Nitrogen use efficiency and nitrogen budget for conservation tilled wheat. Soil Sci. Soc. Am. J. 52:1394-1398.
Staple, W.J., J.J. Lehane and A. Wenhardt. 1960. Conservation of soil moisture from fall and winter precipitation. Can. J. Soil Sci. 40:80-88.
Westerman, R.L. 1987. Soil reaction-acidity, alkalinity, and salinity. p. 340-344. In . E.G. Heyne (ed.) Wheat and wheat improvement. 2nd ed. Agron. Monogr. 13. ASA, CSSA and SSSA, Madison, WI.
Westfall, D.G., J.L. Havlin, G.W. Hergert and W.R. Raun. 1996. Nitrogen management in dryland cropping systems. J. Prod. Agric. 9:192-199.
Winter, S.R., and J.T. Musick. 1993. Wheat planting date effects on soil water extraction and grain yield. Agron. J. 85:912-916.
Witt, Merle D. 1996. Delayed planting opportunities with winter wheat in the central great plains. 9:74-78.

OSU Soil Fertility Research 1997 Page 185
Wuest, S.B. and K.G. Cassman. 1992. Fertilizer-nitrogen use efficiency of irrigated wheat: I. uptake efficiency of preplant versus late-season application. Agron. J. 84:682-688.

Page 186 1997 OSU Soil Fertility Research
Winter Wheat and Cheat Response to Foliar Nitrogen Applications
Jing Chen, William R. Raun, Gordon V. Johnson, Doug A. Cossey, Don S. Murray and R. Brent Westerman
ABSTRACTGrowing winter wheat (Triticum aestivum L.) cultivars in a weed-free environment is necessary for optimum grain yield. Cheat (Bromus secalinus L.) is an important grass weed in winter wheat in Oklahoma. Wheat grain yield losses can exceed 40% in fields heavily infested with cheat. A 2-year field experiment was initiated in the fall of 1995 and 1996 at the Efaw Experiment Station, to evaluate the influence of N rate and source of foliar fertilizer on the growth of winter wheat and cheat. Foliar solution fertilizers evaluated included urea-ammonium nitrate (UAN), ammonium hydroxide, and ammonium sulfate. Three wheat varieties (‘Tonkawa’, ‘Longhorn’ and ‘Jagger’) were also evaluated from 1995 to 1996. A logarithmic sprayer was used to apply solutions, whereby N rates were reduced by half every 10ft. Yield of wheat, grain protein and yield of cheat were determined after harvest. Cheat seeds were also collected for germination tests. Foliar N was applied after winter wheat had completed flowering, but 1 to 2 wks prior to cheat flowering. Both UAN and ammonium hydroxide solutions significantly desiccated immature cheat heads and reduced seed production. Cheat yield was also significantly reduced by UAN and ammonium hydroxide applications. Linear-plateau models indicated that foliar applied UAN and ammonium hydroxide at a rate of 12 lb acre-1 can result in cheat reduction (percent germination * cheat yield versus check) of 55%. Wheat grain yields were not reduced from foliar applied N following wheat flowering, while wheat grain protein increased significantly (1 to 3 % protein).
INTRODUCTION
inter wheat (Triticum aestivum L.) is one of the most important crops in Oklahoma. The traditional wheat market classes in the USA are based primarily on milling and baking quality, and grain protein is the most
important characteristic in determining baking quality. Nitrogen (N) is an essential element for plant growth and plays an important role in wheat production. Increasing the grain protein and yield of winter wheat depends on careful N management.
WGrowing winter wheat cultivars in a weed-free environment is necessary for
optimum grain yield, because weeds are a yield-reducing factor. Cheat (Bromus secalinus L.) is an extremely important grass weed species in winter wheat in Oklahoma. Wheat grain yield losses can exceed 40% in fields heavily infested with cheat (Ratliff and Peeper, 1987).
Methods of application and sources of nitrogen (N) fertilizers are very important for both winter wheat and cheat growth and development. Soil fertility research programs have been successful in developing improved methods of nitrogen (N) fertilizer

OSU Soil Fertility Research 1997 Page 187
application in winter wheat. Bock and Hergert (1991), Johnston and Fowler (1991), Keeney (1982), and Keeney and Follett (1991) found that methods of fertilizer application can effect both crop yield and nitrogen uptake efficiency. The potential of using foliar fertilizer for plants has been recognized for many years. Numerous studies have shown that fertilizer N applications at flowering can increase grain protein. Grain protein increased significantly when the foliar nitrogen (N) was applied at or near wheat flowering (Finney et al. 1957, Pushman and Bingham, 1976, Strong, 1982 and 1986, Morris and Palson, 1985, and Smith et al. 1989 and 1991). Also, Smith et al. (1991) reported that the foliar fertilizer N could be efficiently translocated to the head, subsequently increasing grain N concentration. However, foliar applied N after wheat flowering had no effect on grain yield. Conversely, Mahler et al. (1994) reported that winter wheat grain yield was greatest when N was applied in the fall and spring. In the same experiment, Mahler et al. (1994) also compared 15 different N placement-source-application timing treatments. They found that N source and placement did not significantly effect grain yield. Wuest and Cassman (1992) found that the amount of nitrogen (N) fertilizer applied at anthesis had the greatest influence on postanthesis nitrogen uptake, and also that grain protein level increased with late-season nitrogen (N) application, when applied at rates between 15 and 69 lb N acre-1.
Sexsmith and Russell (1963) reported that preplant N fertilization in wild oats (Avena fatua L.) increased the number of seed-bearing stems, plant height, straw weight, and seed yield. In other wild oat control work, Sexsmith and Pittman (1963) found that early spring N fertilizer application increased the germination of wild oat seed. They stated that in a wild oat control program, the use of nitrate fertilizer to induce germination of dormant seeds in the field should be considered. Nitrogen fertilizer might be used in fallow years to induce more wild oat seed to grow and thereby reduce the supply of available seed. The influence of fertilization on weed seed populations was also studied by Banks et al. (1976) in a 47-year experiment. Results demonstrated that, for most weed species, plots receiving nitrogen (N), phosphorus (P), potassium (K) and lime contained the highest amount of weed seed, whereas plots with no fertilization produced the lowest amount of weed seed. In contrast, evening primrose (Oenothera laciniata Hill) produced fewer seeds with increased fertilizer treatment. Fawcett and Slife (1978) working with lambsquarters (Chenopodium album L.), found that ammonium nitrate had no significant effect on germination or dormancy.
Although the effects of preplant N fertilizer on the growth and composition of winter wheat and several weed species have been studied, foliar fertilizer applications have not been extensively evaluated for their effectiveness to increase winter wheat grain protein and simultaneously control weeds. Unlike some herbicides, foliar applied nitrogen (N) solutions leave no restrictive residues in the soil and can provide sufficient benefit to the crop.
Research by Donnelly et al. (1977) demonstrated that foliar N fertilizer applied before physiological maturity of grain sorghum (Sorghum biocolor L.) accelerated grain drying and reduced grain yield. The same authors found that foliar N fertilizer significantly decreased grain moisture. Our hypothesis was that foliar applied N fertilizer applied 1 or 2 wks before cheat flowering could desiccate immature cheat heads and reduce seed production.

Page 188 1997 OSU Soil Fertility Research
The objectives of this research were to assess the effect of foliar N fertilizer on wheat grain yield and quality, and to determine the effect of N rate and source of foliar applied liquid N fertilizer on the reduction of cheat in winter wheat.
MATERIALS AND METHODS
One field experiment was established in fall of 1994 at the Efaw Experiment Station, Oklahoma State University to determine winter wheat and cheat response to foliar N fertilizer. Initial soil test characteristics and soil classification are reported in Table 1. A randomized complete block experimental design was used with two replications. In the 1994-95 crop season, two winter wheat varieties (Tonkawa and Longhorn), and one foliar application (urea ammonium nitrate (UAN)) were used in a complete factorial arrangement of treatments. In the 1995-96 crop season, winter wheat varieties (Tonkawa and Jagger) and three foliar applications (UAN, ammonium hydroxide (NH4OH), and ammonium sulfate ((NH4)2SO4)) were evaluated in a complete factorial arrangement of treatments. Main plot size was 8.5 ft x 100 ft, and subplots were 8.5 ft x 10 ft in both years.
In the fall of 1994, the entire experimental area was fertilized with 90 lb acre-1 of diammonium phosphate (16.1 lb acre-1 of carrier N), broadcast and incorporated in August. There were no preplant fertilizer treatments applied in the fall of 1995. The seeding date was October 15, 1994, and cheat was dribble applied (fertilizer box) to the entire area. The seeding rate for the cheat was 45 lb acre-1, while the seeding rate for the wheat was 80 lb acre-1. Foliar applications were applied to ‘Tonkawa’ treatments on May 11, and to ‘Longhorn’ treatments on May 16, which was after flowering had taken place in these wheat varieties, but prior to cheat flowering (Table 2). Foliar applications were made using a logarithmic sprayer that was calibrated at 18.93 gal acre-1. By constantly diluting the concentrate liquid fertilizer in a fixed volume canister traveling at a speed of 3.1 mi hr-1, concentrate rates were reduced by half every 10 ft. The sprayer was equipped with 6-11002 degree tip nozzles on 1.7 ft centers. In the 1994-95 crop year, three passes were made thus delivering a total volume of 56.79 gal acre -1. In 1995-96, two passes were used (37.86 gal acre- 1). For all foliar applications, the surfactant ‘X-77’ (ORTHO, St. Paul, MN) was applied at a rate of 0.13 oz gal -1 of solution. Using the sprayer discussed, N rates ranged from 0.2 to 146 lb acre-1 for foliar N fertilizer solutions evaluated from 1994 to 1996. In the 1995-1996 growing season, the seeding rate for winter wheat was 70 lb acre-1, and the seeding rate for cheat remained at 45 lb acre-1. Foliar N fertilizer was applied on May 9, 1996 to both ‘Tonkawa’ and ‘Jagger’ plots. Foliar N application dates always took place once 20 random wheat heads from each variety were selected and examined under a microscope to assess complete wheat flowering, but prior to cheat flowering. Other activities for this experiment are reported in Tables 2.
During the 1994-95 crop year, cheat and wheat were harvested every 10 ft using a self propelled combine, whereby the blower was set to collect the cheat seed and all other fine materials in the bin. In the 1995-96 crop year, cheat and wheat were harvested every 5 ft using a self propelled combine in both replications. Results from regression are reported on the means over replications. The harvested samples were cleaned with a small seed cleaner to separate cheat seed, wheat seed and other material. Yield of wheat and cheat were determined after cleaning. Total N analyses of wheat grain samples were

OSU Soil Fertility Research 1997 Page 189
accomplished using dry combustion (Schepers et al., 1989). Grain protein content was calculated by multiplying the percentage nitrogen by 5.7 (Martin del Molino, 1991). Cheat reduction was calculated as;
Cheat reduction (%) = 1 - CG (%) * CY / B
Where CG is the percentage of cheat germination, CY is the yield of cheat, B is the product of the highest percentage cheat germination and the yield of cheat where no foliar N was applied.
Cheat germination tests were determined as per the work of Copeland, 1978. One hundred seeds from each treatment were placed in wet paper and refrigerated at 4ºC for 5 days, then replaced in the germination chamber (25ºC). A germination count was then completed after 7 days.
Wheat and cheat yield, cheat reduction and wheat grain protein were evaluated using two-segment linear-plateau models (Anderson and Nelson, 1975). Linear-plateau programs were adapted using the NLIN procedure (SAS, 1988). Equations for the linear-plateau models were y = b0 + b1 [min(X,A)] such that b0 is the Y-intercept, b1 is the slope of the line up to where X (N rate) = A (point where the combined residuals were at a minimum) (Mahler and McDole, 1987). Best estimates for b0, b1 and the point of intersection (joint for linear and plateau portions, defined here as the critical N rate) were obtained from the model which minimized combined residuals. Combinations of possible values of b0, b1 and the point of intersection were evaluated (holding the other two constant), that ultimately resulted in the highest coefficient of determination (Mahler and McDole, 1987).
RESULTS AND DISCUSSION
Wheat and cheat response to nitrogen (N) foliar fertilizers, 1994-95Foliar applied UAN had no affect on wheat grain yields (Figure 1). This was
based on statistical analysis where no response could be observed on wheat grain yield by foliar N fertilizer applied post flowering. This finding agrees with results of previous studies, which showed no grain yield response to foliar applied N at or near anthesis (Smith et al., 1991 and Strong, 1982). These results also agree with the work of Mahler et al. (1994) who found that N source and placement did not significantly contribute to grain yield. However, wheat grain protein significantly increased from the foliar N applications (Figure 2). Linear-plateau models for foliar N rate versus wheat grain protein were all highly significant. Significant protein increases were observed at N rates 15 lb N acre-1 as is identified by the joint value from linear-plateau models. Increases in grain protein ranged from 1 to 3% as a result of applying foliar N when compared to plots that did not receive foliar N applications. These results agreed with research by Finney et al. (1957), Pushman and Bingham (1976), Strong (1982 and 1986), Morris and Palson (1985), and Smith et al. (1989 and 1991) who found that grain protein significantly increased when foliar nitrogen (N) applications were made close to wheat flowering.
Linear-plateau models for foliar N rate versus cheat yield and cheat reduction were all highly significant (Figures 3 and 4). Three days after foliar N solutions were

Page 190 1997 OSU Soil Fertility Research
applied, serious damage in cheat flowers was observed. In addition, severe burn on the leaves of wheat and cheat could be observed in the field at the high N rates, when compared to plots that did not receive foliar N. Desiccation caused leaves to drop and hastened cheat physiological maturity. This in turn reduced harvestable cheat seed which confirmed our hypotheses that foliar applied N fertilizer 1 or 2 wks before cheat flowering could desiccate immature cheat heads and reduce seed set. Cheat yields decreased significantly at low N rates but this was variable over variety. Cheat reduction ranged from 47 to 55% when foliar UAN was applied at rates between 8 and 12.6 lb N acre-1 prior to cheat flowering for both varieties (Figure 4).
Wheat and cheat response to nitrogen (N) foliar fertilizers, 1995-96In the 1995-96 crop year, results similar to 1994-95 were found, whereby wheat
yields showed little response to applied foliar N and did not differ over N source (Figure 5). Linear-plateau models for foliar N rates versus wheat grain protein content were all highly significant for sources, excluding the ammonium sulfate application (Figures 6-8). Similar to results in 1994-95, N critical rates ranged between 13 and 23 lb N acre -1. Wheat grain protein increased 4% as a result of applying foliar N.
Linear-plateau models for foliar N rates versus cheat yield were all highly significant excluding the ammonium sulfate foliar treatment (Figures 9 and 10, 11). Cheat yields were decreased from 116 to 357 lb acre-1 with foliar N rates of 4.4 lb acre-1
when compared with plots that did not receive foliar N applications (Figures 9-11). Cheat reduction was variable in 1995-96 depending on N source (Figures 12-14). Foliar applied UAN at a rate of 12 lb N acre-1 achieved a 55% cheat reduction in 1995, while a similar 19 lb N acre-1 rate was required for a 52% reduction in 1996. A 70% cheat reduction was achieved when ammonium hydroxide was applied at 0.7 lb N acre-1
(Figure 13). Critical N rates from linear-plateau models were not entirely consistent for the two varieties (Figure 13). However, excellent cheat reduction was achieved at low N rates in both varieties. Rates of 0.7 lb N acre-1, using ammonium hydroxide, provided 70% to 80% cheat reduction. Cheat reduction ranged from 47% to 67% when foliar ammonium sulfate solution was applied at rates between 0.4 and 5.1 lb N acre-1 (Figure 14). Increased foliar N fertilizer, prior to cheat flowering, generally decreased cheat yield and increased cheat reduction.
CONCLUSIONS
Winter wheat grain protein increased when foliar N fertilizer was applied after wheat flowering. Grain protein was maximized in the 1994-95 crop year at a foliar N rate of 15 lb acre-1. There was also a corresponding increase in grain protein of 1 to 3% when compared to plots not receiving foliar applications. In the 1995-96 growing season, linear-plateau models also indicated that wheat grain protein increased 4% with foliar N rates between 13 and 19 lb acre-1 when compared to plots not receiving foliar N following wheat flowering. Foliar N applied after wheat flowering did not affect wheat yields in either year.
Cheat yield and cheat reduction showed a significant response to foliar N applications. Cheat yield significantly decreased with increased foliar applied N fertilizer prior to cheat flowering. Foliar UAN applied at rates of 12 and 19 lb N acre -1

OSU Soil Fertility Research 1997 Page 191
achieved over a 50% reduction in cheat. Ammonium hydroxide applied at a rate of 0.7 lb N acre-1 resulted in a 70% cheat reduction. Linear-plateau models suggest that 5.1 lb acre-1 was the critical N rate necessary for a 67% cheat reduction using ammonium sulfate foliar solution.
The response of wheat and cheat to foliar N application in this study indicates that foliar application of nitrogen (N) fertilizer can be used to effectively increase winter wheat protein, and to decrease cheat yield.
REFERENCESAnderson, R.L., and L.A. Nelson. 1975. A family of models involving intersecting straight lines and
concomitant experimental designs useful in evaluating response to fertilizer nutrients. Biometrics 31:303-318.
Banks, P.A., P.W. Santelmann, and B.B. Tucker. 1976. Influence of long-term soil fertility treatments on weed species in winter wheat. Agron. J. 68:825-827.
Bock, B.R., and G.W. Hergert. 1991. Fertilizer nitrogen managemant. p. 139-164. In R.F. Follett et al. (ed.) Managing nitrogen for groundwater quality and farm profitability. ASA, Madison, WI.
Copeland, L.O. 1978. Rules for test seeds. J. of Seed Tech. 3: 39.
Donnelly, K. J., R. L. Vanderlip and L. S. Murphy. 1977. Desiccation of grain sorghum by foliar application of nitrogen solutions. Agron. J. 69: 33-36.
Fawcett, R. S. and F. W. Slife. 1978. Effect of field application of nitrate on weed seed germination and dormancy. Weed Sci. 26: 594-596.
Finney, K.F., J.W. Meyer, F.W. Smith, and H.C. Fryer. 1957. Effect of foliar spraying of Pawnee wheat with urea solutions on yield, protein content, and quality. Agron. J. 341-347.
Johnston, A.M., and D.B. Fowler. 1991. No-till winter wheat production: Response to spring applied N fertilizer form and placement. Agron. J. 83:722-728.
Keeney D.R. 1982. Nitrogen management for maximum effiency and minimum pollution. In F.J. Stevenson (ed.) Nitrogen in agricultural soils. Agron. Monogr. 22. ASA, CSSA, and SSSA, Madison, WI. p. 605-649.
Keeney, D.R., and R.F. Follett. 1991. Managing nitrogen for groundwater quality and farm profitability: Overview and introduction. In R.F. Follett et al. (ed.) Managing nitrogen for groundwater quality and farm profitability. ASA, Madison, WI. p. 1- 8.
Mahler, R.L., F.E. Koehler, and L.K. Lutcher. 1994. Nitrogen source, timing of application, and placement: Effects on winter wheat production. Agron. J. 86:637-342.
Mahler, R.L., and R.E. McDole. 1987. Effect of soil pH on crop yield in northern Idaho. Agron. J. 79:751-755.
Morris, C.F. and G.M. Palson. 1985. Development of hard winter wheat after anthesis as affected by nitrogen nutrition. Crop Sci. 25:1007-1010.
Martin del Molino, I.M. 1991. Relationship between wheat grain protein yield and grain yield, plant growth, and nutrition at anthesis. J. Plant Nutrition 14:1297-1306.
Pushman, F.M. and J. Bingham. 1976. The effects of granular nitrogen fertilizer and a foliar spray of urea on the yield and bread-making quality of ten winter wheats. J. Agric. Sci. Cambridge 87:281-292.
Ratliff, L. R. and T. F. Pepper. 1987. Bromus control in winter wheat (Triticum aestivum) with the ethylthio analog of metribuzin. Weed Technology. Vol. 1:235-241.

Page 192 1997 OSU Soil Fertility Research
Schepers, J. S., D.D. Francis, and M.T. Thompson. 1989. Simultaneous determination of total C and total N and 15N on soil and plant material. Commun. In Soil Sci. Plant Anal. 20:949-959.
Sexsmith, J. J. and V. J. Pittman. 1963. Effect of nitrogen fertilizer on germination and stand of wild oats. Weeds 11:99-101.
Sexsmith, J. J., and G. C. Russel. 1963. Effect of nitrogen and phosphorus fertilization on wild oats in spring wheat grown on stubble. Can. J. Plant Sci. 43:64-69.
Smith, C.J., D.M. Whitfield, O.A. Gyles and G.C. Wright. 1989. Nitrogen fertilizer balance of irrigated wheat grown on a red-brown earth in Australia. Field Crop Res. 21:265-275.
Smith, C.J., J.R. Freney, R.R. Sherlock, and I.E. Galbally. 1991. The fate of urea nitrogen applied in a foliar spray to wheat at heading. Fertilizer Research 28:129-138.
Strong, W.M. 1982. Effect of application of nitrogen on the yield and protein content of wheat. Aust. J. Exp. Agric. Anim. Husb. 22:54-61.
Strong W.M. 1986. Effects of nitrogen applications before sowing, compared with effects of split applications before and after sowing, for irrigated wheat on the Darling Downs. Aust. J. Exp. Agric. 26:201-207.
SAS Institute Inc. 1988. SAS/STAT Procedures, Release 6.03 Edition. Cary, NC.
Wuest, S.B., and K.G. Cassman. 1992. Fertilizer-nitrogen use efficiency of irrigated wheat: I. Uptake efficiency of preplant versus late-season application. Agron. J. 84:682-688.
Table 1. Soil chemical characteristics and classification, Efaw experimental Station____________________________________________________________________Depth pH Total N Organic C NH4-N NO3-N P K --ft-- ------- % ------- ------lb acre-1---- --lb acre-1--__________________________________________________________________________0-0.5 5.4 0.094 1.04 16 13 83 342__________________________________________________________________________lb acre-1 values are for 0-6".
Table 2. Treatment and field activities, Efaw experiment station, 1995 and 1996_____________________________________________________________________ N rate range Treatment Winter wheat Foliar N application ---lb acre-1--- variety date___________________________________________________________________________0.3-128.2 UAN Tonkawa 5/11/950.3-128.2 UAN Longhorn 5/16/950.2-97.7 UAN Tonkawa 5/09/960.1-56.8 Ammonium Hydroxide Tonkawa 5/09/960.1-71.7 Ammonium Sulfate Tonkawa 5/09/960.2-97.7 UAN Jagger 5/09/960.1-56.8 Ammonium Hydroxide Jagger 5/09/960.1-71.7 Ammonium Sulfate Jagger 5/09/96___________________________________________________________________________*: Log sprayer used to apply solutions whereby N rates were cut in half every 10ft in 1995. Linear plots harvested every 10 and 5 feet in 1995 and 1996, respectively.

OSU Soil Fertility Research 1997 Page 193
Figure 1. Winter wheat yield response to foliar N application, 1995 (UAN)
Foliar N Fertilizer: UAN(Wheat variety: Tonkawa)
N rate, lb/acre
0 20 40 60 80 100 120 140
Whe
at g
rain
yie
ld, l
b/ac
re
400
800
1200
1600
2000
2400
Foliar N Fertilizer: UAN(Wheat variety: Longhorn)
N rate, lb/acre
0 20 40 60 80 100 120 140
Whe
at g
rain
yie
ld, l
b/ac
re
400
800
1200
1600
2000
2400
Figure 2. Winter wheat grain protein response to foliar N application (UAN, 1995)
Foliar N Fertilizer: UAN(Wheat variety: Tonkawa)
N rate, lb/acre
0 20 40 60 80 100 120 140 160
Whe
at g
rain
pro
tein
, %
14
15
16
17
18
19
20
21
Foliar N Fertilizer: UAN(Wheat variety:Longhorn)
N rate, lb/acre
0 20 40 60 80 100 120 140 160
Whe
at g
rain
pro
tein
, %14
15
16
17
18
19
20
21
Y=15.6+0.24X (X<JOINT)Y=19.2 (X>JOINT)JOINT=15.1R2=0.92 (P<0.01)

Page 194 1997 OSU Soil Fertility Research
Foliar N Fertilizer: UAN(Wheat variety: Tonkawa)
N rate, lb/acre
0 20 40 60 80 100 120 140 160
Che
at y
ield
, lb/
acre
100
150
200
250
300
350
400
Figure 3. Cheat yield response to foliar N application, 1995 (UAN)
Foliar N Fertilizer: UAN(Wheat variety: Longhorn)
N rate, lb/acre
0 20 40 60 80 100 120 140 160
Che
at y
ield
, lb/
acre
100
150
200
250
300
350
400
Y=309.5-11.77X (X<JOINT)Y=183.2 (X>JOINT)JOINT=10.7R2=0.79 (P<0.01)
Y=235.2-9.80X (X<JOINT)Y=131.7 (X>JOINT)JOINT=10.6R2=0.86 (P<0.01)
Foliar N Fertilizer: UAN(Wheat variety: Tonkawa)
N rate, lb/acre
0 20 40 60 80 100 120 140 160
Che
at re
duct
ion,
%
0
20
40
60
80
100
Foliar N Fertilizer: UAN(Wheat variety: Longhorn)
N rate, lb/acre
0 20 40 60 80 100 120 140 160
Che
at re
duct
ion,
%
0
20
40
60
80
100
Figure 4. Cheat reduction response to foliar N application, 1995 (UAN)
Y=8.63+3.80X(X<JOINT)Y=55.23 (X>JOINT)JOINT=12.63 R2=0.83 (P<0.01)
Y=7.00+4.99X (X<JOINT)Y=47.82 (X>JOINT)JOINT=8.19R2=0.76 (P<0.01)

OSU Soil Fertility Research 1997 Page 195

Page 196 1997 OSU Soil Fertility Research
Figure 6. Winter wheat grain protein response to foliar N application, 1996 (UAN)
Foliar N Fertilizer: UAN(Wheat variety: Tonkawa)
N rate, lb/acre
0 20 40 60 80 100 120
Whe
at g
rain
pro
tein
, %
15
16
17
18
19
20
21
22
Foliar N Fertilizer: UAN(Wheat variety: Jagger)
N rate, lb/acre
0 20 40 60 80 100 120
Whe
at g
rain
pro
tein
, %
15
16
17
18
19
20
21
22
Y=17.1+0.12X (X<JOINT)Y=19.0 (X>JOINT)JOINT=16.3R2=0.72 (P<0.01)
Y=17.6+0.11X (X<JOINT)Y=20.2 (X>JOINT)JOINT=22.9R2=0.71 (P<0.01)
Figure 7. Winter wheat grain protein response to foliar N application, 1996 (Ammonium hydroxide)
Foliar N Fertilizer: Ammonium Hydroxide(Wheat variety: Tonkawa)
N rate, lb/acre
0 20 40 60 80 100 120
Whe
at g
rain
pro
tein
, %
15
16
17
18
19
20
21
22
Foliar N Fertilizer: Ammonium Hydroxide(Wheat variety: Jagger)
N rate, lb/acre
0 20 40 60 80 100 120
Whe
at g
rain
pro
tein
, %
15
16
17
18
19
20
21
22
Y=17.4+0.1X (X<JOINT)Y=18.3 (X>JOINT)JOINT=13.7R2=0.56 (P<0.01)
Y=18.3+0.11X (X<JOINT)Y=19.9 (X>JOINT)JOINT=14.8R2=0.73 (P<0.01)
Figure 8. Winter wheat grain protein response to foliar N application, 1996 (Ammonium sulfate)
Foliar N Fertilizer: Ammonium Sulfate(Wheat variety: Tonkawa)
N rate, lb/acre
0 20 40 60 80 100 120
Whe
at g
rain
pro
tein
, %
15
16
17
18
19
20
21
22
Foliar N Fertilizer: Ammonium Sulfate(Wheat variety: Jagger)
N rate, lb/acre
0 20 40 60 80 100 120
Whe
at g
rain
pro
tein
, %
15
16
17
18
19
20
21
22
Y=18.2-0.39X (X<JOINT)Y=17.6 (X>JOINT)JOINT=1.6R2=0.34 (P<0.05)
Wheat variety: Tonkawa
N rate, lb/acre
0 20 40 60 80 100 120
Whe
at g
rain
yie
ld, l
b/ac
re
400
800
1200
1600
2000
2400
2800
UANAmmonium HydroxideAmmonium Sulfate
Wheat variety: Jagger
N rate, lb/acre
0 20 40 60 80 100 120
Whe
at g
rain
yie
ld, l
b/ac
re
400
800
1200
1600
2000
2400
2800UANAmmonium HydroxideAmmonium Sulfate
Figure 5. Winter Wheat grain yield response to foliar N applications, 1996 (UAN, Ammonium hydroxide and Ammonium sulfate)

OSU Soil Fertility Research 1997 Page 197
Foliar N Fertilizer: UAN(Wheat variety: Tonkawa)
N rate, lb/acre
0 20 40 60 80 100 120
Che
at y
ield
, lb/
acre
100
150
200
250
300
350
400
450
Figure 9. Cheat yield response to foliar N application, 1996 (UAN)
Foliar N Fertilizer: UAN(Wheat variety: Jagger)
N rate, lb/acre
0 20 40 60 80 100 120
Che
at y
ield
, lb/
acre
100
150
200
250
300
350
400
450
Figure 10. Cheat yield response to foliar N application, 1996 (Ammonium hydroxide)
Foliar N Fertilizer: Ammonium Hydroxide(Wheat variety: Tonkawa)
N rate, lb/acre
0 20 40 60 80 100 120
Che
at y
ield
, lb/
acre
100
200
300
400
500
600
700
800
900
Foliar N Fertilizer: Ammonium Hydroxide(Wheat variety: Jagger)
N rate, lb/acre
0 20 40 60 80 100 120
Che
at y
ield
, lb/
acre
100
200
300
400
500
600
700
800
900
Y=749.4-720.2X (X<JOINT)Y=210.4 (X>JOINT)JOINT=0.74R2=0.80 (P<0.01)

Page 198 1997 OSU Soil Fertility Research
Figure 11. Cheat yield response to foliar N application, 1996 (Ammonium sulfate)
Foliar N Fertilizer: Ammonium Sulfate(Wheat variety: Tonkawa)
N rate, lb/acre
0 20 40 60 80 100 120
Che
at y
ield
, lb/
acre
0
100
200
300
400
500
600
Foliar N Fertilizer: Ammonium Sulfate(Wheat variety: Jagger)
N rate, lb/acre
0 20 40 60 80 100 120
Che
at y
ield
, lb/
acre
0
100
200
300
400
500
600
Y=264.6-31.61X (X<JOINT)Y=125.8 (X>JOINT)JOINT=4.4R2=0.40 (P<0.05)
Y=528.4-692.63X (X<JOINT)Y=287.0 (X>JOINT)JOINT=0.35R2=0.40 (P<0.05)
Foliar N Fertilizer: UAN(Wheat variety: Tonkawa)
N rate, kg ha-1
0 20 40 60 80 100 120
Che
at re
duct
ion,
%
-20
0
20
40
60
80
100
Foliar N Fertilizer: UAN(Wheat variety: Jagger)
N rate, kg ha-1
0 20 40 60 80 100 120
Che
at re
duct
ion,
%
-20
0
20
40
60
80
100
Figure 12. Cheat reduction response to foliar N application, 1996 (UAN)
Y=15.2+1.90X (X<JOINT)Y=52.1 (X>JOINT)JOINT=19.4R2=0.36 (P<0.05)

OSU Soil Fertility Research 1997 Page 199
Foliar N Fertilizer: Ammonium Hydroxide(Wheat variety: Tonkawa)
N rate, kg ha-1
0 20 40 60 80 100 120
Che
at re
duct
ion,
%
0
20
40
60
80
100
Foliar N Fertilizer: Ammonium Hydroxide(Wheat variety: Jagger)
N rate, kg ha-1
0 20 40 60 80 100 120
Che
at re
duct
ion,
%
0
20
40
60
80
100
Y=-15.4+123.30X (X<JOINT)Y=70.3 (X>JOINT)JOINT=0.7R2=0.81 (P<0.01)
Figure 13. Cheat reduction response to foliar N application, 1996 (Ammonium hydroxide)
Foliar N Fertilizer: Ammonium Sulfate(Wheat variety: Tonkawa)
N rate, lb/acre
0 20 40 60 80 100 120
Che
at re
duct
ion,
%
-20
0
20
40
60
80
100
Foliar N Fertilizer: Ammonium Sulfate(Wheat variety: Jagger)
N rate, lb/acre
0 20 40 60 80 100 120
Che
at re
duct
ion,
%
-20
0
20
40
60
80
100
Figure 14. Cheat reduction response to foliar N application, 1996 (Ammonium sulfate)
Y=34.0+6.46X (X<JOINT)Y=67.0 (X>JOINT)JOINT=5.1R2=0.37 (P<0.05)
Y=-9.6+143.34X (X<JOINT)Y=41.7 (X>JOINT)JOINT=0.4R2=0.42 (P<0.05)

Page 200 1997 OSU Soil Fertility Research
Improving Fertilizer Nitrogen Use Efficiency Using Alternative Legume Interseeding in Continuous Corn Production Systems
D.A. Keahey, S.B. Phillips, J.A. Hattey, G.V. Johnson, J.L. Caddel and W.R. Raun
ABSTRACTMany alternative management systems have been evaluated for corn (Zea mays L.), soybeans (Glycine max L.), and wheat (Triticum aestivum L.) production, however, most have involved rotations from one year to the next. Legume interseeding systems which employ canopy reduction techniques in corn have not been thoroughly evaluated. One study was initiated in 1994 at the Oklahoma Panhandle Research and Extension Center near Goodwell, OK, on a Richfield clay loam soil, to evaluate five legume species: yellow sweet clover (Melilotus officinalis L.), subterranean clover (Trifolium subterraneum L.), alfalfa (Medicago sativa L.), arrowleaf clover (T. vesiculosum L.) and crimson clover (T. incarnatum L.) interseeded into established corn. In addition, the effect of removing the corn canopy above the ear (canopy reduction) at physiological maturity was evaluated. Canopy reduction increased light interception beneath the corn thus enhancing legume growth in late summer, early fall, and early spring the following year prior to planting. Legumes incorporated prior to planting were expected to lower the amount of inorganic nitrogen fertilizer needed for corn production. Crimson clover appeared to be more shade tolerant than the other species evaluated. Grain yields were not affected by removing the tops at physiological maturity when compared to conventional management. Following two years, no response to applied N as fertilizer or incorporated green manure legumes was observed. Additional time will be required to evaluate these practices at this site where residual soil N was high.
INTRODUCTION
ver the past 20 years, various researchers have evaluated intercropped legumes for increased N supply in corn (Zea mays L.) production. As sources of inorganic nitrogen fertilizer become less dependable and prices increase, organic
forms, particularly legumes, are being considered as alternative sources for non-legume crops. Dalal (1974) noted that corn and pigeon pea (Cajanus cajan L.) yields were reduced when intercropped compared to that grown alone, although the combined yield exceeded that of either monoculture. Searle et al. (1981) stated that corn grain yield was not affected by legume intercrop, indicating neither competitive depression nor nitrogen transfer from the legume. Nair et al. (1979) demonstrated that intercropping corn with soybeans increased yield 19.5% when compared to monoculture corn. Scott et al. (1987) noted yields following medium red clover (T. pratense L.) were equivalent to the addition of 17 kg ha-1 fertilizer-N. Coultas et al. (1996) reported that velvet bean (Mucuna pruriens L.) intercropping did not have a positive effect on corn grain yields,
O

OSU Soil Fertility Research 1997 Page 201
but they did obtain some indication that velvet bean intercropping reduced weed populations.
Multiple cropping systems are productive, economical and nutritionally beneficial compared to monocultures. They also provide other benefits such as greater income stability, reduced weed pressure and reduced susceptibility to soil erosion especially in small farming systems (Wade and Sanchez, 1984). Growing dual-purpose grain legumes in rotation with cereals always increases the yield of the latter (Haque and Jutzi, 1984). Land Equivalent Ratios (LER) also increased with intercropping, providing greater productivity per unit of land than monoculture production systems (Allen and Obura, 1983). Partial LERs of corn increased with increasing nitrogen while partial LERs of soybean decreased, indicating a progressive increase in the relative competitive ability of corn. Mohamed et al. (1994) reported the highest LER was obtained with interplanting corn between cotton rows at 30 cm spacing and supplied with 120 kg N/feddan (0.42 ha). Intercropping winged bean (Psophocarpus tetragonolobus L.) with early corn produced 14% more biomass and 39% more N per hectare than did the corn monoculture (Hikam et al. 1992).
Even though intercropping usually includes a legume, applied nitrogen may still confer some benefits to the system as the cereal component depends heavily on nitrogen for maximum yield (Ofori and Stern, 1986). Chowdhury and Rosario, (1994) found that intercropping corn with mungbeans (Vigna radiata L.) increased yields 71% when the N application rate was increased from 0 to 90 kg/ha. Ebelhar et al. (1984) reported with no fertilizer N applied, there was an increase in corn grain yield from 2.5 to 6.2 Mg ha -1
with hairy vetch (Vicia villosa L.) treatment compared with corn residue. Corn yields increased 62% with applied N (0 versus 120 kg N ha-1). Cowpea (V. unguiculata L.) yields decreased 27% from applied N. This was attributed to less dependence on applied N due to higher nodulation in late maturing cowpea cultivars (Ezumah et al. 1987). This work further concluded that cultivars of corn and cowpea are available that can be intercropped.
Intercropping a legume with a non-legume crop has been a traditional practice of farmers in subtropical and tropical countries. However, most intercropping practices evaluated in temperate climates show no economical advantages compared to conventional systems (Calavan and Wiel, 1988). Oyer and Touchton, (1990) demonstrated the benefits of fall-seeded cover-crop legumes for corn grown under conservation tillage systems in the southeast United States. Their work stressed the importance of winter cover-crop legumes for spring crop nitrogen conservation. Calavan and Wiel, (1988) noted various factors concerning intercropping systems, which included shading of legume intercrop, fertilizer nitrogen, time of planting, harvest of the taller cereal crop, density and spacing arrangements of the intercrops. Willey and Osiru, (1972) reported a 38% increase in yield when corn was mixed with beans. They suggested that, because of the marked height difference of the two crops, an increased utilization of light was probably a major contributing factor. Bryan and Peprah, (1988) noted that intercropping corn with common beans (Phaseolus vulgaris L.) reduced corn grain and forage yields compared to corn in monoculture but had no effect on total forage production. Cropping practices should allow at least 80% ambient illumination measured at the height of 50 cm for substantial soybean N2-fixation (Wahua and Miller, 1978).

Page 202 1997 OSU Soil Fertility Research
Canopy reduction is defined as the removal of the corn canopy just above the ear at physiological maturity, where the cut portion is allowed to drop to the soil surface. Some of the basis of canopy reduction comes from regions where a relay crop, like common beans, is produced following corn. In order to increase light interception beneath the corn canopy for the bean plant, the tops of the corn can be removed once physiological maturity is reached. This in turn does not sacrifice the corn yield while increasing the chances of producing a bean crop that would not have been possible if planting took place following corn harvest.
Much of the past work has focused on yield levels obtained for both corn and interseeded legumes, and not the use of interseeded legumes as green manures. Olson et al. (1986) noted that interseeded alfalfa used as green manure increased average corn yields 880 kg ha-1. Conventional tillage practices have generally led to a decline in soil organic matter levels. This leads to lower soil productivity, increased surface erosion, and net mineralization of soil organic nitrogen. To maintain yields with continuous cultivation, supplemental nitrogen inputs from fertilizers, animal manures, or legumes are required (Doran and Smith, 1987). Clement et al. (1992) noted that yield increases with the application of nitrogen were comparable in sole cropping and intercropping.
The objective was to evaluate the effect of interseeded legume species and nitrogen rates combined with canopy reduction on corn grain yield and grain protein.
MATERIALS AND METHODS
One experiment was established in the spring of 1994 at the Oklahoma Panhandle Research and Extension Center near Goodwell, OK on a Richfield clay loam (fine, montmorillonitic, mesic Aridic Argiustoll). Treatment structure for this field experiment is reported in Table 1. Initial soil test characteristics and soil classification are reported in Table 2. A randomized complete block experimental design with three replications was used. Plot size consisted of four rows (0.76 m spacing) x 7.62 m. All treatments received 100 kg N ha-1 of urea (45-0-0) in the fall of 1995. In 1996 and for the remaining years of this experiment, treatments 1-5, 7 and 12 received no N to assess legume N fixation compared to identical treatments with 50 kg N ha-1 yr-1. Pioneer brand 3299 corn hybrid was planted at a seeding rate of 74,000 seeds ha -1 on 21 April and 30 April in 1995 and 1996, respectively.
Herbicides and insecticides that were applied are reported in Table 3. Entire experimental areas were treated alike for weed control and as such, weed control was not a variable. The expected weed composition and severity was considered at each experimental site each year.
Canopy reduction was imposed by removing the tops of the corn plants just above the ear using a machete. This allowed sunlight to reach the legume seedbed. In August, when the corn had reached physiological maturity, five legume species were interseeded by hand at the following seeding rates: yellow sweet clover (Melilotis officinalis L.) 44.8 kg ha-1, subterranean clover (Trifolium subterraneum L.) 44.8 kg ha-1, alfalfa (Medicago sativa L.) 33.6 kg ha-1, arrowleaf clover (T. vesiculosum L.) 22.4 kg ha-1 and crimson clover (T. incarnatum L.) 44.8 kg ha-1. Physiological maturity was determined by periodic monitoring grain black layer formation. Following interseeding and canopy reduction, 5 cm of irrigation water was applied for legume establishment and to prevent
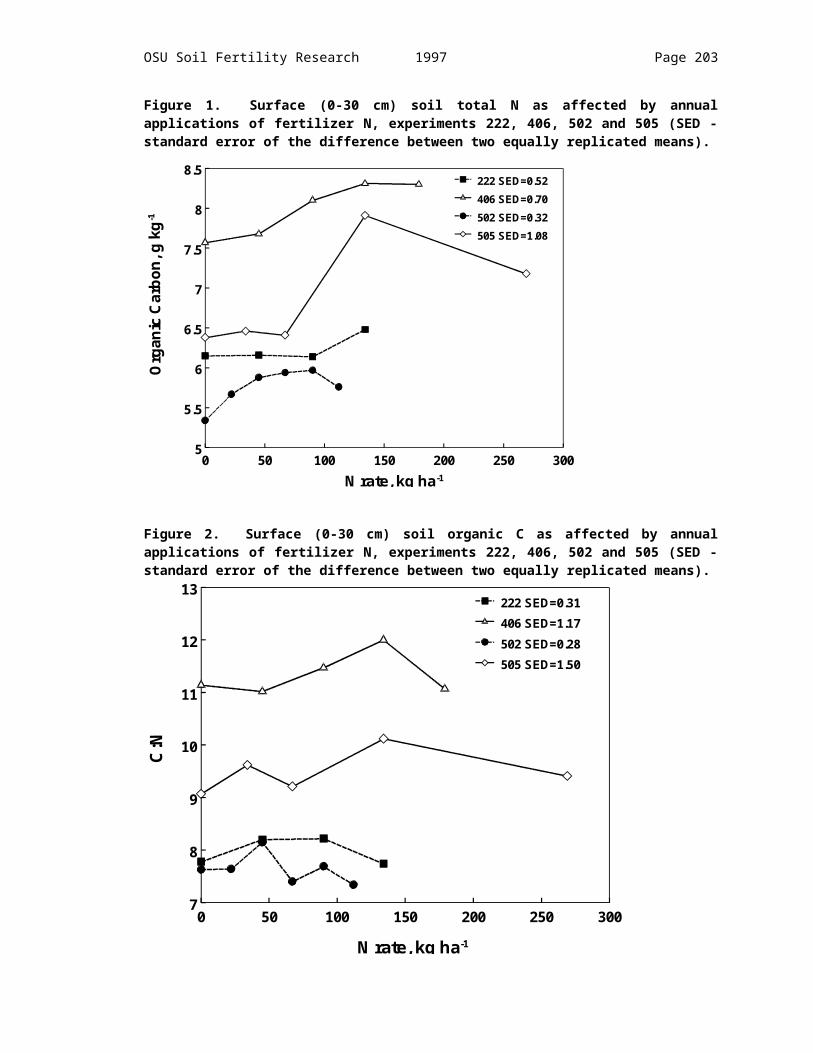
OSU Soil Fertility Research 1997 Page 203
reduction in growth caused by moisture stress. The legume seeds were inoculated prior to planting with a mixture of Rhizobium meliloti and R. trifolii bacteria. Harvest area consisted of two rows (0.76 m spacing) x 7.62 m. Harvesting and shelling were performed by hand. Plot weights were recorded and sub-sampled for moisture and chemical analysis. Subsamples were dried in a forced-air oven at 650C and ground to pass a 140 mesh screen. Total nitrogen concentration was determined on all grain samples using dry combustion (Schepers et al. 1989). Protein N in corn grain can be determined by multiplying %N by 6.25 (personal communication, University of Nebraska, 1997).
Interseeded legumes remained in the field until the following spring (Figure 1) when they were incorporated prior to corn planting using a shallow (10 cm) disk. Legumes were only used for ground cover and potential nitrogen fixation and as such were not harvested for seed or forage.
RESULTS AND DISCUSSION
By imposing the alternative management practice of canopy reduction, we visually observed an increase in light interception beneath the corn canopy, thus enhancing legume growth in late summer, early fall before corn harvest, and early spring the following year prior to planting. Crimson clover had superior spring growth compared to the other species evaluated as visual biomass production was greater when incorporated in early April prior to planting. Analysis of variance and single-degree-of-freedom-contrasts and treatment means for grain yield and protein are reported in Tables 4 and 5. No grain yield response to applied N was observed in either year using conventional production practices (12 vs 13, 0 N applied, and 100 kg N ha -1). The lack of fertilizer N response at this site restricted adequate evaluation of legume N contribution and species comparison. Grain yields were low in 1995, a result of a severe volunteer corn problem from improper combine harvest in 1994.
There was no significant difference between grain yields when tops were cut at physiological maturity compared to the normal practice (5 vs 7, crimson clover with and without canopy reduction, with no N applied). This was attributed to the fact that when the corn plant reaches physiological maturity, all nutrient and moisture uptake has ceased. Also, it was important to find no differences between canopy reduction and conventional management because it demonstrated the applicability of interseeding in late summer. With the addition of fertilizer, no differences in grain yield were observed for crimson clover with canopy reduction and 0 N applied compared to crimson clover with canopy reduction and 50 kg N ha-1 (5 vs 11, Table 4). Under the two management practices with different N rates, a similar lack of differences were found (7 vs 11, crimson clover without canopy reduction with 0 N applied and crimson clover with canopy reduction with 50 kg N ha-1 applied).
Due to large amounts of residual nitrogen in the soil, response to applied nitrogen (and or potential nitrogen fixation) was not observed in the first two years of the study (1-5 vs 6, 8-11, with canopy reduction and 0 N applied, and canopy reduction with 50 kg N ha-1). Grain protein ranged from 107 to 117 g kg-1 in 1995, and from 85 to 95 g kg-1 in 1996 and was not affected by applied N in either year (Figure 2). Increased grain protein

Page 204 1997 OSU Soil Fertility Research
in 1995 compared to 1996 was likely due to elevated residual N at the time the study was initiated.
Although not evaluated in this study, mechanized canopy reduction could decrease the time required for grain to lose moisture since more sunlight would directly come in contact with the corn ears when the tops were removed. When grain moisture is high it can delay harvest and/or significantly increase drying costs. Legume seeding rates, alternative species, method of interseeding and interseeding date will all need to be thoroughly evaluated prior to the mechanization and implementation of this practice. However, our results indicate that it is a possible alternative which deserves further consideration and evaluation.
Since nitrate leaching and soil erosion are becoming major concerns in production agriculture today, this experiment may lead to practices that can decrease both, via lowering the amount of inorganic fertilizer N needed for corn production and reducing the amount of bare soil susceptible to wind and water erosion.
CONCLUSIONS
Canopy reduction has been used in third world countries as a means of increasing light interception for a relay crop. Canopy reduction is imposed when the corn reaches physiological maturity (when nutrient and water uptake has ceased). Under the two different management practices (canopy reduction and conventional) evaluated in this study, no significant differences in grain yield and protein were observed. When additional fertilizer N was applied, no response was seen in grain yield or protein. This was attributed to high residual N in the soil. Further research is needed to evaluate legume seeding rates, alternative species, method of interseeding and interseeding date. However, legume interseeding using corn canopy reduction appears to be feasible but will require added evaluation at N responsive sites.
REFERENCESAllen, James R. and Robert K. Obura. 1983. Yield of corn, cowpea and soybean under different
intercropping systems. Agron. J. 75:1005-1009.
Bryan, W.B. and S.A. Peprah. 1988. Effect of planting sequence and time, and nitrogen on maize legume intercrop yield. J. Agron. & Crop Sci. 161:17-22.
Calavan, Kay M. and Ray R. Weil. 1988. Peanut-corn intercrop performance as affected by within-row corn spacing at a constant row spacing. Agron. J. 80:635-642.
Chowdhury, M.K. and E.L. Rosario. 1994. Comparison of nitrogen, phosphorus and potassium utilization efficiency in maize/mungbean intercropping. J. of Agric. Sci., Cambridge. 122:193-199.
Clement, A., Francois-P. Chalifour, M.P. Bharati and G. Gendron. 1992. Effects of nitrogen supply and spatial arrangement on the grain yield of a maize /soybean intercrop in a humid subtropical climate. Can. J. Plant Sci. 72:57-67.
Coultas, C.L., T.J. Post, J.B. Jones, Jr. and Y.P Hsieh. 1996. Use of velvet bean to improve soil fertility and weed control in corn production in northern Belize. Commun. Soil Sci. Plant Anal., 27(9&10), 2171-2196.
Dalal, R.C. 1974. Effects of intercropping maize with pigeon peas on grain yield and nutrient uptake. Expl. Agric. 10:219-224.

OSU Soil Fertility Research 1997 Page 205
Doran, J.W. and M.S. Smith. 1987. Organic matter management and utilization of soil and fertilizer nutrients. Soil Sci. Soc. Am. J. 19:53-72.
Ebelhar, S.A., W.W. Frye and R.L. Blevins. 1984. Nitrogen from legume cover crops for no-tillage corn. Agron. J. 76:51-55.
Ezumah, H.C., Nguyen Ky Nam and P. Walker. 1987. Maize-cowpea intercropping as affected by nitrogen fertilization. Agron. J. 79:275-280.
Hikam, S., C.G. Poneleit, C.T. MacKown and D.F. Hildebrand. 1992. Intercropping of maize and winged bean. Crop Sci. 32:195-198.
Haque, I. and S. Jutzi. 1984. Nitrogen fixation by forage legumes in sub-Saharan Africa: Potential and limitations. ILCA Bulletin 20:2-13.
Mohamed, H.M.H. and M.I.M. Salwau. 1994. Effect of intercropping cotton with maize under different nitrogen rate and different hill spacing of maize. Beltwide Cotton Confrences.
Nair, K.P., U.K. Patel, R.P. Singh and M.K. Kaushik. 1979. Evaluation of legume intercropping in conservation of fertilizer nitrogen in maize culture. J. Agric. Sci. Camb. 93:189-194.
Ofori, Francis and W.R. Stern. 1986. Maize/cowpea intercrop system: effect of nitrogen fertilizer on productivity and efficiency. Field Crops Research 14:247-261.
Olson, R.A., W.R. Raun, Yang Shou Chun and J. Skopp. 1986. Nitrogen management and interseeding effects on irrigated corn and sorghum and on soil strength. Agron. J. 78:856-862.
Oyer, L.J. and J.T. Touchton. 1990. Utilizing legume cropping systems to reduce nitrogen fertilizer requirements for conservation-tilled corn. Agron. J. 82:1123-1127.
Schepers, J.S., D.D. Francis and M.T. Thompson. 1989. Simultaneous determination of total C, total N and 15N on soil and plant material. Commun. Soil Sci. Plant Anal. 20:949-959.
Scott, T.W., J. Mt. Pleasant, R.F. Burt and D.J. Otis. 1987. Contributions of ground cover, dry matter, and nitrogen from intercrops and cover crops in a corn polyculture system. Agron. J. 79:792-798.
Searle, P.G.E., Yuthapong Comudom, D.C. Shedden and R.A. Nance. 1981. Effect of maize + legume intercropping systems and fertilizer nitrogen on crop yields and residual nitrogen. Field Crops Res. 4:133-145.
Wade, M.K. and P.A Sanchez. 1984. Productive potential of an annual intercropping scheme in the Amazon. Field Crops Res. 9:253-263.
Wahua, T.A.T. and D.A. Miller. 1978. Effects of shading on the N2-fixation, yield, and plant composition of field-grown soybeans. Agron. J. 70:387-392.
Willey, R.W. and D.S.O. Osiru. 1972. Studies on mixtures of maize and beans (Phaseolus vulgaris) with particular reference to plant population. J. Agric. Sci., Camb. 79:517-529.

Page 206 1997 OSU Soil Fertility Research
Table 1. Treatment structure including legume species interseeded, management of corn canopy and N rate.
Treatment Legume Management N ratekg ha-1
(1995)
N ratekg ha-1
(1996)1. Yellow Sweet Clover Tops cut at PM 100 0
2. Subterranean Clover Tops cut at PM 100 0
3. Alfalfa Tops cut at PM 100 0
4. Arrowleaf Clover Tops cut at PM 100 0
5. Crimson Clover Tops cut at PM 100 0
6. Subterranean Clover Tops cut at PM 100 50
7. Crimson Clover Normal 100 0
8. Yellow Sweet Clover Tops cut at PM 100 50
9. Alfalfa Tops cut at PM 100 50
10. Arrowleaf Clover Tops cut at PM 100 50
11. Crimson Clover Tops cut at PM 100 50
12. No Legume Normal 100 0
13. No Legume Normal 100 100
PM- physiological maturity of cornN applied as urea in split applications (45-0-0)

OSU Soil Fertility Research 1997 Page 207
Table 2. Initial surface (0-15 cm) soil test characteristics and soil classification at Goodwell, OK.
Location pH Total N Org. C NH4-N NO3-N P K
---------- g kg-1 --------- --------mg kg-1 -------- -------mg kg-1------Goodwell 7.7 1.4 11.7 65 25 29 580
Classification: Richfield clay loam (fine, montmorillonitic, mesic Aridic Argiustoll)pH - 1:1 soil:water, Total N and Organic C - dry combustion, NH4-N and NO3-N - 2M KCl extraction,P and K - Mehlich III extraction.
Table 3. Herbicides and insecticides applied.
Brand name Active
ingredient
Chemical
formula
Crop year Amount
applied
Purpose
Atrazine Atrazine 6-chloro-N-ethyl-N’-(1-
methylethyl)-1,3,5-triazine-2,4-
diamine
95-96 2.24 kg ai
ha-1
Broadleaf and grass
control
Dual II Metolachlor 2-chloro-N-(2-ethyl-6-
methylphenyl)-N-(2-methoxy-1-
methylethyl)acetamide
95-96 383.1 ml
ha-1
Broadleaf and grass
control
Karate Lambda-
cyhalothrin
[1(S*),3(Z)]-(+)-cyano-(3-
phenoxyphenyl)methyl-3-(2-
chloro-3,3,3-trifluoro-1-propenyl)-
2,2-dimethylcyclopropane-
carboxylate
94-95
95-96
47.9 ml ha-
1
Corn borer and mite
control

Page 208 1997 OSU Soil Fertility Research
Table 4. Analysis of variance and single-degree-of-freedom-contrasts for grain yield, and percent protein, Goodwell, OK, 1995 and 1996.
Source df 1995 1996 1995 1996 ------Grain yield, (kg ha-1)2------ ---Protein, (g kg-1)2---
---------------------------------------------Mean Squares--------------------------------------------Rep 2 346,923 2,584,504 119.2 32.9Trt 12 386,756 1,905,549 40.5 21.8Error 24 308,048 1,861,850 41.8 3.8
Contrasts 12 vs 13 1 1,074,085 493,379 0.6 0.4 7 vs 11 1 4,761 182,271 0.2 56.2 1-5 vs 6,8-11 1 98,609 2,631,571 0.2 27.9 5 vs 7 1 37,562 3,138,066 0.5 43.6 5 vs 11 1 15,577 1,807,750 0.5 0.8SED 453 1,114 5 5
@, *, ** significant at 0.10, 0.05 and 0.01 probability levels, respectively. SED - standard error of the difference between two equally replicated means.

OSU Soil Fertility Research 1997 Page 209
Table 5. Treatment means for grain yield and percent protein for 1995 and 1996.
-------------------------------Treatment means------------------------------Treatment Legume 1995 1996 1995 1996
----------Grain yield, kg ha-1---------- -------Protein, g kg-1-------1 YSC 2,641 9,731 110 912 SC 2,015 10,056 108 913 ALF 2,228 9,661 111 904 ALC 1,932 10,540 117 865 CC 1,808 8,405 114 906 SC 1,843 7,958 111 907 CC 1,967 9,852 117 958 YSC 1,637 8,339 110 859 ALF 2,423 10,270 107 86
10 ALC 2,236 9,362 107 8911 CC 1,910 9,503 110 8912 NL 2,756 9,617 113 8813 NL 2,618 10,190 117 88
SED 453 1,114 5 5SED= standard error of the difference between two equally replicated means. YSC - yellow sweet clover. SC -subterranean clover. ALF - alfalfa. ALC - arrowleaf clover. CC - crimson clover. NL - no legume.
Figure 1. Time schedule for canopy reduction and legume interseeding.
ONE COMPLETE CYCLE
SPRING GROWTH OF LEGUMES MONOCULTURE CORN
FALL GROWTH OF LEGUMES
OCT., NOV., DEC., JAN., FEB. AUG., SEPT., OCT.
ONE YEAR
MAR., APR.
LEGUMES INTERSEEDED
CORN TOPS REMOVED
CORN HARVESTED
DORMANT/REDUCED GROWTH
CORN PLANTINGSURFACE INCORPORATIONOF LEGUMES AND CORN STALKS
APR., MAY, JUNE, JULY

Page 210 1997 OSU Soil Fertility Research
Figure 2. Grain protein for 1995 and 1996 YSC - yellow sweet clover, SC - subterranean clover, ALF - alfalfa, ALC - arrowleaf clover, CC - crimson clover, NL - no legume, CCN - crimson clover with no canopy reduction, 100_0, 100_50 and 100_100 - N rate combinations in kg ha-1 for 1995 and 1996, respectively. SED - standard error of the difference between two equally replicated means).
Figure 3. Corn grain yields for 1994, 1995 and 1996 (YSC - yellow sweet clover, SC - subterranean clover, ALF - alfalfa, ALC- arrowleaf clover, CC - crimson clover, NL - no legume, CCN - crimson clover with no canopy reduction,100_0, 100_50 and 100_100 - N rate combinations in kg ha-1 for 1995 and 1996, respectively. SED - standard error of the difference between two equally replicated means).
YSC
100_
0
SC 10
0_0
ALF
100_
0
ALC
100_
0
SC 10
0_5 0
CCN
100 _
0
YSC
100_
50
ALF
100_
50
NL 10
0_0
NL 10
0_1 0
0
0
20
40
60
80
100
120
1995 SED = 51996 SED = 5
Legume and Applied Nitrogen, kg ha-1
Gra
in p
rote
in, g
kg-1
ALC
100_
50
SC 1
0 0_0
ALF
100_
0
ALC
1 00_
0
CC 1
00_0
SC 1
0 0_5
0
CCN
100_
0
YSC
100_
50
ALF
1 00_
5 0
ALC
100 _
50
CC 1
00_5
0
NL 1
00_1
00
0
2000
4000
6000
8000
10000
12000
1994 S E D = 12 571995 S E D = 45 31996 S E D = 11 14
Gra
in y
ield
, kg
ha-1
Legume and applied N, kg ha-1
OSU Soil Fertility Research 1997 Page 211
Nitrogen Accumulation Efficiency: Relationship Between Excess Fertilizer And Soil-Plant Biological Activity In Winter Wheat
H. Sembiring, G.V. Johnson and W.R. Raun
ABSTRACTThe point at which N applied results in 100 percent recovery in the soil has not been evaluated in winter wheat (Triticum aestivum L.) production systems. In dryland winter wheat, subsoil accumulation has not been found to occur until nitrogen rates exceeded that required for maximum yield. Many conventional N rate experiments have not properly evaluated subsoil N accumulation due to the lack of equally spaced N rates at the high end of the spectrum, over which accumulation is expected to occur. Therefore, the objectives of this study were (1) to determine when soil profile accumulation efficiencies reach 100% in continuous winter wheat production and (2) to evaluate the potential for NO3-N leaching in continuous winter wheat when extremely high rates of fertilizer N are used. Two field experiments (T505 and T222) were conducted during the 1995-96 season using ten N rates (preplant-incorporated) ranging from 0 to 5376 kg ha-1. Following harvest, soil cores were taken to 2.4 m and analyzed for NH4-N and NO3-N. Crop nitrogen use efficiency (NUE) and soil profile inorganic N accumulation efficiencies changed with fertilizer rate and were inversely related. The results indicate that leaching did not take place in the first year of the study, at both locations. Priming may have occurred since increased NUE was observed at low N rates. Nitrogen accumulation efficiencies reached 100% at N rates < 168 and 448 kg ha-1 in experiments T505 and T222, respectively. At both T222 and T505 no subsoil accumulation of NH4-N or NO3-N beyond 60 cm was observed for any of the N treatments when compared to the 0-N check, even when N rates exceeded 448 kg ha-1.
INTRODUCTION
revious studies have indicated poor efficiency for subsoil accumulation of mineral N from excess fertilizer applications. Evaluation of long-term N rate studies have reported that subsoil accumulation did not occur until rates exceeded winter wheat
maximum yield requirements by about 20 kg ha-1. Delayed accumulation is a result of natural processes which are responsible for poor nitrogen use efficiency (NUE). Combined, they help explain the concept of soil-plant buffering of inorganic soil N, proposed by Raun and Johnson (1995) and Johnson and Raun (1995). Conventional N rate experiments do not allow evaluation of subsoil N accumulation because the high rates are at the low end of the range over which accumulation is expected to occur.
P
The soil-plant buffering concept proposed by Raun and Johnson (1995), documents that increased plant protein, gaseous loss of N from plants, denitrification, immobilization, and ammonia volatilization from soils, all take place when N rates exceed that required from maximum yield. Increased plant protein and plant N volatilization probably account for more of the total buffer size of the soil-plant system

Page 212 1997 OSU Soil Fertility Research
than the other sinks. Therefore, these mechanisms have and continue to provide an effective buffer against increased soil profile accumulation of inorganic N (and potential NO3 leaching) when crops are produced in unpredictable environments. The size and/or magnitude of each mechanism depends on the climate, soil type, fertilizer source and method of fertilizer application (Johnson and Raun, 1995).
Four long-term winter wheat experiments in Oklahoma with various nitrogen rates have been evaluated to examine the dynamics of nitrogen in the soil profile. Raun and Johnson (1995) concluded that the threat of fertilizer N use on groundwater contamination was minimal when N fertilizer rates were less than those required for maximum yield. Even at fertilizer N rates beyond those necessary to achieve maximum yield, soil profile inorganic N did not immediately increase. However, at high fertilizer N rates, the soil-plant system can no longer buffer against inorganic N accumulation. Buffering is used here to reflect an entire mechanism that would result in N loss when N rates exceed that required for maximum yield, but prior to observing significant increases in soil profile inorganic N. At present, no work has documented the N rate (for a particular soil) at which an additional one kg of N applied results in an increase in one kg of soil profile inorganic N. As per the work of Raun and Johnson (1995), this should take place once all buffering mechanisms are saturated (N uptake, immobilization, denitrification and plant N loss). However, each of these buffering mechanisms are expected to be saturated at different N rates. Therefore, the objectives of this study were (1) to determine when soil profile accumulation efficiencies reach 100% in continuous winter wheat production and (2) to evaluate the potential for NO3-N leaching in continuous winter wheat when extremely high rates of fertilizer N are used.
MATERIALS AND METHODS
Two experiments were conducted near long-term winter wheat experiments in Stillwater (#222) and Lahoma (#505). At each of these sites, soil-plant inorganic N buffering was evaluated in 1988 and 1993. These new experiments are referred to as T222 and T505. Experiment T222 is on a Kirkland silt loam (fine-mixed, thermic, Udertic Paleustoll) and T505 is on a Grant silt loam soil (fine-silty, mixed, thermic Udic Argiustoll). Results from initial soil samples taken prior to the start of each experiment are reported in Table 1. The experimental design was a randomized complete block with two replications. Nitrogen as ammonium nitrate was applied at rates of 0, 56, 112, 168, 224, 448, 896, 1792, 3584 and 5376 kg ha-1 on October 2, 1995 to T222 and October 6, 1995 to T505. Fertilizer was immediately incorporated using a John Deere GT262 rotary tiller. Individual plots were 3.1 m x 3.1 m with 1.5 m alleys between each plot. Following the incorporation of fertilizers, winter wheat was planted in 19.1 cm rows using a John Deere 450 grain drill. The variety ‘Tonkawa’ was planted at a rate of 67.2 kg ha-1. Grain yield was determined in each plot by harvesting the entire area on June 10, 1996 for T222 and June 13, 1996 for T505. Rainfall distribution during plant growth at T222 and T505 is presented in Figure 1 and 2.
Following harvest, three soil cores (4.5 cm diameter) from each plot were taken to a depth of 2.4 m and partitioned into increments of 0 to 15, 15 to 30, 30 to 45, 45 to 60, 60 to 90, 90 to 120, 120 to 150, 150 to 180, 180 to 210 and 210 to 240 cm. Samples were air-dried at ambient temperature and ground to pass a 20-mesh screen. They were

OSU Soil Fertility Research 1997 Page 213
then extracted using 2 M KCl and analyzed for NH4-N and NO3-N using an automated flow injection analysis system (Lachat, 1989 and 1990).
Fertilizer recovery was calculated using the following formula; ((T i - Tcheck) + (NH4NO3i - NH4NO3check))/N applied; where, Ti was the total N removed in treatment i and Tcheck was the total N removed in the unfertilized check plot; NH4NO3i was total amount of inorganic N in the fertilized plot, assuming that the amount of mineralization in the check and fertilized plots was the same and NH4NO3check was the total inorganic N accumulated in the unfertilized check. Nitrogen accumulation efficiency in percent (NAE) was calculated by NAE=[100(Ni - No) inorganic profile N]/[Ni (applied) - (Ni
crop - No crop)]; where, Ni was the total NH4-N and NO3-N in soil profile (0-240 cm); Ni
applied was total N applied; Ni crop was the total N removed in the fertilized plots; No
crop was the total N removed in the check/unfertilized plot. Nitrogen use efficiency (NUE) was calculated as NUE=[100(Ni -No) grain N]/Ni applied; where, Ni was the total N uptake in the treated plots; No was the total N removed in the check plot and Ni was the rate of nitrogen applied.
RESULTS AND DISCUSSION
Yield and N uptake vs. N rate The effect of N rate on yield and N uptake is presented in Figures 3 and 4.
Analysis of variance and associated treatment means for grain yield, grain N uptake, NO3-N, NH4-N and total inorganic N are reported in Tables 2 and 3. At T222, yield and N uptake were not affected by N rate. The poor yields at T222 were a function of having a poor stand at planting and moisture stress throughout the growing season. Total seasonal rainfall was 18.7 cm at T222 compared to 29.7 cm at T505. No wheat plants grew when N rates exceeded 896 kg ha-1 at T222; whereas, at T505 wheat continued to grow when N was applied at 3584 kg ha-1, however, growth was limited.
Fertilizer Recovery Analysis of variance for fertilizer recovery for T222 and T505 is reported in
Table 4. Fertilizer recovery was markedly different at the two sites. At T222, the highest estimated fertilizer recovery was 150% at an N rate of 448 kg N ha-1 and lowest (32%) at an N rate of 56 kg ha-1 (Figure 5). At T505, the highest fertilizer recovery was 120% at an N rate of 168 kg ha-1 and lowest (29%) at an N rate of 5376 kg ha-1. This difference was expected to be due to soil-plant buffering and rainfall. However, bias analysis errors were also a problem considering observed recoveries in excess of 100%. Raun et al. (1996) also found that fertilizer N recovery at experiment 502 (close to T505) was higher compared to experiment 222 (close to T222).
The increased fertilizer recoveries noted for T505 compared to T222 at the low N rates is worthy of further discussion. Two of the factors believed to be responsible are priming and soil-plant buffering. Westerman and Kurtz (1973) described priming as the result of stimulation of microbial activity by N fertilizer (at low N rates) which increases mineralization of soil N, thus making more soil N available for plants. Raun et al. (1996) suggested that soil-plant buffering will be greater in soils where priming is observed, a result of increased N from easily mineralizable pools. They also noted that these soil-

Page 214 1997 OSU Soil Fertility Research
plant environments will be capable of immobilizing excess mineral N. Combined these results help explain why fertilizer N recovery was greater in experiment T505 (no priming, less easily mineralizable N and less soil-plant buffering).
Nitrogen use efficiency (NUE)The highest NUE for T222 was 29.9% at an N rate of 56 kg N ha -1, whereas at
T505 it was 128.7% at an N rate 56 kg N ha-1. The lowest NUE occurred at the highest N rate at both locations (Figure 6). Increasing N rate leads to increased denitrification, volatilization, immobilization and N plant loss and lower NUE.
Nitrogen accumulation efficiency (NAE)The highest NAE for T222 was at an N rate of 448 kg N ha-1, whereas at T505 it
was at an N rate of 168 kg N ha-1 (Figure 7). NAE was expected to reach 100% between 0 and 448 kg N ha-1. At high fertilizer N rates the soil-plant system can no longer buffer against inorganic N accumulation. Therefore, an additional one kg of N applied should theoretically result in an increase in one kg of soil profile inorganic N. Buffering is used here to reflect the combined mechanisms which would prevent soil profile accumulation, via N loss when N rates exceed that required for maximum yield. Increased soil profile inorganic N accumulation should take place once all buffering mechanisms are saturated (N uptake, immobilization, denitrification and plant N loss).
Distribution of NH4-N and NO3-N and total Inorganic N in soil profilesApplied N influenced total NH4-N and NO3-N and total inorganic N recovered in
the soil profile following the first year of winter wheat production (Table 2). The distribution of NH4-N+NO3-N in the soil profile for T222 and T505 are reported in Figures 8 and 9, respectively. At both T222 and T505 no subsoil accumulation of NH4-N +NO3-N beyond 60 cm was observed for any of the N rates when compared to the 0-N check.
REFERENCESJohnson, G.V. and W.R. Raun. 1995. Nitrate leaching in continuous winter wheat: Use of a soil-plant
buffering concept to account for fertilizer nitrogen. J. Prod. Agri. 8:446-491.
Lachat Instruments. 1989. Quickchem method 12-107-04-1-B. Lachat Instr., Milwaukee, WI.
Lachat Instruments. 1990. Quickchem method 12-107-04-1-B. Lachat Instr., Milwaukee, WI.
Raun, W.R. and G.V. Johnson. 1995. Soil-plant buffering of inorganic nitrogen in continuous winter wheat. Agron. J. 87:827-834.
Raun, W.R., G.V. Johnson, S.B. Phillips and R.L. Westerman. 1996. Effect of long-term nitrogen fertilization on soil organic carbon and total nitrogen in continuous wheat. J. Soil and Tillage Res (in Press, Soil and Tillage Res.).
Raun, W.R., G.V. Johnson, R.L. Westerman, H.L. Lees and J. Chen. 1997. Fertilizer nitrogen recovery in long-term continous winter wheat. (Soil Sci. Soc. Am. J.)
Westerman, R.L. and L.T. Kurtz. 1973. Priming effect of 15N-labeled fertilizers on soil nitrogen in field experiments. Soil Sci. Soc. Am. Proc. 37:725-727.

OSU Soil Fertility Research 1997 Page 215
Westerman, R.L., R.K. Boman, W.R. Raun, and G.V. Johnson. 1994. Ammonium and nitrate nitrogen in soil profiles of long-term winter wheat fertilization experiments. Agron. J. 86:94-99.
Table 1. Initial surface (0 - 15cm) soil test characteristics experiments T222 and T505Characteristics Methods Unit T222 T505pH 1:1 soil:H2O - 6.3 5.0Organic Carbon Dry Combustion g kg-1 7.9 7.1Total Nitrogen Dry Combustion g kg-1 0.95 0.62C:N - 8.3 11.5NH4-N Lachat mg kg-1 12 5NO3-N Lachat mg kg-1 8 5P Mehlich-3. Mg kg-1 5 45K Mehlich-3. Mg kg-1 190 320
Table 2. Analysis of variance and treatment means for grain yield, N uptake, NO 3-N, NH4-N and total inorganic N in the soil profile (0-240 cm), experiment T222, 1995-96
Source of Variation
df Yield N uptake NO3-N in the soil profile
NH4-N in the soil profile
Total Inorganic N
MeansRep 1 21409.68 25.74 15787.19 86.32 18208.24N rate 9 150729.10 156.95 1471446.23*** 1332113.72*** 5566816.69***Error 9 130276.65 114.57 32824.00 73454.44 179163.93N linear 1 90266.23 6.27 9366183.13*** 7360066.84*** 3331759.16***N quadratic 1 261790.93 446.49 2648204.87*** 3493574.28*** 12225100.74***N rate, kg ha-1 Mean, kg ha-1
0 312.31 7.40 53.32 79.19 132.5156 944.37 24.13 58.86 74.80 133.66112 583.72 17.92 102.76 86.31 189.07168 524.23 16.75 142.71 89.48 232.19224 260.26 8.12 164.89 105.67 270.55448 691.54 23.27 553.49 224.75 778.24896 877.44 30.14 858.79 471.59 1330.391792 706.42 24.91 524.99 374.73 899.723584 345.77 11.49 1655.67 1584.60 3240.275376 115.26 3.63 2662.89 2476.12 5139.00SED 360.94 10.70 181.17 271.02 423.28
*, **, *** Significant at the 0.05, 0.01, and 0.001 probability levels, respectively. SED = standard error of the difference between two equally replicated means, df = degrees of freedom

Page 216 1997 OSU Soil Fertility Research
Table 3. Analysis of variance and treatment means for grain yield, N uptake, soil profile NO3-N, NH4-N and total inorganic N in the soil profile (0-240 cm), experiment T505, 1995-96.
Sources df Yield N uptake NO3-N NH4-N Total NMeans
Rep 1 1358971.26** 1269.58** 2633.51 5793.89 16239.77N rate 9 1395841.81*** 1012.21*** 333860.93** 53956.79*** 654856.80***Error 9 67222.93 90.49 37147.20 3882.63 63526.49N linear 1 6467607.81*** 1488.11** 2567984.99*** 428482.49*** 5094406.08***N quadratic 1 4928148.07** 6759.86*** 334870.75* 51437.44** 648795.50*Nrate, kg ha-1 Mean, kg ha-1
0 2558.35 59.75 77.11 129.00 206.1156 3320.65 79.47 86.64 129.40 216.03112 3302.06 86.32 121.37 157.81 279.18168 2833.53 82.39 205.25 183.63 388.88224 3484.27 103.23 228.66 206.69 435.35448 2963.67 92.79 307.16 240.96 548.12896 3090.10 99.22 596.41 323.92 920.341792 2041.48 67.64 582.21 359.42 941.643584 1584.10 51.39 1088.24 512.89 1601.135376 951.94 32.46 1190.10 602.41 1792.52SED 259.27 9.52 192.74 62.31 252.04
*, **, *** Significant at the 0.05, 0.01, and 0.001 probability levels, respectively. SED = standard error of the difference between two equally replicated means, df = degrees of freedom
Table 4. Analysis of variance and treatment means for fertilizer recovery for T222 and T505, 1995-96
Sources df T222 T505
MeansRep 1 0.03492 0.00517N rate 9 0.31339 0.24523Error 9 0.17404 0.12663N linear 1 0.4258 0.6667*N quadratic 1 0.5126 0.7815*Nrate: kg ha-1 Mean, %
56 0.3193 0.532112 0.5989 0.891168 0.6490 1.223224 0.6195 1.218448 1.4768 0.837896 1.3623 0.8411792 0.4379 0.4153584 0.8682 0.3875376 0.9306 0.290SED 0.4172 0.356
*, **, *** Significant at the 0.05, 0.01, and 0.001 probability levels, respectively. SED = standard error of the difference between two equally replicated means,df = degrees of freedom

OSU Soil Fertility Research 1997 Page 217
Figure 1. Rainfall Distribution at Stillwater, T222
0
2
4
6
8
10
12
14
Oct Nov Dec Jan Feb Mar Apr May
Rain
fall
(cm
)
1995-96
Normal
Figur e 2. Rainfall distribution at Lahoma, T505
0
1
2
3
4
5
6
7
8
Oct Nov Dec Jan Feb Mar Apr May
Rai
nfal
l (cm
)
1995-96
Normal

Page 218 1997 OSU Soil Fertility Research
Figure 3. Effect of N rate on grain yield at T222 and T505, 1995/96
0
750
1500
2250
3000
3750
0 500 1000 1500 2000 2500 3000 3500 4000 4500 5000 5500 6000
N rate, kg ha-1
Gra
in, k
g ha
-1
T222
T505
Figure 4. Effect of N rate on total grain N uptake, 1995/96
0
20
40
60
80
100
120
0 500 1000 1500 2000 2500 3000 3500 4000 4500 5000 5500 6000
N rate, kg ha-1
Tota
l N u
ptak
e, k
g ha
-1
T222
T505
Figure 5. Effect of N rate on fertilizer N recovery, 1995/96
0
0.2
0.4
0.6
0.8
1
1.2
1.4
1.6
0 500 1000 1500 2000 2500 3000 3500 4000 4500 5000 5500 6000
N rate, kg ha-1
Fert
ilize
r re
cove
ry
T222
T505

OSU Soil Fertility Research 1997 Page 219
Figure 6. Effect of N rate on Nitrogen use efficiency (NUE), 1995-96
0
20
40
60
80
100
120
140
0 500 1000 1500 2000 2500 3000 3500 4000 4500 5000 5500 6000
N rate, kg ha-1
NUE,
%
T222
T505
Figure 7. Effect of N rate on nitrogen accumulation efficiency (NAE), 1995-96
0
20
40
60
80
100
120
140
160
0 500 1000 1500 2000 2500 3000 3500 4000 4500 5000 5500 6000
N rate, kg ha-1
NAE,
%
T222
T505

Page 220 1997 OSU Soil Fertility Research
Figure 8. Total inorganic N distribution in soil profile at T222, 1995-96
0
50
100
150
200
250
0 500 1000 1500 2000 2500 3000 3500 4000 4500Total inorganic N (NH4-N +NO3-N), kg ha-1
Dept
h, c
m
0 56112 168224 448896 17923584 5376
Figure 9. Total inorganic N in soil profile at T505, 1995-96
0
50
100
150
200
250
0 200 400 600 800 1000 1200 1400Total inorganic N (NH4-N-NO3-N), kg ha-1
Dept
h, c
m
0 56112 168224 448896 17923584 5376
OSU Soil Fertility Research 1997 Page 221
Effect Of Ratios, Time And Temperature On KCl-Mineralization Potential Index
H. Sembiring, G.V. Johnson, and W.R. Raun
ABSTRACTInorganic nitrogen (N) in soils is the primary component of soil-plant N buffering proposed by Raun and Johnson. This study was conducted to determine if non-exchangeable NH4-N could serve as an index of potentially mineralizable N, an important sink in N buffering. A long-term wheat experiment that received annual fertilizer N at 0, 45, 90 and 135 kg N ha -1
was used. Soils from this field experiment were extracted by three 10 ml portions of 2 M KCl at room temperature followed by extraction with 20 ml of 2 M hot KCl. Hot KCL extraction’s were evaluated using varying soil weights (3, 6, 9 and 12 g), temperature (100 and 110oC) and time (1, 2, 3 and 4 h). Extraction at 100oC for 4 hours using 3 g soil and 20 ml 2 M KCl was the most effective. Hot KCl extractable NH4-N minus room temperature KCl extractable NH4-N was considered non-exchangeable NH4-N. Non-exchangeable NH4-N was correlated with the long-term N rates, and believed to be a reliable estimate of potential mineralizable organic N. The relationship trend was linear for total inorganic N, NH4
+-N and NO3-N; where the lowest N rate had the lowest extractable N. The NH4
+-N concentration ranged from 4.64 to 6.13 mg kg-1; whereas, NO3-N ranged from 0.58 to 0.78 mg kg-1. Total inorganic N extracted was similar to that mineralized in a 42 day aerobic, water saturated, incubation. This method shows promise as a rapid measure of potentially mineralizable N.
INTRODUCTION
ineralization of organic N is important in terms of providing crop requirements for N when fertilizer inputs are inadequate. Organic N is also a primary sink in soil-plant buffering against mineral N accumulation. In
general, there are two methods that can be used to detect mineralization potential. There are chemical indexes and incubation methods (Stanford, 1982). Incubation methods have proved to be reliable but they are time consuming (Campbell et al., 1991). Whereas, chemical methods can be done in a short time and may provide a quick test for assessing N-supplying capacity of the soil (Jalil et al., 1996).
MA method using hot 2 M KCl to extract non-exchangeable NH4-N has been
proposed as a method to predict mineralization (Jalil et al., 1996). In a preliminary study using Oklahoma soils from long-term N fertilization trials, this method showed a high correlation with fertilizer N rate; whereas, extraction using 2 M KCl at room temperature gave inconsistent results, unrelated to fertilization history. Pre-extraction of NH4-N and NO3-N from cation exchange capacity (CEC) and anion exchange capacity (AEC) of soils using 2 M KCl increases the correlation coefficient of these parameters with fertilizer use history. This indicates that this method could be a predictor for mineralizable N. However, since procedural variables commonly affect levels of

Page 222 1997 OSU Soil Fertility Research
extractable NH4 and NO3, the objective of this study was to evaluate the influence of temperature, time and soil:extractant ratios on extractable N.
MATERIALS AND METHODS
The soil used in this study is from a 27 year continuous winter wheat experiment (#222) on a Kirkland silt loam (fine, mixed thermic, Udertic, Paleustoll). The amount of NPK annually applied for each N-treatment plot is 0-29-38, 45-29-38, 90-29-38 and 135-29-38. Bulk samples of moist soil from each treatment were sieved through a 20 mesh screen prior to analyses of selected properties (Table 1).
Prior to hot KCl extraction, soils were extracted by three 10 ml portion of 2 M KCl at room temperature. The soils (3, 6, 9 and 12 g) were then extracted with 20 ml of 2 M KCl for 1, 2, 3 or 4 hours at either 100 or 110oC. The solutions collected prior to hot 2M KCl extraction were analyzed for NH4-N and NO3-N. The objective of pretreatment is to make sure that NH4-N and NO3-N obtained from 2M hot KCl are not from typical exchange reaction. The solution from 2M hot KCl is then also analyzed for NH4-N and NO3-N.
Besides, 100 and 110oC, an attempt was also made to extract the samples at 120oC. However, this temperature was so hot some samples boiled away and reduced the volume of the liquid; therefore, this temperature was not evaluated further.The design used in this experiment was a factorial arrangement of treatments in a randomized complete block design with 3 replications. An automated flow injection analysis system was used for analysis of NH4-N and NO3-N (Lachat, 1990); whereas total inorganic N was obtained by adding NH4-N and NO3-N. Statistical analysis was performed using SAS (SAS Institute, 1988).
RESULTS AND DISCUSSION
Method RefinementThe analysis of variance for room temperature extraction of NH4-N, NO3-N, and
total inorganic N (NH4-N + NO3-N) is reported in Table 2. There was an interaction between soil weight and nitrogen rate for NH4-N, NO3-N, and total inorganic N. Mean values for the interaction between soil weight and nitrogen rate with total inorganic N, NH4-N, and NO3-N are presented in Figures 1, 2 and 3. It was found that the higher the ratio of soil to solution in the extraction, the lower amount of exchangeable N that can be extracted. This indicates that increasing the soil:solution ratio decreases the effectiveness of KCl to extract NH4-N and NO3-N. The highest amount of NH4-N, and NO3-N was extracted using a ratio of 3 g soil to 20 ml KCl (6.7:1 solution:soil ratio).
NH4-N and NO3-N of hot 2M KCl extraction:The AOV for hot KCl extractable NH4-N, NO3-N and total inorganic N is
reported in Table 3. In addition, the graphs of two way interactions between N rate and soil, time, and temperature on NH4-N, NO3-N and total inorganic N are presented in Figures 4, 7 and 10 for NH4-N; Figures 5, 8 and 11 for NO3-N; and Figures 6, 9 and 12 for total inorganic N. In this approach N rate was used as the independent variable to

OSU Soil Fertility Research 1997 Page 223
determine the proportionality of extractable NH4-N, NO3-N, and total inorganic N to fertilizer use history. Fertilizer has been applied for 27 years to this soil; therefore, the hot KCl extractable inorganic nitrogen should be proportional to the rate of fertilizer applied if it is related to mineralizable N potential.
From Figures 4, 5 and 6, it was found that 3 g soil showed the most proportional amount of extractable NH4-N compared to N rate. In general, increasing the soil:solution ratio increased the amount of ammonium that could be extracted. However, since the best separation (r2), among N rates, on hot KCl extractable NH4-N, NO3-N, and total inorganic N was at a soil weight of 3 g, this weight was selected for future extraction (Table 4).
From the analysis of variance in Table 3, there was no interaction between N rate and temperature for extractable NH4-N or total inorganic N but, there was for NO3-N. Figures 7, 8 and 9 show the separation of N rate which was similar for 110 oC and 100oC. Interaction between N rate and time was significant for all variables (Table 3). Figures 10, 11 and 12 illustrate the influence of N rate and extraction time on NH4-N, NO3-N and total inorganic N extracted. From these graphs, the amount of extractable NH4-N, NO3-N and total inorganic N was most proportional to N rate at 3 and 4 hours. This suggested that a 3 hour extraction time was the minimum time to be used.
Comparison effectiveness of the method (variable soil weight, temperature and time) was examined by comparison of r2 for the appropriate relationships (Table 4). It was found that the 3 g, 110oC, 3 hour could be used (Figures 13, 14, and 15), but the 3 g, 100oC, 4 hour provided a better coefficient of determination (r2) (Figures 16, 17, and 18). In addition, the temperature at 100oC is easier to handle because it is at the boiling point of water. On the basis of these studies and for practical reasons, extraction of 3 g soil at 100oC for 4 hour is suggested to determine extractable NH4-N and NO3-N as an index of potential mineralizable N (Table 4).
Extractable N using the selected methodThe AOV of NH4-N and NO3-N and total inorganic N using the selected method
(100oC, 3 g soil and 4 hour) is presented in Table 5. It was found that N rate has a positive linear effect on hot KCl extractable N (NH4-N, NO3-N, and total inorganic N) (Figures 16, 17, and 18). The NH4
+-N concentration ranged from 4.64 to 6.13 mg kg-1; whereas, NO3-N ranged from 0.58 to 0.78 mg kg-1. Total inorganic N extracted was similar to that mineralized in a 42 day aerobic, water saturated, incubation (Sembiring, et. al., 1995). This method shows promise as a rapid measure of potentially mineralizable N.
CONCLUSIONS
Extraction at 100oC for 4 hours using 3 g soil and 20 ml 2 M KCl was the most effective extraction of the combinations tested. Non-exchangeable NH4-N was strongly correlated with the long-term fertilizer N rates, thus relating to mineralizable organic N. The relationship was positive and linear for total inorganic N, NH4
+-N and NO3-N; where the lowest N rate had the lowest extractable N. The NH4
+-N concentration ranged from 4.64 to 6.13 mg kg-1; whereas, NO3-N ranged from 0.58 to 0.78 mg kg-1. Total inorganic N extracted was similar to that mineralized in a 42 day aerobic, water saturated,

Page 224 1997 OSU Soil Fertility Research
incubation. This method shows promise as a rapid measure of potentially mineralizable N. Future research is planned to verify the use of this method using several other long-term N fertility experiments in Oklahoma.
REFERENCESCampbell, C.A., G.P. Lafond, A.J. Leyshon, R.P. Zentner, and H.H. Janzen. 1991. Effect of cropping
practices on the initial potential rate of N mineralization in a thin Black chernozem. Can. J. Soil Sci. 71:43-53.
Lachat Instruments. 1990. Quickem method 12-107-04-1-B. Lachat Instr., Milwaukee.
Jalil, A., C.A. Campbell, J. Scoenau, J.L. Henry, Y.W. Jame and G.P. Lafond. 1996. Assessment of two chemical extraction methods as indices of available nitrogen. Soil Sci. Soc. Am. J. 60:1954-1960.
SAS Institute. 1988. SAS/STAT Procedures. Release 6.03 ed. SAS Inst., Cary, NC.
Sembiring, H., G.V.Johnson and W.R. Raun. 1995. Laboratory evaluation of N immobilization and mineralization as affected by historical fertilizer N use. p.266. In Agronomy abstracts. ASA, Madison, WI.
Stanford, G. 1982. Assessment of soil N availability. In F.J. Stevenson. (ed.) Nitrogen in agricultural soils. Am. Soc. of Agronomy, Madison, WI.

OSU Soil Fertility Research 1997 Page 225
Table 1. Initial surface (0 - 15cm) soil test characteristics of Experiment #222, Stillwater,OK at different N application rates.
Characteristics Methods Unit 0-29-38 45-29-38 90-29-38 135-29-38pH 1:1 soil:H2O 5.76 5.49 5.47 5.38Organic Carbon Dry Combustion g kg-1 6.15 6.16 6.14 6.48Total Nitrogen Dry Combustion g kg-1 0.79 0.75 0.75 0.84NH4-N Lachat mg kg-1 3.62 4.56 9.93 8.16NO3-N Lachat mg kg-1 0.42 0.44 0.85 1.09P Mehlich-3. mg kg-1 81 62 66 56K Mehlich-3. mg kg-1 43 45 32 32
Table 2. Analysis of variance for NH4-N, NO3-N and total inorganic-N (NH4-N +NO3-N) from extractable 2M KCl at room temperature
Source of variation df NH4-N NO3-N NH4-N +NO3-NMean Squares
Rep 2 1.093 0.0021 1.097Nrate 3 403.523*** 6.629*** 458.502***Soil 3 426.350 5.769*** 520.235***Nrate*Soil 9 21.017*** 0.209*** 22.898***Error 414 0.978 0.115 1.019CV, % 19.1 25.3 17.9
Nrate*Soil Means, mg kg-1
N0*3g soil 4.14 0.608 4.746N0*6g soil 3.85 0.312 4.162N0*9g soil 2.91 0.216 3.127N0*12g soil 1.79 0.177 1.967N45*3g soil 5.09 0.605 5.699N45*6g soil 4.98 0.320 5.304N45*9g soil 3.48 0.217 3.698N45*12g soil 1.94 0.164 2.109N90*3g soil 10.03 0.619 10.653N90*6g soil 8.98 0.329 9.314N90*9g soil 5.96 0.227 6.189N90*12g soil 3.54 0.170 3.708N135*3g soil 8.62 1.239 9.865N135*6g soil 8.21 0.935 9.155N135*9g soil 5.76 0.711 6.469N135*12g soil 3.30 0.419 3.717SED 0.27 0.031 0.275
*, **, *** Significant at the 0.05, 0.01, and 0.001 probability levels, respectivelySED = standard error of the difference between two equally replicated means,df = degrees of freedom.

Page 226 1997 OSU Soil Fertility Research
Table 3. Analysis of variance for NH4-N, NO3-N and total inorganic-N (NH4-N +NO3-N) from hot extractable 2M KCl
Source of variation df NH4-N NO3-N NH4-N +NO3-NMean Squares
Rep 2 5.766* 0.008 6.20*Temperature 1 634.502*** 0.735* 678.42***Nrate 3 134.475*** 1.669*** 157.049***Soil 3 206.299*** 2.042*** 173.183***Nrate*soil 9 5.692*** 0.143*** 6.461***Nrate*temp 3 2.853 0.050*** 3.433Soil*temp 3 8.203** 0.009 8.658*Nrate*soil*temperature 9 0.987 0.003 0.971Time 3 327.482*** 0.084*** 323.015***Nrate*time 9 3.522** 0.044*** 4.183**Time*soil 9 13.234*** 0.044*** 12.813***Time*temperature 3 7.479*** 0.229*** 5.537**Nrate*time*soil 27 2.144* 0.012*** 2.353Nrate*time*temperature 9 2.088 0.007 2.239Time*soil*temp 9 2.056 0.026*** 2.264Nrate*time*soil*temperature 27 2.366** 0.009** 2.507**
*, **, *** Significant at the 0.05, 0.01, and 0.001 probability levels, respectively, df = degrees of freedom
Table 4. Correlation coefficients (r2) of hot KCl extractable NH4-N, NO3-N, and total inorganic N at various weight of soil, temperature and time.Variables/date 3 g soil 9 g soil 3 g soil 9 g soil110oC and 3 hour r2 from mean* r2 from mean* r2 r2
NH4-N vs. N rate 0.935 0.856 0.829 0.376NO3-N vs. N rate 0.930 0.778 0.899 0.704NH4-N + NO3-N vs. N rate 0.946 0.878 0.856 0.411
110oC and 4 hourNH4-N vs. N rate 0.986 0.938 0.771 0.783NO3-N vs. N rate 0.962 0.702 0.853 0.670NH4-N +NO3-N vs. N rate 0.987 0.961 0.783 0.824
100oC and 3 hourNH4-N vs. N rate 0.836 0.892 0.129 0.462NO3-N vs. N rate 0.071 0.874 0.023 0.849NH4-N + NO3-N vs. N rate 0.812 0.919 0.126 0.526
100oC and 4 hourNH4-N vs. N rate 0.989 0.819 0.855 0.492NO3-N vs. N rate 0.899 0.725 0.818 0.676NH4-N + NO3-N vs. N rate 0.993 0.807 0.870 0.525
* Correlation determined after summing the three observations (reps) for each treatment.

OSU Soil Fertility Research 1997 Page 227
Table 5. Analysis of variance for NH4-N, NO3-N and total inorganic-N (NH4-N +NO3-N) from extractable 2M KCl using 3 g, 100oC and 4 hour dataSource of variation df NH4-N NO3-N NH4-N +NO3-N
Mean SquaresRep 2 0.0395 0.0145 0.0469Nrate 3 1.3416 0.0239*** 1.6979**Error 6 0.0925 0.0010 0.1040CV, % 5.6 4.8 5.3Linear 1 3.9820** 0.0643*** 5.0586***Quadratic 1 0.0039 0.0071 0.0005
N rate Mean, kg ha-1
0 4.64 0.58 5.2245 5.09 0.60 5.6990 5.76 0.66 6.42135 6.13 0.78 6.91SED 0.25 0.03 0.26
*, **, *** Significant at the 0.05, 0.01, and 0.001 probability levels, respectively. SED = standard error of the difference between two equally replicated means, df = degrees of freedom

Page 228 1997 OSU Soil Fertility Research
Figure 1. Effect of N rate and soil w eight on total inorganic N extracted at room temperature
0
2
4
6
8
10
12
14
3 6 9 12 15
Soil, g
NH4-
N+NO
3-N,
mg
kga-1 0 45
90 135
Figure 2. Effect of N rate and soil w eight on NH4-N extracted at room temperature
0
2
4
6
8
10
12
14
3 6 9 12
Soil, g
NH4-
N, m
g kg
-1
0 4590 135
Figure 3. Effect of N rate and soil w eight on NO3-N extracted at room temperature
0
0.3
0.6
0.9
1.2
1.5
3 6 9 12 15
Soil, g
NO3-
N, m
g kg
-1
0 45
90 135
Figure 4. Effect of N rate and w eight of soil on extractable NH4-N
0
2
4
6
8
10
3 6 9 12 15
Soil, g
NH4-
N, m
g kg
-1
0 45
90 135
Figure 5. Effect of N rate and w eight of soil on extractable NO3-N
0
0.2
0.4
0.6
0.8
1
3 6 9 12 15
Soil, g
NO3-
N, m
g kg
-1
0 4590 135
Figure 6. Effect of N rate and w eight of soil on extractable total inorganic N
0
2
4
6
8
10
12
3 6 9 12
Soil, g
NH4-
N +
NO3-
N, m
g kg
-10 4590 135
Figure 7. Effect of N rate and temperature on extractable NH4-N
0
2
4
6
8
10
90 100 110 120
Temperature, oC
NH4-
N, m
g kg
-1
0 45
90 135
Figure 8. Effect of N rate and temperature on extractable NO3-N
0
0.2
0.4
0.6
0.8
90 100 110 120
Temperature, oC
NO3-
N, m
g kg
-1
0 4590 135
Figure 9. Effect of N rate and temperature on extractable total inorganic N
0
2
4
6
8
10
90 100 110 120
Temperature, oC
NH4-
N+NO
3-N,
mg
kg-1
0 4590 135

OSU Soil Fertility Research 1997 Page 229
Figure 10. Effect of time and N rate on extractable NH4-N
0
2
4
6
8
10
12
1 3 5
Time, h
NH4-
N, m
g kg
-1
0 4590 135
Figure 12. Effect of N rate and time on extractable total inorganic N
0
2
4
6
8
10
12
1 2 3 4 5
Time, h
NH4-
N +
NO3-
N, m
g kg
-1
0 4590 135
Figure 11. Effect of N rate and Time on extractable NO3-N
00.10.20.30.40.50.60.70.8
1 3 5
Time, h
NO3-
N, m
g kg
-1
0 4590 135
Figure 13. Response of hot KCl extractable NH4-N to 27 year N rate at 3g, 110oC and 3 hour
y = 0.019x + 6.0662R2 = 0.9348
5
6
7
8
9
10
0 50 100 150
N rate, kg ha-1
NH4-
N, m
g kg
-1
Figure 14. Response of hot KCl extractable NO3-N to 27 year N rate at 3g, 110oC and 3 hour
y = 0.0022x + 0.693R2 = 0.9296
0.6
0.7
0.8
0.9
1
1.1
0 50 100 150
N rate, kg ha-1
NO3-
N, m
g kg
-1
Figure 15. Response of hot KCl extractable total inorganic N to 27 year N rate at 3 g, 110oC and 3 hour
y = 0.0212x + 6.7603R2 = 0.9464
5
6
7
8
9
10
0 50 100 150
N rate, kg ha-1
NH4-
N +
NO3-
N, m
g kg
-1
Figure 16. Response of hot KCl extractable NH4-N to 27 year N rates using 3g, 100oC and 4 hour
y = 0.0114x + 4.6315R2 = 0.9894
4
4.5
5
5.5
6
6.5
0 45 90 135
N rate, kg ha-1
NH4-
N, m
g kg
-1
Figure 17. Response of hot KCl extractable NO3-N to 27 year N rates using 3g, 100oC and 4 hour
y = 0.0015x + 0.5585R2 = 0.8985
0.4
0.5
0.6
0.7
0.8
0 45 90 135 180
N rate, kg ha-1
NO3-
N, m
g kg
-1
Figure 18. Response of hot KCl extractable total inorganic N to 27 year N rates using 3g, 100oC and 4 hour
y = 0.0129x + 5.19R2 = 0.9931
4
5
6
7
8
0 45 90 135 180
N rate, kg ha-1
NH4-
N+NO
3-N,
mg
kg-1

Page 230 1997 OSU Soil Fertility Research

OSU Soil Fertility Research 1997 Page 231
PRECISION AGRICULTURE Indirect Measures of Plant Nutrients
W.R. Raun, G.V. Johnson, H. Sembiring, E.V. Lukina, J.M. LaRuffa, W.E. Thomason, S.B. Phillips, J.B. Solie, M.L. Stone and R.W. Whitney
ABSTRACTIndirect, non-destructive sensor based methods of plant and soil analyses could replace many of the wet chemistry testing methods that are in place today. Over 140 years have past since Justus von Liebig first employed soil testing in 1850. Today, simultaneous analyses of moisture, organic C and total N in plants and soils using non-destructive near infrared reflectance spectrophotometry is possible. Recent work has targeted indirect measurements of the nutrient status in soils using spectral radiance data collected from growing crop canopies. The use of spectral measurements from plant canopies has been driven in part by newer variable rate technologies which apply nutrients to prescribed areas. More recent work has documented significant soil variability on a 1m2 scale. Because of this, indirect measures are necessary to avoid the cost of chemical analyses (10000 samples required/ha) and to avoid on-the-go chemistry. Also, in order for application technologies to be environmentally sensitive, they must treat the resolution where real differences exist in the field. Present state-of-the-art methods can sense N deficiencies in winter wheat (December - February) on a 1m2 scale and apply variable foliar N on-the-go at 15 kph. These indirect methods rely on indices developed using the sufficiency concept that originally applied only to immobile nutrients. Plant canopy sensing methods allow for sufficiency to be used for both immobile and mobile nutrients since intensity and capacity can be integrated into one component, total nutrient uptake.
INTRODUCTION
ver 140 years have past since Justus von Liebig proposed the law of the minimum. This law implied that the nutrient present in the least relative amount would be the nutrient limiting production. Since Liebig’s time, scientists have
been interested in whether or not elements were essential, the nature of their available forms in soil and the relationships between the amounts of these available forms and plant growth. The development of the science of soil fertility and soil testing has depended heavily on this knowledge. Early work by Bray (1948) outlined the criteria for a successful soil test. Perhaps the most important was that the amounts extracted (chemical soil extraction) need to be correlated with the growth and response of the crop to that nutrient under various conditions. Recent work by Peck and Soltanpour (1990) noted that a sound soil testing program is today’s best and perhaps only way of determining what constitutes adequate, but not excessive, fertilizer use for high and
O

Page 232 1997 OSU Soil Fertility Research
efficient crop production. With the advent of sensor based technologies, our challenge today is to apply the conceptual framework of soil testing and soil extraction to sensor based systems and non-destructive plant analyses.
Bray’s Mobility ConceptBefore discussing the potential applications that sensors could have in ‘soil
testing’ it is important to review one of the more fundamental concepts in soil fertility. The utility of soil testing was greatly enhanced by the work of Bray (1954) who identified two distinct types of soil sorption zones for plants. One is the large volume of soil occupied by the major part of the plant root system (root system sorption zone) from which mobile nutrients are taken up by plants. The other sorption zone is a relatively thin layer of soil adjacent to each root surface (root surface sorption zone) from which immobile nutrients can be removed by the plant (Figure 1). This concept has assisted many researchers in the development of appropriate methods of applying fertilizers depending on whether the nutrient elements are relatively mobile or immobile in soils.
Plants respond to the total amount present of mobile nutrients and to the concentration present of immobile nutrients in soils. Stated this way, yield is directly related (proportional) to the total amount of a mobile nutrient present in the soil. Therefore, nutrient depletion of the root system sorption zone is dependent on the environment, or growing conditions. Ideally, the response of crops to mobile nutrients should be linear because mobile nutrients (like water) are not decreased in availability by reaction with the soil. However, yield response to an immobile nutrient is not related to the total amount present in the soil, but instead is a function of the concentration of available form at, or very near, the root surface. Because of this, depletion of the root surface sorption zone is considered to be independent of environment.
Sensor-Based-AnalysesWhen white light from the sun strikes the surface of soil or plants, it is reflected
in wavelengths that have a characteristic frequency and energy (Figure 2). The visible portion of light can be separated into red, orange, yellow, green, blue and violet. Wavelengths and relative energy levels of gamma rays, x-rays, ultraviolet, infrared, microwave and radio waves are also reported in Figure 2. If for example red light was absorbed by a certain substance, we would actually be seeing green (visible color absorbed compared to the visible color transmitted, Figure 2). If blue light were absorbed we would see yellow. Keeping this in mind, the yellow-green color that we associate with nitrogen deficiencies should be characterized by having more violet light absorbed by the plant material (Figure 2). Or alternatively, the intensity of green in plants should be characterized by the amount of red light absorbed. Phosphorus deficiencies in plants should theoretically result in increased absorbance of green light since increased purple coloring of leaf margins and stems is expected. What is actually being measured in many sensor based systems is spectral radiance, or the radiated energy from plant and soil surfaces.

OSU Soil Fertility Research 1997 Page 233
Early Use of Spectral Data for Non-Destructive Chemical AnalysisThe potential replacement of wet chemical methods with non-destructive spectral
analyses was first seen over 20 years ago. Near infrared (NIR) diffuse reflectance spectrophotometry was first used to measure protein, moisture, fat and oil in agricultural products. Initially, leaf reflectance measurements at 550 (green) and 675 nm (red) were used to estimate the N status of sweet peppers (Thomas and Oerther, 1972). The NIR spectral region has also been used for predicting organic C and total N in soils. Each constituent of an organic compound has unique absorption properties in the NIR wavelengths due to stretching and bending vibrations of molecular bonds between elements (Morra et al., 1991). One band (780-810nm) is particularly sensitive to the presence of amino acids (R-NH2) which are the building blocks of proteins. The presence and/or absence of these amino acids largely determines the N content of the plant. Because of this, many researchers believe that if the plant canopy could be characterized using spectral data, the development of an indirect soil test (or measure of soil nutrient supplying capacity) could be possible.
Plant and Soil Spectral IndicesWork by Becker and Choudhury, (1988) found that the microwave polarization
difference index (MPDI) could be used to detect the water contents of plants while NDVI was sensitive to chlorophyll absorption. Filella et al. (1995) indicated that leaf chlorophyll A content is mainly determined by N availability. They found improved correlation between measured chlorophyll A and leaf reflectance at 550 and 680 nm, compared to NDVI. Gamon et al. (1992) used a physiological reflectance index (PRI) to track diurnal changes in photon efficiency (CO2 uptake/absorbed photosynthetically active radiation = Rref -R531/Rref + R531 where Rref was a reference wavelength and R531 represented spectral radiance at 531 nm). Peñuelas et al. (1993) examined a water band index (WBI) defined as R950/R900 because the reflectance spectrum was associated with a water absorption band. They also evaluated a normalized total pigment to chlorophyll A ratio index (NPCI) defined as (R680-R430)/(R680+R430). They reported that NPCI was highly correlated with chlorophyll content and was a rough estimate of the ratio of total pigments to chlorophyll A, decreasing in healthy plants and rising in stressed or senescing plants.
Indirect measures for soil analysis have been considered by scientists in various disciplines. Ben-Dor and Bannin (1995) reported that simultaneous and rapid, nonrestrictive determination of clay content, organic matter, cation exchange capacity, hygroscopic moisture, and specific surface area was possible using high-resolution diffuse reflectance spectra in the near-infrared region. Using a fixed 1.5 MPa gravimetric moisture content for 30 representative soils in Illinois, Sudduth and Hummel (1993) found good correlation between spectral reflectance (100-scan average of 1600-2620 nm) and soil organic C.
Phosphorus Using FluorescenceStudies by Shchurina (1990) used the XR-23 desktop analyzer (LECO) to
determine phosphorus in soil and plants. X-rays were directed at the surface of the sample, penetrating a depth of <0.5mm and the fluorescence from the sample was subsequently passed through a curved pentaerythritol crystal and the characteristic

Page 234 1997 OSU Soil Fertility Research
fluorescence of phosphorus was read. Fluoresence is essentially the reemission of absorbed light as light energy but of a longer wavelength and of lower energy than what was initially absorbed. The fluorescence spectrum is characteristic of the pigment, therefore it is possible to tell which pigment is fluorescing. Lauer et al. (1989) indicated that low phosphate nutrition results in increased chlorophyll fluorescence, reduced photosynthetic rate, accumulation of starch and sucrose in leaves and low crop yields. They further noted that leaves of plants grown under high P fertility had significantly higher light saturation points (400-700 nm) and higher apparent quantum efficiency. Gamon et al. (1990) indicated that the spectral irradiance changes in the red and near-infrared regions when suddenly illuminated were caused by the quenching of chlorophyll fluorescence. The fluorescence was fully induced within a few seconds of increased illumination, and relaxed over the next several minutes.
Detection of Field Variability, Need for Sensor Based TechnologiesThe variability in bermudagrass forage yield when harvested from 0.30 x 0.30 m
grids (1x1ft), 22 m in length is illustrated in Figure 3. This site and others have shown that large differences exist over very short distances. Forage yield changed by a factor of >4 over 1.2 m at the end of the transect. Similar differences were noted in total soil N and organic C (using dry combustion). This was important to find, considering that the precision of this instrumentation is ±0.001%, and because the change in total N and organic C occurred in the same sampling units as that noted for yield.
Using semivariograms and mean difference analyses generated from sensor data collected every 4 cm, Solie et al. (1996) estimated that the fundamental field element size averaged 1.5 m. The fundamental field element was defined as the area which provides the most precise measure of the available nutrient and where the level of that nutrient changes with distance. Data collected by the sensor based variable rate technology team in Oklahoma continues to show that field element sizes are seldom more than 1m2 (wheat and bermudagrass). If the resolution where ‘real’ soil differences exist is at 1m2, grid soil sampling will never be economical (10000 soil samples / hectare). Also, if variable rate technology is truly going to be environmentally sensitive, it must be implemented at the resolution where real differences are encountered in the field.
Sensor Based or Map Based Technology? Much has been learned over the past 150 years concerning the use of soil testing
and improved use of fertilizers. Today, we are on the verge of using newer non-destructive sensor based technologies which sense nutrient uptake in growing crop canopies. Sensor based systems are now capable of detecting nutrient needs on-the-go and can simultaneously apply prescribed fertilizer rates based on those needs. Spectral radiance measurements for red (660 nm) and near infrared (NIR, 780 nm) wavelengths have been measured in wheat from December to February using photodiode based sensors (Stone et al., 1996, Solie et al., 1996). This work has shown that the plant nitrogen spectral index (PNSI) was highly correlated with wheat forage N uptake at several locations, using a wide range of varieties. PNSI is the inverse of the normalized difference vegetative index (NDVI), commonly used in remote sensing. This is important since several researchers have shown that wheat forage total N uptake during the winter months can be a predictor of topdress N needs (Roth et al., 1989, Vaughan et

OSU Soil Fertility Research 1997 Page 235
al., 1990a). Because N uptake can be predicted indirectly using spectral radiance measurements, sensors can reliably provide measurements equivalent to 'on-the-go' chemical analyses. Using the PNSI index, fertilizer N has been topdressed from January to February using ‘prescribed amounts’ based on the spectral radiance measurements (Stone et al., 1996). Grain yields have increased as a result of applying topdress N and no differences have been found between variable and fixed N topdress rates. Varying N rates based on PNSI resulted in improved N use efficiency when compared to the fixed topdress N rates. In addition to improving site-specific N use efficiency, this technology will likely decrease the risk that over fertilization poses to the environment.
Similar to taking soil samples and generating a fertilizer recommendation based on that data, sensor based systems collect equivalent data; however, they do so on a much finer scale. The sensor-based N fertilizer applicator developed by Stone et al. (1996) collects the equivalent of 10000 samples per hectare and applies a prescribed rate to 10000 independent 1 m2 areas within each hectare.
Sensor based systems collect data (e.g., spectral radiance) on-the-go from the plant canopy or soil. Without having a known reference or fixed position, the sensor data is then used to apply fertilizer or other agricultural chemicals (to the area which was read) at prescribed rates. Present map based systems require the use of global positioning systems or GPS. These systems were first developed for military purposes in order to better locate a specific target or position. Although this satellite based system is still used by the military, it is now available for a wide range of uses. Conventional GPS systems used today have a resolution of ±10m. What this means is that one 100m2 area (10mx10m) could be confused for another neighboring 100m2 area when relying on the information delivered from GPS units. Using differential correction (DGPS), this resolution can be ±1m. Yield monitoring systems are map based and the mapping resolution depends on GPS resolution. However, these map based approaches continue to rely on yield data collected from combines, where it is presently not possible to obtain this information on a 1m2 scale. Most yield monitoring systems have been placed on combines with 5 m wide headers (and wider). Time delays and mixing associated with grain that passes through combines have not been fully accounted for. Without this knowledge, yield mapping resolution is still a long way away from a 1m2 scale. Finally, yield mapping on its own is void of a cause and effect relationship unless the effect of additional variable(s) (soil test, satellite sensing, etc.) are determined separately.
Sensor based variable rate systems avoid traditional costs (such as soil sampling, chemical analysis, data management, and recommendations) and can instantaneously adjust the application rate based on sensor measurements of fertility as the applicator travels across the field. Present sensor based systems operate at a much finer resolution than commercially available GPS units. This is important if we consider the fundamental field element size to be a significant variable as it relates to fertilizer applications and environmental safety.
Fertilizer ResponseVaughan et al. (1990a) found that whole-plant total N at Feekes 5 could be used
for making fertilizer recommendations in winter wheat. Similar work by Roth et al. (1989) found that total N between Feekes 4 and 6 accounted for the most variation in relative yields. This work also noted that N uptake was the weakest predictor of N

Page 236 1997 OSU Soil Fertility Research
deficiency. Considering the field element size where differences are observed (1m2), we feel the poor results with N uptake from Roth et al. (1989) may have been due to sampling error (10 plants selected from outside rows that were separated by distances equal to or greater than 1m, and where the grain yield data was obtained from the center rows, different from that used for total N uptake).
Similar to the work by Vaughan et al. (1990a) and Roth et al. (1989), work at Oklahoma State University has focused on using whole-plant total N in winter wheat at Feekes 5. However, unlike the work reported earlier, we have successfully used total N uptake, largely because both yield and concentration data (combined to determine uptake) were collected from much smaller plots where sensed data (entire canopy), total N uptake and yield were collected from the same areas. If the resolution where real differences exist in fields is at 1m2, then calibration data must be collected on the same scale.
Work in Oklahoma has found significant increases in wheat grain yield from topdress N applied between December and February. Various researchers have found increased fertilizer N use efficiency in winter wheat when N was split applied (Mahler et al., 1994) or topdressed before mid January (Boman et al., 1995). Variable rate technology capitalizes on this work by reducing the total field N rate, while also having the potential to optimize N use efficiency because a much finer resolution is used. Spring applied N can result in increased N use efficiency when compared to fall applied N in winter wheat thus making sensor based variable rate technology increasingly beneficial since spring plant N is used as an indicator variable.
Initial results from sensor-based-variable-rate experiments by Stone et al. (1996) suggest that fertilizer N use efficiency can increase from 50 to 70% using this technology. This is largely because the sensors are capable of detecting large differences within extremely small areas (1m2) in an entire field. Instead of applying a fixed rate of 100 kg N/ha to a 100 ha field, this technology allows us to apply the prescribed amount to 1,000,000 individual 1m2 areas within the 100 ha field at N rates that range from 0-100 kg N/ha.
When fertilizers are applied in excess of that needed for maximum yields, the potential for nitrate leaching and groundwater contamination increases. If the resolution where real differences exist in the field is very fine, as this work has shown, the need for precision agriculture should increase because this defined resolution will be more environmentally sensitive. It is expected that fertilization practices will rapidly become tailored to the environment when using sensor based technology.
Lessons Learned from Soil TestingBefore sensor based systems are adopted, it is critical that soil scientists learn
from the fortunes and failures of this technology. Those involved in the dual development of fertilizer recommendations from soil tests and sensor based systems need to report both what has worked and what has not. Soil testing may well have been more successful had it been allied with industry from the outset. Similar to the applications of Bray’s mobility concept for mobile and immobile nutrients in the soil, sensor based systems will need to consider the mobility of elements in the plant. Because the plant canopy acts as the indicator variable with sensor based systems, correct interpretation of visual symptoms is critical. For example, N deficiencies early in the season will show

OSU Soil Fertility Research 1997 Page 237
yellowing in older leaves while S deficiencies have very similar yellowing in younger leaves. Added characteristics of each technology are reported in Table 1.
It is important to note that there will be many interfering factors affecting fertilizer recommendations when using sensor based systems. While formal field experiments can remove all other factors excluding those being evaluated, the real world poses many additional problems. If a weed is present, and the sensor responds to it, one agronomic decision could be to not fertilizer that area (decreased potential for weed seed). By not fertilizing this area, this agronomic decision will ultimately lead to increased field variability for that fertilizer nutrient. Alternatively, fertilizer could be applied as normal, and a point injector could be used to ‘spot’ treat for weeds as they are detected in the field. Added problems include the presence of clouds, time of day, plant variety, and stage of growth, all of which have yet to be resolved.
CONCLUSIONS
Initial results suggest that total N uptake (whole plant) at Feekes 5 can be used for detecting relative N deficiencies. Relative N deficiencies (% sufficiency) can be translated into projected N deficiencies by multiplying them times yield goal. Initial work indicates total N uptake > 50 kg N ha-1 at Feekes 5 is 100 % sufficient for a winter wheat grain yield goal of 2.6 Mg ha-1. Yield potential appears to be defined at or near Feekes growth stage 5. The specific environmental or nutritional factors that control yield potential have not been defined. When Bray proposed sufficiency for immobile nutrients, environment had to be independent of the index. Irrespective of environmental conditions beyond Feekes 5, relative grain yields should be maximized when total N uptake equals or exceeds 100 % sufficiency. This statement implies that environment will be independent of relative maximum grain yields, which is not the norm for mobile nutrients. If the biomass and concentration of a plant were known, we believe that this information would integrate root system and root surface sorption zones. The plant integrates the availability of mobile N from the entire reservoir (e.g., NO3-N) and immobile N which is taken up via contact exchange at the root surface (e.g., NH4-N, mineralized organic N). The use of sensors on the entire plant canopy provides relative integration of both the root system sorption zone and root surface sorption zone. Supply of NH4-N could be that held on the exchange complex or that mineralized from organic pools. Combining biomass or percent coverage at Feekes 5 and N concentration, we end up with a parameter (total N uptake) that should work much like a sufficiency index. This is somewhat in opposition to Bray’s mobility concept which suggested that sufficiency could only be applied to immobile nutrients.
Finally, sensor estimates of biomass and concentration integrate the availability of both mobile NO3-N and immobile NH4-N. Vaughan et al. (1990b) suggested the need for including both soil NO3-N and NH4-N instead of NO3-N alone to measure available soil N to plants in the spring. Most commercial and state soil testing labs continue to focus only on NO3-N. Sensing the entire plant canopy for biomass and concentration is thought to be somewhat similar to a soil test that includes both mobile and immobile forms of N.

Page 238 1997 OSU Soil Fertility Research
REFERENCESBecker, Francois and Bhaskar J. Choudhury. 1988. Relative sensitivity of normalized vegetation index
(NDVI) and microwave polarization difference index (MPDI) for vegetation and desertification monitoring. Remote Sens. Environ. 24:297-311.
Ben-Dor, E., and A. Banin. 1995. Near-infrared analysis as a rapid method to simultaneously evaluate several soil properties. Soil Sci. Soc. Am. Proc. 59:364-372.
Boman, R.K., R.L. Westerman, W.R. Raun, and M.E. Jojola. 1995. Time of nitrogen application: effects on winter wheat and residual soil nitrate. Soil Sci. Soc. Am. J. 59:1364-1369.
Bray, Roger H. 1948. Requirements for successful soil tests. Soil Sci. 66:83-89.
Bray, Roger H. 1954. A nutrient mobility concept of soil-plant relationships. Soil Sci. 104:9-22.
Filella, I., L. Serrano, J. Serra and J. Peñuelas. 1995. Evaluating wheat nitrogen status with canopy reflectance indices and discriminant analysis. Crop Sci. 35:1400-1405.
Gamon, J.A., C.B. Field, W. Bilger, O.Bjorkman, A.L. Fredeen, and J. Peñuelas. 1990. Remote sensing of the xanthophyll cycle and chlorophyll fluorescence in sunflower leaves and canopies. Oecologia 85:1-7.
Gamon, J.A., J. Peñuelas, and C.B. Field. 1992. A narrow-waveband spectral index that tracks diurnal changes in photosynthetic efficiency. Remote Sens. Environ. 41:35-44.
Lauer, Michael J., Stephen G. Pallardy, Dale G. Blevins and Douglas D. Randall. 1989. Whole leaf carbon exchange characteristics of phosphate deficient soybeans (Glycine max L.). Plant Physiol. 91:848-854.
Mahler, R.L., F.E. Koehler and L.K. Lutcher. 1994. Nitrogen source, timing of application, and placement: effects on winter wheat production. Agron. J. 86:637-642.
Morra, M.J., M.H. Hall, and L.L. Freeborn. 1991. Carbon and nitrogen analysis of soil fractions using near-infrared reflectance spectroscopy. Soil Sci. Soc. Am. J. 55:288-291.
Peck, T.R., and P.N. Soltanpour. 1990. The principles of soil testing. p. 1-9. In R.L. Westerman (ed.) Soil testing and plant analysis. 3rd ed. SSSA Book Ser. 3. SSSA, Madison, WI.
Peñuelas, Josep, John A. Gamon, Kevin L. Griffin and Christopher B. Field. 1993. Assessing community type, plant biomass, pigment composition, and photosynthetic efficiency of aquatic vegetation from spectral reflectance. Remote Sens. Environ. 46:110-118.
Roth, G.W., R.H. Fox and H.G. Marshall. 1989. Plant tissue tests for predicting nitrogen fertilizer requirements of winter wheat. Agron. J. 81:502-507.
Shchurina, G.N. 1990. Determination of phosphorus in soils and plants with the XR-23 X-ray fluorescence analyzer. Scripta Technica. 22(6):119-121.
Solie, J.B., W.R. Raun, R.W. Whitney, M.L. Stone and J.D. Ringer. 1996. Optical sensor based field element size and sensing strategy for nitrogen application. Trans. of the ASAE 39(6):1983-1992.
Stone, M.L., J.B. Solie, W.R. Raun, R.W. Whitney, S.L. Taylor and J.D. Ringer. 1996. Use of spectral radiance for correcting in-season fertilizer nitrogen deficiencies in winter wheat. Trans. of the ASAE 39(5):1623-1631.
Sudduth, K.A., and J.W. Hummel. 1993. Soil organic matter, CEC and moisture sensing with a portable NIR spectrophotometer. Trans. of the ASAE. 36(6):1571-1582.
Thomas, J.R., and G.F. Oerther. 1972. Estimating nitrogen content of sweet pepper leaves by reflectance measurements. Agron. J. 64:11-13.

OSU Soil Fertility Research 1997 Page 239
Vaughan, B., K.A. Barbarick, D.G. Westfall and P.L. Chapman. 1990a. Tissue nitrogen levels for dryland hard red winter wheat. Agron. J. 82:561-565.
Vaughan, B., D.G. Westfall, K.A. Barbarick, and P.L. Chapman. 1990b. Spring nitrogen fertilizer recommendation models for dryland hard red winter wheat. Agron. J. 82:565-571.
Table 1. Differences between soil testing and sensor based systems for developing nutrient recommendations.________________________________________________________________________
Soil Testing Sensor Based Analyses ______________________________________________________________________________Detection Plant available Plant statusSample collection >20 hectares 1m2
Sampling soil, destructive plant, non-destructiveMethod Extraction & chemical Spectral radiance,
analyses wavelength specificAnalytical parameter Nutrient element Spectral radianceInterpretation Calibration with yield Calibration with yieldFertilizer Recommendation Procedure specific Wavelength specific
Interfering Factors Affecting Fertilizer RecommendationNumber of samples (reliability)Subsoil N availability -- Weeds- Clouds- Time of day (sun angle)- Variety- Stage of growth (% cover)- Living vs. dead plant tissueField element size Field element sizeCalibration curve Calibration curve
______________________________________________________________________________

Page 240 1997 OSU Soil Fertility Research
Figure 1. Root system and root sorption zones as related to mobile and immobile nutrients and the use of soil and sensor tests.
Figure 2. Characteristics of visible and non-visible portions of the spectra.
Root System Sorption ZoneRoot System Sorption Zone Root Surface Sorption ZoneRoot Surface Sorption Zone
•• Response does not depend on reservoir Response does not depend on reservoir•• Independent of environment Independent of environment
•• Response depends on reservoirResponse depends on reservoir•• Dependent on environment Dependent on environment
••Depends on Growth StageDepends on Growth Stage ••IndicatorsIndicators
••BiomassBiomass••ColorColor••ConcentrationConcentration
••Independent of Growth StageIndependent of Growth Stage
••IndicatorsIndicators••BiomassBiomass••ColorColor
NONO33-- HH22POPO44
--
Bray’s Mobility ConceptBray’s Mobility Concept
HPOHPO44==
Soil TestSoil Test
Mobile NutrientsMobile Nutrients Immobile NutrientsImmobile Nutrients
SensorSensor
VISIBLE Color Absorbed
VISIBLE Color Transmitted
VioletViolet BlueBlue GreenGreen YellowYellow Orange Orange RedRed
Short wavelengthShort wavelengthHigh frequencyHigh frequencyHigh energyHigh energy
Long wavelengthLong wavelengthLow frequencyLow frequencyLow energyLow energy
0.01 10 380 0.01 10 380 450 495 570 590 620 450 495 570 590 620 750 1x10750 1x10⁶ 6 1x101x101111
wavelength, wavelength, nm nm
Gam
ma
Ray
sG
amm
a R
ays
X-R
ays
X-R
ays
Ultr
avio
let
Ultr
avio
let
Infr
ared
Infr
ared
Mic
row
aves
and
sho
rt ra
dio
Mic
row
aves
and
sho
rt ra
dio
Rad
io, F
M, T
VR
adio
, FM
, TV
ElectronicElectronic VibrationalVibrational Rotational Rotationaltransitionstransitions transitions transitionstransitions transitions
Yellow-greenYellow-green YellowYellow VioletViolet BlueBlue Green-blueGreen-blue Blue-greenBlue-green

OSU Soil Fertility Research 1997 Page 241
Figure 3. Variability in bermudagrass forage yield, total soil N and organic C sampled in 0.30x0.30m grids.
Forage YieldForage Yieldkg/hakg/ha
Soil total NSoil total Ng/kgg/kg
500500100010001500150020002000250025003000300035003500
0.0550.0550.0650.065
0.0750.075
0.0850.0850.0950.095
0.60.60.70.70.80.80.90.9
111.11.11.21.2
2 4 6 8 10 12 14 16 18 20 22 24 26
Distance, m
Soil organic CSoil organic Cg/kgg/kg

Page 242 1997 OSU Soil Fertility Research
Micro-Variability in Soil Test, Plant Nutrient, and Yield Parameters in Bermudagrass
W.R. Raun, J.B. Solie, G.V. Johnson, M.L. Stone, R.W. Whitney, H.L. Lees, H. Sembiring, D.A. Keahey and S.B. Phillips
ABSTRACTThe scale or resolution where distinct differences in soil test and yield parameters can be detected has not been thoroughly evaluated in crop production systems. This study was conducted to determine if large differences in soil test and forage yield parameters were present within small areas (<1m2). A 2.13 x 21.33 m area was selected for intensive forage and soil sampling from two bermudagrass pasture sites (Burneyville and Efaw, OK). Each 2.13 x 21.33 m area was partitioned into 490, 0.30 x 0.30 m (1’x1’) subplots. Bermudagrass forage was hand harvested at ground level from each 0.30 x 0.30 m subplot. Prior to forage harvest, spectral radiance readings (red, 671 ± 6 nm; green, 550 ± 6 nm; and near infrared, 780 ± 6 nm) were recorded from each subplot. Composite samples composed of eight soil cores, 0-15 cm deep, 1.9 cm in diameter were collected from each subplot. At both locations bermudagrass forage yield harvested from 0.30 x 0.30 m subplots ranged from less than 1300 kg ha-1 to greater than 10000 kg ha-1. Soil pH ranged from 4.37 to 6.29 within the 2.12 x 21.33 m area at Burneyville and 5.37 to 6.34 at Efaw. No P or K fertilizer would have been recommended at Efaw using mean soil test P and K. The range in recommended fertilizer rates would have been 0-31 and 0-17 kg P ha-1 and 0-107 and 0-108 kg K ha-1 at Burneyville and Efaw, respectively, if recommendations were based on individual 0.30 x 0.30 m grid data. Significant differences in surface soil test analyses were found when samples were less than 1 m apart for both mobile and immobile nutrients.
INTRODUCTION
recision farming has become an integral part of modern day agriculture that has and will impact growers, fertilizer dealers, equipment industries and environmental groups. Recent work in precision agriculture has used yield maps
as keys to identifying spatial variability in crop production systems without questioning the resolution at which yield maps are generated. Present day yield maps that use global positioning systems (GPS) have been generated at a resolution of approximately 10x10m. Some differentially corrected GPS systems work at a 1m2 resolution. However, GPS resolution has not been driven by what was agronomically needed but by what was technologically possible.
P
Solie et al. (1996) noted that the fundamental field element is that area which provides the most precise measure of the available nutrient where the level of that nutrient changes with distance. They further indicated that variable rate technology which treats field elements greater than 1.96 m2 will likely not optimize fertilizer N

OSU Soil Fertility Research 1997 Page 243
inputs while having the potential for misapplying fertilizers as a result of using too coarse a grid.
The ideal field element size in precision agriculture production systems should theoretically be concerned with or able to identity:
1. the smallest resolution where cause and effect relationships can be identified2. the precise resolution where variances between paired samples of the same
size (area) become unrelated (use of semivariograms) and where heterogeneity can be recognized
3. the resolution where misapplication could pose a risk to the environment4. the treated resolution where net economic return is achieved (inputs exclude
the cost of technology)5. the resolution where differences in yield potential may exist
Yost et al. (1982) collected surface (0-15 cm) soil samples from the Island of Hawaii at 1-2 km intervals along 21 transects. This data was then used to develop a soil P sorption map using an optimal geostatistical technique called kriging. Their work noted that the kriged points corresponded with known soil P behavior and that kriging provided estimates of the reliability of the resulting map. Cahn et al. (1994) studied much smaller scale spatial variation in soil test parameters. This work indicated that reducing sampling intervals from 50 to 1 m reduced the variance of measured soil water content, soil organic carbon, NO3-N, PO4-P and K by more than 25%. Paz et al. (1996) noted that error due to spatial dependence could be reduced by taking soil samples 20-25 m apart. Alternatively, Guertal (1994) found soil sampling on 5-m intervals to be too coarse to calculate fundamental field element size. In general, grid soil sampling has not been attempted for areas < 1 m2, possibly failing to identify micro-soil variability.
West et al. (1989) found wide variations over short distances (30 m) in soil organic C (16.2 to 34.8 g kg-1) and total N (1.94 to 4.64 g kg-1) in surface horizons (0-7.5 cm) in their studies with grazed pastures. Their work, which focused on animal deposition concentrates near watering areas, noted that differences in soil organic C in the sampled pastures tended to be more associated with native soil variations and unrelated with distance from the water source as was observed for extractable soil P and K. Recent work by Borges and Mallarino (1997) found that variability tended to be lower for soil test P when compared to other variables including dry weight, K and P uptake.
Peck and Soltanpour (1990) noted that present soil sampling procedures need to be reexamined. They also indicated that variability in the fertility patterns within a given field will continue to grow and that the problem of assessing the true or average fertility level for a given field will become more difficult. Reuss et al. (1977) suggested that the large number of cores required to obtain a narrow confidence limit may be more important than the percentage of the area that is improperly fertilized due to spatial variability.
Our objective was to determine if variability in soil test and forage yield parameters was present for areas < 1 m2 in two bermudagrass pastures.

Page 244 1997 OSU Soil Fertility Research
MATERIALS AND METHODS
Two established bermudagrass pastures were used for this study. The experimental sites were near Stillwater (Efaw Experiment Station), and Burneyville, OK. The soil at Stillwater was a Norge loam (fine-silty, mixed, thermic Udic Paleustoll) and at Burneyville, a Minco fine sandy loam (coarse-silty, mixed, thermic Udic Haplustoll). Established stands of 'Greenfield' and 'Midland' bermudagrass varieties were used at Efaw and Burneyville, respectively where no fertilizers had been applied for the past five years. At each location, a visually homogenous 2.13 x 21.33 (7’ x 70’) area was selected for intensive forage and soil sampling. Each 2.13 x 21.33 m area was partitioned into 490 subplots that were 0.30 x 0.30 m (1’x1’). Bermudagrass was harvested on July 17, 1996 at Efaw and August 8, 1996, at Burneyville. At both sites, bermudagrass harvest took place at booting stages 21-29 as morphologically defined by West (1990). Bermudagrass forage was hand harvested at ground level from each 0.30 x 0.30m subplot, and wet weights were recorded prior to drying at 70 °C in a forced air oven. Bermudagrass forage samples were ground to pass a 120 mesh sieve (<.125 mm) and analyzed for total N using a Carlo-Erba (Milan, Italy) NA-1500 dry combustion analyzer (Schepers et al., 1989). Total N uptake from forage samples was determined by multiplying dry matter yield by the total N concentration determined from dry combustion.
Following the collection of bermudagrass forage, soil samples (0-15 cm deep) were taken from each 0.30 x 0.30 m subplot (8 cores/subplot). Soil samples were air dried at ambient temperature and ground to pass a 200-mesh sieve (<.075 mm) and analyzed for total N and organic C (Schepers et al., 1989). Duplicate soil samples were also extracted using 2M KCl (Bremner, 1965) and analyzed for NH4-N and NO3-N using an automated flow injection analysis system. Soil pH was determined using a glass electrode and a soil/water ratio of 1:1. Extractable P and K were determined using the Mehlich III procedure (Mehlich, 1984). Nitrogen fertilizer rates were determined by subtracting the combined surface NH4-N + NO3-N in mg kg-1 from the N requirement determined using a 6720 kg ha-1 yield goal (3 tons/acre). This translates into 58 kg N ha-1
Mg-1 (50 lb N acre-1 ton-1). Phosphorus and potassium fertilizer rates were determined as;kg P ha-1 = -1.117*(Mehlich III P in mg kg-1) + 34.12kg K ha-1 = -0.981*(Mehlich III K in mg kg-1) + 119.46
The fertilizer recommendation equations reported above were derived from soil test calibration tables reported by Johnson et al. (1997).
Prior to forage harvest, spectral radiance readings were obtained from each 0.30 x 0.30 m subplot using an integrated sensor and signal processing system. The integrated sensor had already been modified for use on a variable N rate applicator (Stone et al., 1996). Photodiode detectors and interference filters for red (671 ± 6 nm), green (550 ± 6 nm) and NIR (780 ± 6 nm) spectral bands with a 0.30 m wide by 0.08 m spatial resolution, were used. An uncalibrated normalized-difference-vegetation-index (NDVI) was used as reported by Perry and Lautenschlager (1984), Duncan et al. (1993) and Stone et al. (1996), where NDVI = (NIR-red)/(NIR+red). A total of seven sensor readings were recorded from each 0.30 x 0.30 m subplot and average values for red, green, NIR and NDVI were determined.
Geostatistical treatment of the data is reported and discussed in a separate manuscript.

OSU Soil Fertility Research 1997 Page 245
RESULTS
Precision of Soil Test ProceduresFor each chemical procedure, one soil sample was randomly chosen from the
population of 490 samples at Efaw and analyzed ten different times to assess procedural precision (Table 1). Documentation of procedural precision (analytical error) was considered important prior to making any inferences concerning spatial variability. Coefficients of variation for all chemical procedures were less than 6%, demonstrating the high procedural and analytical precision of the procedures employed (Table 1). These results, by procedure, were all within published limits for relative percent error (Horwitz, 1982, Greenberg et al., 1992).
Soil Sampling ErrorOnce procedural precision was established it was then necessary to document
sampling error prior to observing differences across the entire area. To do this, 20 of the 490, 0.30 x 0.30 m subplots were selected at random from the 2.13 x 21.33 m area that had already been sampled (A) and they were soil sampled again using the same procedures, eight cores/subplot, 0-15 cm (B), discussed in materials and methods. These samples were used to assess the error in soil sampling 0.30 x 0.30 subplots. Variances about the means for A and B soil sample groups when analyzed for pH, organic C, P and K were found to be equal. Although taking eight cores in 0.30 x 0.30 m plots was expected to be destructive, means for soil pH, organic C, P and K from the first (A) and second sample (B) taken from the same area were also not different using a paired T-test on the computed differences (A-B) as reported in Table 2 (Prob |T|, SAS, 1988). The sampling error was small when analyzing the reproducibility (A versus B, Table 2). As per Steel and Torrie (1980), coefficients of variation (CV) were determined that provided a relative measure of variation from individual samples taken from the same 0.30 x 0.30 m area. CV's did not exceed 3.6% for soil pH, and averaged 0.8%. Similarly, CV's were small for soil organic C and K averaging less than 5.7%. Unlike observations for pH, organic C, and K, soil P was found to vary considerably (Table 2). Even though eight cores per 0.30 x 0.30 m was expected to provide an accurate estimate of soil test P in this small of an area, there was apparently more variability within plots than previously thought. Work by Follett and Peterson (1988) demonstrated significant differences in soil test P when sampled at depths of 0-5, 5-10 and 10-20 cm. Although sampling here was targeted for 0-15 cm, some error may have been encountered by depth since several different people were needed to collect the 490 forage and 490 soil samples at each site.
Linear Transect VariabilityOne transect (70 consecutively sampled 0.30 x 0.30 m subplots, 21.33 m in
length) was randomly selected at each site to demonstrate the linear variability in selected soil test parameters and resultant N and P recommendations (Figures 1 and 2). Soil samples from each of these transects (70 samples/transect) were analyzed for organic C, total N, Mehlich III P and K, NO3-N and NH4-N and then the same analysis repeated one week later. Although not reported in this section, soil pH and K provided similar results. The mean was calculated and error bars were plotted that represented one standard deviation from this duplicate analyses (Figures 1 and 2). By-plot error bars that are not visible were small and underlie the individual symbol on each graph.

Page 246 1997 OSU Soil Fertility Research
The combined processing and analytical precision was excellent since few error bars overlapped when organic C in neighboring samples differed by at least two g kg-1
(Figures 1 and 2 ). Similar to observations for organic C, duplicate Mehlich III P-analyses varied considerably over the Efaw and Burneyville transect data (Figures 1 and 2). At both sites, concentration differences in excess of 20 mg kg-1 were observed over distances less than 1.5 m. At Burneyville, no P fertilizer would have been recommended 1 m away from a cluster of samples which would have required 25 kg P ha-1. Similar differences were noted at Efaw over very short distances, although mean soil test P levels were much higher.
Reproducibility of NH4-N+NO3-N soil test data was good as indicated by the minimal amount of variability in all error bars from duplicate analyses over transect data at Burneyville and Efaw. Fertilizer N rates would have been reduced by as little as 10 kg N ha-1 to as much as 50 kg N ha-1 over very short distances (for every 1 mg kg-1 NO3-N or NH4-N, fertilizer N can be reduced 2.24 kg ha-1). However, it should be noted that the variability in NH4-N+NO3-N was small compared to P, a result of moderate yields and no N fertilizer input over the past five years which depleted much of the mineral N in the surface horizon.
Variability in Soil Test Analyses and Spectral RadianceSoil pH within the 2.13 x 21.33 m area sampled ranged from 4.37 to 6.29 at
Burneyville and 5.37 to 6.34 at Efaw (Table 3). It was somewhat surprising to find these large differences in soil pH (Burneyville 1.92, Efaw 0.97) within the 45 m2 areas sampled. Although the mean soil pH was near 5.50 at both sites, several values were below 4.5 at Burneyville. At pH below 4.5, Al and/or Mn in soil solution can increase to toxic levels, thus lime would be required in these areas to alleviate the toxicity.
Low soil test NH4-N + NO3-N values were expected since no fertilizers have been applied at either site for the past five years. However, with a relatively low yield goal of 6720 kg ha-1 (3 tons/acre), N fertilizer rates would have ranged from 109 to 166 and 124 to 156 kg N ha-1 at Burneyville and Efaw, respectively after subtracting soil NH4-N +NO3-N from the 168 kg N ha-1 base recommendation.
Mean soil test P and K values were more than 80% sufficient for bermudagrass production (18.4 mg P kg-1 and 130 mg K kg-1) as reported by Johnson et al. (1997). Projected response from an application of P and K would be small at these soil test levels (Johnson et al., 1997). At Burneyville, mean P and K soil test levels would have resulted in recommending 11 kg P ha-1 and no fertilizer K for bermudagrass production. No P or K fertilizer would have been recommended at Efaw using mean soil test P and K. However, fertilizer rates would have reached 32 and 15 kg P ha-1 and 133 and 136 kg K ha-1 at Burneyville and Efaw, respectively, when observing minimum values from 0.30 x 0.30 m grid data (Table 3).
Total soil N and organic C were also variable at each site, however, a much wider range was found at Burneyville (Table 3). This was also found in calculated C:N ratios. Spectral radiance measurements for NIR, Red, Green and calculated NDVI paralleled soil test findings, with recorded ranges wider at Burneyville than Efaw (Table 3). Similar to spectral radiance data, the range in forage moisture was much wider at Burneyville compared to Efaw. Because a wide range in forage moisture was found, variability in NIR was also expected since NIR diffuse reflectance spectrophotometry has

OSU Soil Fertility Research 1997 Page 247
been used to predict moisture content in forages (Windham et al., 1987). Similar studies have found good correlation between NIR and soil moisture (Dalal and Henry, 1986).
Variability in Bermudagrass Forage YieldAt both locations bermudagrass forage yield harvested from 0.30 x 0.30m
subplots ranged from less than 1300 kg ha-1 to greater than 10000 kg ha-1 (Table 3). Finding a 44 and 19 fold difference in yield at Burneyville and Efaw, respectively, within a 45 m2 area was notable considering that the precision error in estimating yield (precision of scale for wet and dry weights, and harvest area error) was estimated at ± 480 kg ha-1. Similarly, 76 and 15 fold differences in bermudagrass forage N uptake were observed where precision error was ± 10 kg N ha-1 (Table 3, Burneyville and Efaw, respectively).
Correlation of Yield, Soil Test and Spectral Radiance MeasurementsCorrelation of bermudagrass yield and N uptake, soil test and spectral properties
was performed. NDVI was highly correlated with bermudagrass forage yield and N uptake at Burneyville while providing inconsistent results at Efaw. At Efaw, an older bermudagrass stand contributed to significant amounts of dead biomass (non-green) at harvest and this likely influenced red spectral radiance readings which would be more indicative of the presence and/or absence of green and intensity of green. This was confirmed in the narrow range of red spectral radiance readings recorded for Efaw when compared to Burneyville (Table 3).
Using the entire population of data, soil test results were not correlated with bermudagrass yield or N uptake at either location. This is because N was limiting yield at both sites since no N fertilizer had been applied for over five years. Soil test NH4-N+NO3-N determined following harvest was not expected to be correlated with yield either, since soil test levels were low at both sites. The relationship between soil test P or K and dry matter yield would not be identifiable when N or another variable was limiting. It is only when all other variables are non-limiting that a significant relationship between a specific soil test procedure and yield can be established.
DiscussionThe 2.13 x 21.33 m areas that were sampled on a 0.30 x 0.30 m grid in this work
were used to document the resolution where real differences in both soil test and yield parameters could be detected. These areas were not intended to be ‘representative’ of the entire range in variability found in each field, but rather representative of the fixed area or resolution where variability could be expected. Chancelor and Gornonea (1994) indicated there is evidence of considerable potential for using submeter sampling and response intervals. Similarly, Solie et al. (1996) noted that "variable rate technology which treats field elements greater than 1.96m2 will likely not optimize fertilizer N inputs while having the potential for misapplying fertilizers as a result of too coarse a grid." In this regard, this work reports significant differences in soil test analyses at resolutions less than 1 m2 reported by others for both mobile and immobile nutrients (NO3-N and P). This kind of micro-variability in all soil test parameters measured indicates that grid soil sampling would be necessary but unlikely to be economical (with a field element size of

Page 248 1997 OSU Soil Fertility Research
1m2 this would require 10000 soil samples/hectare). Considering the large differences in soil test data, it was also not surprising to find large differences in forage yield.
Some consideration should be given as to why we found such large variability in such a small area. The random influence of cattle dung patches and the lasting effects of white clover (Trifolium repens L.) within dung patch areas has been documented by Weeda (1967). Castle and MacDaid (1972) reported that the average area of rejected herbage around cattle dung patches was 0.078 m2, one year after being deposited. Because of this, soil heterogeneity would only be detected if the sampling resolution were small enough to detect the micro-area of influence. This should also be the resolution where potential differences in soil test parameters are found.
It could be argued that significant differences in soil test parameters could be detected at the centimeter level (horizontally) as has been demonstrated vertically by Follett and Peterson (1988). Although this has not been researched, we believe that horizontal differences, by cm, may well exist in soils. However, from a crop production point of view, the rooting volume that is explored by individual plants, and that will vary by crop, will ultimately dictate the applicator resolution since the plant can integrate that variability into one unit or one mean value. In this regard, it is unlikely that horizontal plant root influence will be less than 0.30 x 0.30 m.
The random influence of wind deposits, alluvial wash, animal deposition, and animal death and decay, would be expected to increase soil variability. Outlying soil test observations, especially in non-cultivated pastures where mixing has not taken place, may be explained in part by sampling areas where animals died and decayed or where animal deposits influenced the plant species which grew in the area.
In theory, environmental stewardship should employ management practices that conform to the resolution where detectable differences in soil test parameters are observed in the field. The presence of significant differences in surface soil test analyses in this work, when samples were less than 1 m apart for both mobile and immobile nutrients, supports the existence of submeter variability.
REFERENCESBorges, R., and A.P. Mallarino. 1997. Field-scale variability of phosphorus and potassium uptake by no-till
corn and soybean. Soil Sci. Soc. Am. J. 61:846-853.
Bremner, J.M. 1965. Inorganic forms of nitrogen. In C.A. Black et al. (ed.) Methods of soil analysis, Part 2. Agronomy 9:1179-1237. Am. Soc. of Agron., Madison WI.
Cahn, M.D., J.W. Hummel and B.H. Brouer. 1994. Spatial analysis of soil fertility for site-specific crop management. Soil Sci. Soc. Am. J. 58:1240-1248.
Carlo Erba Instruments. 1990. Nitrogen analyzer 1500 series 2 instruction manual. Milan, Italy.
Castle, M.E., and Elizabeth MacDaid. 1972. The decomposition of cattle dung and its effect on pasture. J. Br. Grassld Soc. 27:133-137.
Chancellor, W.J., and M.A. Goronea. 1994. Effects of spatial variability of nitrogen, moisture, and weeds on the advantages of site-specific applications for wheat. Trans. ASAE. 37:717-724.
Dalal, R.C., and R.J. Henry. 1986. Simultaneous determination of moisture, organic carbon and total nitrogen by near infrared reflectance spectrophotometry. Soil Sci. Soc. Am. J. 50:120-123.

OSU Soil Fertility Research 1997 Page 249
Duncan, J., D. Stow, J. Franklin, and A. Hope. 1993. Assessing the relationship between spectral vegetation indices and shrub cover in the Jornada Basin, New Mexico. Int. J. Remote Sensing. 14:3395-3416.
Follett, R.F., and G.A. Peterson. 1988. Surface soil nutrient distribution as affected by wheat-fallow tillage system. Soil Sci. Soc. Am. J. 52:141-147.
Greenberg, Arnold E., Lenore S. Clesceri, and Andrew D. Eaton. 1992. Standard methods for the examination of water and wastewater. Am. Public Health Assoc. Washington DC.
Guertal, E.A. 1994. Geostatistical analysis of forms of soil nitrogen in a continuously cropped wheat field. Unpublished Ph.D. dissertation. Oklahoma State University, Stillwater, OK.
Horwitz, W. 1982. Evaluation of analytical methods used for regulation of foods and drugs. Anal. Chem. 54:67A-76A.
Johnson, G.V., W.R. Raun, H. Zhang, and J.A. Hattey. 1997. Oklahoma soil fertility handbook. Okla. Agric. Exp. Sta. Stillwater, OK.
Mehlich, A. 1984. Mehlich No. 3 extractant: A modification of Mehlich No. 2 extractant. Commun. Soil Sci. and Plant Anal. 15:1409-1416.
Paz, A., M.T. Taboada, and M.J. Gomez. 1996. Spatial variability in topsoil micronutrient contents in a one-hectare cropland plot. Commun. Soil Sci. Plant Anal. 27:479-503.
Peck, T.R., and P.N. Soltanpour. 1990. The principles of soil testing. p. 1-9. In R.L. Westerman (ed.) Soil testing and plant analysis. 3rd ed. SSSA Book Ser. 3. SSSA, Madison, WI.
Perry, Charles R., Jr., and Lyle F. Lautenschlager. 1984. Functional equivalence of spectral vegetation indices. Remote Sensing of Environ. 14:169-182.
Reuss, J.O., P.N. Soltanpour, and A.E. Ludwick. 1977. Sampling distribution of nitrates in irrigated fields. Agron. J. 69:588-592.
SAS. 1988. SAS/STAT User's Guide, Release 6.03 Edition. SAS Institute Inc. Cary, NC.
Schepers, J.S., D.D. Francis, and M.T. Thompson, 1989. Simultaneous determination of total C, total N, and 15N on soil and plant material. Commun. Soil Sci. Plant Anal. 20:949-959.
Solie, J.B., W.R. Raun, R.W. Whitney, M.L. Stone, and J.D. Ringer. 1996. Optical sensor based field element size and sensing strategy for nitrogen application. Trans. ASAE 39:1983-1992.
Steel, Robert G., and James H. Torrie. 1980. Principles and procedures of statistics, a biometrical approach. 2nd ed. McGraw-Hill Book Co., New York, NY.
Stone, M.L., J.B. Solie, W.R. Raun, R.W. Whitney, S.L. Taylor, and J.D. Ringer. 1996. Use of spectral radiance for correcting in-season fertilizer nitrogen deficiencies in winter wheat. Trans. ASAE 39:1623-1631.
Weeda, W.C. 1967. The effect of cattle dung patches on pasture growth, botanical composition, and pasture utilisation. N.Z. J. Agric. Res. 10:150-159.
West, C.P., A.P. Mallarino, W.F. Wedin and D.B. Marx. 1989. Spatial variability of soil chemical properties in grazed pastures. Soil Sci. Soc. Am. J. 53:784-789.
West, C.P. 1990. A proposed growth stage system for bermudagrass. P. 38-42. In Proc. Am. Forage and Grassl. Conf. Blacksburg, VA. 6-9 June, 1990. Am. Forage and Grassl. Council, Georgetown, TX.
Windham, W.R., J.A. Robertson, and R.G. Leffler. 1987. A comparison of methods for moisture determination of forages for near infrared reflectance spectroscopy calibration and validation. Crop Sci. 27:777-783.

Page 250 1997 OSU Soil Fertility Research
Yost, R.S., G. Uehara, and R.L. Fox. 1982. Geostatistical analysis of soil chemical properties of large land areas. II. Kriging. Soil Sci. Soc. Am. J. 46:1033-1037.
Figure 1. Mean surface (0-15 cm, eight cores/subplot) soil organic C, Mehlich III P, and NH4-N+NO3-N from duplicate samples collected from consecutive 0.30 x 0.30 m plots, associated error bars (1 standard deviation) and fertilizer P and N recommendations based on soil test analyses, in a bermudagrass pasture, Burneyville, OK.
0
10
20
30
40
50
60
70
0 2 4 6 8 10 12 14 16 18 20 22DISTANCE, m
MEH
LIC
H II
I P, m
g/kg
0
5
10
15
20
25
30
P F
ER
TILI
ZER
, kg/
ha
Mehlich IIIP Fertilizer
0
2
4
6
8
10
12
14
16
18
20
0 2 4 6 8 10 12 14 16 18 20 22DISTANCE, m
OR
GAN
IC C
, g/k
g
0
5
10
15
20
25
30
0 2 4 6 8 10 12 14 16 18 20 22DISTANCE, m
NH
4-N
+ N
O3-
N, m
g/kg
0
20
40
60
80
100
120
140
N F
ER
TILI
ZER
, kg/
ha
NH4-N + NO3-NN Fertilizer

OSU Soil Fertility Research 1997 Page 251
Figure 2. Mean surface (0-15 cm, eight cores/subplot) soil organic C, Mehlich III P, and NH4-N+NO3-N from duplicate samples collected from consecutive 0.30 x 0.30 m plots, associated error bars (1 standard deviation) and fertilizer P and N recommendations based on soil test analyses, in a bermudagrass pasture, Efaw Experiment Station, Stillwater, OK.
0
10
20
30
40
50
60
70
0 2 4 6 8 10 12 14 16 18 20 22DISTANCE, m
ME
HLI
CH
III P
, mg/
kg
0
5
10
15
20
25
30
P F
ER
TIL
IZE
R, k
g P
/ha
Mehlich IIIP Fertilizer
0
2
4
6
8
10
12
14
16
18
20
0 2 4 6 8 10 12 14 16 18 20 22DISTANCE, m
OR
GA
NIC
C, g
/kg
0
5
10
15
20
25
30
0 2 4 6 8 10 12 14 16 18 20 22DISTANCE, m
NH
4-N
+ N
O3-
N, m
g/kg
0
20
40
60
80
100
120
140
N F
ER
TIL
IZE
R, k
g/ha
NH4-N + NO3-NN Fertilizer

Page 252 1997 OSU Soil Fertility Research
Table 1. Precision of soil test procedures for ten repeated runs of one sample, Efaw site.______________________________________________________________________________Procedure Mean Standard Coefficient of Minimum Maximum
deviation variation, %______________________________________________________________________________Soil pH† 5.50 0.059 1.1 5.42 5.58Soil P‡, mg kg-1 37.78 2.07 5.5 33.84 40.17Soil K‡, mg kg-1 153.40 1.95 1.3 151 156Total soil N†† , g kg-1 0.934 0.046 5.0 0.874 0.100Organic C†† , g kg-1 8.243 0.226 2.7 7.880 8.635NH4-N, mg kg-1ƒ 9.34 0.40 4.3 8.63 10.05NO3-N, mg kg-1ƒ 2.81 0.11 4.1 2.60 2.98______________________________________________________________________________† - 1:1 soil:water, ‡ - Mehlich III, †† - dry combustion, ƒ- 2M KCl extraction

OSU Soil Fertility Research 1997 Page 253
Table 2. Soil sampling error generated from double sampling twenty, 0.30 x 0.30 m subplots (8 cores to a depth of 15 cm)._________________________________________________________________________________________________
Sample A B Std. Dev. CV A B Std. Dev. CV
Soil pH† Organic C, g kg-1
††
1 6.17 6.16 0.007 0.1 0.924 1.042 0.084 8.5
2 6.27 6.22 0.035 0.6 0.939 0.989 0.035 3.6
3 6.09 6.05 0.028 0.5 1.000 1.130 0.092 8.6
4 5.64 5.67 0.021 0.4 1.035 1.215 0.127 11.3
5 5.82 5.86 0.028 0.5 1.067 0.992 0.053 5.1
6 5.64 5.65 0.007 0.1 1.045 1.096 0.036 3.4
7 5.75 5.92 0.120 2.1 1.032 0.933 0.071 7.2
8 5.75 5.72 0.021 0.4 1.183 1.228 0.032 2.6
9 5.69 5.60 0.064 1.1 0.840 0.907 0.047 5.4
10 5.51 5.80 0.205 3.6 1.018 1.002 0.012 1.2
11 5.58 5.65 0.049 0.9 1.285 1.098 0.132 11.1
12 5.62 5.67 0.035 0.6 1.057 1.062 0.004 0.3
13 5.64 5.50 0.099 1.8 0.940 0.891 0.035 3.8
14 5.89 5.92 0.021 0.4 1.006 0.959 0.033 3.4
15 5.70 5.75 0.035 0.6 0.964 0.812 0.107 12.1
16 5.72 5.68 0.028 0.5 0.912 0.981 0.049 5.2
17 5.58 5.48 0.071 1.3 0.855 0.837 0.013 1.5
18 5.59 5.59 0.000 0.0 1.040 0.931 0.077 7.8
19 5.77 5.72 0.035 0.6 0.790 0.712 0.055 7.4
20 5.83 5.75 0.057 1.0 0.793 0.788 0.003 0.4
Average 5.76 5.77 0.048 0.8 0.986 0.980 0.055 5.5
Minimum 5.51 5.48 0.000 0.0 0.790 0.712 0.003 0.3
Maximum 6.27 6.22 0.205 3.6 1.285 1.228 0.132 12.1
Std. Dev. 0.20 0.20 0.048 0.8 0.121 0.136 0.038 3.6
Prob |T| 0.80 0.78
P, mg kg-1
‡ K, mg kg-1
‡
1 17.64 19.96 1.64 8.7 150 142 6 3.9
2 17.75 18.59 0.60 3.3 139 143 3 2.0
3 23.65 33.34 6.85 24.0 180 140 28 17.7
4 29.02 30.50 1.04 3.5 139 143 3 2.0
5 20.91 24.07 2.24 9.9 135 135 0 0.0
6 25.75 42.93 12.14 35.4 168 180 8 4.8
7 29.34 25.54 2.68 9.8 149 160 8 5.0
8 31.02 26.81 2.98 10.3 190 183 5 2.6
9 37.98 24.59 9.46 30.2 156 146 7 4.6
10 38.61 30.50 5.74 16.6 170 165 4 2.1
11 52.83 45.98 4.84 9.8 203 190 9 4.6
12 35.13 35.03 0.07 0.2 140 141 1 0.5
13 38.92 38.40 0.37 0.9 168 166 1 0.8

Page 254 1997 OSU Soil Fertility Research
14 26.70 34.81 5.74 18.7 163 154 6 4.0
15 35.13 31.34 2.68 8.1 135 133 1 1.0
16 43.77 35.34 5.96 15.1 140 168 20 12.8
17 40.29 35.45 3.43 9.0 137 100 26 22.1
18 31.55 26.91 3.28 11.2 140 95 32 27.0
19 28.39 33.66 3.73 12.0 140 144 3 1.9
20 31.02 37.13 4.32 12.7 140 144 3 1.9
Average 31.77 31.54 3.99 12.5 154 149 9 6.1
Minimum 17.64 18.59 0.07 0.2 135 95 0 0.0
Maximum 52.83 45.98 12.14 35.4 203 190 32 27.0
Std. Dev. 8.85 7.13 3.06 9.0 20 24 10 7.6
Prob |T| 0.89 0.18
_________________________________________________________________________________________________
† - 1:1 soil:water
‡ - Mehlich III
†† - dry combustion
CV - coefficient of variation
Prob |T|, probability that the means of two groups (A & B) of observations are equal

OSU Soil Fertility Research 1997 Page 255
Table 3. Mean, standard deviation, minimum and maximum values for soil test, forage yield, forage N and uncalibrated voltage readings for near infrared (NIR), red and green spectral radiance collected from 0.30 x 0.30m plots, Burneyville and Efaw.______________________________________________________________________________Burneyville (n=490) Mean Standard Minimum Maximum CoefficientVariable deviation of variation, %______________________________________________________________________________Forage yield, kg ha-1 2905 1591 244 10750 54Forage N, g kg-1 1.37 0.26 0.14 2.78 19Forage N uptake, kg ha-1 39.2 23.0 2.4 183.5 59Soil pH† 5.44 0.22 4.37 6.29 4Soil NH4-N+NO3-N‡‡ , mg kg-1 11.7 3.4 0.6 26.3 28
N recommendation, kg ha-1 141 - 166 109Soil P‡, mg kg-1 18.4 9.6 3.1 124.1 52
P recommendation, kg ha-1 11.0 - 30.6 0Soil K‡, mg kg-1 130.2 37.6 13.0 262.0 29
K recommendation, kg ha-1 0.0 - 106.7 0Total soil N ††, g kg-1 1.06 0.33 0.44 2.38 31Organic C ††, g kg-1 11.12 3.58 5.34 25.54 32C:N 10.5 1.05 6.28 13.98 10NIR 2098 604 292 3893 29Red 386 171 36 886 44Green 978 265 116 1405 27NDVI 0.685 0.119 0.331 0.909 17Forage moisture, % 45 10 13 80 22
Efaw (n=490) Mean Standard Minimum Maximum CoefficientVariable deviation of variation, %______________________________________________________________________________Forage yield, kg ha-1 7343 3862 1221 23945 52Forage N, g kg-1 1.07 0.18 0.63 1.67 16Forage N uptake, kg ha-1 74.9 33.2 13.8 220.3 44Soil pH† 5.81 0.19 5.37 6.34 3Soil NH4-N+NO3-N‡‡, mg kg-1 15.7 2.0 5.5 19.7 13
N recommendation, kg ha-1 133 - 156 124Soil P‡, mg kg-1 41.8 9.6 15.2 63.7 23
P recommendation, kg ha-1 0.0 - 17.1 0Soil K‡, mg kg-1 131.4 38.4 12.0 301.0 29
K recommendation, kg ha-1 0 - 107.6 0Total soil N††, g kg-1 0.88 0.11 0.57 1.25 12Organic C††, g kg-1 10.37 1.53 7.16 17.17 14C:N 11.7 1.87 8.31 17.85 16NIR 1410 115 1074 1719 8Red 432 47 314 681 11Green 898 70 714 1170 8NDVI 0.530 0.044 0.373 0.667 8Forage moisture, % 25 6 9 50 21______________________________________________________________________________† - 1:1 soil:water, ‡ - Mehlich III, †† - dry combustion, NDVI = (NIR-red)/(NIR+red), ‡‡ -2M KCl extract
Page 256 1997 OSU Soil Fertility Research
Effect of Row Spacing, Nitrogen Rate and Growth Stage on Spectral Radiance in Winter Wheat
E.V. Lukina, W.R. Raun, H.L. Lees, H. Sembiring, G.V. Johnson, J.B. Solie and M.L. Stone
ABSTRACTSoil reflectance may affect spectral radiance measurements of plant canopies in the red and near infrared bandwidths. Percent of vegetation coverage may also impact spectral radiance in variable rate technology. The main objective of this experiment was to determine the critical percentage of vegetation coverage needed for precise forage N uptake calibration with indirect spectral radiance measurements. This study evaluated soil background interference with the spectral radiance of wheat as influenced by soil color and percentage of vegetation coverage. The effects of row spacing (15.2, 19.0, 25.4 and 30.5 cm) and growth stage under various nitrogen fertilizer rates (0, 56, 112, 168 kg N ha -1) on spectral radiance measurements from “Tonkawa” winter wheat (Triticum aestivum L.) canopies were evaluated at Perkins and Tipton, Oklahoma. Normalized difference vegetative index (NDVI) was used to characterize wheat canopy reflectance. NDVI decreased with increasing row spacing and increased with increasing N fertilizer rate at Perkins, at Feekes growth stage 4. At Tipton, NDVI was not affected by row spacing; however, NDVI increased with increasing nitrogen applied, as measured at Feekes growth stage 5.
INTRODUCTION
mproving field management techniques can increase productivity and reduce the environmental impact of modern agriculture. One problem of efficient field management is applying fertilizers where they are needed and in sufficient, but not
excessive, amounts. Scientists as well as field practitioners have observed that nutrient levels vary within fields. Nevertheless, fertilizers are usually applied uniformly based on one composite soil sample from each field. Thus, the entire field receives the same fertilizer rate.
ISawyer (1994) highlighted the concepts of variable rate technology (VRT) and
stressed the major factors which constrain VRT on a large scale: (i) the cost of implementation (sampling, mapping, equipment, personnel); (ii) lack of expected increase in crop yield; and (iii) lack of input savings. Also, Sawyer (1994) suggested that interpretation of data and reliable recommendations should be of major concern for further study. He stated that determination of crop yield variability with on-the-go sensors was still futuristic. However, work by Stone et al. (1996) demonstrated that it would be possible to use on-the-go plant sensing methods to monitor soil and yield variability.
The main objective in this study was to determine the critical percentages of vegetation coverage needed for precise forage N uptake calibration with indirect spectral radiance measurements. Secondary objectives of this study were: 1) to estimate the soil

OSU Soil Fertility Research 1997 Page 257
background interference with the spectral radiance of wheat; 2) to determine soil background interference relationships to soil color; 3) to evaluate how different percentages of vegetation cover affect soil background interference; and 4) to evaluate the impact of each of these variables on calibrating indirect spectral measures with wheat forage N uptake.
LITERATURE REVIEW
The successful use of spectral radiance in variable rate technology depends on better understanding of indices that predict spatial distribution of yield limiting factors within a field. Application of reflectance measurement devices in agriculture began in the 1970s, when near infrared spectrometers were used to measure chlorophyll content in plant leaves, and moisture content in forage and plant samples. Thomas and Oerther (1972) reported the ability to predict leaf nitrogen (N) content in sweet peppers (Capsicum annum, L. var. ‘Yolo Wonder’) from reflectance measurements at 550 nm (green) and 675 nm (red) due to a direct relationship between N and chlorophyll concentration in leaf tissue. Later, Thomas and Gausman (1977) showed that 550 nm was superior to 450 and 670 nm wavelengths to predict chlorophyll content. They concluded that carotinoid concentration does not affect the reflectance sensitivity to chlorophyll concentration in leaves of cantaloupe (Cucumis melo L. cv. Reticulatus Naud.), corn (Zea mays L.), cotton (Gossypium hirsutum L.), cucumber (Cucumis sativus L.), lettuce (Lactuca sativa L. cv. Capitala L), sorghum (Sorghum bicolor (L.) Moench), spinach (Spinacia oleracea L.), and tobacco (Nicotiana tabacum L.). Other authors tried different spectral radiance indices to assess the growing condition of crops. Kleman and Fagerlund (1987) studied different ratios of red (R), near infrared (IR) and infrared bandwidths: IR/red --R(0.80)/R(0.68), R(0.80)/R(1.65), and the blue color coordinate Z which is R(0.48)/[R(0,48)+R(0.56)+R(0.68)], in order to find relationships between the state of vegetation and the spectral “signatures” of plants. They concluded that IR/red ratio was related to the amount of biomass and barley grain yield. The Z coordinate better indicated the difference between irrigated and non-irrigated treatments.
Blackmer et al. (1994) studied light reflectance of corn leaves from plots with different N treatments within the 400-700 nm range. They found relatively strong correlation between reflectance readings near 550 nm and grain yield. Later, Blackmer et al. (1996) studied reflected radiation from irrigated corn canopies with different N treatments at the R5 growth stage. They stated that absolute scale measurements are affected by many factors, such as sensor and illumination angles, solar radiation and canopy architecture. To avoid the interference of illumination factors, the data were referenced to the radiation measurements taken from the plot with highest N application (relative reflectance was set equal to 1 for this plot). Measurements at 550 and 710 nm were the most sensitive to N treatment and highly correlated with grain yield. A ratio of 550 or 710 nm to 800-900 nm also showed high correlation with relative grain yield. However, single wavelength reflectance measurements had significant hybrid x N interactions. In the same work, Blackmer et al. (1996) used reflected radiation expressed as a ratio of red/NIR to demonstrate differences in N status of several corn hybrids. Here, reflectance was measured from plant canopies [(550-600)/(800-900)]. The idea to

Page 258 1997 OSU Soil Fertility Research
use ratios is that they may have advantages of compensating for other factors such as light conditions, soil background reflectance and canopy architecture.
Wanjura and Hatfield (1987) studied the sensitivity of several vegetative indices (VI) based on spectral radiance. They also indicated that VI (NIR/red) and normalized difference vegetative index (NIR-red/NIR+red) had relatively high correlation with fresh and dry biomass for cotton (Gossypium hirsutum L.), soybeans (Glycine max L.), sunflower (Helianthus annus L.) and grain sorghum (Sorghum bicolor L.). They pointed out that sensitivity of the latter two indices was higher when plants were in the early growth stages, due to the contribution of the ground reflectance.
Perry and Lautenschlager (1984) indicated that spectral measurements made from satellites are influenced by vegetative characteristics as well as soil background and atmospheric conditions. Green vegetation has higher reflectance in the visible and infrared spectrum over the soil background from 0.75 m and up (Deering et al., 1975). They compared numerous indices and stated that several widely used indices, NDVI and R75 (ratio of bandwith 800-900 to 600-700) among them, are equivalent to one another.
Stone et al. (1996) used a plant nitrogen spectral index (PNSI) obtained from winter wheat fields whose visual N differences were known to exist. Sensor readings were obtained in-vivo, from the sensor, mounted on a tractor. They found high correlation between PNSI and total forage N uptake. They utilized PNSI readings to abate spatial variation among the fields and found smaller variance in grain and forage yield compared to a fixed nitrogen application rate.
Spectral radiance readings are affected by amount of green biomass under the sensor’s view, or biomass density. The biomass density may vary with different row spacing, seeding rate and growth stage of a crop. When 15.2 cm row spacing is used, a 100 m wide field contains 656 rows. However, at 30.5 cm row spacing, this number is less by a factor of two. Plants growing in wider rows have more room and nutrients to form larger canopies. The influence of row spacing and seeding rate on the spectral radiance measurements has not been thoroughly evaluated.
Lafond (1994) found no significant difference of nitrogen by row-spacing interaction for barley yield. Grain yield increased by 3% at the low N rate with 30 cm row spacing compared to 10 cm, and the opposite was found at the high N rate; 10 cm row spacing had a 2% increase in yield versus the 30 cm row spacing. Nevertheless, the interaction of nitrogen and seeding rate was significant for durum wheat and spring wheat yields because of positive seeding rate response to increased nitrogen application.
Koscelny et al. (1990, 1991) found that increasing seeding rate from 67 to 134 kg ha -1 increased yield of cheat free and cheat (Bromus secalinus) infested winter wheat seeded in late October. They did not find a significant yield difference between row spacings of 7.5 and 15 cm; although the further widening of the distance to 22.5 cm between rows led to a decrease in grain yield by 8%. The best grain yield was at a seeding rate of 101 kg ha -1, which was 3.5 percent greater than the yield at 67 kg ha-1, but which was not significantly different from a seeding rate of 134 kg ha -1. However, on fields highly infested with cheat, decreasing row spacing and increasing the seeding rate led to higher wheat grain yields.
Johri et al. (1992) studied nutrient uptake by wheat related to different management practices. They found that a higher seeding rate (150 kg ha -1) and a row

OSU Soil Fertility Research 1997 Page 259
spacing of 15 cm, compared with 22 cm, did not greatly affect the nitrogen uptake by wheat, however, it did significantly decrease weed N removal.
MATERIALS AND METHODS
Tonkawa winter wheat (Triticum aestivum L.) was planted in the beginning of October at Perkins, OK on a Teller sandy loam (fine-loamy, mixed, thermic Udic Argiustoll) and at Tipton, OK on a Tipton loam (fine-loamy, mixed, thermic, Pachic Arguistoll). The color of Perkins soil was lighter than that of Tipton; therefore, providing variable soil background interference. Each plot was 2.6 x 6.1m. A complete factorial arrangement of N rate and row spacing treatments were randomly distributed among the experimental plots in three replications. Four N rates of 0, 50, 100 and 150 lbs N per acre (0, 56, 112, 168 kg ha-1, respectively) of ammonium nitrate were applied preplant. Soil reflectance affects sensor readings in red and short and long near infrared bandwidths. The percentage of bare soil exposed to the sensor view may also interfere with spectral radiance from wheat canopies. To estimate the influence of soil background interference, treatments with the same planting density, but different seeding rates and various row spacings were used. The seeding rates were 98.6, 79.5, 59.4 and 49.3 kg ha-1, at row spacings of 6, 7.5, 10 and 12 inches (15.2, 19.0, 25.4 and 30.5 cm), respectively. Spectral radiance readings were taken from wheat canopies in red: 671±6 nm and infrared: 780±6 nm wavelengths. Forage samples were clipped from 91.4 cm2, the same area where sensor readings were taken. Wet and dry forage weights were taken and then ground to pass a 140 mesh screen. Sensor readings in red and near infrared bandwidths were collected from all plots of these two sites. NDVI index was calculated using the formula: NDVI=(NIR - RED)/(NIR + RED) Statistical analysis was performed using SAS (SAS Institute, 1985).
RESULTS
Effect of row spacing and N rate on dry matter yieldDry matter wheat forage yields at Tipton and Perkins from Feekes 4 and Feekes 5
are reported in Figure 1. With few exceptions, analysis of variance showed no significant interaction between row spacing and N rate for dry matter yield or NDVI, thus allowing independent interpretation of main effects (Table 1). Increased nitrogen applied increased dry matter production at both sites and stages of growth (N rate linear contrast, Table 1).
Row spacing affects crop biomass whereby the wider row spacings provide more room for a single plant to grow, which can increase per-plant biomass; however, it decreases the number of plants per unit area. At Perkins, Feekes growth stage 4, the highest biomass was obtained from treatments with a 15 cm row spacing and was significantly different from those of 19 and 30.5 cm. However, by Feekes 5, differences between row spacings were small. At Tipton, the highest biomass levels were noted in the 25.4 and 19 cm row spacings at Feekes 4. By Feekes 5, increased biomass levels were detected in the 15 and 19 cm row spacings. Treatments with 30.5 cm row spacing produced the lowest biomass at both Feekes 4 and 5. Overall, dry matter biomass levels were higher at Tipton than Perkins.

Page 260 1997 OSU Soil Fertility Research
Effect of row spacing and N rate on spectral measurementsSpectral readings in the red and near infrared bandwidths were affected by both
biomass and bare soil surface. Consistent with Perry (1984), bare soil reflectance was higher in the red region, and lower in near infrared bandwidth when compared with that of green plants. Therefore, bare soil can considerably decrease NDVI. Spectrometer readings of bare soil and wheat at Feekes growth stage 4 showed the difference in spectral measurements in the red (671±6 nm) and near infrared (780±6 nm ) regions (Figure 1).
Dry matter content was directly related to NDVI and was inversely related to intensity of red light reflectance. At Perkins NDVI readings were higher with a 15 cm row spacing when taken at Feekes growth stage 4 (Table 1). By Feekes 5, NDVI readings were highest in the 15 cm row spacing.
NDVI increased with increased nitrogen applied and was significantly different from the control in Perkins at Feekes 4. At Feekes 5, the highest NDVI was obtained at the 112 kg N ha-1 rate. At Tipton, Feekes 5, N rate was highly correlated with red (r=-0.72) and NDVI (r=0.82) spectral radiance readings.
Regression of spectral indices on dry biomass by row spacingIn order to estimate the relationship between biomass and spectral indices, dry
biomass was regressed on red, NIR and NDVI. Linear models, regression coefficients and coefficients of determination are reported in the Table 2.
For all stages and locations, NDVI was a better predictor of dry biomass than NIR and/or red alone. When data from all row spacing treatments were pooled together, the best relationship between dry biomass and NDVI was found in Perkins at Feekes 4 (Table 2). However, this relationship was not as pronounced at Feekes 5, partially, explained by freeze damage following Feekes 4 readings.
Analysis of variance for sensor readings showed significant differences between row spacings. Spectral reflectance of bare soil in the red region may significantly interfere with plant reflectance. However, the reflectance from green plants in the NIR bandwidth was considerably higher than that of the soil surface.
In order to assess the effect of soil exposure to the sensor view, data were separated by row spacing. The D1 variable is equal to the row spacing value (Table 2). Incorporation of the D1 variable improved correlation at all locations. The significant value of the D1 regression coefficients showed that a change in row spacing overvalued NDVI by 0.080 NDVI units at Perkins, Feekes growth stage 4. This could result in an overestimation of dry matter yield if the indirect spectral property were used. The decreased D1 coefficient (-0.01) at Feekes 5 might be related to the decrease in the soil area exposed to the sensor view. At Tipton, the D1 coefficient was negative meaning that the narrow row spacings underestimated NDVI by 0.06 NDVI units.
CONCLUSIONS
Preliminary results indicated that NDVI was the best estimator of dry biomass for winter wheat compared to red and NIR. Row spacing affects spectral readings, probably because of soil background interference with plant reflectance in the red region. Separation by row spacing improved the correlation between biomass and NDVI.

OSU Soil Fertility Research 1997 Page 261
Further studies should evaluate the relationship between percent vegetative cover, background soil intereference, spectral indices, total N uptake and grain yield. To assess soil background interference with spectral readings, digital image data will be incorporated into predictive equations.
REFERENCESBlackmer, T. M., J. S. Schepers, and G. E. Varvel. 1994. Light reflectance compared with other nitrogen
stress measurements in corn leaves. Agron. J. 86:934-938.
Blackmer, T. M., J. S. Schepers, G. E. Varvel, and E. A. Walter-Shea. 1996. Nitrogen deficiency detection using reflected shortwave radiation from irrigated corn canopies. Agron. J. 88:1-5.
Deering, D.W., J. W. Rouse Jr., R. H. Haas, and J. A. Schell. 1975. Measuring “forage production” of grazing units from Landsat MSS data. Proceedings of the 10th Internal Symposium Remote Sensing of Environment. 2:1169-1178.
Johri, A. K., Govindra Singh and D. Sharma. 1992. Nutrient uptake by wheat and associated weeds as influenced by management practices. Trop. Agric. 69(4):391-393.
Kleman, J. and E. Fagerlund. 1987. Influence of different nitrogen and irrigation treatments on the spectral reflectance of barley. Remote Sens. of Environ. 21:1-14.
Koscelny, J. A., T. F. Peeper, J. B. Solie and S. G. Solomon, JR., 1990. Effect of wheat (Triticum aestivum) row spacing, seeding rate, and cultivar on yield loss from cheat (Bromus secalinus). Weed Technology. 4:487-492.
Koscelny, J. A., T. F. Peeper, J. B. Solie and S. G. Solomon, JR., 1991. Seeding date, seeding rate, and row spacing affect wheat (Triticum aestivum), and cheat (Bromus secalinus). Weed Technology. 5:707-712.
Lafond, G. P. 1994. Effects of row spacing, seeding rate and nitrogen on yield of barley and wheat under zero-till management. Can. J. Plant Sci. 74:703-711.
Perry, C. R., JR., and L. F. Lautenschlager. 1984. Functional equivalence of spectral vegetation indices. Remote Sens. of Environment. 14:169-182.
Roth, G. W., R. H. Fox, and H. G. Marshall. 1989. Plant tissue tests for predicting nitrogen fertilizer requirements of winter wheat. Agron. J. 81:502-507.
Sawyer, J. E. 1994. Concepts of variable rate technology with considerations for fertilizer application. J. Prod. Agric. 7:195-201.
Schepers, J. S, D. D. Francis, and M. T. Thompson. 1989. Simultaneous determination of total C, total N, and 15N on soil and plant material. Commun. in Soil Sci. Plant Anal. 20(9&10):949-959.
Stone, M. L., J. B. Solie, W. R. Raun, R. W. Whitney, S. L. Taylor, and J. D. Ringer. 1996. Use of spectral radiance for correcting in-season fertilizer nitrogen deficiencies in winter
wheat. Trans. ASAE. 39(5):1623-1631.
Thomas, J. R. and H. W. Gausman. 1977. Leaf reflectance vs. leaf chlorophyll and carotenoid concentrations for eight crops. Agron. J. 69:799-802.
Thomas, J. R. and G. F. Oerther. 1972. Estimating nitrogen content of sweet pepper leaves by reflectance measurements. Agron. J. 64:11-13.
Wanjura, D. F. and J. L. Hatfield. 1987. Sensitivity of spectral vegetative indices to crop biomass. Transactions of ASAE. 30(3):810-816.

Page 262 1997 OSU Soil Fertility Research
Wood, C. W., D. W. Reeves, R. R. Duffield and K. L. Edmisten. 1992. Field chlorophyll measurements for evaluation of corn nitrogen status. J. of Plant Nutr.15:487-500.
Table 1. Analysis of variance for dry matter yields and NDVI at Feekes 4 and 5 at Perkins and Tipton, OK, 1997.______________________________________________________________________________
Tipton PerkinsSource of df Feekes 4 Feekes 5 Feekes 4 Feekes 5Variation yield NDVI yield NDVI yield NDVI yield NDVI
------------------------------------------------- mean squares ---------------------------------------------------
Rep 2 143564 282422 0.0074** 131752 0.0525** 1275865 0.0389N rate 3 747123** 1447727** 0.05728** 394598* 0.0517** 2438455** 0.0618**Row spacing 3 3655993** 3914689* 0.0020 374867* 0.0673** 693382 0.0218N rate * Row spacing 9 94297 114772 0.0021*506110.0032 508155 0.0197Residual 24 114375 113660 0.0008 95667 0.0057 377306 0.0118
SED 276 275 0.02 253 0.06 502 0.09CV 14 11 4 32 14 32 19
Contrast:N rate linear 2023088** 3160904** 0.1620** 1041096** 0.1132** 6802302** 0.1620**N rate quadratic 200855 1178447** 0.0088** 132258 0.0417* 314565 0.0074Row spacing linear 244947 697211* 0.0026 598441* 0.0195 44164 0.0063Row spacing quadratic 440853 8178399** 0.0006 523113* 0.1821** 6599 0.0428
Treatment meansN rate0 1970 - 2424 0.626 724 0.445 1365 0.49256 2248 - 2951 0.713 934 0.544 1759 0.536112 2483 - 3204 0.753 1105 0.592 2215 0.637168 2503 - 3105 0.786 1106 0.574 2301 0.632
Row spacing15.2 2003 - 3324 0.728 1206 0.627 1947 0.63119.0 2695 - 3270 0.716 922 0.571 1890 0.58025.4 2829 - 2998 0.732 959 0.498 2160 0.53130.5 1676 - 2092 0.703 781 0.460 1672 0.556_________________________________________________________________________________________________*,** - significant at 0.05 and 0.01 probability levels, respectively.SED – standard error of difference between two equally replicated means.

OSU Soil Fertility Research 1997 Page 263
Table 2. Regression Coefficients and Coefficients of Correlation between Spectral Indices and Dry biomass by Row Spacings.
Perkins, Feekes 4 Perkins, Feekes 5 Tipton, Feekes 5NRED SNIR NDVI NRED SNIR NDVI NRED SNIR NDVI
LINEAR MODEL over all row spacingsSpectral Index = a + b * DryMatter
Intercept 742.8** 1413.7**
0.31** 627.5**
1955.1**
0.52** 503.9** 1669.8** 0.55**
Slope -0.25** 0.25* 2*1E-4 -0.05* 0.11* 4*1E-4* -0.05** 0.21** 5*1E-5**R2 0.30 0.09 0.51 0.09 0.10 0.12 0.14 0.16 0.29
LINEAR MODEL, Separation by row spacingSpectral Index = a + b1 * Dry Matter + b2 * D1
Intercept 756.4** 1417.7**
0.30** 654.5**
1862.9**
0.49** 552.9** 1560.2** 0.51**
Slope -0.20** 0.26* 2*1E-4 -0.05 0.11* 4*1E-4* -0.08** 0.27** 8*1E-5**D1 -124.6** -37.5 0.08** -57.8 176.3 0.05 66.3* -148.6 0.06**R2 0.43 0.09 0.62** 0.12 0.18 0.19 0.25 0.19 0.40
* - significant at significance level 0.05 ** - significant at significance level 0.01
Figure 1. Spectral measurements of bare soil and a winter wheat canopy at Feekes growth stage 4.
Spectral Radiance Readings
-1000
-500
0
500
1000
1500
2000
2500
300 400 500 600 700 800 900 1000 1100 1200
Wavelenth, nm
Inte
nsity
Wheat (RS=7.5, 168 kg N)Bare Soil

Page 264 1997 OSU Soil Fertility Research
Use of Spectral Radiance for Correcting Nitrogen Deficiencies and Estimating Soil Test Variability in an Established
Bermudagrass Pasture
S.L. Taylor, W.R. Raun, J.B. Solie,G.V. Johnson, M.L. Stone, R.W. Whitney Jerry L. Rogers, Wadell Altom and C.M. Taliaferro
ABSTRACTThe use of variable rate technology has become increasingly popular for applying plant nutrients. The most widely used method for determining variable fertilizer rates is presently based on soil testing and yield mapping. Three field studies (Burneyville 1995, Burneyville 1996, and Ardmore 1996) were initiated in established Midland bermudagrass (Cynodon dactylon (L) Pers.) pastures to determine the relationship between spectral radiance at specific wavelengths with forage nitrogen (N) removal and biomass, and to determine field variability of soil test parameters. Variable N (applied to 1.5 x 2.4 m subplots within 2.4 x 45.7 main plots), fixed N and check treatments were evaluated at each location. Spectral radiance readings were taken in the red (671±6 nm), green (570±6nm), and near infrared (NIR) (780±6 nm), wavelengths. The normalized difference vegetation index (NDVI) was calculated as NIR-red/NIR+red. Variable N rates were applied based on NDVI. The highest fixed variable N rate was set at 224, 336 and 672 kg ha -1 for Burneyville 1995, 1996 and Ardmore 1996, respectively. At Burneyville, soil samples were collected in all variable rate plots (1.5 x 2.4m) and analyzed for various soil test characteristics. NDVI, red, green and NIR spectral radiance readings were correlated with bermudagrass forage N removal and yield. Correlation of forage yield and N removal with red, NIR, and, NDVI were best with maximum forage production. However, when forage production levels were low, correlation decreased dramatically for the red wavelength compared with NIR and NDVI. Forage yield and forage N removal in variable rate treatments increased when compared to the check while being equal to the ½ fixed and fixed rates where higher N rates were applied. Also, variability about the mean in variable rate plots was significantly lower than ½ fixed and fixed rates which supports adjusting N rates based on indirect NDVI measurements. Variable N rate plots reduced fertilizer inputs by 60%, and produced the same yield as fixed rate plots, while fixed and ½ fixed rates did not increase N content in the forage over that of the variable rate treatment. Soil sample data collected from small consecutive plots (<4m2), was extremely variable indicating that intense sampling would be needed if variable fertilizer application were to be based on soil test results.
INTRODUCTION
ensor-based variable fertilizer application has not been extensively studied. Spectral radiance has been used to detect weed versus bare soil and NIR instruments have been used to detect protein content and digestibility in forages. S

OSU Soil Fertility Research 1997 Page 265
The use of precision farming for applying plant nutrients is becoming increasingly popular although the most widely used method to adjust nutrient application continues to be soil testing. Kincheloe (1994) noted that wide yield variations occur in fields which have continually received the same inputs and where much of the variability is due to soil type. Wibawa et al. (1993) indicated that a 15 m sampling grid was a better estimator of field variability compared to a 76 m sampling grid. Grain yield increased from the reduced grid size but the intense sampling resulted in a lower net return because of the high sampling and testing costs. Han et al. (1994) calculated the minimum cell size by subdividing a field into small enough regions that soil properties within regions were uniform thus keeping application rates constant. They estimated that the minimum cell size for soil nitrate concentration was 20 m x 20 m. Cahn et al. (1994) analyzed spatial variability of soil properties and nutrient concentrations for site-specific crop management and concluded that reducing sampling intervals from 50 to 1 m would reduce variability of soil water content, soil organic carbon, NO3-N, PO4-P, and K estimates by 74, 95, 25, 64, and 58%, respectively. Vansichen and De Baerdemaeker (1993) reported that 67% of the variability in corn silage yield was explained by soil sampling variables. Wollenhaupt et al. (1994) estimated mapping accuracy by dividing a field into 97 m2 cells and taking a composite soil sample from each cell. They also divided a second field into 32 m2 cells and took soil samples on grid-point intersections. This work showed that the 97 m2 cells were not acceptable for variable rate fertilizer application and if used would result in some misapplication, while the 32 m grid-point samples increased mapping accuracy by 38%. Chancellor and Goronea (1994) found that application of nitrogen in wheat based on spatial variability of < 1 m intervals increased N use efficiency 12 % over spatial variability greater than 1 m.
Recent work by Stone et al. (1996) has demonstrated that total plant nitrogen can be estimated by using spectral radiance measurements in the red (671) and near infrared (NIR) (780) wavelengths. A plant-nitrogen-spectral-index (inverse of NDVI) was used to calculate the amount of fertilizer N required to correct in-season winter wheat nitrogen deficiencies. Blackmer et al. (1994) stated that light reflectance near 550 nm was best to separate nitrogen treatment differences and could be used to detect N deficiencies in corn. Work by Bowman (1989) measured leaf spectral reflectance of cotton in the near-infrared spectra (810, 1665, and 2210 nm) as it related to relative leaf water content, total water potential and turgor pressure. Hagger et al. (1984) used a hand held meter which measured relative intensity of reflected light at 650 and 750 nm on various legumes and grasses, and indicated that the meter could be used to discriminate between white clover and nitrogen-deficient grasses. Green leaf dry matter and infrared:red ratios indicated that reflectance measurements could be used to estimate leaf dry matter or leaf area measurements in spring and winter wheat (Aase and Tanaka, 1984). Everitt et al. (1985) studied the relationship of plant leaf N content and leaf reflectance from 500 to 750 nm and concluded that buffelgrass which received no fertilizer N resulted in higher reflectance readings. Kleman and Fagerlund (1987) found that an infrared to red ratio was strongly correlated with biomass 200 days after planting barley. Walburg et al. (1982) measured spectral differences across N treatments in corn and found that N treatments had an effect across the entire wavelength interval measured (0.4 to 2.4 um). Readings in the red reflectance increased from N-deprived canopies, while the near

Page 266 1997 OSU Soil Fertility Research
infrared reflectance decreased, with a near infrared/red ratio differing more than a single wavelength.
The objectives of this work were to determine the relationship between spectral radiance at specific wavelengths with total bermudagrass forage nitrogen and biomass, and to quantify soil test variability in small plots.
MATERIALS AND METHODS
For all experiments, forage spectral radiance measurements were obtained using an integrated sensor and signal processing system. Photodiode detectors included interference filters for red (671±6nm), NIR (780±6nm), and green (550±6nm) with a spectral band width of 0.46m and 0.075m long. Using sensor measurements obtained for NIR and red uncalibrated voltage readings, NDVI was calculated based on work by Stone et al. (1996) and Perry and Lautenschlager, (1984). Spectral radiance readings were obtained at the start of the experiment and before each subsequent forage harvest. The sensor components were mounted on the front of a John Deere Model 318 lawn and garden tractor traveling at a speed of 3 km/hr. Approximately 10 readings were taken per second, with a range of 75-100 readings from each 2.4 x 1.5 m plot. Red, NIR, and green were determined from each plot by averaging the collected readings. All sensor readings were taken in the same direction (south) for all experiments. Variable N rates were applied based on a linear NDVI-N rate scale in which readings with the highest NDVI value (highest total forage N) received the lowest fertilizer N rate, and the lowest NDVI value (lowest total forage N) received the highest fertilizer N rate, dependent on the location and year. All variable N rates were broadcast by hand as ammonium nitrate to each subplot.
All forage samples (prior to and after fertilization) were collected using a self-propelled John Deere 256 rotary mower at a height of 0.09 m. Plot weights were recorded and sub-sampled for moisture and chemical analysis. Sub-samples were dried for 120 hr in a forced-air oven at 70°C and ground to pass a 100 mesh screen. Bermudagrass forage and soil samples were analyzed for total N and organic C (soil only), by dry combustion, (Schepers et al., 1989), and total P (only prefertilization at Burneyville 1995) using the vanadomolybdate method without the use of H2SO4 in the digest (Barton, 1942; and Bolin and Stamberg, 1944). Soil samples were additionally analyzed for pH (1:1 soil:water), NH4-N and NO3-N (2M KCl extract, Lachat, 1989), extractable K and P (Melich III extract).
Burneyville 1995 A field experiment was conducted in the summer of 1995 on a mature stand of
'Midland' bermudagrass. Initial soil test characteristics are reported in Table 1. Whole plot treatments (2.4 X 45.7 m) consisted of check (no-nitrogen), fixed (242 kg N ha -1) and a variable rate (N rate dependent on NDVI readings) applied to 30 subplots (2.4 x 1.5 m) within whole plots. The experimental design was a split-plot randomized complete block with 3 replications. Part of the third replication was infested with crabgrass and was not included in the forage yield results. Fertilizer treatments were applied after sensor readings were taken and forage was removed, with the variable rate application ranging from 0 to 224 kg N ha-1 (agronomic rate determined based on yield

OSU Soil Fertility Research 1997 Page 267
goal for the region) A blanket application of phosphorus (P) as triple superphosphate and potassium (K) as potassium chloride was applied (at the time of N fertilization) at rates of 48.9 kg ha-1 of P and 186 kg ha-1 of K, respectively. Surface soil samples (0-15cm) were taken from all subplots within variable rate plots prior to fertilization to evaluate soil heterogeneity.
Ardmore and Burneyville 1996 Two field experiments were conducted at Ardmore and Burneyville to determine
the use of spectral radiance reading for estimating N deficiencies in bermudagrass pastures. Both experiments were conducted on mature stands of 'midland' bermudagrass. The Burneyville 1996 experiment was 200 m away from the Burneyville 1995 experiment. Soil test values and classification are reported in Table 1. The experimental design was a split-plot randomized design with two replications. Whole plot treatments (3.1 X 45.7 m) consisted of a check (0 kg N ha-1), fixed (600 and 300 kg N ha-1 Ardmore and Burneyville respectively), ½ fixed (half the fixed rate at each site respectively) and variable rate (N rate dependent on NDVI readings). Whole plots were subdivided into 30 subplots (3.1 X 1.5 m). Fertilizer treatments were applied after sensor readings were taken, when the bermudagrass was approximately 0.1 m tall, with the variable N rate ranging from 0 to 600 kg N ha-1 and 0 to 300 kg N ha-1 at Ardmore and Burneyville respectively. The top fixed rate (600 and 300 kg N ha-1 at Ardmore and Burneyville) was chosen based on yield maximums observed over time in companion studies at the same sites (data not reported). A blanket application of P and K was applied as was done in 1995, but, in early April at these two sites. Spectral radiance readings were taken prior to fertilization, and before each subsequent harvest following fertilization for all treatments.
RESULTS AND DISCUSSION
Forage Yield, PrefertilizationPrior to any fertilization a contour map of NDVI readings was developed from
mean values generated from every plot (2.4 x 1.5 m) from the entire experimental area to determine the variable fertilizer rates. Simple correlation coefficients for forage yield, total N, N removal, NDVI, red, green and NIR combinations are reported in Table 2. Red green and NDVI readings were significantly correlated with forage yield and N removal, while the NIR spectral radiance readings were not correlated, at either location in the 1996 sampling year. The lack of correlation could have been due to the low N availability (low total N content in the forage), also illustrated by the lack of correlation of total N with any of the spectral radiance readings. Results from forage harvest and NDVI data collected from consecutive (2.4 X 1.5 m) plots is reported in Figure 1. It is important to note that forage yields ranged from 400 to 1800 kg ha-1 over a 40 m distance. Similarly, N removal ranged from 5 to 35 kg ha-1, roughly a 7 fold difference. This large variability was not expected, however, it was important to find that NDVI readings paralleled the severe variations in yield and N removal for all prefertilization readings, both years and locations.

Page 268 1997 OSU Soil Fertility Research
Forage Yield, Post FertilizationPrior to each harvest, spectral radiance readings were taken for the entire
experimental area. Simple correlation coefficients by harvest and location are reported in Table 2. Forage yield and N removal were correlated with NDVI at all locations. The second harvest at Ardmore 1996 and the first harvest at Burneyville 1996 had the highest forage yields. For these harvests, red, NIR and NDVI spectral radiance readings had the highest correlation with forage yield, total N and N removal. Green spectral radiance readings were better correlated with forage yield when yield levels were lower (first post fertilization harvest at Ardmore and second harvest at Burneyville, Tables 2 and 3). Alternatively total N concentration was consistently correlated with spectral radiance measurements when yield production levels were high (Ardmore 1996, second post fertilization harvest, and Burneyville 1996, first post fertilization harvest), Tables 2 and 3. The relationship between NDVI and total N removal at Ardmore (second post fertilization harvest) and Burneyville (first post fertilization harvest) in 1996 is reported in Figure 2. The quadratic equation at both locations significantly improved correlation over linear. This highly significant curvilinear relationship between NDVI and total N removal in bermudagrass was consistent with similar work in winter wheat (Stone et al., 1996).
Analysis of variance for forage yield, total N, and N removal is reported in Tables 4 and 5. The main effect of treatment for bermudagrass forage yield was not significant at the Burneyville 1995 and 1996 sites. Failure to observe a significant increase in yield in 1995 was due to initially low soil test P which was not corrected until after the first harvest. Forage yield and N removal were significantly affected by treatment at Ardmore (Table 5). The single-degree-of-freedom contrast for check vs variable-rate and fixed rate treatments was significant for total N and N removal at Burneyville, 1995 (Table 4). The 1996 sites showed significant differences for the check vs variable-rate, ½ fixed rate and the fixed rate treatment for total forage yield at Ardmore and total N at Burneyville, 1996 (Table 5). Total N removal in the forage was significantly different for the above contrast at both locations for 1996. However, no differences were detected between variable-rate and ½ fixed rate (VR vs ½ FX) or fixed rate (VR vs FX) treatments for any of the variables measured (Table 5). For the Burneyville 1996 experiment, forage N use efficiency was greater for the variable rate compared to the ½ fixed and fixed rate treatments. Percent fertilizer recovery (N uptake treated - N uptake check/N rate) over the check was 71% for the variable rate and 20 and 19 for the ½ fixed and fixed rate, respectively. Addition of fertilizer at Ardmore increased total forage yield and total N removal compared to the check plot, with no difference detected between the variable rate, ½ fixed and fixed rate treatments.
Variability in the measurement of bermudagrass forage yield and N removal over 45.7 m from harvest data collected from consecutive 1.53 m intervals is illustrated in Figure 3 for rep 1 of Ardmore and rep 2 of Burneyville, 1996. Also reported in each Figure are the treatment means over the 45.7 m (30 subplots) and the associated standard deviations. The application of variable fertilizer N had a decreased standard deviation compared to the ½ fixed and fixed rate treatments for total forage yield at both locations (Figure 3). For both forage yield and forage N removal, coefficients of variation were smaller for the variable rate compared to ½ fixed and fixed rate treatments (excluding forage N removal, Ardmore, Figure 3).

OSU Soil Fertility Research 1997 Page 269
Soil Variability Soil samples were taken in the variable N rate plots in 1.53 m intervals over the
entire plot, to quantify the actual soil variability within a 45.7 m transect. Simple statistics for each soil test are reported in Table 6. None of the soil test variables collected were correlated with total production, total N or N removal. Variability in soil test results are reported in Table 6, from samples (16 cores/plot) collected from each 1.5 x 2.44 m subplot (n=90). Soil pH ranged from 5.1 to 6.2 within this 1350 m2. Soil organic carbon had a three fold difference within the sampled area. This would represent a range in organic matter of between 1.3 to 3.4. Similar large differences in other soil test parameters were found, especially for P. The agronomic significance of this soil variability is that it would be economically impossible to collect samples on such a fine scale and treat each area independently. This is the principal reason why indirect sensor measurements are needed to detect and subsequently treat micro-soil variability.
CONCLUSIONS
Spectral radiance readings were significantly correlated with forage yield, and N removal for all harvests and locations, indicating that sensor based variable rate technology can be used in bermudagrass forage production systems. There was a significant N treatment response to applied fertilizer for total N and total N removal in two of the three experiments. Application of N fertilizer increased total forage yield over the check at two of the three locations. Total N and total N removal was increased over the check, while the variable rate treatment was equal to the ½ fixed and fixed rate. In general, the variability in both forage yield and N removal of variable rate treatments was lower than that of 1/2 fixed rate and fixed rate treatments. This supports adjusting N rates based on indirect NDVI measurements, and also because significant yield increases were found as a result of applying N. Results from soil test analysis suggested that substantial field variability is present over very short distances (<= 1.53 m). The intense sampling required to account for soil variability in an entire field on this small of a scale and the costs associated with such sampling would further indicate the beneficial use of sensor-based-variable-rate-technology to adjust for nutrient needs.
REFERENCESAase, J.K., and D.L. Tanaka. 1984. Effects of tillage practices on soil and wheat spectral reflectances.
Agron. J. 76:814-818.
Barton, C.J. 1942. Photometric analyses of phosphate rock. Anal. Chem. 20:1068-1074.
Blackmer, Tracy M., James S. Schepers, and Gary E.Varvel. 1994. Light reflectance compared with other nitrogen stress measurement in corn leaves. Agron J. 86:934-938.
Bolin, D.W., and O.E. Stamberg. 1944. Rapid digestion method for the determination of phosphorus. Ind. Eng. Chem. Anal. Ed. 16345-346.
Bowman, William D. 1989. The relationship between leaf water status, gas exchange, and spectral reflectance in cotton leaves. Remote Sens. Environ. 30:249-255.

Page 270 1997 OSU Soil Fertility Research
Cahn M.D., J.W. Hummel, and B.H. Brouer. 1994. Spatial analysis of soil fertility for site-specific crop management. Soil Sci. Soc. Am. J. 58:1240-1248.
Chancellor, W.J., and M.A. Goronea. 1994. Effects of spatial variability of nitrogen, moisture, and weeds on the advantages of site-specific application on wheat. Trans. ASAE 37:717-724.
Everitt, J.H., A.J. Richardson, H.W. Gausman. 1985. Leaf reflectance-nitrogen-chlorophyll relations in buffelgrass. Photogram. Engin. Remote Sens. 51:463-466.
Haggar, R.J., C.J. Stent, and J.Rose. 1984. Measuring spectral differences in vegetation canopies by a reflectance ratio meter. Weed Res. 24:59-65.
Han, S., J.W. Hummel, C.E. Goering, and M.D. Cahn. 1994. Cell size selection for site-specific crop management. Trans. ASAE. 37:19-26.
Kincheloe, S. 1994. Tools to aid management: The use of site specific management. J. Soil Water Conser. 49:43-45.
Kleman, Johan, and Erik Fagerlund. 1987. Influence fo different nitrogen and irrigation treatments on the spectral reflectance of barley. Remote Sens. Environ. 21:1-14.
Lachet Instruments. 1989. Quickchem method 12-107-04-1-B. Lachat Instr. Milwaukee, WI.
Perry, C.R. Jr., and L.F. Lautenschlager. 1984. Functional equivalence of spectral vegetation indices. Remote Sens. Environ. 14:169-182.
Schepers, J.S., D.D. Francis and M.T. Tompson. 1989. Simultaneous determination of total C, total N and 15N on soil and plant material Commun. Soil Sci. Plant Anal. 20:949-959.
Stone, M.L., J.B. Solie, W.R. Raun, R.W. Whitney, S.L. Taylor and J.D. Ringer. 1996. Use of spectral radiance for correcting in-season fertilizer nitrogen deficiencies in winter wheat. Trans. ASAE 39(5):1623-1631.
Vansichen, R., and J. De Baerdemaeker. 1993. A measurement technique for yield mapping of corn silage. Agric. Eng. Res. 55:1-10.
Walburg, G., M.E. Bauer, C.S.T. Daughtry, and T.L. Housley. 1982. Effects of nitrogen nutrition on the growth, yield, and reflectance characteristics of corn canopies. Agron. J. 74:677-683.
Wibawa, Winny D., Duduzile L. Dludlu, Larry J. Swenson, David G. Hopkins, and William C. Dahnke. 1993. Variable fertilizer application based on yield goal, soil fertility, and soil map unit. J. Prod. Agric. 6:255-261.
Wollenhaupt, N.C., R.P. Wolkowski, and M.K. Clayton. 1994. Mapping soil test phosphorus and potassium for variable-rate fertilizer application. J. Prod. Agric. 7:441-448.

OSU Soil Fertility Research 1997 Page 271
Figure 1. Variability in bermudagrass forage yield, N removal and the inverse of NDVI, and weighted average trendlines, rep 2, Burneyville, OK, 1995.

Page 272 1997 OSU Soil Fertility Research
Figure 2. Correlation of total N removal versus NDVI spectral radiance readings, Ardmore and Burneyville, OK, 1996.
0.74 0.76 0.78 0.8 0.82 0.84 0.86 0.880
20
40
60
80
100
120
NDVI
N re
mov
al, k
g ha
-1
Burneyville
0.6 0.65 0.7 0.75 0.8 0.85 0.90
20
40
60
80
100
NDVI
N re
mov
al, k
g ha
-1
Ardmore
y = 245 - 817x + 695x2
r2 = 0.75
y = 3479 - 9006x + 5853x2
r2 = 0.75

OSU Soil Fertility Research 1997 Page 273
Figure 3. Variability of bermudagrass total forage yield and N removal from replication 1 and replication 2, first harvest following fertilization, Ardmore and Burneyville, OK, 1996 (coefficients of variation are listed in parentheses following treatment mean and standard deviations)
0 10 20 30 40 500
1000
2000
3000
4000
5000
6000Check 1173 + 558Variable 2634 + 509
1/2 Fixed 3183 + 748Fixed 2633 + 741
Distance, m
Fora
ge p
rodu
ctio
n, k
g ha
-1
Ardmore Rep 1
0 10 20 30 40 500
1000
2000
3000
4000
5000
6000
7000
Check 2881 + 762
Variable 4123 + 766
1/2 Fixed 3389 + 941
Fixed 3532 + 1010
Distance, m
Fora
ge p
rodu
ctio
n, k
g ha
-1
Burneyville Rep 2
Fora
ge N
rem
oval
, kg
ha-1
0 10 20 30 40 500
30
60
90
120
150
180Check 32 + 18
Variable 72 + 27
1/2 Fixed 81 + 16
Fixed 87 + 24
Distance, m
Check 46 + 12
Variable 108 + 18
1/2 Fixed 81 + 23
Fixed 87 + 29
Distance, m
Fora
ge N
rem
oval
, kg
ha-1
0 10 20 30 40 500
20
40
60
80
100
120
140
160
180

Page 274 1997 OSU Soil Fertility Research
Table 1. Initial surface (0-15 cm) soil test characteristics and soil classification, Ardmore and Burneyville, OK, 1995 and 1996.______________________________________________________________________________Location pH Total N Org. C NH4-N NO3-N P K
--------- g kg-1 --------- --------------------- mg kg-1 -------------------______________________________________________________________________________1995Burneyville 5.7 0.8 9.5 7.8 2.2 23 184Classification : Minco fine sandy loam (coarse-silty, mixed thermic Udic Haplustoll)
1996Ardmore 5.4 0.6 9.6 15.8 1.8 9 141Classification: Wilson silt loam (fine, montmorillonitic, thermic Vertic Ochraqualfs)
Burneyville 5.4 0.8 9.1 8.7 1.2 30 149Classification: Minco fine sandy loam (coarse-silty, mixed thermic Udic Haplustoll)______________________________________________________________________________pH - 1:1 soil:water, Total N and Organic C - dry combustion, NH4-N and NO3-N - 2M KCl extract, P and K - Melich III extraction.

OSU Soil Fertility Research 1997 Page 275
Table 2. Simple correlation coefficients and significance levels for forage production, total N, N removal, NDVI, red, NIR, and green spectral radiance readings, Ardmore and Burneyville, OK, 1995 and 1996.______________________________________________________________________________
Forage Yield Total N N Removalkg ha-1 g kg-1 kg ha-1
______________________________________________________________________________1995 ----------------------- R ----------------------Burneyville Prefertilization (n=53)Red -0.74 ** 0.09 -0.73 **NIR 0.55 ** 0.14 0.63 **NDVI 0.60 ** 0.09 0.66 **
1996Ardmore Prefertilization (n=60)Red -0.57 ** -0.16 -0.61 **Green -0.47 ** -0.25 -0.51 **NIR 0.12 -0.16 0.11NDVI 0.51 ** 0.11 0.54 **
Post FertilizationArdmore First Harvest (n=240)Red -0.12 0.16 -0.01Green 0.35 ** 0.13 * 0.39 **NIR 0.50 ** 0.10 0.50 **NDVI 0.59 ** 0.11 0.46 **
Ardmore Second Harvest (n=240)Red -0.48 ** -0.78 ** -0.62 **Green 0.64 ** -0.13 * 0.49 **NIR 0.88 ** 0.32 ** 0.83 **NDVI 0.76 ** 0.71 ** 0.83 **
Burneyville Prefertilization (n=60)Red -0.75 ** 0.08 -0.55 **Green -0.67 ** 0.20 -0.42 **NIR -0.03 0.10 0.02NDVI 0.72 ** 0.02 0.56 **
Post FertilizationBurneyville First Harvest (n=240)Red -0.58 ** -0.44 ** -0.60 **Green -0.06 -0.02 -0.06NIR 0.50 ** 0.55 ** 0.58 **NDVI 0.74 ** 0.68 ** 0.80 **
Burneyville Second Harvest (n=240)Red 0.02 0.18 0.06Green 0.43 ** 0.50 ** 0.49 **NIR 0.57 ** 0.57 ** 0.64 **NDVI 0.62 ** 0.50 ** 0.63 **______________________________________________________________________________**, * - significant at the 0.01 and 0.05 probability levels, respectively.

Page 276 1997 OSU Soil Fertility Research
Table 3. Post fertilization treatment means, total N and N removal by harvest, Ardmore and Burneyville, OK, 1996.______________________________________________________________________________
Harvest #1 Harvest #2Forage Yield Total N N Removal Forage Yield Total N N Removalkg ha-1 g kg-1 kg ha-1 kg ha-1 g kg-1 kg ha-1
______________________________________________________________________________Ardmore 1996Check 443 2.97 13.2 641 1.73 11.1Variable 1233 2.94 36.3 1412 2.78 39.1½ Fixed 1521 2.89 43.7 1779 2.71 47.3Fixed 1437 3.66 52.4 1638 2.90 46.6SED 406 0.73 14.3 378 0.28 9.4
Burneyville, 1996Check 1522 1.48 22.5 1013 1.64 16.7Variable 2122 2.44 51.3 1749 2.73 47.6½ Fixed 1735 2.32 40.5 1321 2.48 32.8Fixed 2438 2.49 61.4 1527 2.90 44.7SED 504 0.21 11.7 325 0.38 8.7______________________________________________________________________________SED - standard error of the difference between two equally replicated means.
Table 4. Analysis of variance and single-degree-of-freedom-contrasts for forage yield, total N, and N removal for the first harvest after fertilization, Burneyville, OK, 1995.___________________________________________________________________Source df Forage Yield Total Forage N N Removal
kg ha-1 g kg-1 kg ha-1
___________________________________________________________________-----------------------Mean Squares----------------------
Rep 1 1102499 0.04 755.4Trt 2 425725 6.62* 1534.0 Contrast
CK vs VR and FX 1 220537 17.01** 3201.2*VR vs FX 1 792263 0.33 1123.0
Error (a) 2 784408 0.35 465.8Sub-plot 26 112553 0.93 69.4Trt*Sub-plot 52 51114 0.11 43.3Error (b) 78 96904 0.07 73.7SED 254 0.22 7.0CV, % 30 11 31
Treatment Means N rate, kg ha-1
Check 0 994 2.27 22.5Variable-rate 126 949 2.80 26.4Fixed 224 1121 2.95 32.8__________________________________________________________________SED - standard error of the difference between two equally replicated means, CV -coefficient of variation, %, CK - check, VR - variable rate, FX - fixed.

OSU Soil Fertility Research 1997 Page 277
Table 5. Analysis of variance and single-degree-of-freedom-contrast for total forage yield, total N and total N removal following one fertilization, Ardmore and Burneyville, OK, 1996.______________________________________________________________________________
---------------------Ardmore---------------------- --------------------Burneyville------------------- Forage yield Total N N removal Forage yield Total N N removalSource df kg ha-1 g kg-1 kg ha-1 kg ha-1 g kg-1 kg ha-1
_________________________________________________________________________________________________ ---------------------Mean Squares-------------------
Rep 1 3498328 1.04 4343 4080200 0.02 780Trt 3 59850223* 11.73 66846* 27999374 14.74* 53002*Contrast
CK vs VR, ½ FX, FX 1 166243419** 27.24 183521** 53995684 42.39** 124996*VR vs ½ FX 1 12889391 0.17 6390 19952145 0.76 17791
VR vs FX 1 5545684 4.89 16704 2622460.22 1901
Error (a) 3 3181050 5.37 4244 8501032 0.76 9974Sub-plot 29 1095582** 0.13 786** 1162871** 0.05 642**Trt*Sub-plot 87 364644 0.25** 472 497344 0.06 463Error (b) 116 441341 0.16 363 499983 0.06 307SED 664 0.40 16 707 0.24 18
Trt Means N rate N ratekg ha-1 kg ha-1
Check 0 1085 2.18 24 0 2535 1.54 39Variable-rate 268 2645 2.85 75 87 3871 2.56 99½ Fixed 336 3300 2.77 90 168 3056 2.39 73Fixed 672 3075 3.25 99 336 3965 2.64 106_________________________________________________________________________________________________SED - standard error of the difference between two equally replicated means. CK - check, VR - variable rate, ½ FX - ½ fixed rate, FX - fixed rate, **,* - significant at the 0.01 and 0.05 probability levels, respectively.
Table 6. Range, mean, and standard deviation of soil test parameters collected every 1.5 x 2.44 m, Burneyville, OK, 1995.____________________________________________________________________________
pH Total N Org. C Total P NH4-N NO3-N P K ------ g kg-1 ----- ------------------------ mg kg-1 -----------------------
______________________________________________________________________________Min 5.1 0.4 5.4 138.8 4.6 1.2 5.7 144Max 6.2 1.3 17.3 336.5 14.7 9.0 60.4 273Mean 5.7 0.8 9.5 223.1 7.8 2.2 22.7 184Std. Dev. 0.2 0.1 2.2 38.8 1.9 1.0 12.0 25______________________________________________________________________________pH - 1:1 soil:water, Total N and Organic C - dry combustion, NH4-N and NO3-N - 2M KCl extract, K and P - Melich III extraction, Total P vanadomolybdate method, Std. Dev. - standard deviation from the mean.

Page 278 1997 OSU Soil Fertility Research
Detection Of Nitrogen And Phosphorus Nutrient Status In Bermudagrass (Cynodon Dactylon L.) Using Spectral Radiance
H. Sembiring, W.R. Raun, G.V. Johnson, M. L. Stone, J. B. Solie, H.L. Lees and S.B. Phillips
ABSTRACTNitrogen (N) and phosphorus (P) are two of the most limiting nutrients for crop production. Because of this, continued interest focuses on improving N and P use efficiency. Spectral radiance measurements were evaluated to identify optimum wavelengths for dual detection of N and P status in bermudagrass (Cynodon dactylon L.). A factorial arrangement of treatments (0, 112, 224 and 336 kg N ha-1 and 0, 29 and 58 kg P ha-1) was applied to an established bermudagrass pasture for further study using a randomized complete block design. A wide range of spectral radiance measurements (276 - 831 nm) was obtained from each plot using a PSD1000 fiber optic spectrometer, partitioned into 10 nm bands. Added indices were generated to test for correlation of N and P content with spectral radiance. The 435 nm band (430-440nm) was found to be independent of N and P treatment, and as a covariate, significantly decreased residual error. Using 435 nm as a covariate, it was found that N uptake, P uptake, and N concentration could be predicted using 695/405nm; whereas, biomass was best predicted using NDVI. However, no index reliably predicted bermudagrass forage P concentration. Spectral radiance has the potential to be used for predicting N and P nutrient status, but further work is needed to document response in different environments.
INTRODUCTION
ecent work has documented micro-variability in soil N and P, thus enhancing the potential use of sensor-based-variable-rate-technology (s-VRT) for fertilizer application. Optimizing fertilizer application using s-VRT may reduce N and P
fertilizer input cost as well as surface and ground water contamination from over fertilization.
RLight reflectance can be used to detect nutrient status in plants because plants
have strong absorption of light by chlorophyll and a high reflectance in NIR (Thomas and Oerther, 1972). In addition, organic compounds have unique absorption properties due to vibration of molecular bonds (Morra et al, 1991). However, several factors affect the reflectance such as nonuniformity of incident solar radiation, plant structure, leaf area, background reflectivity (tillage), diseases, physiological stress (Knipling, 1970), leaf thickness (Wooley, 1971), variety, weed interference, coverage and resolution. Pronounced changes occur in the visible spectra region due to a large variety of factors. Nutrient status affects crop performance and visual symptoms; therefore, the effect of fertilizer on plant growth should be detected using spectral radiance.

OSU Soil Fertility Research 1997 Page 279
There are several existing indices that have been used to predict nutrient status. In corn, nitrogen status was estimated using 550 nm wavelength (Blackmer et al, 1994) and NIR/red (Walburg et al, 1982). In winter wheat, PNSI (plant nitrogen spectral index = NIR+red/NIR-red) and NDVI (normalized difference vegetation index = NIR-red/NIR+red) have been used to predict N uptake (Stone et al., 1996). NDVI is usually used to predict biomass. Milton et al. (1991) found that P deficiency showed higher reflectance in the green and yellow portion of the electromagnetic spectrum. Little research has been done concerning the use of spectral radiance on detecting P deficiencies. The objective of this research was to identify indices for the dual detection of N and P deficiencies in bermudagrass.
MATERIALS AND METHODS
One study was conducted on an established bermudagrass (Cynodon dactylon L.) pasture near Burneyville, OK on a Minco fine sandy loam (coarse-silty, mixed thermic Udic Haplustoll). Initial soil test characteristics are reported in Table 1. An N rate x P rate factorial arrangement of treatments (0, 112, 224, and 336 kg N ha -1 with 0, 29, and 58 kg P ha-1) was evaluated in a randomized complete block experimental design with three replications. The nitrogen and phosphorus fertilizers were applied on April 18, 1996 and August 9, 1996. The plots were 3.1 x 9.1 m with 6.1 m alleys. Spectral readings and forage yields were collected on May 29, 1996 (the first harvest after the first fertilization), June 27, 1996 (the second harvest after the first fertilization), August 9, 1996 (the third harvest after the first fertilization) and September 13, 1996 (the first harvest after the second fertilization).
Spectral data was collected within each plot using a PSD1000 portable dual spectrometer manufactured by Ocean Optics Inc., from two overlapping bandwidths 276-831 nm and 650-1100nm. The fiber optic spectrometer has a spectral resolution as low as 1nm, however, all spectral readings were partitioned into 10 nm bandwidths. In addition to these spectral bands collected from each reading, the spectral indices NDVI (Normalized Difference Vegetation Index) and other combinations of single indices were generated. Total N in forage was determined using a Carlo-Erba (Milan, Italy) NA 1500 dry combustion analyzer (Schepers et al., 1989). Total P was determined using a nitric-perchloric acid digest and concentration determined as per a modified method developed by Murphy and Riley (1962). N and P uptake were calculated by multiplying N or P concentration by biomass. Individual wavelengths and combinations of wavelengths (or ratios) were used to predict agronomic responses such as N and P concentration, N and P uptake, and biomass.
Statistical analyses included regression, analysis of variance and covariance. All were performed using procedures defined in SAS (SAS institute, 1988). Since the wavelengths and indices were not consistent over time, analysis of covariance was performed. The selection criteria for covariates included no significant effect of treatment, no correlation with dependent variables and variances with normal distributions. Bandwidths which adhered to these criteria were 375, 395, 435, 445, 455, 465, 475, 485, 495, 785, 795 and 805 nm. The indices used to predict agronomic responses were chosen based on similarity in AOV.

Page 280 1997 OSU Soil Fertility Research
RESULTS AND DISCUSSION
Analysis of variance models with factorial effects of N, P and N*P are reported in Tables 2 and 3 for biomass, N, N uptake, P and P uptake for three dates where comprehensive data was collected. Similar to the first fertilization, no significant interaction of N and P was detected for the second fertilization (Tables 2 and 3) thus allowing direct interpretation of main effects of N and P independently. Forty one days following the first fertilization, a significant quadratic response to N fertilization was found for dry biomass, N concentration, N uptake, P concentration and P uptake. This result suggests that N was limiting response since increases with N rate were shown for biomass, N concentration and N uptake, P concentration and P uptake. It was interesting to find that N rate influenced P concentration in bermudagrass tissue. As N rate increased P concentration increased (Tables 2 and 3). Following 71 and 113 days from the first fertilization, a linear response to N rate was observed for N concentration and N uptake and P uptake. Tissue P concentration responded linearly to N applied 41 days following the first fertilization. A linear trend for increased N to increase biomass, N concentration, N uptake, P concentration and P uptake by the second fertilization was also observed (Table 3).
If significant differences in measured biological variables were found, we expected reflectance changes to be significant as well. However, no one index was consistently related to measured plant response over time. It was thought that the consistency of one index over multiple sampling dates could be increased using covariance. The 435 nm band (430-440nm) was found to be independent of N and P treatment, and as a covariate, significantly decreased residual error (Tables 4 and 5). This was consistent over several cuttings but results did vary with time in terms of the percentage error accounted for by the 435 nm covariate.
The indices which behaved similarly to observed differences in N concentration (means and significance of AOV) were 695/405 and NDVI. Their response was consistent with time. The effect of N rate was highly significant for N concentration as well as 695/405 and NDVI. The relationship between 695/405 and N concentration for the May 29, 1996 and September 13, 1996 dates is reported in Figures 1 and 2, respectively.
Similar to results for N concentration, 695/405 was highly correlated with N uptake (Figures 3 and 4). It was important to find a consistent, positive relationship with N uptake even when values changed significantly with time (100 kg ha-1 vs. 200 kg ha-1
from May 29 to Sept 13, 1996).No consistent index or 10 nm band was correlated with P concentration at any
sampling date. However, similar to N uptake, the index that best predicted P uptake was 695/405. This index was obviously providing good prediction of biomass since similar response in N and P uptake were observed. Correlation between 695/405 and P uptake was good for both May 29 and September 13 harvest dates (Figures 5 and 6). It is important to note that several indices were positively correlated with biomass (NDVI and 695/405). NDVI has been commonly used to predict biomass, which was consistent with what is reported here. Correlation between biomass and 695/405 is presented in Figures 7 and 8 for May 29, 1996 and Sep 13, 1996; and biomass with NDVI in Figures 9 and

OSU Soil Fertility Research 1997 Page 281
10, respectively. Using a linear model, correlation with dry biomass was consistently better using 695/405 when compared to NDVI.
REFERENCESBlackmer, T.C., J.S. Schepers and G.E. Varvel. 1994. Light reflectance compared with nitrogen stress
measurements in corn leaves. Agron. J. 86:934-938.
Knipling, E.B. 1970. Physical and physiological basis for the reflectance of visible and near-infrared radiation from vegetation. Remote Sens. of Environ. 1:155-159.
Milton, N.M., B.A. Eiswerth and C.M. Ager. 1991. Effect of phosphorous deficiency on spectral reflectance and morphology of soybean plants. Remote Sens. Environ. 36:121-127.
Morra, J.M., M.H. Hall and L.L. Freeborn. 1991. Carbon and nitrogen analysis of soil fraction using near infrared reflectance spectroscopy. Soil Sci. Soc. Am. J. 55:288-291.
Murphy, J., and J.P. Riley. 1962. A modified single solution method for the determination of phosphate in natural waters. Anal. Chim. Acta. 27:31-36.
SAS Institute. 1988. SAS/STAT Procedures. Release 6.03 ed. SAS Inst., Cary, NC.
Schepers, J.S., D.D. Francis, and M.T.Thompson. 1989. Simultaneous determination of total C, total N, and 15N on soil and plant material. Soil Sci. Plant Anal. 20:949-959.
Stone, M.L., J.B. Solie, W.R. Raun, R.W. Whitney, S.L.Taylor and J.D. Ringer. 1996. Use of spectral radiance for correcting in-season fertilizer nitrogen deficiencies in winter wheat. Trans. ASAE 39(5):1623-1631.
Thomas, J.R. and G.F. Oerther. 1972. Estimating nitrogen content of sweet pepper leaves by reflectance measurements. Agron. J. 64:11-13.
Walburg, G., M.E. Bauer, C.S.T. Daughtry and T.L.Housley. 1982. Effects of nitrogen nutrition on the growth, and reflectance characteristics of corn canopies. Agron. J. 74:677-683.
Wooley, J.T. 1971. Reflectance and transmittance of light by leaves. Plant Physiol. 47:656-662.
Table 1. Initial surface (0 - 15cm) soil test characteristics, Burneyville, OK 1996
Characteristics Method Unit ValuepH 1:1 soil:H2O 5.68
Organic Carbon Dry Combustion g kg-1 9.564Total Nitrogen Dry Combustion g kg-1 0.872
NH4-N Lachat Mg kg-1 13.1NO3-N Lachat Mg kg-1 6.4
P Mehlich-3. Mg kg-1 23.8K Mehlich-3. Mg kg-1 163.5

OSU Soil Fertility Research 1997 Page 282
Table 2. Analysis of variance for forage total N, N uptake, total P, P uptake for May 29 and June 27, Burneyville OK., 1996
Last fertilization: April 18, 1996Harvest: May 29, 1996
Last fertilization: April 18, 1996 Harvest: June 27, 1996
Biomass N N uptake P P Uptake Biomass N N uptake P P uptakeMean Squares
Rep ns ns ns ns ns ns ** ns *** nsN rate *** *** *** *** *** ns *** ** *** *P rate ns ns ns ** ns ns ns ns ns nsNxP ns ns ns ns ns ns ns ns ns nsResidual 207216.9 1.5 80.92 15433.9 0.755 1256671.0 3.4 711.1 65790.3 9.8CV, % 17.8 5.7 16.0 6.4 17.1 40.7 7.1 37.7 8.9 39.6N lin *** *** *** *** *** ns *** *** *** **N quad *** ** *** ** *** ns ns ns ** nsP lin ns ns ns *** ns ns * ns ns nsP quad ns ns ns Ns ns ns ns ns ns ns
MeansN rate, kg ha-1 kg ha-1 g kg-1 kg ha-1 mg kg-1 kg ha-1 kg ha-1 g kg-1 kg ha-1 mg kg-1 kg ha-1
0 1667.4 14.4 24.6 1597.1 2.7 2150.8 18.3 38.8 2265.4 4.9112 2737.6 20.3 55.4 1902.3 5.2 2896.6 22.5 65.4 2713.4 7.8224 3042.9 23.8 71.4 2137.1 6.4 3131.9 29.1 86.6 3314.2 9.8336 2780.8 26.6 72.8 2131.4 5.9 2820.9 32.9 91.8 3224.4 9.2SED 214.6 0.6 4.2 58.6 0.4 528.4 0.9 12.6 120.9 1.5
P rate, kg ha-1
0 2480.8 21.2 53.9 1823.4 4.6 2652.1 26.4 69.3 2828.6 7.529 2632.8 21.3 59.0 1967.1 5.3 2728.0 26.0 72.2 2972.3 8.258 2558.0 21.2 55.2 2035.4 5.3 2869.9 24.7 70.5 2837.2 8.1SED 185.8 0.5 3.7 50.7 0.4 457.6 0.7 10.9 104.7 1.3
*, **, *** Significant at the 0.05, 0.01, and 0.001 probability levels, respectively.ns = not significant; SED = standard error difference between two equally replicated means

OSU Soil Fertility Research 1997 Page 283
Table 3. Analysis of variance for forage total N, N uptake, total P, P uptake for August 9 and Sept 13, Burneyville OK, 1996
Last fertilization April 18, 1996 Harvest: August 9, 1996
Last fertilization August 9, 1996 Harvest: Sept 13, 1996
Biomass N N uptake P P uptake Biomass N N uptake P P uptakeMean Squares
Rep ns ns Ns ns ns ns ns ns ns nsN rate ns *** *** *** ** *** *** *** *** ***P rate ns ns Ns ns ns ns ** ns ns nsNxP ns ns Ns ns ns ns ns ns ns nsResidual 898846.3 1.9 402.3 119479.1 15.5 1913863.5 1.2 946.4 105319.2 17.0CV, % 18.1 7.4 20.5 9.0 19.5 23.8 5.1 24.2 9.0 19.6N lin ns *** *** *** ** ** *** *** *** ***N quad ns ns ns ns ns ** * ** *** **P lin ns ns ns ns ns ns * ns ns nsP quad ns ns ns ns ns ns * ns ns ns
MeansN rate, kg ha-1 kg ha-1 g kg-1 kg ha-1 mg kg-1 kg ha-1 kg ha-1 g kg-1 kg ha-1 mg kg-1 kg ha-1
0 4765.2 14.1 67.7 3285.5 16.0 3702.6 16.9 62.5 3095.2 11.5112 5583.4 17.8 97.9 3662.1 20.4 6931.6 20.7 143.1 3251.9 22.4224 4885.2 20.5 98.0 4092.7 19.9 6267.6 23.2 142.9 4026.0 24.9336 5762.3 22.4 126.7 4237.6 24.6 6386.5 25.2 159.8 4059.5 25.3SED 446.9 0.7 9.5 162.9 1.9 652.1 0.5 14.5 153.0 1.9
P rate, kg ha-1
0 4986.9 19.1 93.9 3837.4 19.4 5504.2 22.3 124.6 3574.5 19.629 5273.0 18.4 95.9 3762.8 20.2 5912.4 20.8 126.6 3588.5 21.758 5487.3 18.6 103.1 3858.2 21.1 6049.5 21.3 129.9 3661.5 21.9SED 387.1 0.6 8.2 141.1 1.6 564.8 0.4 12.6 132.5 1.7
*, **, *** Significant at the 0.05, 0.01, and 0.001 probability levels, respectively.ns = not significant; SED = standard error difference between two equally replicated means

OSU Soil Fertility Research 1997 Page 284
Table 4. Analysis of variance for selected indices from various readings using 435 nm as covariance for reading on May 29 and June 27, Burneyville OK, 1996
Sources of variation 725/535 695/405 NDVI PNSI 805/695May 29, 1996 Mean squares
Rep *** ns ns ns nsNrate ** *** *** *** ***Prate * ns ns ns nsNxP Ns ns ns ns nsw435 *** ns ns ns nsNlin *** *** *** *** ***Nquad Ns *** ** ** *Plin * ns ns ns nsPquad ns ns ns ns nsError 0.00323359 0.00333341 0.0002131 0.00256278 0.01934773CV, % 2.0 2.5 2.7 2.7 4.1
N rate, kg ha-1 Means
0 2.765 2.427 0.513 1.949 3.116112 2.871 2.254 0.549 1.822 3.438224 2.860 2.242 0.549 1.823 3.440336 2.900 2.229 0.555 1.801 3.500SED 0.027 0.027 0.007 0.024 0.066
P rate, kg ha-1
0 2.810 2.297 0.534 1.872 3.29929 2.865 2.293 0.545 1.839 3.40858 2.872 2.275 0.546 1.836 3.413SED 0.023 0.024 0.006 0.021 0.057
June 27, 1996 Mean squaresRep ns ns ns ns nsNrate ns * ns ns nsPrate ns ns ns ns nsNxP ns ns ns ns nsw435 *** ns ns ns *Nlin ns * * ns *Nquad ns * ns ns nsPlin * ns ns ns nsPquad ns ns ns ns nsError 0.00550089 0.01445946 0.00176798 0.03145814 0.1134118CV, % 3.2 4.9 8.1 9.1 10.6
N rate, kg ha-1 Means0 2.892 2.584 0.487 2.080 2.942112 3.033 2.386 0.523 1.923 3.215224 3.080 2.439 0.528 1.909 3.265336 3.057 2.417 0.530 1.906 3.295SED 0.035 0.057 0.028 0.084 0.159
P rate, kg ha-1
0 2.301 2.461 0.501 2.026 3.06529 2.328 2.456 0.520 1.939 3.19458 2.380 2.452 0.529 1.899 3.279SED 0.030 0.049 0.024 0.72 0.137
*, **, *** Significant at the 0.05, 0.01, and 0.001 probability levels, respectively.ns = not significant; SED = standard error difference between two equally replicated means

OSU Soil Fertility Research 1997 Page 285
Table 5. Analysis of variance for selected indices from various readings using 435 nm as covariance for reading on August 9, and Sept 13, Burneyville OK, 1996
Sources of variation 725/535 695/405 NDVI PNSI 805/695August 9, 1996 Mean
squaresRep ns ns Ns ns nsNrate ns * Ns ns nsPrate ns ns Ns ns nsNxP ns ns Ns ns nsw435 * *** ** ** **Nlin ns ** Ns ns nsNquad ns ns Ns ns nsPlin ns ns Ns ns nsPquad ns ns Ns ns nsError 0.01078132 0.0027265 0.00006177 0.34545796 0.00040872CV, % 6.5 1.1 6.7 6.8 1.6
N rate, kg ha-1 Means0 1.628 4.573 0.119 8.548 1.270112 1.627 4.569 0.120 8.347 1.273224 1.582 4.540 0.116 8.708 1.263336 1.576 4.496 0.115 8.806 1.259SED 0.050 0.025 0.004 0.277 0.009
P rate, kg ha-1
0 1.592 4.551 0.116 8.683 1.26329 1.579 4.535 0.117 8.603 1.26458 1.639 4.548 0.119 8.521 1.271SED 0.042 0.021 0.003 0.240 0.008
September 13, 1996 Mean squares
Rep ns ns ns ns nsNrate *** *** *** *** ***Prate ns ns ns ns nsNxP ns ns ns ns nsw435 *** *** *** *** ***Nlin ** *** *** *** ***Nquad *** *** *** *** ***Plin ns ns ns ns nsPquad ns ns ns ns nsError 0.00074845 0.00853740 0.00032166 0.00247958 0.08893813CV, % 1.0 4.1 2.8 3.2 6.2
N rate, kg ha-1 Means0 2.576 2.600 0.585 1.720 3.901112 2.630 2.128 0.669 1.503 5.164224 2.631 2.141 0.669 1.499 5.111336 2.615 2.187 0.660 1.517 4.931SED 0.129 0.014 0.003 0.023 0.141
P rate, kg ha-1
0 2.627 2.277 0.641 1.574 4.70929 2.603 2.279 0.645 1.561 4.73458 2.609 2.236 0.652 1.545 4.887SED 0.011 0.012 0.002 0.020 0.122
*, **, *** Significant at the 0.05, 0.01, and 0.001 probability levels, respectively.ns = not significant; SED = standard error difference between two equally replicated means.

OSU Soil Fertility Research 1997 Page 286
Figure 1. Correlation between N concentration and 695/405 on May 29, 1996
y = -33.304x + 97.474R2 = 0.5226
0
5
10
15
20
25
30
2 2.2 2.4 2.6695/405
Fora
ge N
, g k
g-1
Figure 3. Correlation between 695/405 and N uptake on May 29, 1996
y = -180.83x + 469.86R2 = 0.7133
0
20
40
60
80
100
120
2 2.2 2.4 2.6695/405
N up
take
, kg
ha-1
Figure 2. Correlation between N concentration and 695/405 on Sept 13, 1996
y = -7.4086x + 38.094R2 = 0.3083
0
5
10
15
20
25
30
1.8 2.3 2.8 3.3695/405
Fora
ge N
, g k
g-1
Figure 4. Correlation between N uptake and 695/405 on Sept 13, 1996
y = -145.25x + 450.5R2 = 0.7221
0
50
100
150
200
250
1.8 2.3 2.8 3.3695/405
N up
take
, kg
ha-1
Figure 5. Correlation between P uptake and 695/405 on May 29, 1996
y = -14.845x + 39.053R2 = 0.6973
0
2
4
6
8
10
2 2.1 2.2 2.3 2.4 2.5 2.6695/405
P up
take
, kg
ha-1
Figure 6. Correlation between P uptake and 695/405 on Sept 13, 1996
y = -22.241x + 70.793R2 = 0.6768
0
5
10
15
20
25
30
35
1.5 1.8 2.1 2.4 2.7 3695/405
P up
take
, kg
ha-1
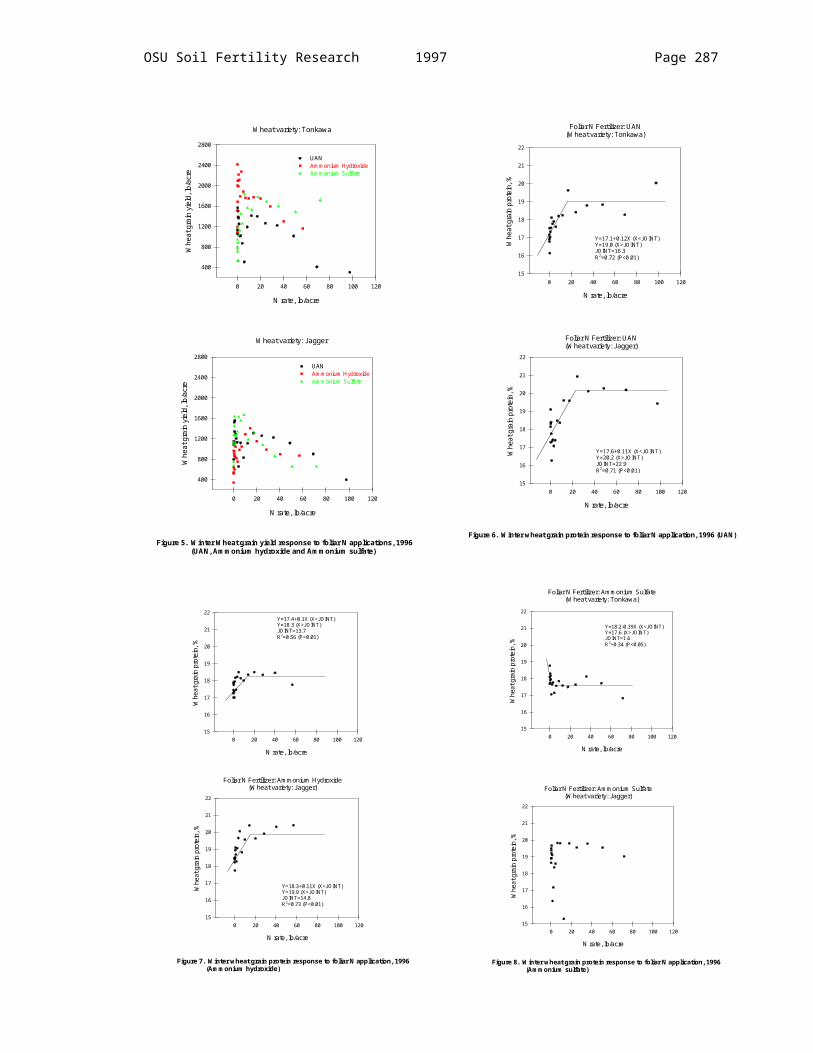
OSU Soil Fertility Research 1997 Page 287
Figure 9. Correlation between biomass and NDVI on May 29, 1996
y = 24017x - 10453R2 = 0.5657
0
1000
2000
3000
4000
5000
0.45 0.5 0.55 0.6NDVI
Biom
ass,
kg
ha-1
Figure 10. Correlation between biomass and NDVI on Sept 13, 1996
y = 23592x - 9617.9R2 = 0.5631
0
2000
4000
6000
8000
10000
12000
0.45 0.55 0.65 0.75 0.85NDVI
Biom
ass,
kg
ha-1
Figure 7. Correlation between biomass and 695/405 on May 29, 1996
y = -5568.9x + 15301R2 = 0.657
0
500
1000
1500
2000
2500
3000
3500
4000
4500
2 2.2 2.4 2.6695/405
Biom
ass,
kg
ha-1
Figure 8. Correlation between biomass and 695/405 on Sept 13, 1996
y = -5398.3x + 17850R2 = 0.603
0
2000
4000
6000
8000
10000
12000
1.5 1.7 1.9 2.1 2.3 2.5 2.7 2.9 3.1695/405
Biom
ass,
kg
ha-1

OSU Soil Fertility Research 1997 Page 288
Detection Of Nitrogen And Phosphorus Nutrient Status In Winter Wheat (Triticum Aestivum L.) Using Spectral Radiance
H. Sembiring, W.R. Raun, G.V. Johnson, M. L. Stone, H.L. Lees, E.V. Lukina, S.B. Philips and J. B. Solie
ABSTRACTNitrogen (N) and phosphorus (P) are major limiting nutrients for crop production and continued interest lies in improving their use efficiency. Spectral radiance measurements were evaluated to identify optimum wavelengths for dual detection of nitrogen and phosphorus status in winter wheat (Triticum aestivum L.). A factorial arrangement treatments of N and P (0, 56, 112 and 168 kg N ha -1 and 0, 14.5 and 29 kg P ha-1) was used to further study N and P uptake and associated spectral properties at Perkins and Tipton, Oklahoma. A wide range of spectral radiance measurements (345-1145 nm) were obtained from each plot using a PSD1000 fiber optic spectrometer. At each reading date, 78 bands and 40 combination indices were generated to test for correlation with forage biomass and N and P uptake. For this study, simple numerator/denominator indices were useful in predicting wet and dry biomass. Numerator wavelengths that ranged between 705 and 735 nm and denominator wavelengths between 505 and 545 nm provided reliable prediction of wet and/or dry biomass over locations and Feekes growth stages 4 through 6.
INTRODUCTION
ater contamination and the economic importance of this problem has led to the need for improved nitrogen (N) and phosphorus (P) fertilizer management. Due to the significance that N and P fertilizers have on crop
production, application of these two fertilizers often exceed the recommended rate. A quick method to determine the status of N and P in wheat plant tissue could be valuable to improve N and P fertilizer management practices.
WUse of spectral radiance as a tool to determine the nutrient status in plants has
several advantages compared to other non-destructive methods. Spectral radiance measurements can be obtained without attaching the meter to a specific leaf and many readings can be acquired in a short time thus reducing variability (Blackmer et al., 1994). In addition, sensors combined with other technologies such as GIS and GPS should be able to make local specific fertilizer recommendations (Schepers, 1994). Therefore, undesired environmental effects associated with excess fertilization can be reduced.
Some indices have been proposed to predict biological growth (biomass) and nutrient status. The normalized pigment chlorophyll index (NPCI = Reflectance at 430 nm (R430) - reflectance at 680 nm (R680)/(R680+R430)) was recently used to predict carotenoid/Chl A ratio (Penuelas et al., 1993). Similarly, the normalized difference vegetation index (NDVI = NIR-red/NIR+red) has provided good correlation with dry

OSU Soil Fertility Research 1997 Page 289
biomass (Mahey et al., 1991 and Penuelas et al., 1993). Also, moisture in leaves can be predicted at 1300 and 2400 nm (Kleman and Fagerlund, 1987). However, less has been done concerning the use of spectral radiance measurements for detecting plant P deficiencies. Therefore, the objectives of this study were (1) to identify the optimum sensor and reflectance wavelength for detecting dual N and P deficiencies in winter wheat, (2) to identify the ideal stage of growth for detecting N and P deficiencies and (3) to determine the use of spectral radiance on N*P interactions.
MATERIALS AND METHODS
Two field experiments were conducted at Tipton (Tillman-Hollister clay loam, fine-loamy, mixed, thermic, Pachic Argiustoll) and Perkins (Teller sandy loam, fine-loamy, mixed, thermic Udic Argiustoll), Oklahoma. Soil characteristics at each of these locations are reported in Table 1. A factorial arrangement of treatments for N and P rate was used at each location (0, 56, 112, and 168 kg N ha-1 with 0, 14.5, and 29 kg P ha-1). The experimental design was a randomized complete block with three replications. The plot size was 3.1 m x 9.1 m. Spectral readings and forage yield were collected at Feekes growth stages 4, 5, 6 and 9 for Tipton and 5, 6 and 7 at Perkins (Large, 1954).
A wide range of spectral radiance measurements (300 to 1100 nm) were obtained from each plot using a PSD1000 portable dual spectrometer manufactured by Ocean Optics Inc., from two overlapping bandwidths, 300-850nm and 650-1100nm. The PSD1000 was connected to a portable computer through a PCMCIA slot using a PCM-DAS 16D/12 A/D converter manufactured by Computer Boards Inc.. The fiber optic spectrometer has spectral resolution as low as 1nm, however, all spectral readings were partitioned into 10 nm bandwidths (78 spectral bands per reading). Individual wavelengths (78 bands) and combinations of wavelengths (40 combination indices) were used to predict biological responses. Various combinations of these wavelengths (Table 2) were evaluated to determine the proper indices for predicting wet biomass, dry biomass, total N uptake, total P uptake, and total N and P concentration in winter wheat forage. In this report only wet biomass and dry biomass data are reported. All spectral radiance readings were standardized using a barium sulfate (BaSO4) background reading. Statistical analysis were performed using SAS (SAS institute, 1988).
RESULTS AND DISCUSSION
At both sites, a significant increase in wheat forage yield due to applied N was observed (Tables 3 and 4). A response to applied P was not found at Tipton but was significant at Perkins. No N*P interaction was detected at either location. The lack of a P response at Tipton was partly due to high inorganic soil test P (Table 1). The main effect of growth stage was significant at both sites, a result of increased biomass with advancing age.
Using data combined over all growth stages, the best three indices (single and multi-wavelength combinations) to predict N rate, P rate, wet biomass, dry biomass and moisture were determined (Table 5). No one index, either single or multi-wavelength combination was consistent over time (Table 5) in being correlated with N rate, P rate, wet and/or dry biomass. Data partitioned by growth stage for every location is presented

Page 290 1997 OSU Soil Fertility Research
in Tables 6 (Tipton) and 7 (Perkins). No single index or wavelength demonstrated consistent correlation with the dependent variables.
The indices that could be used to predict N rate varied (Table 5-7). The highest correlation at Tipton was found at Feekes 5 with the index w715/545. Correlation tended to increase from Feekes 4 to Feekes 7. At Feekes 4 at Tipton, no index was significant to predict N rate, but improved at later stages of growth. This indirectly suggests that percent foliage cover was critical in the establishment of indices for N status in winter wheat since the percent coverage was low when the first readings were taken at Tipton.In general, correlation of indices to predict P-rate at Tipton were lower than at Perkins. Using all data (Table 5) over growth stages, no index could be used to predict P-rate at Tipton, however, at Perkins, P-rate could be predicted using w705/535, w705/545 and w705/525. However, this was not consistent over stage of growth.
There were several indices that reliably predicted wet biomass including w705/505, w715/515 and w715/505 at Tipton. At Perkins, 735/665, NPCIX and w735/655 provided good prediction of wet biomass. NDVI has been commonly used to predict biomass in various studies (Mahey et al, 1991 and Penuelas et al. 1993). However, we did not observe consistent correlation between NDVI and wet biomass. Beginning at Feekes 5 (Table 6), NDVI was highly correlated with wet biomass, suggesting that topdress applications (based on growth) could be applied at this time, given that a yield response was achieved.
Similar to wet biomass, dry biomass correlation with several indices increased with advancing stage of growth. This same trend was found in an earlier study in wheat using NDVI. Combined over growth stage, w705/515 and NPCIX were better predictors of dry biomass at Tipton and Perkins, respectively (Table 5).
Using all data combined over growth stages, the highest correlation coefficient for predicting moisture was with w795/735 at Tipton and w705/505 for Perkins (Table 5). Analysis by growth stage suggested that moisture in plants could not be adequately predicted until Feekes 5. The same observation was noted for biomass, indicating that a critical amount of coverage is needed in order to override background soil interference. Results at Perkins were not consistent with observations at Tipton. At Perkins, moisture could be detected at earlier growth stages but not at later stages.
This work demonstrates the difficulty in identifying constant indices that can be used over time for predicting chemical and biological parameters. One particular index is sometimes good at a given reading but not for others. Some of the problems encountered with using spectral properties to predict biological properties of plants include, light intensity, weed pressure, clouds and the sensitivity of the sensor in capturing the images of the plant canopy. In addition, part of the problem might be the resolution at which sensed data is collected.
REFERENCES
Blackmer, T.C., J.S. Schepers and G.E. Varvel. 1994. Light reflectance compared with nitrogen stress measurements in corn leaves. Agron. J. 86:934-938.
Kleman, J. and E. Fagerlund. 1987. Influence of different nitrogen and irrigation treatments on spectral reflectance of barley. Remote Sens. Environ. 21:1-14.

OSU Soil Fertility Research 1997 Page 291
Mahey, R.K., R. Singh, S.S. Sidhu and R.S. Narang. 1991. The use of remote sensing to assess the effects of water stress on wheat. Expl. Agric. 27:243-429.
Large, E.C. 1954. Growth stages in cereals. Plant Pathol. 3:128-1631.
Penuelas, J., J.A. Gamon, K.L. Griffin and C.B. Field. 1993. Assessing community type, plant biomass, pigment composition, and photosynthetic efficiency of aquatic vegetation from spectral reflectance. Remote Sens. Environ. 46:110-118.
SAS Institute. 1988. SAS/STAT Procedures. Release 6.03 ed. SAS Inst., Cary, NC.
Schepers, J.S. 1994. New diagnostic tools for tissue testing. Commun. Soil Sci. Plant Anal. 25:817-826.
Stone, M.L., J.B. Solie, W.R. Raun, R.W. Whitney, S.L.Taylor and J.D. Ringer. 1996. Use of spectral radiance for correcting in-season fertilizer nitrogen deficiencies in winter wheat. Trans. ASAE 39(5):1623-1631.
Table 1. Initial surface (0 - 15cm) soil test characteristics at Tipton and Perkins, OK, 1996Characteristics Method Unit Tipton PerkinspH 1:1 soil:H2O - 7.81 5.95Organic Carbon Dry Combustion g kg-1 7.158 5.336Total Nitrogen Dry Combustion g kg-1 0.719 0.504NH4-N Lachat mg kg-1 3.00 3.04NO3-N Lachat mg kg-1 4.02 2.83P Mehlich-3. mg kg-1 43.96 8.99K Mehlich-3. mg kg-1 464.5 133.0
Table 2. Combinations of multi-wavelength indices tested for winter wheat forage spectral radiance readings collected at Perkins and Tipton OK.___________________________________________________________________________________NPCIX1= (w685 - w435)/(w685 + w435), NPCIX2 = (w675 - w425)/(w675 + w425), NPCIX = (npci1 + npci2)/2, NW1= w975-w905, NW2 = w965-w895, NW=(wbi1+wbi2)/2, PRI1 = (w555-w535)/(w555+w535), PRI2 =(w545-w525)/(w545+w525), PRI = (pri1+pri2)/2, GR = (w515+w525+w535+w545)/4, PNSI = (w805+w695)/(w805-w695), NDVI = (w805-w695)/(w805+w695), nirgi = w795/(1/w545), NR= w805/w695, w735/665=w735/w665, w405_635=w405/w635, w805_415 = w805/w415, w795_735 = w795/w735, w735_655 = w735/w655, w705_505 = w705/w505, w705_515 = w705/w515, w705_525 = w705/w525, w705_535 = w705/w535,w705_545 = w705/w545, w715_505 = w715/w505, w715_515 = w715/w515,w715_525 = w715/w525, w715_535 = w715/w535, w715_545 = w715/w545, w725_505 = w725/w505, w725_515 = w725/w515, w725_525 = w725/w525,w725_535 = w725/w535, w725_545 = w725/w545, w735_505 = w735/w505; w735_515 = w735/w515, w735_525 = w735/w525, w735_535 = w735/w535, w735_545 = w745/w545, w725_715 = w725/w715, w735_715 = w735/w715, w785_505 = w785/w505, w695_405 = w695/w405, w405_635 = w405/w635.______________________________________________________________________

Page 292 1997 OSU Soil Fertility Research
Table 3. Analysis of variance for biomass and moisture, Tipton OK, 1996-97________________________________________________________________________________________Source of variation df Wet biomass Dry Biomass Moisture
Mean Squares________________________________________________________________________________________Rep 2 4368840.2 696752.66 23.9027N rate 3 392141534.8*** 59850694.95*** 204.439**P rate 2 11439514.9 1543152.35 21.8262N*P 6 5644164.4 1353685.78 6.4501Error a 22 9267263.8 1630114.59 33.9216Growth stage (GS) 3 1386871114.9*** 296575532.96*** 6978.5588***GS*Nrate 9 103640794.9*** 16302299.73*** 145.9742***GS*Prate 6 6226289.3 1105656.19 9.9789GS*Nrate*Prate 18 4920259.3 1261777.75 15.6189Residual error 72 8733477.5 1577046.70 17.3036
MeansN rate, kg ha-1 --------------- kg ha-1 ---------------- ---%---
Feekes 4 0 4113.29 2112.10 49.2156 4894.48 2425.54 50.48112 4267.60 2165.15 49.34168 5019.86 2502.70 49.83
Feekes 5 0 3631.08 1745.62 51.8156 4301.36 1967.44 53.82112 4667.84 2145.86 53.51168 5169.35 2478.59 51.49
Feekes 6 0 6374.88 4701.60 23.9956 10560.51 6987.30 31.92112 18039.67 10517.11 40.62168 18111.99 10526.75 41.71
Feekes 9 0 9369.44 3071.71 67.2156 12899.25 4050.61 68.58112 21362.13 6601.52 69.06168 23141.50 7083.74 69.29
SED 1393.12 591.99 1.96________________________________________________________________________________________
*, **, *** Significant at the 0.05, 0.01, and 0.001 probability levels, respectively. SED = standard error difference between two equally replicated means

OSU Soil Fertility Research 1997 Page 293
Table 4. Analysis of variance for biomass, Perkins OK, 1996-97___________________________________________________________________________________________Source of variation df Wet biomass Dry Biomass Moisture
Mean Squares___________________________________________________________________________________________
Rep 2 167452144.1* 6841794.00** 3.908N rate 3 1110990913.4*** 23664177.78*** 151.702**P rate 2 478166108.5*** 17683819.52*** 61.678N*P 6 102844108.9 1985602.88 5.514Error a 22 376525306.4 1045833.13 21.625Growth Stage (GS) 2 1583596064.8*** 43186308.98*** 2624.358***GS*N rate 6 171391250.5*** 3294202.28** 114.162***GS*Prate 4 8204487.2** 3627620.31** 146.533***GS*Nrate*Prate 12 88528168.6 660601.30 19.113Residual error 48 241953388.3 749320.74 16.362
MeansN rate, kg ha-1 --------------- kg ha-1 ---------------- ---%---
Feekes 5 0 3418.91 1692.57 51.0956 5227.21 2150.67 57.36112 7078.92 2695.58 61.04168 7421.29 2338.74 66.33
Feekes 6 0 4913.77 1287.51 73.8156 7802.24 2006.01 74.21112 11423.67 2724.51 75.59168 14900.45 3775.74 75.55
Feekes 7 0 9673.23 2705.23 72.0956 12116.14 3312.82 73.26112 18685.83 5183.81 72.35168 20050.50 5680.49 71.89
SED 7332.63 408.06 1.91
MeansP rate, kg ha-1 --------------- kg ha-1 ---------------- ---%---
Feekes 5 0 4889.66 2180.82 53.6114.5 5490.19 2173.58 59.0429 6980.06 2303.78 64.22
Feekes 6 0 7048.78 1645.56 75.4014.5 8640.09 2184.43 74.2929 13591.23 3515.35 74.69
Feekes 7 0 12370.99 3334.52 73.5614.5 14314.55 3916.79 72.5529 18708.74 5410.45 71.29
SED 6350.24 353.39 1.65___________________________________________________________________________________________
*, **, *** Significant at the 0.05, 0.01, and 0.001 probability levels, respectively. SED = standard error difference between two equally replicated means

Page 294 1997 OSU Soil Fertility Research
Table 5. The best spectral radiance measures for predicting N rate, P rate, wet biomass, dry biomass and mositure from data combined over growth stages at Tipton and Perkins OK, 1996-97.
TIPTON PERKINSSinggle wavelength 1 2 3 1 2 3N rate W795
0.13138(0.1165)
w8050.13861(0.00976)
w7550.12595(0.1325)
w7450.58795(0.0001)
w635-0.50142(0.0001)
w625-0.49548(0.0001)
P rate W8050.0336(0.6893)
w8250.03301(0.6945)
w7950.03306(0.6941)
w665-0.26892(0.0049)
w675-0.26221(0.0049)
w655-0.26585(0.0054)
Wet Biomass W575-0.45293(0.0001)
w585-0.45255(0.0001)
w535-0.45181(0.0001)
w685-0.81457(0.0001)
w675-0.81335(0.0001)
w665-0.81013(0.0001)
Dry biomass W435-0.72607(0.0001)
w425-0.72492(0.0001)
w655-0.72489(0.0001)
w685-0.68412(0.0001)
w695-0.68352(0.0001)
w675-0.68094(0.0001)
Moisture W3450.80618(0.0001)
w3550.80535(0.0001)
w3650.8029(0.0001)
w375-0.7616(0.0001)
w1145-0.75754(0.0001)
w375-0.75677(0.0001)
Combination 1 2 3 1 2 3N rate W805/415
0.34598(0.0001)
w735/5150.354(0.0001)
w725/5050.32625(0.0001)
w725/5250.68502(0.0001)
w725/5350.67856(0.0001)
w735/5250.6755(0.0001)
P rate w735/655-0.10762(0.1992)
735/665-0.10673(0.2029)
PNSI-0.08905(0.2885)
w705/535-0.34858(0.0002)
w705/545-0.34744(0.0002)
w705/525-0.33181(0.0005)
Wet Biomass w705/5050.60158(0.0001)
w715/5050.58621(0.0001)
w715/5150.50834(0.0001)
735/6650.91322(0.0001)
NPCIX-0.90999(0.0001)
w735/6550.90104(0.0001)
Dry biomass w705/5150.68415(0.0001)
pri10.67914(0.0001)
w705/5450.66926(0.0001)
NPCIX-0.84064(0.0001)
735/6650.82017(0.0001)
w735/6550.80008(0.0001)
Moisture w795/7350.76862(0.0001)
w785/5050.70083(0.0001)
w705/535-0.66325(0.0001)
w705/5050.63476(0.0001)
w715/5050.63399(0.0001)
w715/5150.59326(0.0001)
wXXX or wXXX/XXX = index combination using specified bandwidth0.18915 = Correlation coeficient (0.2692) = probability >|R|

OSU Soil Fertility Research 1997 Page 295
Table 6. The best spectral radiance measures for predicting N rate, P rate, wet biomass, dry biomass, and moisture, by growth stage at Tipton OK. 1996-97
Growth Stage 4 Growth Stage 5 Growth Stage 6 Growth Stage 9Single wavelength 1 2 3 1 2 3 1 2 3 1 2 3N rate w345
0.18915(0.2692)
w3550.17944(0.295)
w3650.16742(0.3291)
w1095-0.92014(0.0001)
w1085-0.9201(0.0001)
w565-0.91982(0.0001)
w685-0.86759(0.0001)
w675-0.86483(0.0001)
w665-0.86474(0.0001)
w625-0.84157(0.0001)
w635-0.84076(0.0001)
w695-0.84006(0.0001)
P rate w10350.16068(0.3492)
w10450.15576(0.3643)
w1145-0.13514(0.432)
w915-0.21139(0.2159)
w925-0.20139(0.2389)
w795-0.19027(0.2663)
w10850.08392(0.6265)
w10950.08364(0.6277)
w11050.07908(0.6466)
w4450.03114(0.8569)
w1005-0.03044(0.8601)
w985-0.02837(0.8695)
Wet Biomass w7350.19301(0.20414)
w7450.19569(0.2527)
w7250.18374(0.2834)
w345-0.49744(0.002)
w7450.47978(0.0031)
w7550.47944(0.0031)
w635-0.78207(0.0001)
w625-0.78004(0.0001)
w645-0.78003(0.0001)
w695-0.89895(0.0001)
w625-0.89634(0.0001)
w615-0.89614(0.0001)
Dry biomass w7450.20414(0.2324)
w7350.19966(0.243)
w7250.18806(0.272)
w7550.49719(0.002)
w7450.494(0.0022)
w345-0.47776(0.0032)
w635-0.78188(0.0001)
w645-0.78033(0.0001)
w625-0.77992(0.0001)
w505-0.89691(0.0001)
w625-0.89454(0.0001)
w615-0.89421(0.0001)
Moisture w10550.15817(0.3569)
w10250.007478(0.6647)
w10250.0074780.6647
w355-0.13453(0.4341)
w365-0.13102(0.4463)
w435-0.12861(0.4547)
w635-0.82413(0.0001)
w645-0.82349(0.0001)
w655-0.82206(0.0001)
w7450.68637(0.0001)
w7650.67376(0.0001)
w7750.67443(0.0001)
Combination 1 2 3 1 2 3 1 2 3 1 2 3N rate 735/665
0.25546(0.1326)
w735/545-0.25489(0.1336)
w785/505-0.25161(0.1388)
w715/5450.92254(0.0001)
w725/5450.9252(0.0001)
w725/7150.91961(0.0001)
w735/545-0.89003(0.0001)
w725/715-0.88367(0.0001)
w735/715-0.88153(0.0001)
NDVI0.88195(0.0001)
w735/7150.8742(0.0001)
w735/5250.86949(0.0001)
P rate w735/655-0.21561(0.2066)
735/665-0.21385(0.2104)
w805/4150.18178(0.2887)
w795/735-0.19322(0.2589)
PSNI-0.18494(0.2802)
NW0.15971(0.3521)
pri20.24767(0.1453)
NPCIX10.18003(0.2934)
pri0.13254(0.441)
w705/525-0.17445(0.3089)
w705/515-0.10269(0.5512)
w705/505-0.08342(0.6286)
Wet Biomass NDVI-0.21585(0.2061)
w725/5050.20775(0.2241)
w725/5150.20649(0.2269)
w725/7150.4862(0.0026)
w725/5450.4803(0.003)
w725/5350.49598(0.0033)
w735/525-0.80198(0.0001)
w735/545-0.80426(0.0001)
w735/515-0.80058(0.0001)
w725/5250.92866(0.0001)
w725/5150.92755(0.0001)
w725/7350.92667(0.0001)
Dry biomass PSNI-0.39583(0.0169)
w695/4050.34843(0.0373)
NDVI-0.26098(0.1242)
w705/525-0.48096(0.003)
w725/5450.47612(0.0033)
w735/7150.47571(0.0034)
w735/545-0.79948(0.0001)
w735/525-0.79921(0.0001)
w735/515-0.79619(0.0001)
w715/5150.91748(0.0001)
w725/5250.91669(0.0001)
NDVI0.91662(0.0001)
Moisture 735/665-0.26977(0.1116)
w735/6550.26897(0.1127)
NDVI0.25511(0.1332)
NIRGI-0.15383(0.3704)
w705/5150.15126(0.3785)
pri0.12521(0.4669)
w735/515-0.85808(0.0001)
w735/505-0.85587(0.0001)
w735/545-0.85373(0.0001)
w735/6550.74467(0.0001)
NR0.74392(0.0001)
735/6650.74365(0.0001)
wXXX or wXXX/XXX = index combination using specified bandwidth0.18915 = Correlation coeficient (0.2692) = probability >|R|

Page 296 1997 OSU Soil Fertility Research
Table 7. The best spectral radiance measures for predicting N rate, P rate, wet biomass, dry biomass, and moisture, by growth stage at Perkins OK. 1996-97
Growth Stage 5 Growth Stage 6 Growth Stage 7Singgle wavelength 1 2 3 1 2 3 1 2 3N rate w385
-0.61817(0.0001)
w395-0.61247(0.0001)
w375-0.61084(0.0001)
w1105-0.791(0.0001)
w1095-0.77925(0.0001)
w705-0.77671(0.0001)
w8850.70485(0.0001)
w8750.70194(0.0001)
w8450.70137(0.0001)
P rate w675-0.43822(0.0075)
w665-0.43774(0.0079)
w655-0.42928(0.0090)
w7350.34739(0.0379)
w7650.34566(0.0389)
w7550.34428(0.0398)
w8450.34492(0.0394)
w8850.33916(0.0430)
w8150.33873(0.0433)
Wet Biomass w7450.70762(0.0001)
w7550.68863(0.0001)
w395-0.6708(0.0001)
w7650.85282(0.0001)
w7750.85153(0.0001)
w7850.85116(0.0001)
w7750.88523(0.0001)
w.7850.88445(0.0001)
w7650.88399(0.0001)
Dry biomass w7450.47733(0.0032)
w7550.45844(0.0049)
w7350.45411(0.0054)
w7650.75125(0.0001)
w7850.75058(0.0001)
w7750.75056(0.0001)
w7950.62196(0.0001)
w8150.62178(0.0001)
w8050.62109(0.0001)
Moisture w675-0.72574(0.0001)
w665-0.71589(0.0001)
w395-0.71456(0.0001)
w1105-0.34121(0.0417)
w1085-0.3362(0.0450)
w1095-0.3327(0.0474)
w7050.17039(0.3204)
w6950.16409(0.3389)
w6150.15766(0.3584)
Combination 1 2 3 1 2 3 1 2 3N rate w715/525
0.75816(0.0001)
w735/5250.73421(0.0001)
w715/5150.73356(0.0001)
gr-0.75836(0.0001)
w725/7150.75534(0.0001)
w735/7150.74887(0.0001)
w725/5250.81423(0.0001)
w725/5350.80448(0.0001)
w725/5150.80139(0.0001)
P rate w705/505-0.42877(0.0091)
w715/5050.41148(0.0127)
w715/5150.38759(0.0195)
w705/545-0.40782(0.0135)
w705/535-0.40744(0.0136)
w715/5050.37008(0.0263)
w705/535-0.40635(0.0139)
w705/545-0.40355(0.0147)
w705/525-0.40286(0.0148)
Wet Biomass w715/505-0.87938(0.0001)
w725/5050.87607(0.0001)
w725/5150.86914(0.0001)
NPCIX-0.90696(0.0001)
735/6650.90245(0.0001)
nr0.89835(0.0001)
NPCIX-0.93237(0.0001)
w735/6550.93166(0.0001)
NDVI0.93059(0.0001)
Dry biomass w715/525-0.56584(0.0003)
w715/5150.56161(0.0004)
w715/5050.554968(0.0004)
w795/7350.82798(0.0001)
nr0.8188(0.0001)
735/6650.80999(0.0001)
w735/6550.90883(0.0001)
NPCIX-0.90553(0.0001)
735/6650.90457(0.0001)
Moisture w715/5050.86203(0.0001)
w725/5050.85645(0.0001)
w715/5050.84919(0.0001)
NPCIX-0.34763(0.0378)
w705/525-0.33853(0.0434)
w705/545-0.33702(0.0444)
w705/5250.23633(0.1652)
w705/5350.22965(0.1832)
nr-0.22453(0.188)
wXXX or wXXX/XXX = index combination using specified bandwidth0.18915 = Coefficient correlation (0.2692) = probability >|R|

OSU Soil Fertility Research 1997 Page 297
Variability in Winter Wheat Spectral Radiance as Affected by Nitrogen Rate, Growth Stage and Variety
H.L. Lees, H. Sembiring, W.R. Raun, J.B. Solie, M.L. Stone, G.V. Johnson, E.V. Lukina, D.A. Cossey and E.G. Krenzer
ABSTRACTBefore sensor-based VRT (variable rate technology) can be used to reduce nitrogen input costs in winter wheat (Triticum aestivum, L.) production, several issues involved with obtaining and understanding the spectral radiance readings must be resolved. One prominent issue is the impact of crop growth stage on spectral radiance readings, and the ensuing problem of relating databases gathered at different locations and different stages of growth. In order to evaluate the impact of growth stage on spectral radiance, readings were taken from a winter wheat variety trial and two long-term nitrogen (N) and phosphorus (P) fertility trials. Spectral radiance readings were also taken at different stages of growth (Feekes 4 to Feekes 8). Results indicated a relationship exists between the normalized difference vegetative index (NDVI=(NIR-red)/(NIR+red)) and total N uptake. Small differences in five common wheat varieties over growth stages from NDVI readings were observed. Slopes from linear regression of total N uptake on NDVI were different at different stages of growth, which suggests the need for growth stage specific calibration.
INTRODUCTION
ield element size is the area on which a single rate of nitrogen or other nutrient is applied; the fundamental field element is that area which provides the most precise measure of the available nutrient where the level of that nutrient changes with
distance (Solie et al., 1996). Work by Solie et al. (1996) demonstrated that the field element size where real differences are likely to exist is less than 1.96 m2. Hence, sensor-based VRT (sVRT) may be the only cost effective answer for addressing nutritional needs. In sVRT, an integrated sensor and signal processing system is used to obtain spectral radiance readings. Sensor- based VRT holds perhaps more promise for the reduction of fertilizer costs than map-based VRT due to the cost of implementing the latter (Sawyer, 1994). While improving fertilizer management via sensors has advanced, many uncharacterized variables affect spectral radiance readings. One of these variables is growth stage. By describing this variable’s impact, we can more effectively utilize spectral readings for the precise application of need based fertilizer rates.
F
Growth stage of the crop is one of the many factors affecting spectral radiance in wheat (Triticum durum Desf. var Produra) (Jackson et al.,1983), grasses (Hagger et al., 1984), and barley (Horedum vulgare, L.) (Kleman and Fagerlund, 1987). Research in barley found that the relationship between fresh biomass and IR/red changed with time, indicating the ratio was dependent on growth stage (Kleman and Fagerlund, 1987). Other research has documented why growth stage affects reflectance readings. Gausman et al. (1971) explained why reflectance changed due to growth stage in cotton. Young,

Page 298 1997 OSU Soil Fertility Research
compact leaves had less air spaces within the mesophyll than did older leaves, and thus, showed decreased NIR spectral radiance. Furthermore, leaf aging had a variable effect on visible light reflectance. Chlorophyll molecules were sensitive to disease and other physiological stresses (Knipling, 1970). Initially, these stresses were exhibited by changes in the visible spectral region, but not in the infrared (Knipling, 1970). Wanjura and Hatfield (1987) found that overall, a ratio was more sensitive to high levels of biomass and leaf area index (LAI), but when crops were small, normalized difference and greenness were better indicators of LAI and groundcover. Therefore, the reliability of spectral vegetative indices is dependent upon the growth stage of the crop. The objective of this paper was to evaluate the impact of growth stage on NDVI readings of winter wheat in Oklahoma.
MATERIALS AND METHODS
Three winter wheat trials were selected in the fall of 1995: a long-term N and P fertility trial at Stillwater, OK on a Kirkland soil loam (fine, mixed, thermic Udertic Paleustoll), another long-term N and P fertility trial at Lahoma, OK on a Grant silt loam (fine-mixed thermic Typic Paleustoll) and a variety by N rate trial at Hennessey, OK on a Shellabarger sandy loam (fine, loamy, mixed, thermic Udic Argiustoll). Winter wheat was planted in October and November of 1995 at 62.5 kg ha-1 (Hennessey) and 67 kg ha-1
(Stillwater and Lahoma). The variety by N rate trial consisted of a full factorial arrangement of treatments including 5 varieties and 3 preplant N rates, evaluated in a randomized complete block design. The varieties were: ‘Tonkawa’, ‘Jagger’, ‘Karl 92‘, ‘Agri-Pro‘ ‘Hickok’, and ‘AGSECO 7853+’. Preplant N rates evaluated were 0, 84, and 168 kg N ha-1. Each plot was 15.24 m x 2.44 m. The long-term N and P fertility trial at Stillwater evaluated N rates of 0 to 135 kg ha-1 in a completely randomized block design. Also, the long-term N and P fertility trial at Lahoma evaluated N rates of 0 to 112 kg ha-1
in a completely randomized block design. Main plot size in the long-term trial at Stillwater was 18.29 m x 6.10 m and 18.29 m x 4.88 m in the long-term trial at Lahoma. Row spacing for the long-term trials was 19.05 cm at Stillwater, and 21.59 cm at Lahoma. The wheat variety ‘Tonkawa’ was planted at both sites. At the variety by N rate trial at Hennessey, a 20.32 cm row spacing was used.
The long-term trial at Stillwater was sampled at Feekes growth stage 5 (sheaths of leaves strongly erected) and 7 (second node of stem formed, next to last leaf just visible). The long-term trial at Lahoma was sampled at Feekes growth stage 7 and 8 (last leaf visible, but still rolled up, ear beginning to swell), and the variety by N rate trial at Hennessey was sampled at growth stage 4 (leaf sheaths beginning to lengthen), 5, and 7. Spectral radiance readings were collected just prior to obtaining forage clippings. Photodiode detectors and interference filters for red (671 +/- 6 nm), green (550 +/- 6 nm), and NIR (780 +/- 6 nm) spectral bands with a 0.305m width by 0.075 m length spatial resolution were used. Readings were taken with a sensor mounted on the front of a John Deere 318 garden tractor. Details on sensor design can be found in Stone et al. (1996). Sensor height was adjusted according to row spacing. Sensor readings were taken from subplot areas of (variety by N rate trial at Hennessey) 0.91m x 0.61m, (long-term trial at Stillwater) 0.91m x 0.57m, and (long-term trial at Lahoma) 0.91m x 0.65m. Forage yield was determined by handclipping the entire subplot area (0.91m x 3 rows) 2

OSU Soil Fertility Research 1997 Page 299
cm above the ground. The plant material was oven dried for 3 days at 700°C in a forced air oven. The amount of fresh material and forage moisture was also calculated. Total N in plant tissue was determined using a Carlo-Erba (Milan, Italy) NA 1500 dry combustion analyzer. Total N uptake was found by multiplying total N and dry biomass. NDVI was calculated for the spectral radiance readings using the following formula: (NIR - red)/(NIR + red). Analysis of variance and correlation of wet and dry biomass and total N uptake with green, red and NIR uncalibrated voltage readings, and NDVI vegetative indices were also evaluated for each trial. Initial surface (0-15cm) soil test characteristics at each site are reported in Table 1.
RESULTS
Analysis of variance on spectral radiance, NDVI and total N uptake at different growth stages, is presented in Tables 2, 3, and 4. Results are presented by location.
Long-term N and P fertility trial, StillwaterFor all dependent variables analyzed, no significant N rate by growth stage
interactions were detected, thus allowing independent interpretation of main effects (Table 2). A significant linear response to applied N was observed for N uptake and NDVI. Also, N uptake and NDVI were different with changing growth stages, which was observed for red, green, and NIR.
Long-term N & P fertility trial, LahomaThe N rate by growth stage interaction was significant for N uptake, thus
restricting main effect interpretation of this variable. However, this was not observed for NDVI or the red, green, and NIR spectral radiance readings at Lahoma (Feekes growth stages 7 and 8). A significant linear response to N rate was observed for NDVI, red, green, and NIR spectral radiance readings. Growth stage was significant for red, green and NIR spectral radiance readings. NDVI, however, was not significant for growth stage.
In the long-term trial at Lahoma, red spectral radiance and NDVI decreased and NIR increased, as N rate increased. One would expect higher N rates to produce more biomass; therefore, decreasing red and increasing NIR.
Variety by N rate trial, HennesseyThe variety by growth stage interaction was significant for N uptake (Feekes
growth stages 4, 5, and 7) (Table 4). The N rate by variety interaction was significant for the red and green spectral radiances. NDVI, red, green, and NIR were significant for growth stage. No differences in NDVI or NIR were observed when evaluated over varieties or N rates.

Page 300 1997 OSU Soil Fertility Research
DISCUSSION
The variety by growth stage interaction for N uptake at Hennessey was explained by finding significant differences in variety at growth stage 4, but none at growth stage 5 (Table 4). Different varieties break dormancy at different times, and metabolism is limited when they are dormant. By growth stage 5 there was not a significant difference in N uptake values by variety, possibly because all varieties had broken dormancy by this time (February 26).
The effect of N fertilizer rates on spectral radiance were evaluated for the three sites. N rate was linear for NDVI and total N uptake in the long-term N and P fertility trial at Stilllwater and N rate was linear for NDVI in the long-term N and P fertility trial at Lahoma; however, N rate was not linear for any of the parameters in the variety by N rate trial. This was possibly due to high soil test nitrate (21.2 mg kg -1) and ammonium (18.4 mg kg-1) at this site.
NDVI was significant for growth stage in the long-term N and P fertility trial at Stillwater (growth stage 5 and 7) and the variety by N rate trial (growth stage 4, 5, and 7), but not in the long-term N & P fertility trial at Lahoma (growth stage 7 and 8). This was possibly due to the level of crop maturity at the time spectral radiance readings were taken, and proximity of the harvest dates. There was no difference in NDVI when evaluated over varieties.
A significant N rate by variety interaction was found for the red and green spectral readings. Thus, interaction was the result of having lower radiance readings for Jagger at the 84 kg N ha-1 rate when compared to all other varieties. Although this effect was significant, we cannot explain why.
Regression analysis of total N uptake on NDVI from the long-term N & P fertility trials at Stillwater and Lahoma, and the variety by N rate trial at Hennessey is presented in Figures 1, 2, and 3, respectively. Hinzman et al. (1986) presented a similar curve in their work for leaf area index and reflectance in the middle infrared bands. The figures show growth stage accounting for most of the difference between the regression functions. The inconsistencies between locations of the slopes and y-intercepts of the regression functions were probably due to background noise in the sensor, and differences in sunlight intensity and in sun angle.
The amount of variability in total N uptake as explained by NDVI increased with advancing growth stages in the long-term N & P fertility trial at Lahoma and the variety by N rate trial at Hennessey (Figures 2 and 3). In the variety by N rate trial, total N uptake expressed higher correlation with spectral radiance at growth stages 5 and 7 than at growth stage 4 (Figure 3). As growth stage increased, so too did the percentage of soil covered by vegetation. In the variety by N rate trial, in January, the percent of soil cover was less than 50%, leading to a high degree of soil reflectance interference in the spectral radiance readings. Thus, it is thought that the optical sensing systems’ ability to detect N deficiencies was impaired when soil cover was less than 50%. As percent cover increased, background soil reflectance should have decreased. Thus, NIR reflectance increased and red reflectance decreased (Knipling, 1970; Gausman et al., 1976; and Walburg et al., 1982).
In the long term N & P fertility trial at Stillwater, a higher correlation with NDVI existed for Feekes growth stage 5 than for Feekes growth stage 7. In addition to growth stage, environmental factors impacted spectral radiance readings. From January 18th

OSU Soil Fertility Research 1997 Page 301
through the 24th, air temperatures were below 0°C causing cell blasting. The resulting grayish foliage in the variety by N rate trial may have increased the Jan 25th red spectral radiance. This further explains the low correlation between NDVI and total N uptake observed at the variety by N rate trial at Feekes growth stage 4. Secondly, drought injury was significant for the 1995 Oklahoma winter wheat crop. Plants under drought stress can accumulate NO3 proline, a free amino acid that may act as a storage vessel for nitrogen (Tyankova, 1967) and ammonium. In addition, initial soil nitrate and ammonium levels were high in the variety by N rate trial. Subsequently, the variety by N rate data from Feekes growth stage 7 showed forage N concentrations as high as 5%.
The freeze in the variety by N rate trial just prior to the Jan. 25th sensor reading and harvest many have led to the same amount of biomass present at both Feekes growth stage 4 (January) and 5 (February). Perhaps the freeze contributed to no increase in biomass. In January, even though the cells had lost turgor, much of the vegetative material was still there. By February, the leaves had either recovered or died. The amount of dead vegetation led to the low biomass present at Feekes growth stage 5. New vegetative growth had not surpassed the amount that had died. By April, the crop had accumulated biomass above its level in January and February.
Furthermore, correlation between grain N concentration and NDVI existed at Feekes growth stage 7, but not at Feekes growth stages 4 and 5. At Feekes growth stages 4 and 5, inorganic N concentration was 2000 to 3000 mg kg -1, but declines to 200 to 300 mg kg-1 by Feekes growth stage 7. Further research was done to ascertain this observation.
Previous research has shown forage NO3N to be higher at earlier stages of growth stage and declining with advancing stage of growth (Roth et al., 1989). As NO 3N is converted to amino acids with advancing stages of growth, NO3N concentrations should decrease. Analysis using cadium reduction followed by automated flow injection of the forage samples showed that at Feekes growth stage 4 samples averaged 350 mg kg-1. NO3N concentrations averaged 1200 mg kg-1 for Feekes growth stage 5 and 1192 mg kg-1
for Feekes growth stage 7, which was not consistent with previous literature.Total forage N concentrations for Feekes growth stages 4, 5, and 7 as analyzed by
Carlo Erba (Milan, Italy) NA 1500 dry combustion analyzer, averaged 4.5, 4.7 and 4.8 %, respectively. The ratio of nitrate to total N was expected to decrease with advancing growth stage as organic N levels increase. Deepening of chlorophyll color and an increase in the number of vibrational bonds may have increased NDVI values. The increase in biomass also was expected to decrease background interference. Therefore, we expected to find improved correlation of NDVI and forage N concentration with advancing stage of growth due to increased relative amounts of organic N.
CONCLUSIONS
Spectral readings of winter wheat were affected by its growth stage. At lower growth stages, NDVI could not predict total N uptake in the forage. Correlation increased as percent soil cover increased. N rate had a linear effect on NDVI and total N uptake. Freeze injury impaired the ability of NDVI to predict total N uptake. Since the slope and y-intercept of the function describing the relationship between NDVI and total N uptake changed with respect to time and location, the calibration curve used to apply

Page 302 1997 OSU Soil Fertility Research
topdress N fertilizer must be generated on a per growth stage and per field basis. Future research is necessary to discover at which growth stage VRT based N fertilizer should be applied to obtain the highest economic return on grain and forage yields.
REFERENCESGausman, H.W., W.A. Allen, D.E. Escobar, R.R. Rodriguez, and R. Cardenas. 1971. Age effects of
cotton leaves on light reflectance, transmittance, and absorptance and on water content and thickness. Agron. J. 63:465-469.
Hagger, R.J., C.J. Stent, and J. Rose. 1984. Measuring spectral differences in vegetation canopies by a reflectance ratio meter. Weed Research, 24:59-65.
Hinzman, L.D., M.E. Bauer, C.S.T. Daughtry. 1986. Effects of nitrogen fertilization on growth and reflectance characteristics of winter wheat. Remote Sens. Envir., 19:47-61.
Jackson, R.D., P.N. Slater, P.J. Pinter, Jr. 1983. Discrimination of growth and water stress in wheat by various vegetation indices through clear and turbid atmospheres. Remote Sens. of Envir., 13:187-208.
Kleman, J. and E. Fagerlund. 1987. Influence of different nitrogen and irrigation treatments on the spectral reflectance of barley. Remote Sens. Envir. 21:1-14.
Knipling, E.B. 1970. Physical and physiological basis for the reflectance of visible and near-infrared radiation from vegetation. Remote Sens. of Envir. 1:155-159.
Large, E.C. 1954. Growth stages in cereals. Plant Pathol. 3:128-129.
Roth, G.W., R.H. Fox, and H.G. Marshall. 1989. Plant tissue tests for predicting nitrogen fertilizer requirements of winter wheat. Agron. J. 81:502-507.
Sawyer, J.E. 1994. Concepts of variable rate technology with considerations for fertilizer application. J. Prod. Agric. 7:195-201.
Solie, J.B., W.R. Raun, R.W. Whitney, M.L. Stone, and J.D. Ringer. 1996. Optical sensor based field element size and sensing strategy for nitrogen application. In press, Transactions of ASAE.
Stone, M.L., J.B. Solie, W.R. Raun, R.W. Whitney, S.L. Taylor and J.D. Ringer. 1996. Use of spectral radiance for correcting in-season fertilizer nitrogen deficiencies in winter wheat. Trans. ASAE 39(5):1623-1631.
Tyankova, L.A. 1967. Distribution of the free and bound proline and of the free hydroxyproline in the separate organs of wheat plants during drought. C.R. Acad. Bulg. Sci. 20:583-586.
Walburg, G., M.E. Bauer, C.S.T. Daughtry, and T.L. Housley. 1982. Effects of nitrogen nutrition on growth, yield, and reflectance characteristics of corn canopies. Agron. J. 74:677-683.
Walter-Shea, E.A., J.M. Norman, B.L. Blad, and B.F. Robinson. 1991. Leaf reflectance and transmittance in soybean and corn. Agron. J. 83:631-636.
Wanjura, D.F. and J.L. Hatfield. 1987. Sensitivity of spectral vegetative indices to crop biomass. Transactions of the ASAE 30(3):810-815.

OSU Soil Fertility Research 1997 Page 303
Figure 1. Regression of Total N Uptake in Winter Wheat on the Normalized Difference Vegetative Index (NDVI) at two Feekes Growth Stages (5 and 7), Stillwater, OK, 1996.
Figure 2. Regression of Total N Uptake in Winter Wheat on the Normalized Difference Vegetative Index (NDVI) at two Feekes Growth Stages (7 and 8), Lahoma, OK, 1996.
Feekes Growth Stage 513 Jan 1996
y = 162.37x - 17.88R2 = 0.5178
Feekes Growth Stage 718 Mar 1996
y = 151.48x - 25.548R2 = 0.4253
0
20
40
60
80
100
120
140
0 0.1 0.2 0.3 0.4 0.5 0.6 0.7
NDVI
Tota
l N U
ptak
e (k
g/ha
)
Feekes Growth Stage 816 Apr 1996
y = 208.69x - 42.399R2 = 0.8712
Feekes Growth Stage 719 Mar 1996
y = 126.62x - 30.025R2 = 0.5906
0
20
40
60
80
100
120
140
160
0 0.2 0.4 0.6 0.8 1NDVI
Tota
l N u
ptak
e (k
g/ha
)

Page 304 1997 OSU Soil Fertility Research
Figure 3. Regression of Total N Uptake in Winter Wheat on the Normalized Difference Vegetative Index (NDVI) at three Feekes Growth Stages (4, 5, and 7), Hennessey, OK, 1996.
Table 1. Initial surface (0 - 15cm) soil test characteristics at each location.__________________________________________________________________________
pH NH4-N NO3-N P K OC TN-------------------------mg kg-1-----------------------------------g kg-1---------
Hennessey 5.8 18.3 21.1 142 674 12.3 1.00Lahoma 5.0 45 320 7.1 0.62Stillwater 5.8 70 211 6.4 0.67__________________________________________________________________________pH, 1:1 soil:deionized water; K and P, Mehlich-3.
0
50
100
150
200
250
0 0.2 0.4 0.6 0.8
NDVI
Feekes Growth Stage 526 February 1995
y = 97.953x - 12.413R2=0.6687
Feekes Growth Stage 79 April 1995
y = 234.78x - 9.4074R2= 0.7286
Feekes Growth Stage 425 January 1995
y = 286.62x - 20.226R2= 0.3588
Total N uptake, kg/ha

OSU Soil Fertility Research 1997 Page 305
Table 2. Analysis of variance for forage N uptake, NDVI, red, green, and NIR at Stillwater, OK._____________________________________________________________________________Sources of variation df N uptake (kg ha-1) NDVI Red Green NIR_____________________________________________________________________________
Mean squaresReplication 3 263 0.012 327497** 686710** 1748064*N rate 3 1475* 0.044 75981 29939 345628Growth stage 1 2270** 0.008* 554447* 2104222* 5568846*N rate*growth stage 3 152 0.003 35659 72445 298302N rate linear 1 4294** 0.122* 169033@ 1015 808857N rate quadratic 1 106 0.007 56160 84185 102702
MeansNitrogen rate, kg ha-1
0 36.56 0.397 777.92 1114.43 1751.6445 41.71 0.402 813.29 1200.56 1895.2090 54.42 0.489 723.40 1237.83 2205.32134 66.86 0.552 591.20 1118.80 2122.27SED 7.3 0.057 157.75 258.2 452.72
Growth Stage5 41.46 0.444 594.82 911.47 1576.447 58.31 0.476 858.09 1424.33 2410.77_____________________________________________________________________________@,*, **, *** Significant at the 0.10, 0.05, 0.01, and 0.001 probability levels, respectively.SED = standard error of the difference between two equally replicated treatment means.
Table 3. Analysis of variance for forage N uptake, NDVI, red, green, and NIR at Lahoma, OK_____________________________________________________________________________Sources of variation df N uptake (kg ha-1) NDVI Red Green NIR_____________________________________________________________________________
Mean squaresReplication 3 774* 0.011 51358 161328 794218N rate 5 4746*** 0.149*** 1675323*** 1005994* 647491Growth stage 1 9690*** 0.001 767404** 3481413** 13272296***N rate*growth stage 5 552** 0.002 64712 186044 847411N rate linear 1 22189*** 0.710*** 7354401*** 3971062** 1495830N rate quadratic 1 494 0.029 654624 352564 110531
MeansNitrogen rate, kg ha-1 GS7 GS80 16.38 24.38 0.355 1637.89 2228.10 3398.6122 19.93 36.71 0.432 1401.79 2097.86 3501.9445 39.23 56.8 0.549 813.19 1498.15 2798.3667 52.61 88.35 0.637 690.53 1580.68 3078.6190 44.3 94.05 0.657 661.66 1565.05 3126.71112 58.17 100.83 0.701 502.12 1352.35 2844.14SED 5.46 5.46 0.053 151.05 265.11 (NS)_____________________________________________________________________________*, **, *** Significant at the 0.05, 0.01, and 0.001 probability levels, respectively, NS Not significant.

Page 306 1997 OSU Soil Fertility Research
SED = standard error of the difference between two equally replicated treatment means. GS7 and GS8, Feekes growth stages 7 and 8, respectively.
Table 4. Analysis of variance for forage total N uptake, NDVI, red, green, and NIR, Hennessey, OK.______________________________________________________________________________Sources of variation df N uptake NDVI Red Green NIR______________________________________________________________________________
Mean squaresReplication 2 2932.02** 0.0632** 82664.24* 2870.69 184059N rate 2 710.69 0.0251 88372.87* 31742.06 3608Variety 4 1801.46** 0.0144 94998.66** 19690.57 97936N rate*variety 8 255.48 0.005 62433.97* 60263.00*** 131896Rep*variety*N rate(a) 28 432.47 0.0111 22996.93 12485.70 82530
Growth stage 2 152700.64** 2.16** 1966798** 10030973** 70568654**N rate*growth stage 4 363.24 0.0103 26256.56 8993.2 8297Variety*growth stage 8 735.37** 0.0099 47915.17 46718.1 163431*N rate*variety*growth stage 16 432.14 0.0059 26324.04 42962.5 148560*______________________________________________________________________________*, **, *** Significant at the 0.05, and 0.01probability levels, respectively.
Table 5. Effect of variety and growth stage on forage total N uptake, NDVI, red, green, and NIR, Hennessey, OK.______________________________________________________________________________Variety Growth N uptake NDVI Red Green NIR
Stage kg/ha______________________________________________________________________________
Treatment meansAgri-Pro "Hickok" 4 15.6 0.1468 1000.0 1146.9 1348.2
5 22.3 0.3627 639.1 886.6 1393.17 116.7 0.5268 1079.1 1862.9 3499.3
AGSECO 7853 4 16 0.1289 967.7 1092.3 1258.95 26.8 0.3746 642.8 914.4 1403.37 140.8 0.6672 771.9 1829.3 3829.9
Jagger 4 42.8 0.1785 973.6 1149.7 1403.15 22.5 0.407 555.6 815 1307.57 158 0.64 825.2 1763.1 3753.3
Karl 92 4 23.2 0.1653 1006.5 1180.2 1412.95 23.9 0.3615 467.2 663.5 998.97 138 0.6593 766.1 1863.2 3661.6
Tonkawa 4 18.6 0.1405 1002.4 1145.3 1332.95 29.1 0.4003 604.1 872.5 1382.97 123.3 0.6112 915.5 1841.3 3754.1
SED 9.8 0.0362 76.5 97.7 181.7______________________________________________________________________________SED = standard error of the difference between two equally replicated treatment means.

OSU Soil Fertility Research 1997 Page 307
Development of Field Standards for Variable Rate Technology
H.L. Lees, W.R. Raun, J.B. Solie, M.L. Stone, G.V. Johnson and S.B. Phillips
ABSTRACTVariable rate technology (VRT) can assess and correct nitrogen (N) deficiencies in winter wheat (Triticum aestivum, L.). Spectral radiance readings of wheat forage were applied to a calibration curve relating NDVI (normalized difference vegetative index) to forage total N uptake. Nitrogen rates used in the first year were 0, variable, 45 and 90 kg N ha -1, and in the second year were 0, variable, 56 and 112 kg N ha-1. A linear response to applied fertilizer N was found at all sites for grain yield. At Hennessey in 1997 yield and grain N uptake increased with increasing NDVI. The wide scatter in the data points over a narrow NDVI range in the Hennessey (1996-1997) data implies NDVI was not sensitive to forage N uptake, probably due to the fact that it could not detect canopy depth; or there was an intervening cause and N was adequate. An indication of N uptake (less than or greater than x kg N ha-1) at x stage of growth is needed prior to establishing the linear N-rate curve. NDVI values where N uptake is known to be greater than x kg N ha-1 at x stage of growth would not be fertilized. Similarly, the high end may all receive 20 kg N ha-1
depending on yield potential. Future work will target methods to establish limits for the non-responsive and response portions of the NDVI - forage N uptake curve.
INTRODUCTION
ariable rate technology (VRT) can be used to accurately assess and correct nitrogen (N) needs in winter wheat. VRT is a practice whereby fertilizer application over a field is changed in accordance with predetermined soil
nutrient levels. VRT is a useful concept in U.S. agriculture because it proposes to apply only the amount of N needed by the crop thereby protecting not only the environment but also the producer’s profit. VRT works because fields are not uniform. Therefore, when production inputs are applied based on soil test values from four soil samples of a ten hectare area, maximum profit does not occur (Sawyer, 1994). Hence, VRT enables the producer to capitalize on the variability within fields.
V
Measures of crop spectral reflectance that relate to corresponding N uptake may be utilized in variable rate technology. Walburg et al. (1982) found that when plants are N deficient, spectral reflectance in the near-infrared (NIR) portion of the spectrum decreases, while reflectance in the red increases. Infrared (IR)/red ratio, of reflectance, increases with increased N fertilization and N content in plant tissue (Kleman and Fagerlund, 1987). Nitrogen deficiencies are linked to decreased amounts of leaf chlorophyll and less light absorption. This results in a greater reflectance measurement (Blackmer et al., 1994). Red has been measured at 0.671 ± 0.006 um, and NIR at 0.780 ± 0.006 um (Stone et al., 1996), and green spectral radiance at 0.550 ± 0.006 um (Thomas and Oerther, 1972; Blackmer, 1994). Stone et al. (1995) found plant N spectral

Page 308 1997 OSU Soil Fertility Research
index (PNSI) was highly correlated with estimates of N uptake in wheat forage at all stages of growth. The index is calculated as the absolute value of (NIR + red)/(NIR - red) and is the inverse of the normalized difference vegetative index (NDVI). The highest PNSI reading should correspond to the lowest rate of N applied (0 kg ha-1) preplant.
Spectral readings of the wheat forage are taken using photodiode based sensors fitted with interference filters and interfaced to an embedded microcontroller. The readings are used to apply fertilizer just moments after the readings have been obtained based on a predetermined calibration curve (Stone et al., 1995). The objective of this study was to evaluate the appropriateness of a variable applied N rate based on a linear calibration curve of NDVI and forage N uptake (biomass x N concentration) versus a fixed topdress N application in field-scale trials.
LITERATURE REVIEW
Remote sensing of radiant energy in the visible and near infrared region may be an input or basis for variable rate technology (VRT) to apply only the amount of fertilizer needed by the plant. VRT is a potentially useful tool for U.S. farmers because it allows them to conserve fertilizer, while maximizing yield potential. With concern about groundwater contamination and the depressed farm economy, the development of VRT for fertilizer application is clearly desirable. Fixed rate fertilizer application does not allow optimum efficiency or profitability (Sawyer, 1994).
Spectral radiance is measured in terms of wavelength. Chlorophyll absorbs light at wavelengths of 0.450 to 0.670 um. Blue light is measured at about 0.450 um, while red light is approximately 0.675 um. Finally, green light is found at 0.550 um. Approximately 75 to 90% of the light absorbed by green leaves is blue and red. Absorption is approximately 20% for green light (Thomas and Oerther, 1972). Plant leaves reflect wavelengths between 0.700 and 1.300 um from their internal structure. Above 1.300 um, energy incident upon vegetation is absorbed or reflected with marginal transmittance of energy (Thomas and Oerther, 1972). Factors affecting soil reflectance include: soil moisture content, texture, surface roughness, ferric oxide content and organic matter. Sandy soils have a low moisture content and high reflectance. Water affects reflectance between 1.3 and 2.5 um (Kleman and Fagerlund, 1987). In plants, leaf thickness impacts light absorption and reflectance (Woolley, 1971). Lillesaester (1982) demonstrated that reflectance on one or two layers of leaves, for wavelengths beyond 0.700 um, was affected by background (soil) reflectance. Blackmer et al. (1994) found the optimum wavelength for separation of nitrogen (N) treatment differences to be 0.550 um. They measured chlorophyll activity at 0.650 um. Moreover, their results indicated chlorophyll activity was proportional to leaf N concentration. Nitrogen deficiencies led to decreased amounts of leaf chlorophyll, which resulted in less chlorophyll light absorption. Therefore, the greatest reflectance occurred with the lowest N rate (Blackmer et al., 1994). In support of this finding, Takebe et al. (1990) found N content in the upper leaves relates closely to the intensity values of the canopy green color. When plants are N deficient, reflectance in the red increases, while the near infrared decreases (Thomas and Oerther, 1972). Under nitrogen deficiency, reflectance in sweet pepper (Capsicum annuum L.) leaves increases in the visible (0.4 to 0.7 um) and

OSU Soil Fertility Research 1997 Page 309
near infrared (0.7 to 1.4 um) while decreasing in the middle infrared (1.4 to 2.5 um) (Walburg et al., 1982). Kleman and Fagerlund, (1987) report that the IR/red ratio increases with increased fertilization in barley. Their findings also show a strong correlation between IR/red ratio and biomass, but the function changes with growth stage. Therefore, it is important to take all of the samples at the same growth stage (Kleman and Fagerlund, 1987).
Water content and internal leaf structure impacts near-infrared reflectance. Intercellular air spaces increased when N deficiency became more severe, as evidenced by increased reflectance (Thomas and Oerther, 1972). Research by Frederick and Camberato (1995) showed that high rates of spring-applied N increased the severity of drought stress on non-irrigated winter wheat. Furthermore, Karrou and Maranville (1994) noted that severe water stress masked the effect of N supply. Roth (1990) stated that under low nutrient supply, plants would use more water. In addition, increased plant growth results in increased water use efficiency. In humid regions, fertilized crops were more drought tolerant. However, in subhumid regions, if fertilizer caused vigorous growth early in the season, and then the crops were subjected to drought, yields decreased (Foth, 1990).
Vegetation indices are used to enhance vegetation signals from remote sensing instruments. Walburg et al. (1982) found the IR/red reflectance ratio enhanced treatment differences in canopy reflectance and reduced reflectance variability from extraneous factors. Kleman and Fagerlund (1987) reported the IR/red ratio indicated the amount of biomass in barley on each measurement date until approximately 20 July. The average of the IR/red ratio during the middle of the season was highly correlated (r2=0.97) to grain yield two months later (Kleman and Fagerlund, 1987).
Leaf area index (LAI) is an important consideration when measuring canopy reflectance. A lower LAI results in decreased canopy reflectance in the near infrared and increased in the red, without any alteration of the reflectance properties of individual leaves (Colwell, 1974). Bunnik (1978) showed that the NIR/red reflectance ratio was highly correlated to variation in LAI of vegetative canopies, while being relatively insensitive to variations in soil background reflectance.
According to Stone et al. (1995), a strong relationship between PNSI and total N uptake exists. Stone et al. (1995) found the plant-nitrogen-spectral index (PNSI) was highly correlated with estimates of N uptake in wheat forage at all stages of growth. Work done at Oklahoma State University indicates that forage N uptake is better correlated to grain yield than total N in the forage or forage yield; however, work by Roth et al. (1989) showed plant N concentration to be a better predictor of grain yield.
MATERIALS AND METHODS
Experimental sites were established in Oklahoma, in the fall of 1995 at Altus and Hennessey (1996 crop), and in fall of 1996 at Hennessey and Tipton (1997 crop). Soil types and initial soil test results are reported in Table 1. The soil test data reported is from two and three composite surface soil samples (0-15 cm) of the field in which each experiment was located. The experimental design was a completely randomized block. Four treatments were replicated five times at Altus, Hennessey (1996-97), and Tipton, and 10 times at Hennessey (1995-96). The large numbers of replications were used to

Page 310 1997 OSU Soil Fertility Research
test an experimental applicator and to increase our database. Main plots included a check (no N fertilization), a variable N rate (based on NDVI), and two fixed topdress rates of 45 and 90 kg N ha-1 in 1995-96 and 56 and 112 kg N ha-1 in 1996-97. Each main plot was split into 10 subplots for variable fertilizer application during topdressing and grain harvest in the variable plots. Main plot sizes at both locations were 3.048 m x 15.24 m in 1995-96 and 3.048 m x 21.336 m in 1996-97. Plot size was altered for the 1996-97 crop year to facilitate harvesting. Winter wheat (Triticum aestivum L.), ‘Tonkawa’ variety, was planted at a rate of 79 kg ha-1 in 19 cm row spacing at Hennessey and 27 cm row spacing at Altus and Tipton. UAN was applied on 26 March 1996 at Altus, 2 April 1996 at Hennessey, 4 February 1997 at Tipton, and 13 February 1997 at Hennessey to the fixed rate and variable rate plots. Tables 2 through 5 report the fertilizer rates that were applied to each subplot in the variable treatments. Wheat at all locations was at either Feekes growth stages 6 or 7 in 1996 and at Feekes growth stage 5 in 1997 when topdress N was applied. Fixed N rates of 45, 56, 90 and 112 kg N ha-1 were applied using a conventional sprayer to support 1344, 1680, 2688, and 3360 kg ha-1 yield goals, (not considering a soil test). Variable rates were applied using portable back-pack sprayers, to 3.0 m x 1.5 m plots in 1996 and 3.0 m x 2.1 m plots in 1997. Check plots did not receive any N fertilizer. The fixed rate (90 kg N ha-1 in 1996 and 112 kg N ha-1 in 1997) applications were based on the rate a producer was likely to use for his yield goal.
Spectral readings of the wheat forage in the variable rate plots (1996) and all of the plots (1997) were taken using photodiode based sensors fitted with interference filters and interfaced to an embedded microcontroller (Stone et al. 1995). A linear calibration relating spectral readings to forage characteristics was prepared utilizing data taken by the same sensor from that same site either on that day or two days before. The highest NDVI value corresponded with the highest forage total N uptake. Thus, that plot received no topdress N. Conversely, the lowest NDVI value corresponded with the lowest forage total N uptake, and thus received the a topdress N application of 90 kg N ha-1 in 1996 and 112 kg N ha-1 in 1997. A linear curve was drawn through the NDVI values, and fertilizer was applied accordingly. Outliers at the top and bottom of the NDVI values were discarded when present.
In late May and early June of both years, grain was harvested with a Massey Ferguson 8XP research combine. Harvested area in 1996 was 1.5 m x 2.0 m and 3.0 m x 2.0 m in 1997. Grain yield and grain moisture were recorded using a Harvest Master data system. Grain was ground to pass a 140 mesh screen and analyzed for total N on a Carlo-Erba NA 1500 dry combustion analyzer. Amount of N available for plant uptake was calculated by adding NH4-N and NO3-N (in ppm) and then multiplying by 2.24 to obtain kg N ha-1. Analysis of variance using subplots as sampling error was performed (SAS Institute, 1985). Contrasts were also evaluated for the linear effect of N rate, VRN versus the check, VRN versus the one-half fixed rate, and VRN versus the fixed rate.
RESULTS
Response to applied N fertilizer was variable in the both years of the experiment. Hence, the detailing of results that follows was separated by year and location. Analysis of variance for each site is presented in Tables 6 through 9.

OSU Soil Fertility Research 1997 Page 311
Altus, 1996A significant linear response to applied N was observed for grain yield, total N in
the grain, and grain N uptake (Table 6). Grain yield and grain N uptake decreased with increasing applied N, while total N concentration in the grain increased. The extremely low grain yields were attributed to severe freeze damage and drought encountered at this site. Sufficient soil NH4-N plus NO3-N was present to produce 934 kg ha-1 grain without added fertilization. Regression analysis indicated there was no correlation at this site between NDVI readings taken from the variable rate plots on 2 March 1996 at Feekes growth stage 6 and grain yield, total N in the grain, or grain N uptake. No differences were found between the variable rate N (VRN) (48 kg N ha-1) and either of the fixed N rates. Yield response when N was variably applied was independent of NDVI. This affirms the contrasts that under drought conditions N level did not affect yield (Table 6).
Hennessey, 1996A slight trend for applied N fertilizer to decrease grain yield was found at
Hennessey (Table 7). The lack of differences in yield restricts the comparison of N treatments, especially compared to VRN, because N savings would be inconsequential. No differences were found between the variable rate N (VRN) (43 kg N ha-1) and either of the fixed N rates and the check. In the VRN treatment, yields were considerably reduced at higher topdress N rates.
Tipton, 1997At Tipton, the main effect of N fertilizer rate was significant for grain yield, total
N in the grain, and grain N uptake, with grain yield increasing from 539 to 797 kg ha-1
and total N in the grain from 28.2 to 29.7 g kg -1 from the check to fixed N rate plots, respectively (Table 8). Normal yields in this county were 1206 kg ha-1 higher. The large yield reduction was the result of freeze damage on April 11, 12 and 13. Actual yields ranged from 797 kg ha-1 for the 112 kg N ha-1 to 539 kg ha-1 for the check. The variable rate N application (VRN) (averaging 45 kg ha-1) had lower grain yield (649 kg ha-1) and grain N uptake (19 kg N ha-1) compared to the fixed rate of 112 kg N ha-1 rate (797 kg ha-
1 and 24 kg N ha-1). Total N in the grain was lower in the VRN plot (28.9 g kg -1) compared to the 56 kg N ha-1 (29.5 g kg-1).
Hennessey, 1997Response of grain yield and grain N uptake to N fertilizer was linear (Table 9).
The variable rate N application (46 kg ha-1) had lower grain yield, total N in the grain and grain N uptake compared to the fixed rate of 112 kg N ha-1. Figure 2 shows grain yield, total N in the grain and grain N uptake in the subplots within check plots (no N applied) plotted against NDVI for the check plot. Grain yield and grain N uptake increased with increasing NDVI readings taken at an early stage of growth. This implies that at Feekes growth stage 5, NDVI was able to detect some differences in forage N uptake between plots and which could be used to predict yield as has been reported by Stone et al. (1995) and Tucker et al. (1980).

Page 312 1997 OSU Soil Fertility Research
DISCUSSION
Altus, 1996The Altus 1995-96 growing season, September through May, was very dry, with
total rainfall only reaching 264 mm. Normal rainfall for this period is 449 mm. Thus, it was not startling that the effect of N fertilizer application was not significant since response was controlled by moisture and not nutrient limited. Interestingly, the 90 kg N ha-1 rate reduced yield, confirming the conclusions of Frederick and Camberato (1995) and Karrou and Maranville (1994) that in drought conditions application of N can reduce yield. Even though wheat was at Feekes growth stage 6 when the readings were taken, the wheat canopy was at low coverage. Unpublished data by Lees et al. (in preparation) suggests NDVI is not a good predictor of N uptake until percent vegetative coverage reaches or exceeds 50%. The very low range in NDVI from 0.18 to 0.28 is usually associated with bare soil. However, the readings for this site were taken under overcast skies which shift the values lower and reduce sensitivity. In addition, vegetation was very sparse due to drought. The drier than normal year, freeze injury that occurred in January, and subsequent lack of vigorous growth contributed to the lack of correlation between NDVI and grain yield, total N in the grain, and grain N uptake. The biggest reason for lack of NDVI response was extremely low yield. Sufficient N was present in the soil to support a yield of 940 kg ha-1 without additional fertilizer N. Average yield for the VRN treatment was 605 kg ha-1 which equaled the check yield. Under this condition, no response should be expected. Hence, due to the environmental factors present in this portion of the study, no inferences on the justification of sensor-based variable rate technology should be made from data at this site.
Hennessey, 1996In addition to low rainfall at Hennessey (261 mm Sept 1995 through May 1996),
enough soil inorganic N was present, without the addition of fertilizer, to produce 2600 kg ha-1 wheat (Table 7). Annual rainfall for this area averaged 543 mm. Average yields for each treatment were less than 2020 kg ha-1. Thus, we expected limited, and perhaps negative, response to applied fertilizer N. Since fertilizer was applied relatively late in the growing season under drought conditions (end of Feekes growth stage 6), limited uptake of applied fertilizer N occurred. This was compounded by high inherent soil N levels. Under these conditions the topdress fertilizer application reduced yield about 100 kg ha-1. This trend was observed in the VRN plots where yield tended to decrease with increasing N application.
Tipton, 1996-1997In contrast to the previous growing season, in 1996-97, total rainfall for Tipton
was 542 mm (Sept. 1996 through May 1997) and for Hennessey was 599 mm (Sept. 1996 through Apr. 1997). Normal rainfall for the two areas was 520 mm and 543 mm, respectively. Initial soil test results from Tipton showed 29 kg N ha-1 available for plant uptake, or enough to produce 874 kg of wheat grain. As there was adequate moisture supply, a yield response to applied fertilizer N was expected. The April freeze drastically lowered the yields for this location from an average historic yield of 2000 kg ha -1 to 665 kg ha-1. Even though the yield goal for the fixed rate plots was 3360 kg ha-1, the 112 kg N ha-1 treatment only averaged 850 kg grain ha-1. The fact that grain yield and grain N

OSU Soil Fertility Research 1997 Page 313
uptake decreased with increasing NDVI values, suggests that the subplots with the highest NDVI readings needed some amount of fertilizer, too. However, with yields this low, it is difficult to reliably evaluate treatments or draw conclusions.
Because of this we think the high end of the variable N rate treatment was not high enough since yields and N uptake were lower. Also, the improved yields (112 kg N ha-1 vs. VRN) could suggest that the variability in NDVI detected, and which was the basis for the linear NDVI-N rate fertilizer recommendation may not have been appropriate. The variability in NDVI detected may not have been due to deficiencies of N, the linear calibration curve may have underestimated N need. Previous work by Solie et al. (1996) suggests an exponential curve may be a better fit. See Figure 1 for NDVI versus grain yield, total N in the grain, and grain N uptake in the check plot. Also, it was important to find that the NDVI range was narrow, 0.5 to 0.65, indicating that there was uniform vegetation and uniform N concentration.
Hennesssey, 1996-1997Hennessey had less freeze damage than Tipton. Consequently, forage N uptake
was related to yield parameters for this particular year at Hennessey. Figure 2 shows NDVI versus grain yield, total N in the grain, and grain N uptake for the check plot at Hennessey. Growth was more vigorous at this site than the others, having achieved 50% vegetative coverage by late January. Although the NDVI readings were uncalibrated, the values for this location and year were higher than any of the others.
Three other factors may be responsible for the lack of correlation between NDVI and yield parameters. The N rates applied may not have been appropriate for the site. It is possible that the high end of the linear curve should have received 20 kg N ha -1 instead of 0, or that the plots needing the highest fertilizer application occurred in the middle of the curve. Furthermore, the slope of the actual curve relating NDVI to forage N uptake may not have been linear. It should also be noted that the variability detected with NDVI may have been due to factors other than N.
CONCLUSIONS
The wide scatter in the data points over a narrow NDVI range in the Hennessey (1996-1997) data implies NDVI was not sensitive to forage N uptake, probably due to the fact that it could not detect canopy depth; or there was an intervening cause and N was adequate. This poses a question: should we be attempting to fertilize based on growth stage, percent coverage, or at a time where plant coverage is at 50% or greater, but when the plant has not achieved much height? Perhaps the solution is an ultrasonic device to estimate plant height and integrate that with NDVI. Also, since NDVI was apparently unable to sense forage N uptake at Feekes growth stage 5, when high levels of biomass were present, the need for an independent in-field estimation of forage N uptake becomes apparent. This might involve a quick plant tissue test for N content and weighing forage clippings from a specific area. Sensor readings of the area would be taken beforehand and a calibration curve developed. Ideally, technology would advance to the point where in field calibration was no longer necessary. If the resolution on global satellite positioning systems becomes fine enough, it might be used for the experimental applicator to more accurately match NDVI readings with grain yield.

Page 314 1997 OSU Soil Fertility Research
An indication of N uptake (less than or greater than x kg N ha -1) at x stage of growth is needed prior to establishing the linear N-rate curve. NDVI values where N uptake is known to be greater than x kg N ha-1 at x stage of growth would not be fertilized. Similarly, the high end may all receive 20 kg N ha -1 depending on yield potential. Work by Roth et al. (1989) showed whole plant N concentrations necessary to produce 90% of maximum yields or critical levels, were 39.0, 35.0, and 26.5 g N kg-1 for Feekes growth stages 4, 5, and 6, respectively.
REFERENCESBlackmer, T.M., J.S. Schepers and G.E. Varvel. 1994. Light reflectance compared with other nitrogen
stress measurements in corn leaves. Agron. J. 86:934-938.
Bunnik, N.J.J. 1978. The multispectral reflectance of short-wave radiation by agricultural crops in relation with their morphological and optical properties. H.V. Veenman and B.V. Zonen, Wageningen, 98-114.
Colwell, J.E. 1974. Vegetation canopy reflectance. Remote Sens. Environ., 12:247-254.
Frederick, J.R., and J.J. Camberato. 1995. Water and nitrogen effects on winter wheat in the southeastern Coastal Plain. I. Grain yield and kernal traits. Agron J. 87(3):521-526.
Karrou, M., and J.W. Maranville. 1994. Response of wheat cultivars to different soil nitrogen and moisture regimes. J. Plant Nutr. 17(5):745-761.
Kleman, J. and E. Fagerlund. 1987. Influence of different nitrogen and irrigation treatments on the spectral reflectance of barley. Remote Sens. Environ. 21:1-14.
Lillesaeter, O. 1982. Spectral reflectance of partly transmitting leaves: Laboratory measurements and mathematical modeling. Remote Sens. Environ., 12:247-254.
Roth, G.W., R.H. Fox and H.G. Marshall. 1989. Plant tissue tests for predicting nitrogen fertilizer requirements of winter wheat. Agron. J. 81:502-507.
SAS Institute Inc. 1985. SAS procedures guide for personal computers. 6th ed. SAS Institute Inc., Cary, NC, USA.
Sawyer, J.E. 1994. Concepts of variable rate technology with considerations for fertilizer application. J. Prod. Agric. 7:195-201.
Solie, J.B., W.R. Raun, R.W. Whitney, M.L. Stone, and J.D. Ringer. 1996. Optical sensor based field element size and sensing strategy for nitrogen application. Trans. ASAE 39(6):1983-1992.
Stone, M.L., J.B. Solie, W.R. Raun, R.W. Whitney, S.L. Taylor, and J.D. Ringer. 1996. Use of spectal radiance for correcting in-season fertilizer nitrogen deficiencies in winter wheat. Trans. of the ASAE 39(5):1623-1631.
Takebe, M., T. Yoneyama, K. Inada, and T. Murakam. 1990. Spectral reflectance ratio of rice canopy for estimating crop nitrogen status. Plant and Soil. 122:295-297.
Thomas, J.R., and G.F. Oerther. 1972. Estimating nitrogen content of sweet pepper leaves by reflectance measurements. Agron. J. 64:11-13.
Tucker, C.J., B.N. Holben, J.H. Elgin, Jr., J.E. McMurtrey, III. Relationship of spectral data to grain yield variation. Photogrammetric Engr. and Remote Sens. 46(5):657-666.
Walburg, G., M.E. Bauer, C.S.T. Daughtry, and T.L. Housley. 1982. Effects of nitrogen nutrition on the growth, yield, and reflectance characteristics of corn canopies. Agron. J. 74:677-683.

OSU Soil Fertility Research 1997 Page 315
Woolley, J.T. 1971. Reflectance and transmittance of light by leaves.Plant Physiol. 47:656-662.
Table 1. Initial surface (0-15cm) soil test characteristics and soil classification at Altus, Hennessey, and Tipton, OK.______________________________________________________________________________Location pH NH4-N NO3-N P K Org. C Total N
-----------------------mg kg-1--------------------- ---------g kg-1--------Altus 7.9 7.9 6.0 22 466 10.4 0.8Classification: Tillman-Hollister clay loam (fine, mixed thermic Pachic Paleustoll)
Hennessey, 1995 5.8 18.4 21.1 142 674 12.3 1.0Hennessey, 1996 5.3 9.1 16.0 100 498 10.8 1.0Classification: Shellabarger sandy loam (fine-loamy mixed thermic Udic Argiustoll)
Tipton 7.4 5.1 7.9 30 465 8.0 0.8Classification: Tillman-Hollister clay loam (fine, mixed thermic Pachic Arguistoll)______________________________________________________________________________pH - 1:1 soil:deionized water; NH4-N and NO3-N 2M KCl extract, K and P - Mehlich-3 extraction, Organic carbon and Total N - dry combustion.
Table 2. Nitrogen rates applied to variable-rate subplots, Altus, OK, 1996._________________________________________________________________Distance Rep 1 Rep 2 Rep 3 Rep 4 Rep 5m ------------------------Nitrogen Rate, kg ha-1------------------------1.52 56 30 77 81 303.05 60 34 69 69 114.57 54 29 82 64 06.10 53 20 74 79 637.62 90 39 44 20 739.14 61 25 54 58 5110.67 51 17 60 80 2412.19 52 5 64 30 4413.72 63 33 60 35 2815.24 55 35 45 24 22_________________________________________________________________Average variable rate applied: 48 kg N ha-1

Page 316 1997 OSU Soil Fertility Research
Table 3. Nitrogen rates applied to variable-rate subplots, Hennessey, OK, 1996. Backpack sprayer method of application.______________________________________________________________________________Distance Rep 1 Rep 2 Rep 3 Rep 4 Rep 5 Rep 6 Rep 7 Rep 8 Rep 9 Rep 10m --------------------------------------Nitrogen Rate kg ha-1-----------------------------------1.52 21 83 15 74 29 43 37 46 44 883.05 20 13 27 27 27 65 90 66 42 404.57 27 17 13 9 57 52 73 43 90 96.10 14 20 13 33 66 63 55 39 60 67.62 17 38 19 27 25 65 56 51 46 379.14 33 65 30 25 26 36 66 56 77 5010.67 28 40 38 29 29 55 88 60 53 3812.19 44 31 51 32 35 37 62 88 15 013.72 47 46 61 35 32 41 88 69 37 815.24 48 30 57 42 35 50 65 60 90 2______________________________________________________________________________Average variable rate applied: 43 kg N ha-1
Table 4. Nitrogen rates applied to variable-rate subplots, Tipton, OK, 1997.________________________________________________________________Distance Rep 1 Rep 2 Rep 3 Rep 4 Rep 5m------------------------Nitrogen Rate, kg ha-1------------------------2.13 72 42 60 58 384.27 77 71 66 32 736.40 45 89 80 31 458.53 42 62 71 8 4610.67 58 66 60 17 5212.80 60 35 25 15 4314.94 70 39 19 22 6317.07 23 55 8 27 6719.20 18 19 16 26 29________________________________________________________________Average variable rate applied: 45 kg N ha-1
Table 5. Nitrogen rates applied to variable-rate subplots, Hennessey, OK, 1997.________________________________________________________________Distance Rep 1 Rep 2 Rep 3 Rep 4 Rep 5m------------------------Nitrogen Rate, kg ha-1-----------------------2.13 112 112 52 74 174.27 86 45 46 38 396.40 64 81 12 9 478.53 112 72 47 35 3010.67 62 60 34 31 1412.80 68 49 35 17 4414.94 79 71 35 8 1017.07 42 61 27 8 4019.20 49 39 32 0 3321.34 56 57 31 16 29________________________________________________________________Average variable rate applied: 46 kg N ha-1
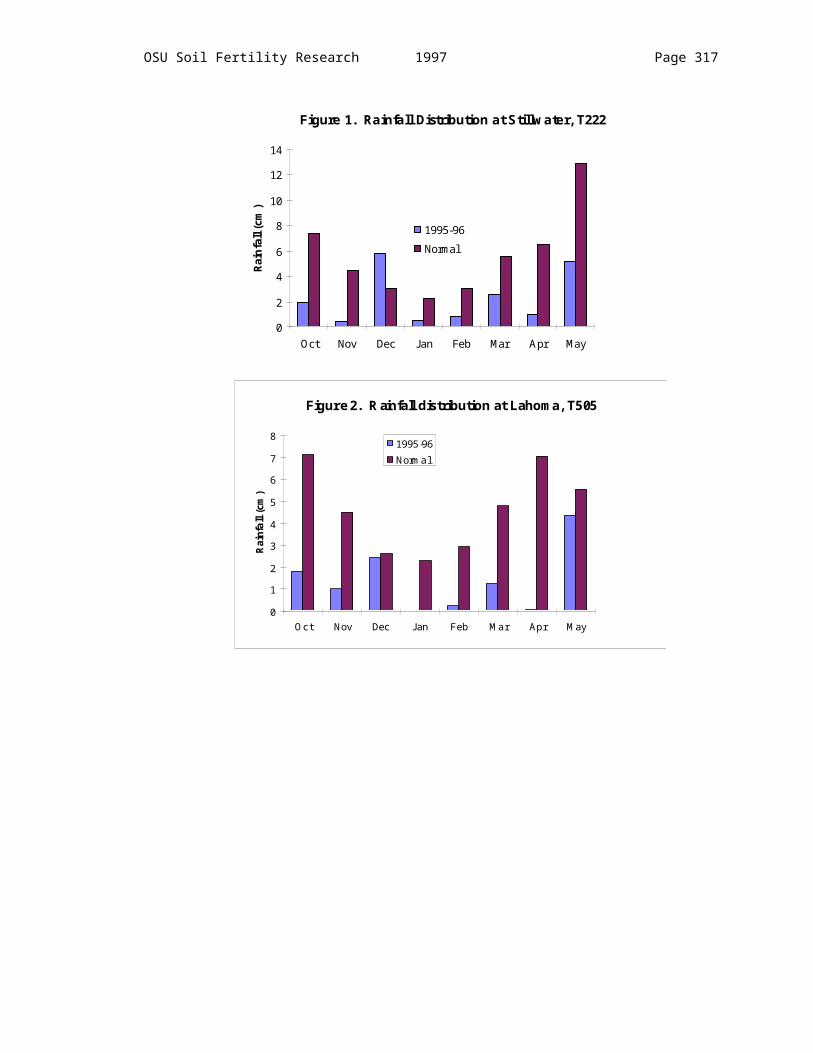
OSU Soil Fertility Research 1997 Page 317
Table 6. Analysis of variance and single-degree of freedom contrasts, Altus, OK, 1995-96.Source of variation df
Grain yield,kg ha-1
Grain total N,g kg-1
Grain N uptake, kg N ha-1
------------------------------Mean Squares------------------------------Rep 4 315503.52 64.29 149.90Nrate 3 45114.88 12.23 19.19
ContrastsN rate linear 92890.89*** 30.71*** 44.14**VRN vs 0 81.29 1.59 0.001VRN vs 45 1344.02 0.44 1.45VRN vs 90 98468.03*** 17.05** 41.37**
---------------------------Treatment Means---------------------------Nitrogen rate
(kg ha-1)0 383 131 27.6 2.2 10 345 380 123 27.7 2.0 10 390 323 101 28.6 2.0 9 3VRN (48 kg ha-1) 389 115 27.8 1.6 11 3CV 40 9.9 33SED 30 0.6 0.7
*, **, *** significant at the 0.05, 0.01, and 0.001 probability levels, respectively. VRN = variable rate N applied (average = 48, min = 0, max = 90 kg ha -1), CV = coefficient of variation, SED = standard error of the difference between two equally replicated treatment means.
Table 7. Analysis of variance and single-degree of freedom contrasts, Hennessey, OK, 1995-96.Source of variation df
Grain yield,kg ha-1
Grain total N,g kg-1
Grain N uptake, kg N ha-1
------------------------------Mean Squares------------------------------Rep 4 1976861.59 14.44 1940.80Nrate 3 189232.65 6.75 146.75
ContrastsN rate linear 499543.10* 6.6 326.49VRN vs 0 134844.96 2.39 252.31VRN vs 45 40929.19 10.85* 1.52VRN vs 90 113984.61 16.90** 4.75
---------------------------Treatment Means---------------------------Nitrogen rate
(kg ha-1)0 2072 421 32.9 1.5 68 1445 1991 430 33.2 1.8 66 1490 1972 381 33.3 1.7 66 13VRN (43 kg ha-1) 2017 472 32.7 1.2 66 15CV 27 7.3 27SED 78 0.3 2.5
*, **, *** significant at the 0.05, 0.01, and 0.001 probability levels, respectively. VRN = variable rate N applied (average = 43, min = 0, max = 90 kg ha -1), CV = coefficient of variation, SED = standard error of the difference between two equally replicated treatment means.

Page 318 1997 OSU Soil Fertility Research
Table 8. Analysis of variance and single-degree of freedom contrasts, Tipton, OK, 1996-97.Source of variation df
Grain yield,kg ha-1
Grain total N,g kg-1
Grain N uptake, kg N ha-1
------------------------------Mean Squares------------------------------Rep 4 13684.88 2.83 9.90Nrate 3 559307.54** 22.36*** 601.10***
ContrastsN rate linear 1658897.84*** 57.87*** 1773.96***VRN vs 0 301625.56** 12.75** 319.79**VRN vs 56 17351.59 6.89* 28.88VRN vs 112 545792.34*** 16.30** 587.37***
---------------------------Treatment Means---------------------------Nitrogen rate
(kg ha-1)0 539 187 28.2 1.4 15 556 675 179 29.5 1.2 20 5112 797 178 29.7 1.1 24 5VRN (45 kg ha-1) 649 219 28.9 1.2 19 6CV 36 3.0 36SED 47.3 0.2 1.4
*, **, *** significant at the 0.05, 0.01, and 0.001 probability levels, respectively. VRN = variable rate N applied (average = 45, min = 0, max = 112 kg ha-1), CV = coefficient of variation, SED = standard error of the difference between two equally replicated treatment means.
Table 9. Analysis of variance and single-degree of freedom contrasts, Hennessey, 1996-97.Source of variation df
Grain yield,kg ha-1
Grain total N,g kg-1
Grain N uptake, kg N ha-1
------------------------------Mean Squares------------------------------Rep 4 2344786.76 109.96 1162.33Nrate 3 767339.46 12.32 485.33
ContrastsN rate linear 1725990.56** 6.79 1209.96**VRN vs 0 1690.91 6.28 17.96VRN vs 56 37540.95 0.02 31.06VRN vs 112 1619635.38** 26.14** 933.10*
---------------------------Treatment Means---------------------------Nitrogen rate
(kg ha-1)0 1391 483 31.1 2.7 43 1456 1438 434 31.6 2.2 45 12112 1654 502 30.5 2.5 50 13VRN (46 kg ha-1) 1399 461 31.6 2.1 44 13CV 47.09 10.77 41.62SED 138.5 0.7 3.8
*, **, *** significant at the 0.05, 0.01, and 0.001 probability levels, respectively. VRN = variable rate N applied (average = 46, min = 0, max = 112 kg ha-1), CV = coefficient of variation, SED = standard error of the difference between two equally replicated treatment means.

OSU Soil Fertility Research 1997 Page 319
Figure 1. Relationship of grain yield, total N in the grain and grain N uptake with NDVI (4 Feb 1997, Feekes growth stage 5) on check plots, Tipton, OK, 1997.
0
1
2
3
4
5
6
7
Tota
l N in
the
Gra
in, %
0
20
40
60
80
100
120
140
160
Gra
in N
Upt
ake,
kg
ha-1
0.4 0.45 0.5 0.55 0.6 0.65 0.7 0.75 0.8 0.85
0
500
1000
1500
2000
2500
3000
3500
Gra
in y
ield
, kg
ha-1
NDVI

Page 320 1997 OSU Soil Fertility Research
Figure 2. Relationship of grain yield, total N in the grain and grain N uptake with NDVI (11 Feb 1997, Feekes growth stage 5) on check plots, Hennessey, OK, 1997.
0
1
2
3
4
5
6
7
Tota
l N in
the
Gra
in, %
y = -268.18 + 404.91x r = 0.47
0
20
40
60
80
100
120
140
160
Gra
in N
Upt
ake,
kg
ha-1
y = -8590.21 + 12963.68x r = 0.47
0.4 0.45 0.5 0.55 0.6 0.65 0.7 0.75 0.8 0.85
0
500
1000
1500
2000
2500
3000
3500
Gra
in y
ield
, kg
ha-1
NDVI

OSU Soil Fertility Research 1997 Page 321
Optimum Field Element Size for Maximum Yields in Winter Wheat Using Variable Nitrogen Rates
J.M. LaRuffa, W.R. Raun, J.B. Solie, M.L. Stone, R.W. Whitney, G.V. Johnson, S.B. Philllips, H.L. Lees, and H. Sembiring
ABSTRACTThe resolution at which variability in soil test and yield parameters exists is fundamental to the efficient use of sensor-based variable rate technology (s-VRT). This study was conducted to determine the optimum field element size which would account for the spatial variability of nitrogen in winter wheat (Triticum aestivum L.). The effect of nitrogen variability on yield was investigated at Tipton, Oklahoma, on a Tillman-Hollister (fine loamy, mixed, thermic, Pachic Arguistoll) and at Hennessey, Oklahoma, on a Shellabarger (fine loamy, mixed, thermic, Udic Argiustoll). Initial results indicate that variability exists at resolutions less than or equal to one square meter. Increased yields at smaller harvested resolutions and reduced fertilizer costs are expected from using variable nitrogen rates based on NDVI values. Therefore, s-VRT has the potential ability to detect micro-variability of nutrients on-the-go and simultaneously apply prescribed fertilizer rates based on those needs, thus implementing the potential to increase yields, decrease grower costs, and decrease the environmental impact of excess fertilizers.
INTRODUCTION
oil testing is the most widely used method to detect nutrient availability. However, a composite sample estimates the mean soil test nutrient level which does not address the variability encountered in that field (Raun et al., 1997).
Wibawa et al. (1993) evaluated the influence of soil fertility variation using grid sampling to generate detailed soil maps of each field in their study. Results indicated that variation of soil NO3-N occurred over very short distances within a 15 m2 grid. Wibawa also observed yield increases as a result of variable rate fertilization based on 15 m2 grid sampling versus a 76 m2 grid. These results indicated that a smaller grid area provided a more accurate estimate of soil nutrient availability. Penney et al. (1996) also evaluated nutrient variability using grid sampling. Results, using a 67 m2 grid, revealed very large differences in NO3-N levels within the field. This indicated that applying a constant rate of N based on a composite sample of the field would result in over fertilization of the areas with high levels of N and under fertilization of large areas with low levels of available N. Penney et al. (1996) also refers to the fact that the cost of intensive grid sampling is high and alternative methods are needed for mapping the spatial variability of soil nutrients. According to Han et al. (1994), if a field is subdivided into small enough regions (grid cells), the soil properties within the regions will be uniform, hence, application rates and actual soil productivity are more closely matched. He suggested a minimum cell size of 20 m2 would be responsive to the NO3-N distribution based on the spatial variability of crop production factors in the field. Cahn et al. (1994) characterized spatial patterns of soil properties and nutrient concentrations
S

Page 322 1997 OSU Soil Fertility Research
for site-specific farming. They concluded that reducing sampling intervals from 50 m to 1 m, would reduce the variance of soil water content (SWC), soil organic carbon (SOC), NO3-N, PO4-P, and K estimates by 74, 95, 25, 64, and 58%, respectively. They also indicated that NO3-N had the shortest correlation range (< 5 m) which refers to the distance between samples. Chancellor and Goronea (1994) stated that there may be considerable potential for sampling at <1 m intervals, as their results indicated a 12% increase in N use efficiency when application of N was based on sampling intervals <1 m versus intervals >1 m. Through the application of yield mapping to corn silage production, Vansichen and Baerdemaeker (1993) concluded that 67% of the variability in yield could be explained by the sampled soil variables. In a similar study, Mulla et al. (1992) studied variable rate fertilizer applications for the Palouse region of eastern Washington which has complex soil fertility and crop productivity patterns due to steep, highly erodible hills, resulting in drastic soil variability. Results from this study indicated that improvements in N fertilizer response were achieved by applying variable rates of fertilizer depending on landscape position.
Sensor based variable rate technology (s-VRT) has the ability to detect micro-variability of nutrients on-the-go and simultaneously apply prescribed fertilizer rates based on those needs, thus implementing the potential to increase yields, decrease grower costs, and decrease the environmental impact of excess fertilizers. A sensor based system developed at Oklahoma State University (Stone et al., 1996b) measures spectral radiance which is the radiated energy from plant and soil surfaces. Spectral radiance measurements are obtained using an integrated sensor with photodiode based sensors and interference filters for red (671+/- 6 nm) and near infrared (NIR, 780 +/- 6 nm) (Stone et al., 1996b). Measurements taken at these wavelengths can be used to calculate a normalized-difference-vegetation-index (NDVI), which has been demonstrated to be highly correlated with plant N uptake (Stone et al., 1996a), and a reliable predictor of topdress N needs (Roth et al., 1989). In order to effectively utilize s-VRT, Sawyer (1994) suggests that within-field variation must be accurately identified and reliably interpreted. Therefore, there is a need to establish the optimal field element size which is fundamental to s-VRT in order to detect micro-variability of nutrients, such as nitrogen. Solie et al. (1996) defines the field element size as that area which provides the most precise measure of the available nutrient where the level of that nutrient changes with distance. They designate 0.8 to 1.4 m as the range for the field element size. According to Raun et al. (1997), the field element size should theoretically (1) identify the smallest resolution where cause and effect relationships can be measured (2) identify the precise resolution where variances between paired samples of the same size (area) become unrelated and where heterogeneity can be recognized (3) the resolution where misapplication could pose a risk to the environment (4) the treated resolution where net economic return is achieved (inputs exclude the cost of technology) and (5) the resolution where differences in yield potential may exist. Sensing and applying fertilizer based on the field element size should provide the most precise measurement of the actual need and accurately supply the amount of nitrogen required by the crop (Solie et al., 1996).
Therefore, the objective of this study is to determine the optimum field element size for maximum yields in winter wheat using variable nitrogen rates based on sensor readings and the calculated NDVI values.

OSU Soil Fertility Research 1997 Page 323
MATERIALS AND METHODS
Two studies were initiated in January 1997 at Tipton, Oklahoma (Tillman-Hollister fine loamy, mixed, thermic, Pachic Arguistoll) and Hennessey, Oklahoma (Shellabarger, fine loamy, mixed, thermic, Udic Arguistoll). Winter wheat (Triticum aestivum L.) ‘Tonkawa’ had been previously established at both sites. The wheat was planted at Tipton on October 7, 1996 using 0.27 m row spacing and on October 2, 1996 in Hennessey using 0.19 m row spacing. At each location, a randomized complete block experimental design was employed. Four treatments, varying in harvested resolution, were replicated three times at both sites onto 53.51 m2 plots. The four treatments are defined in Table 1. Table 1. Treatment structure for resolution study.________________________________________Treatment Treatment Number of
Resolution, m2 Subplots________________________________________ 1 0.84 64 2 3.34 16 3 13.38 4 4 53.51 1________________________________________
At Feekes growth stage 5 (Large, 1954) an optical sensor developed at Oklahoma State University (M.L. Stone) measured red (671+/- 6 nm) and near-infrared (780+/- 6 nm) wavelengths in each subplot. The sensor was mounted at a height of 108 cm on the front of a John Deere model 318 lawn and garden tractor. Approximately 10 readings were taken per 0.84 m2. A normalized-difference-vegetation-index (NDVI) was calculated from the sensor measurements obtained for red and NIR uncalibrated voltage readings, according to the following equation: NDVI=(NIR-red)/(NIR+red). Based on a linear NDVI - N rate scale, variable N rates were determined for the subplots. Subplots with the lowest NDVI values received the highest fertilizer N rate (112 kg/ha) and the highest NDVI values received the lowest fertilizer N rate (0 kg/ha). This linear NDVI - N rate scale was based on previous experience reported by Stone et al. (1996a). From this linear scale, the amount of N fertilizer for each subplot was determined and the appropriate amount of ammonium nitrate was broadcast applied by hand.
RESULTS AND DISCUSSION
Based on the average NDVI readings for each subplot, a contour map was created using SURFER (Golden Software, Inc., 1995) for each site (Figure 1). The contour maps employed the kriging technique. Initial results indicate that variability exists at resolutions < 1 m2. We expect to see increased yields at smaller harvested resolutions and reduced fertilizer costs using variable nitrogen rates based on NDVI. Continuation of this study is in progress.

Page 324 1997 OSU Soil Fertility Research
1 64 0.84 m2 2 16 3.34 m2
3 4 13.38 m2
4 1 53.51 m2
Field Length: 27.97 m Treatment # of Subplots TreatmentField Width: 29.18 m ResolutionPlot Size: 53.51 m2
01 02 03 04
08 07 06 05
09 10 11 12
16 15 14 13
01 02
04 03
01 01 02 03 04
08 07 06 05
09 10 11 12
16 15 14 13
01 02 03 04
08 07 06 05
09 10 11 12
16 15 14 13
01 02 03 04 05 06 07 08
16 15 14 13 12 11 10 09
17 18 19 20 21 22 23 24
32 31 30 29 28 27 26 25
33 34 35 36 37 38 39 40
48 47 46 45 44 43 42 41
49 50 51 52 53 54 55 56
64 63 62 61 60 59 58 57
01
01 02 03 04 05 06 07 08
16 15 14 13 12 11 10 09
17 18 19 20 21 22 23 24
32 31 30 29 28 27 26 25
33 34 35 36 37 38 39 40
48 47 46 45 44 43 42 41
49 50 51 52 53 54 55 56
64 63 62 61 60 59 58 57
01 01 02 03 04 05 06 07 08
16 15 14 13 12 11 10 09
17 18 19 20 21 22 23 24
32 31 30 29 28 27 26 25
33 34 35 36 37 38 39 40
48 47 46 45 44 43 42 41
49 50 51 52 53 54 55 56
64 63 62 61 60 59 58 57
01 04
02 03
01 04
02 03
N S
Alley: 3.04 m wide
Alley: 3.04 m wide
Resolution Trial Tipton, OK 1996-97
NDVI
0.48
0.45
0.42
0.39
0.36
0.33
0.30
0.27
0.24
0.21
0.18
Figure 1. Contour map of NDVI values at Tipton, OK.
REFERENCESCahn, M.D., J.W. Hummel, and B.H. Brouer. 1994. Spatial analysis of soil fertility for site-specific crop
management. Soil Sci. Soc. Am. J. 58:1240-1248.
Chancellor, W.J. and M.A. Goronea. 1994. Effects of spatial variability of nitrogen, moisture, and weeds on the advantages of site-specific applications for wheat. Trans. ASAE 37(3):717-724.
Golden Software, Inc. 1995. SURFER for Windows: Version 6 User’s Guide. Golden Software, Inc., Golden, Colorado.
Han, S., J.W. Hummel, C.E. Goering, and M.D. Cahn. 1994. Cell size selection for site-specific crop management. Trans. ASAE 37(1):19-26.
Large, E.C. 1954. Growth stages in cereals. Plant Pathol. 3:128-129.
Mulla, D.J., A.U. Bhatti, M.W. Hammond, and J. A. Benson. 1992. A comparison of winter wheat yield and quality under uniform versus spatially variable fertilizer management. Agric. Ecosystems Environ. 38:301-311.

OSU Soil Fertility Research 1997 Page 325
Penney, D.C., S.C. Nolan, R.C. McKenzie, T.W. Goddard, and L. Kryzanowski. 1996. Yield and nutrient mapping for site specific fertilizer management. Commun. Soil Sci. Plant Anal. 27(5-8):1265-1279.
Raun, W.R., J.B. Solie, G.V. Johnson, M.L. Stone, R.W. Whitney, H.L. Lees, H. Sembiring, and S.B. Phillips. 1997. Micro-variability in soil test, plant nutrient and yield parameters in two bermudagrass pastures. (accepted, Soil Sci. Soc. Am. J.).
Roth, G.W., R.H. Fox, and H.G. Marshall. 1989. Plant tissue tests for predicting nitrogen fertilizer requirements of winter wheat. Agron. J. 81:502-507.
Sawyer, J.E. 1994. Concepts of variable rate technology with considerations for fertilizer application. J. Prod. Agric. 7:195-201.
Solie, J.B., W.R. Raun, R.W. Whitney, M.L. Stone, J.D. Ringer. 1996. Optical sensor based field element size and sensing strategy for nitrogen application. Trans. ASAE 39(6):1983-1992.
Stone, M.L., J.B. Solie, W.R. Raun, R.W. Whitney, S.L. Taylor, and J.D. Ringer. 1996a. Use of spectral radiance for correcting in-season fertilizer nitrogen deficiencies in winter wheat. Transactions of the ASAE 39(5):1623-1631.
Stone, M.L., J.B. Solie, R.W. Whitney, W.R. Raun, and H.L. Lees. 1996b. Sensors for detection of nitrogen in winter wheat. SAE Technical paper series. SAE Paper No. 961757. SAE, Warrendale PA.
Vansichen, R. and J. De Baerdemaeker. 1993. A measurement technique for yield mapping of corn silage. J. Agric. Engng. Res. 55:1-10.
Wibawa, W.D., D.L. Dludlu, L.J. Swenson, D.G. Hopkins, and W.C. Dahnke. 1993. Variable fertilizer application based on yield goal, soil fertility, and soil map unit. J. Prod. Agric. 6:255-261.

Page 326 1997 OSU Soil Fertility Research
Effectiveness of Sensor Based Technology to Detect Nitrogen Deficiencies in Turfgrass
B.M. Howell, G.V. Johnson, W.R. Raun, J.B. Solie, and M.L. Stone
ABSTRACTThe detection of nitrogen deficiencies in bermudagrass (Cynodon dactylon) and bentgrass (Agrostis palustris) is a key to developing proper management practices on golf courses and other high maintenance turf areas. This study was conducted to determine whether or not spectral technology could be used to detect nitrogen deficiencies in turfgrasses. Initial results show good correlation between NDVI and % N in two bermudagrass varieties (‘Midfield’ and Common).
INTRODUCTION ensor based technology as a replacement for soil testing has received a large amount of attention in recent years. However, much of the recent research has been done on crops and production forages. The purpose of this research is to
expand this technology into the turfgrass industry. The turfgrass industry is a multibillion dollar industry not only in the United States but the world over. In areas where turf is intensively managed, a large portion of the maintenance budget goes toward the application of fertilizer and other chemicals. These costs are high partly because managers apply everything at a constant rate over the entire turf area. If this new sensor technology proves to have the ability to sense nutrient deficiencies and areas of poor turf, and to determine the cause of these problems, it would give the turf managers the ability to treat only those areas. Therefore, they would be able to cut the cost of their maintenance budget, while at the same time, improve their maintenance practices. These advances would also help the turfgrass industry show that its turf managers are interested in becoming better environmental stewards.
S
MATERIALS AND METHODS
Two studies were initiated in May 1997 at separate locations. The bermudagrass (Cynodon dactylon) trials were initiated at the Oklahoma State University Turfgrass Research Center on previously established stands of bermudagrass. The northern site consisted of a long term stand of ‘Common’ bermudagrass and the southern site consisted of ‘Midfield’ bermudagrass. Both sites used randomized complete block experimental designs with eight treatments and four replications (thirty-two plots at each location). The plots were 3’ x 3’ with a 5’ alley between plots. The treatments consisted of four nitrogen rates (0, 1/2lb, 1lb, and 1 1/2lb/month) applied once a month and two mowing heights (1/2 inch and 1 ¼ inch) in a complete factorial arrangement of treatments. The fertilizer source in all experiments was urea ammonium nitrate (UAN), with an analysis of 28-0-0. This fertilizer was applied with a small research sprayer powered by CO2 that has a spray pattern width of five feet. The trial areas were irrigated

OSU Soil Fertility Research 1997 Page 327
immediately after fertilization. The plots were mowed twice a week and clippings were collected from selected mowings for analysis. Prior to harvesting the plots, spectral data from two overlapping bandwidths, 300-850nm and 650-1100nm, was collected within each plot using a PSD 1000 portable dual spectrometer (Ocean Optics Inc.). The PSD1000 is connected to a portable computer through a PCMCIA slot using a PCM-DAS16D/12A/D converter manufactured by Computer Boards Inc.. The fiber optic spectrometer has spectral resolution as low as 1nm, however all spectral readings were partitioned into 10 nm bandwidths (75 spectral bands per reading). After harvest, the clippings were placed in a drying oven for twenty-four hours. Once clippings were dry, they were weighed and these weights were used to calculate the growth rate for each plot. Clippings were then ground using a Cyclone Sample Mill manufactured by the UDY Corporation to transform the clippings into a homogeneous sample. These samples were then analyzed for total chlorophyll and total N.
Chlorophyll analysis was based on a procedure reported by Johnson (1974). This procedure was a simple methanol extraction in which 50 mg of sample was mixed with 50 ml of ACS grade methanol. After 20 to 22 hours the samples were gently shaken and allowed to settle for 2 hours before analyzing absorbance of the liquid portion using a Spectronic 401 spectrometer. Absorbance levels that were obtained from the spectrometer at 660 nm were converted to mg chlorophyll/liter. The concentration curve was developed by plotting the calculated chlorophyll concentrations of serial dilutions of a concentrated solution. The concentrated solution was prepared by extracting a larger quantity of plant material as described above. The calculated chlorophyll concentration for the diluted samples was obtained from absorbance measured at 650- and 665-nm wavelengths using the Spectronic 401 spectrometer, which has a 1cm path length, and applying the formula : total chlorophyll (g/liter) = 0.0256 absorbance 650 + 0.004 absorbance 665. The mg chlorophyll/liter solution will be equal to mg chlorophyll/g clippings when a 1 mg:1 ml clipping:extractant ratio is used. Total N was determined using a Carlo-Erba NA1500 dry combustion analyzer.
The bentgrass study was initiated at two separate sites. One was located at the Oklahoma State University Turfgrass Research Center and the other was located at Karsten Creek golf course. Both sites were established on SR1020 Bentgrass (Agrostis palustris) greens. A randomized complete block experimental design with four treatments and three replications was used at each site. Plots were 10’ x 5’ without alleys between the plots. Treatments consisted of four different N rates (1/8, 1/4, 1/2, and 3/4 lb N/1000 ft2/month) and these plots were also fertilized using a small research sprayer with a five foot spray width.

Page 328 1997 OSU Soil Fertility Research
RESULTS AND DISCUSSION
Based on the data that has been collected from the first bermudagrass harvest there has been good correlation between NDVI and percent N (Figure 1). There has also been fair correlation between NDVI and chlorophyll and growth rate (Figures 2 and 3). However, these are only the results from the first harvest which is the only set of data that we have right now. We expect to find good correlation between NDVI and total N, dry matter yield and total N uptake. In addition, we expect to find that the relationship between NDVI (and other indices/bandwidths) and total N in bermudagrass is dependent upon mowing height. However, it should be possible to incorporate mowing height into the resultant N calibration model for making N recommendations based on indirect sensor measurements.
Figure 1. Relationship of bermudagrass forage N and NDVI as influenced by mowing height.
North Bermuda 1/2" NDVI vs N
y = 0.418x - 0.4862R2 = 0.8431
0
0.1
0.2
0.3
0.4
0.5
0.6
0.7
0.8
2.4 2.5 2.6 2.7 2.8 2.9 3
% Nitrogen
NDVI
NDVILinear (NDVI)
North Bermuda 1 1/4" NDVI vs N
y = -0.1645x2 + 0.9617x - 0.6286R2 = 0.6952
0
0.1
0.2
0.3
0.4
0.5
0.6
0.7
0.8
0.9
1.5 1.7 1.9 2.1 2.3 2.5 2.7 2.9 3.1 3.3
% Nitrogen
NDVI
NDVIPoly. (NDVI)
South Bermuda 1/2" NDVI vs N
y = 0.0891x2 - 0.1429x + 0.4311R2 = 0.6666
0
0.1
0.2
0.3
0.4
0.5
0.6
0.7
0.8
0.9
2.4 2.5 2.6 2.7 2.8 2.9 3
% Nitrogen
NDVI
NDVIPoly. (NDVI)
South Bermuda 1 1/4" NDVI vs N
y = 0.0194x2 + 0.0246x + 0.4612R2 = 0.3328
0.56
0.58
0.6
0.62
0.64
0.66
0.68
0.7
1.5 1.7 1.9 2.1 2.3 2.5 2.7 2.9 3.1
% Nitrogen
NDVI
NDVIPoly. (NDVI)
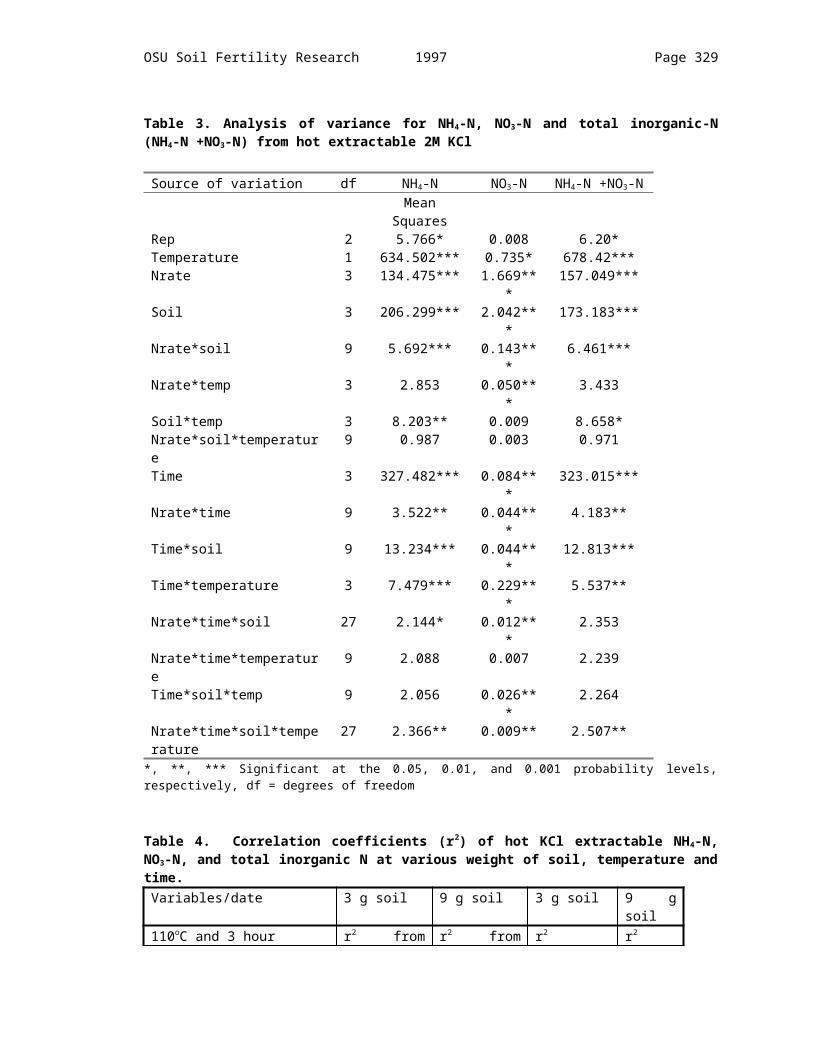
OSU Soil Fertility Research 1997 Page 329
Figure 2. Relationship of NDVI and chlorophyll as influenced by mowing height.
Figure 3. Relationship of NDVI and growth rate as influenced by mowing height.
REFERENCES
Johnson, G.V. 1974. Simple Procedure For Quantitative Analysis Of Turfgrass Color. Agron. J. 66:457-459
North Bermuda 1/2" NDVI vs Chlorophyll
y = 0.0305x2 - 0.0775x + 0.5149R2 = 0.5568
0
0.1
0.2
0.3
0.4
0.5
0.6
0.7
0.8
2 2.5 3 3.5 4 4.5
Chlorophyll mg/g
NDVI
NDVIPoly. (NDVI)
North Bermuda 1 1/4" NDVI vs Chlorophyll
y = -0.0315x2 + 0.2582x + 0.2492R2 = 0.7437
0
0.1
0.2
0.3
0.4
0.5
0.6
0.7
0.8
0.9
1.5 2 2.5 3 3.5 4 4.5 5
Chlorophyll mg/g
NDVI
NDVIPoly. (NDVI)
South Bermuda 1/2" NDVI vs Chlorophyll
y = 0.2761x2 - 1.6103x + 2.9616R2 = 0.6939
0
0.1
0.2
0.3
0.4
0.5
0.6
0.7
0.8
0.9
2 2.5 3 3.5 4 4.5
Chlorophyll mg/g
NDVI
NDVIPoly. (NDVI)
South Bermuda 1 1/4" NDVI vs Chlorophyll
y = 0.0422x2 - 0.2162x + 0.8964R2 = 0.1408
0.56
0.58
0.6
0.62
0.64
0.66
0.68
0.7
1.5 2 2.5 3 3.5 4 4.5 5
Chlorophyll mg/g
NDVI
NDVIPoly. (NDVI)
North Bermuda 1/2" NDVI vs Growth Rate
y = -1E-07x2 + 0.0004x + 0.4452R2 = 0.7318
0
0.1
0.2
0.3
0.4
0.5
0.6
0.7
0.8
0.00 200.00 400.00 600.00 800.00 1000.00 1200.00 1400.00 1600.00
Growth Rate g/1000/d
NDVI
NDVIPoly. (NDVI)
North Bermuda 1 1/4" NDVI vs Growth Rate
y = -5E-07x2 + 0.0006x + 0.6053R2 = 0.675
0
0.1
0.2
0.3
0.4
0.5
0.6
0.7
0.8
0.9
0.00 200.00 400.00 600.00 800.00 1000.00 1200.00
Growth Rate g/1000/d
NDVI
NDVIPoly. (NDVI)
South Bermuda 1/2" NDVI vs Growth Rate
y = -2E-07x2 + 0.0004x + 0.4948R2 = 0.3644
0
0.1
0.2
0.3
0.4
0.5
0.6
0.7
0.8
0.9
0.00 200.00 400.00 600.00 800.00 1000.00 1200.00 1400.00 1600.00
Growth Rate g/1000/d
NDVI
NDVIPoly. (NDVI)
South Bermuda 1 1/4" NDVI vs Growth Rate
y = -1E-07x2 + 0.0002x + 0.5859R2 = 0.4396
0.56
0.58
0.6
0.62
0.64
0.66
0.68
0.7
0.00 200.00 400.00 600.00 800.00 1000.00 1200.00
Growth Rate g/1000/d
NDVI
NDVIPoly. (NDVI)

Page 330 1997 OSU Soil Fertility Research
Expectations of Precision Phosphate Management
M.W. Goedeken, G.V. Johnson and W.R. RaunWith the advent of precision agriculture to crop production come the questions, how variable are fields and what happens when this variability is treated? This paper examines variability of available soil phosphate and some of the expected outcomes of its treatment.
Variability Of Available Soil PhosphateAMONG-FIELD VARIABILITY. Soil test phosphate (STP) varies greatly within and
among fields. Figure 1 shows the variability of STP among 50 wheat fields tested from a major wheat growing county (Garfield) in Oklahoma in 1996. These results are from composite soil samples representing the surface soil (0-6”) of fields averaging 80 acres in size. It is not surprising that variability is quite great among fields in a county with 450,000 acres of wheat. This variability is a result of large scale differences in soil types, past production levels and fertilizer use.
WITHIN-FIELD VARIABILITY. Variation in STP on a smaller scale is illustrated in Figure 2a, which shows STP values for 50 samples taken from 10 x 10’ plots along a 500 foot transect in a 50 x 500’ area used for correlating STP and wheat forage yield. Although not as great as the among-field variability, within-field variability in this small area included a four-fold difference between the lowest and highest value.
Treating Field VariabilityVARIABLE RATE. It is well established and accepted that STP variability among
fields will diminish if high testing fields receive less, or no fertilizer P, and low testing fields receive more, relative to past fertilizer P inputs. Similarly, if areas within a field are fertilized in relation to variable STP values, variability might decrease in time. This hypothesis was tested by applying a response model to the data in Figure 2a and calculating the wheat yield, P removal, and change in STP for each 10 x 10’ plot as if it had been fertilized and wheat responded according to local STP calibration (Mehlich III or Bray P1) for a projected 50 year period. The yield potential was assumed to be constant across the field at 40 bushels/acre and P the only yield limiting factor (acknowledged unrealistic assumptions).
Because grain harvest does not remove large quantities of P, and relatively small amounts of fertilizer P are required to correct the annual crop deficiency even in low STP areas, there is little change in STP variability the first 10 years (Figure 2, a-f). After 20 to 30 years, most of the STP variability in the field has been removed, and after 50 years the levels of STP are almost constant across the field.
These projections support the hypothesis that variable rate P fertilization, according to some measure of potentially available soil P, should reduce the need for variable rate applications.
CONSTANT RATE. When a constant rate of P fertilizer is applied to a field made up of many areas that differ in available soil P, variability in STP for the field does not change over time. Using the same approach as for developing Figure 2, the effect over time of a constant 46 lb/acre rate of P2O5 (100 lb/acre of DAP is a common rate) was

OSU Soil Fertility Research 1997 Page 331
evaluated (Figure 3, a-f). This figure shows variability remains almost the same and only the levels change (increase, note y-axis scale changes).
FIELD ELEMENT SIZE. Of particular interest to the consideration of precision agriculture is the treatment resolution, or field element size. That is, how small should grids be to best identify variability in the field, and what is the smallest size that should be treated? To examine these questions, the response model was used to calculate projected wheat yields, P2O5 applied, and marginal profit associated with variable rate treatment for the 50, 10 x 10’ plots when a constant P2O5 rate was applied to smaller and smaller sections of the field. Initially, the average STP of the 50 plots (47 lb/acre) was used to identify a “field” rate of P2O5 to apply. Yield for the field was predicted by using the model to calculate response for each plot based on its STP value and summing these values. Yield without P2O5 addition was similarly calculated for estimating the marginal return from fertilizing. Next, the first 25 plots and the last 25 plots were treated as separate areas of the field, each receiving a constant P2O5 rate based on the average STP for the 25 plots involved. Smaller and smaller areas of the field were independently treated until finally each 10 x 10’ plot was treated separately. Each time smaller groupings were considered, projections for the treated area (field element size) were made. Yield, P2O5, and marginal profit totals for the field were compared to that obtained when a single P2O5 rate was applied to all 50 plots. These results (Figure 4) show that as the field element size decreases, there is a gradual and then rapid increase in total yield, P2O5, and profit.
Discussion and ConclusionsGENERAL. Crop yield and profit are maximized when the ability to treat smaller
units increases to that size representing the smallest identifiably “different” unit. That is, maximum economic yield (MEY), based on marginal profit from fertilizer, is achieved when the smallest variable unit is treated. This assumes costs of identifying and treating small variable units in a field are negligible compared to conventional approaches.
AMONG-FIELD VARIABILITY. When the above conclusion is applied to variability among fields, it indicates that when fields have different fertilizer needs, they should be treated differently. Although this may seem clearly obvious, a survey of Garfield county wheat producers, participating in a free soil testing program, showed: 1) only 58% of the fields had been soil tested within the last three years; and 2) 67% of the participants treated the five fields they had tested the same, even though tests indicated large differences in fertilizer needs. Results illustrated in Figure 4 also indicate that as more and more individual fields in a community (or fertilizer dealers retail area) are regularly soil tested and treated according to the soil test recommendations, an increase in fertilizer use efficiency and farmer profit should result. If, on the average, fields in the community need fertilizer, then individual field treatment, rather than using a common fertilizer program for groups of fields, will result in increased sales of fertilizer.
WITHIN-FIELD VARIABILITY. Variability of STP in fields has been shown to exist over distances of only a few feet (Figure 2 and other intensive soil sampling data). While identification of soil P deficiency by conventional means at this level of resolution may be cost prohibitive (435 soil tests per acre), separately soil testing large portions of a field that appear to be different based on visual observation of soil color, soil type, or crop yield, should be economical. Results in Figure 4 were obtained by systematically

Page 332 1997 OSU Soil Fertility Research
reducing the treated area in half, without regard to whether a grouping of cells by STP level could be done. In many field situations large areas can be logically identified for soil testing and fertilizing independently based on soil survey and yield monitor maps.
High resolution field element size, such as 10 x 10’, may be economical to manage in precision farming when nutrient deficiencies can be identified at low cost, such as with GPS-coupled, sensor-based mapping. When that is possible, it may be important to speed the transition of buildup and depletion shown in Figure 2 by adding higher rates than required for annual correction of deficiencies. If the uniformity shown in Figure 2f could be created in five years instead of 50, then a constant rate could be used. With this approach, costs associated with each application of variable rates could be minimized.
Finally, this treatment of data clearly shows that farmers will benefit economically, in relation to the extent to which they are able to detect and treat variable fertilizer needs on the land they manage. Until new technology replaces conventional soil testing, its value for increasing yields, farmer profits, and fertilizer use could not be clearer.
Figure 1. Soil test P variability among first 50 soil tests for wheat in Garfield county Oklahoma, 1997; avg = 73.26 std dev = 39.52
0
50
100
150
200
250
300
1 5 9 13 17 21 25 29 33 37 41 45 49Sample ID
Soil
Test
P

OSU Soil Fertility Research 1997 Page 333
Figure 2. Effect of variable rate treatment on field variability with time.a) Year 1 avg = 46.96 std dev = 13.97
0102030405060708090
1 5 9 13 17 21 25 29 33 37 41 45 49Cell ID
Soil
Test
P
b) Year 10 avg = 43.57 std dev = 9.93
0102030405060708090
1 5 9 13 17 21 25 29 33 37 41 45 49Cell ID
Soil
Test
P
c) Year 20 avg = 40.71 std dev = 6.57
0102030405060708090
1 5 9 13 17 21 25 29 33 37 41 45 49Cell ID
Soil
Test
P
d) Year 30 avg = 38.77 std dev = 4.16
0102030405060708090
1 5 9 13 17 21 25 29 33 37 41 45 49Cell ID
Soil
Test
P
e) Year 40 avg = 37.54 std dev = 2.53
0102030405060708090
1 5 9 13 17 21 25 29 33 37 41 45 49Cell ID
Soil
Test
P
f) Year 50 avg = 36.79 std dev = 1.50
0102030405060708090
1 5 9 13 17 21 25 29 33 37 41 45 49Cell ID
Soil
Test
P

Page 334 1997 OSU Soil Fertility Research
Figure 3. Effect of constant rate treatment on field variability with time.
a) Year 1 (46 lbs P2O5) avg = 46.96 std dev = 13.97
10
20
30
40
50
60
70
80
90
1 5 9 13 17 21 25 29 33 37 41 45 49Cell ID
Soil
Test
P
b) Year 10 (46 lbs P2O5) avg = 57.77 std dev = 13.97
20
30
40
50
60
70
80
90
100
1 5 9 13 17 21 25 29 33 37 41 45 49Cell ID
Soil
Test
P
c) Year 20 (46 lbs P2O5) avg = 69.78 std dev = 13.97
30
40
50
60
70
80
90
100
110
1 5 9 13 17 21 25 29 33 37 41 45 49
Cell ID
Soil
Test
P
d) Year 30 (46 lbs P2O5) avg = 81.79 std dev = 13.97
45
55
65
75
85
95
105
115
125
1 5 9 13 17 21 25 29 33 37 41 45 49Cell ID
Soil
Test
Pe) Year 40 (46 lbs P2O5) avg = 93.79 std dev = 13.97
60
70
80
90
100
110
120
130
140
1 5 9 13 17 21 25 29 33 37 41 45 49Cell ID
Soil
Test
P
f) Year 50 (46 lbs P2O5) avg = 105.80 std dev = 13.97
70
80
90
100
110
120
130
140
150
1 5 9 13 17 21 25 29 33 37 41 45 49Cell ID
Soil
Test
P

OSU Soil Fertility Research 1997 Page 335
Figure 4. Relative effect of field element size on yield, P2O5 used, and marginal profit.
0
10
20
30
40
50
60
70
80
90
100
110
120
130
140
0 10 20 30 40 50 60
Cells per Treated Area
Varia
ble
Rat
e M
argi
nal G
ain/
Are
a Yield (bu)
P2O5 (lbs)
Profit ($)

Page 336 1997 OSU Soil Fertility Research
PRODUCTION TECHNOLOGY
Effect of 'AMISORB and 'MPACT' on Wheat Grain Yield
E. V. Lukina, W. R. Raun, G. V. Johnson
ABSTRACTTwo field experiments were conducted at Carrier and Hennesey, Oklahoma, to evaluate the effect of AMISORB and MPACT on winter wheat grain yield. AMISORB was broadcast and incorporated with fertilizer N preplant at rates of 1, 2 and 3 qt/ac, respectively. The application of MPACT employed rates of 1, 2 and 3 gal/10 acre. Nitrogen was applied as urea ammonium nitrate broadcast and incorporated preplant at a rate of 100 lb N/ac for all AMISORB and MPACT treatments. In addition to AMISORB and MPACT treatments, four rates of UAN without added products were evaluated (50, 100, 150, 200 lb N/ac) and an additional check with no N applied. At both locations the application of AMISORB and/or MPACT provided no significant increase in wheat grain yield.
INTRODUCTION
ome alternative approaches to increase agricultural production include the recommendation of growth enhancers. AMISORB is a new product recommended as a nutrient absorption enhancer. AMISORB is a long chain
polymer (polyaspartic acid or PAA). Polyaspartate molecules are reported to act as extensions of the plants’ root hairs. It is a syrupy material and can be easily dissolved in water or fluid fertilizers. The producers of AMISORB claim that their product enhances the plant root system, resulting in better nutrient uptake and higher yields. AMISORB is not a fertilizer or plant growth regulator
SAMISORB is also reported as being non-toxic and biodegradable, is not absorbed
by plants, and because of this no EPA restrictions apply. The manufacturers of AMISORB report that the negative charge of the polymer serves to attract nutrients and moisture, and these nutrients are then drawn into the plants’ growing root systems. The net effect is that plants are given a better chance to reach their full genetic potential. The manufacturers of AMISORB further report that because it is not dependent on the weather for activation or general performance, the decision to make the added input investment of AMISORB is not a high-risk proposition. They also note that it is predicted to give a 3 to 1 return on your investment and is recommended at one low application rate - just 2 quarts per acre.
Field trials demonstrate that AMISORB plus fertilizer can increase pepper yields up to 13.2% and cause plants to mature up to one week earlier. When used with full fertilizer rates, AMISORB is reported to increase cotton yields up to 40 %. AMISORB studies with land grant universities show that it can boost wheat yields as much as 20 to

OSU Soil Fertility Research 1997 Page 337
30%. Protein content has also been reported to increase dramatically when AMISORB is applied as recommended. As per the manufacturers, the performance claims of AMISORB are backed by several years of research and studies by major universities.Goos and Cattanach (1996) found that adding AMISORB with a 10-34-0 fertilizer increased “wheat tillering” and “sugarbeet seedling vigor”; however, no final yield increase was observed.
MPACT is registered with a 10-5-5 (N-P2O5-K2O) analysis. MPACT is noted to contain essential elements that serve as catalysts which increase the microbial activity in the soil. MPACT also is reported to contain certain extracts which cause natural fruiting and stimulate the roots. The producers of MPACT report that major universities, the USDA and farmers worldwide have proven the effectiveness of this product, but do not identify the individuals at these respective institutions. MPACT is reported to improve microbial action and soil aeration through the organic matter by loosening compacted soils and by granulating loose and sandy soils to give them a crumb structure. Lastly, MPACT producers state that it is “a product that helps cure environmental ills”.
The objective of the study was to evaluate the effect of AMISORB and MPACT at manufacturer recommended rates on winter wheat grain yield.
MATERIALS AND METHODS
In order to estimate the effect of AMISORB and MPACT growth enhancers on grain production in winter wheat, two field experiments were conducted at Carrier and Hennessey, OK. Winter wheat (Triticum aestivum L.) was planted at Carrier on a Pond Creek silt loam (fine silty mixed, thermic Pachic Argiustoll) and on a Shellabarger sandy loam (fine-loamy mixed thermic Udic Argiustoll) at Hennessey. The varieties 'Custer' and 'Tonkawa' were planted in mid-October at Carrier and Hennessey, respectively. Initial soil test results are reported in Table 1. Three different chemicals were used in the experiment: AMISORB, MPACT and Urea ammonium nitrate (UAN). All treatments with AMISORB and MPACT received 100 lb N/ac as UAN broadcast and incorporated preplant. No N was applied to the check plots (treatments 1 and 8). AMISORB was applied at rates of 1, 2 and 3 qt/ac, (1/2 fall; 1/2 spring). MPACT was applied at rates of 1, 2 and 3 gal/10ac. All N was broadcast and incorporated as UAN in the fall. A randomized complete block experimental design was used at both sites with 3 replications.
Table 1. Initial surface soil test characteristics at Carrier and Hennessey, OK._______________________________________________________________
NH4-N NO3-N P K pH--------------------- ppm ----------------------
CARRIER 7.014 16.975 36.242 353 6.06HENNESSEY 4.779 13.827 144.008 457 6.45____________________________________________________________________
RESULTS

Page 338 1997 OSU Soil Fertility Research
Wheat grain yields decreased with increasing applied N at Carrier (treatments 8-12, Table 2). All AMISORB and MPACT treatments decreased wheat grain yields when compared to the check where no N was applied. No differences were found between AMISORB and MPACT when compared to UAN alone at a comparable 100 lb N/ac rate (treatments 3 and 5 versus 10, Table 2).
At Hennessey, applied N significantly increased grain yields up to the 150 lb N/ac rate (treatments 8-12). However, similar to results at Carrier, no differences were found between AMISORB and MPACT when compared to UAN alone at a comparable 100 lb N/ac rate (treatments 3 and 5 versus 10, Table 2). AMISORB and MPACT treatments provided variable response. The coefficient of variation was high at this site (25%) and differences required to declare significance paralleled this observation.
Table 2. Average Grain Yield kg/ha (bu/ac).__________________________________________________________________
L O C A T I O NTreatment CARRIER HENNESSEYN rate(lb/ac) Other ------- Grain yield, bu/ac -------1. 0 0 50.5 20.22. 100 1gt/ac AMISORB 32.2 21.93. 100 2gt/ac AMISORB 36.4 40.64. 100 3gt/ac AMISORB 33.9 38.85. 100 1gal/10ac MPACT 36.2 20.26. 100 2gal/10ac MPACT 41.4 32.47. 100 3gal/10ac MPACT 35.4 24.68. 0 0 51.6 22.89. 50 0 50.4 33.910. 100 0 36.5 37.911. 150 0 31.1 40.312. 200 0 29.2 26.8
CV (%) 10 25SED 3.4 6.2__________________________________________________________________
REFERENCESGoos, J. R., and A. Cattanach. 1996. Effect of “Amisorb” on spring wheat and sugarbeet. Sugarbeet
Recearch and Extention Reports. 27:143-145.

OSU Soil Fertility Research 1997 Page 339
Alfalfa Yield Response to Method and Rate of Applied Phosphorus
S.B. Phillips, G.V. Johnson, J.F. Stritzke, J.L. Caddel and W.R. Raun
ABSTRACTPast experience in Oklahoma indicates that initial and maintained soil fertility levels strongly affect long-term production of alfalfa (Medicago sativa L.). Presently, there are indications which suggest that P fertilizers should be applied at two to three times the recommended rate at the time of establishment when the fertilizer can be incorporated. Preplant band-applied P fertilizer may also provide increased long-term benefit by reducing soil-fertilizer P reactions. The objectives of this work were to evaluate the effect of alternative methods of applying P fertilizer on alfalfa yield and to determine optimum P fertilizer rates and timing of application for alfalfa production. One experiment was established at the South Central Research Station in Chickasha, OK, in September 1992. Five forage harvests have been obtained each year from 1993 to 1996. A linear response to P was obtained for rates up to 672 kg P2O5 ha-1. No differences in yield were determined to exist due to source of P fertilizer. Single applications of high rates of preplant fertilizer P, either broadcast and incorporated or deep knifed in a band, have resulted in higher yields and projected higher profits than conventional annual (112 kg P2O5 ha-1) rates. This work suggests that high preplant rates should provide a P fertility foundation with the potential for sustaining yields for several years.
INTRODUCTION
lfalfa (Medicago sativa L.) is an important forage legume crop in Oklahoma. It is preferred over many other forage legumes due to its high yield potential, protein content, and palatability. Past experience in Oklahoma indicates that
initial and maintained soil fertility levels strongly affect long-term production of alfalfa. Alfalfa forage generally contains 3.0 to 4.0 % N, but because it is a legume and fixes most of its own N via rhizobial symbiosis, N fertilization on established alfalfa stands is not a common practice. Phosphorus and K make up 0.2 to 0.5 % and 1.0 to 2.0 % of alfalfa forage, respectively (Bickoff et al., 1972). This indicates that an 11.0 Mg alfalfa crop removes 22.0 to 55.0 kg P ha-1 and 110.0 to 220.0 kg K ha-1 from the soil annually which must be replaced through fertilization. When P and K fertilizers are applied to established alfalfa stands, they are normally broadcast on the soil surface. Due to the immobile nature of P and K, this practice does not maximize nutrient availability to the existing root system. Ideally, immobile nutrients should be incorporated to improve their positional availability. Sheard et al. (1971) demonstrated that band placement of P near the seed is also an effective method of fertilization at establishment of alfalfa stands. Banding not only applies the nutrient where there is the greatest chance for root contact, but also reduces the surface area of the fertilizer in direct contact with the soil which limits the potential for formation of insoluble precipitates. This is especially important
A

Page 340 1997 OSU Soil Fertility Research
when applying P on highly alkaline or highly acid soils (Johnson et al., 1997). Reducing soil-fertilizer P reactions can provide increased long-term benefit from fertilizer P.
The dilemma faced when dealing with perennial crops like alfalfa, is whether to apply two to three times the recommended rate at the time of establishment when it can be incorporated, or to broadcast smaller amounts annually. Moyer (1992) found that high rates of P fertilizer applied (320 kg P2O5 ha-1) at seeding to result in increased forage yield for several years. Malhi et al. (1992) reported residual effects of large single P applications to result in increased yields for five years. Economic comparisons of these different approaches are complex, taking into consideration such factors as local initial and annual values of the crop and fertilizer as well as interest rates for capital expended preplant as opposed to annually for fertilizer. Except for extremely inflationary times, it would seem that single large preplant rates of P would have to produce yields at least equal to those resulting from annual applications over the life of the stand or the period of reasonable comparison. Of additional concern is the effect of large additions of N when ammonium phosphates are applied at high rates preplant. High rates of N may reduce the effectiveness of rhizobial N-fixation and also encourage growth of non-legume weeds leading to lower alfalfa production. The objectives of this work were to evaluate the effect of alternative methods of applying P fertilizer on alfalfa yield and to determine optimum P fertilizer rates and timing of application for alfalfa production.
MATERIALS AND METHODS
One experiment was established in September 1992, at the South Central Research Station in Chickasha, OK, on a Dale silt loam soil. Initial soil sampling of the entire area was used to identify a homogenous area where P levels were low to medium (Mehlich III of 10 to 20 mg kg-1). The alfalfa variety 'Garst 630' was planted to the entire area at a rate of 20 kg ha-1. Supplemental water was applied as needed via irrigation. Treatment structure included method, rate, and timing of applied P (Table 1). A randomized complete block experimental design with four replications was employed. Treatment 13 (112 kg P2O5 ha-1 applied annually) was included in the structure to simulate present farmer practices. Sources of P evaluated were triple superphosphate (TSP, 0-46-0) diammonium phosphate (DAP, 18-46-0), and ammonium polyphosphate (APP, 10-34-0). All of these sources were broadcast applied using a dry fertilizer spreader or a conventional liquid applicator. The rates applied at planting were incorporated while rates applied in subsequent years were not. Two treatments involved APP being knifed 15-cm deep into the soil for both preplant and topdress application dates. This was accomplished using a custom-built band-applicator which was equipped with five knives spaced 45-cm apart. Five forage harvests were obtained each year from 1993 to 1996. A 5.0 m2 area from the center of each plot was harvested at each cutting using a ‘Carter’ forage harvester. Following each cutting, the remaining forage was harvested and removed from the entire experimental area using a conventional swather and baler. Dry matter yield was determined for all treatments. Alfalfa forage samples were subsampled and subsequently analyzed for total N and total P using a ‘Carlo-Erba 1500’ dry combustion analyzer, and HClO4 / HNO3 digestion, respectively. Significant treatment differences were determined using analyses of variance and single degree of freedom non-orthogonal contrasts (SAS, 1990).

OSU Soil Fertility Research 1997 Page 341
RESULTS AND DISCUSSION
Linear increases were observed in total alfalfa yield (1993 to 1996) as a result of applied P (Figure 1). The highest 4-yr total yield (60.7 Mg ha-1) was obtained from the 672 kg P2O5 ha-1 (knifed, preplant) rate, indicating there may be some benefit from high rates of preplant fertilizer P. It will be of interest to see if increased yield associated with this rate persists to the sixth year of the stand. The initial soil tests identified the site as having a medium P supplying capacity (80 % sufficient in P) and that an annual rate of about 90 kg P2O5 ha-1 should remove P deficiency as a yield limiting factor. However, the ‘farmer’ practice of applying the soil test recommended or slightly greater rate of 112 kg P2O5 ha-1 each year, resulted in 85 % of the maximum yield obtained from the 672 kg P2O5
ha-1 preplant knifed treatment. No significant differences in yield were determined to exist among sources of P. Increased yields were observed in 1996 as a result of biennial band-applied P versus biennial broadcast application (Figure 2). The band-applied treatment yielded 13.9 Mg ha-1, while broadcast-applying the same rate yielded 11.1 Mg ha-1. This treatment also resulted in the second highest 4-yr total yield (58.6 Mg ha-1, Figure 1). Since a final 224 kg P2O5 ha-1 application was band-applied in early 1997 (Table 1), this treatment is expected to be the highest yielding practice at the completion of the study. These results contradict Leyshon (1982) who reported band-applications to established alfalfa to have negative effects on fertilizer efficiency due to mechanical damage to the roots, soil drying, and possible disruption of N fixation. Simons et al. (1995) also reported band-applications of P into established alfalfa stands to have no benefit over broadcast applications. An issue of importance may be the timing of the band-application. Leyshon (1982) and Simons et al. (1995) both performed the banding operation in the spring when the alfalfa was actively growing. The band-applications in this study were made in February when the alfalfa was dormant. This difference may explain why benefits to band-applying P into established alfalfa stands were observed in this study and not the earlier ones. Annual K applications of 560 kg ha-1 resulted in increased yields after the third yr of the study (Figure 3). The supplemental K increased yield from 42.3 to 46.4 Mg ha-1, however this practice was not economical resulting in a loss of $20.08 ha-1. Addition of 56 kg S ha-1 was also a non-economical practice which had no effect on yield (Figure 3). Marginal profit from fertilizing, assuming alfalfa valued at $88 Mg-1 and P2O5 from DAP costing $0.59 kg-1, was greatest from the 672 kg ha-1 rate. On a per hectare per year basis, marginal profits ranged from about $48 for the annual 112 kg ha-1 rate to about $148 for the 672 kg ha-1 treatment (Figure 4).
CONCLUSIONS
A linear response of alfalfa yield to preplant P up to 672 kg P2O5 ha-1 was obtained on a medium P testing soil for four years (1993 to 1996). Single applications of high rates of preplant fertilizer P, either broadcast and incorporated or knifed in a band, have resulted in higher yields and projected higher profits than conventional annual (112 kg P2O5 ha-1) rates. No differences in yield were found due to source of P. Supplemental S did not show a response and response to K only occurred in the third year. On a per hectare per year basis, marginal profits ranged from about $48 for the annual 112 kg ha -1

Page 342 1997 OSU Soil Fertility Research
rate to about $148 for the 672 kg ha-1 treatment. A biennial band-application of 224 kg P2O5 ha-1 is expected to be the highest yielding treatment for fertilizing established alfalfa stands at the completion of this study. This work suggests that high preplant rates should provide a P fertility foundation with the potential for sustaining yields for several years.
REFERENCESBickoff, E.M., G.O. Kohler, and D. Smith. 1972. Chemical composition of herbage. Pp 247-282. In C.H.
Hanson (ed.) Alfalfa science and technology. ASA-CSSA-SSSA, Madison, WI.
Johnson, G.V., W.R. Raun, H. Zhang, and J.A. Hattey. 1997. Oklahoma Soil Fertility Handbook. Fourth ed. Dept. of Agron., Okla. Agric. Exp. Sta., Okla. Coop. Ext. Serv., Div. of Agric. Sci. and Nat. Res., Oklahoma State University, Stillwater, OK.
Leyshon, A.J. 1982. Deleterious effects on yield of drilling fertilizer into established alfalfa stands. Agron. J. 74: 741-743.
Malhi, S.S., M.A. Arshad, K.S. Gill, and D.K. McBeath. 1992. Response of alfalfa hay yield to phosphorus fertilization in two soils in central Alberta. Commun. Soil Sci. Plant Anal. 23: 717-724.
Moyer, J.R. 1992. Alfalfa yields in establishment and subsequent years after herbicide and phosphorus application during establishment. Can. J. Plant Sci. 72: 619-625.
SAS Institute. 1990. SAS/STAT user’s guide. Release 6.03 ed. SAS Inst., Cary, NC.
Sheard, R.W., G.J. Bradshaw, and D.L. Massey. 1971. Phosphorus placement for the establishment of alfalfa and bromegrass. Agron. J. 63: 922-927.
Simons, R.G., C.A. Grant, and L.D. Bailey. 1995. Effect of fertilizer placement on yield of established alfalfa stands. Can. J. Plant Sci. 75: 883-887.
Table 1. Treatment structure including weed density, method, source, rate and timing of P applied, N, K, and S applications at Chickasha, OK, 1992._________________________________________________________
Trt. Placement Source P rate ----P Timing---- K rate S rate kg ha-1 planting Years kg ha-1 kg ha-1
3 and 5 1 BI 0-46-0 336 112 112 0 02 BI 0-46-0 672 224 224 0 0 3 BI 0-46-0 672 672 0 0 04 BI 18-46-0 336 112 112 0 05 BI 18-46-0 672 224 224 0 06 BI 18-46-0 672 672 0 0 07 BI 10-34-0 336 112 112 0 08 BI 10-34-0 672 224 224 0 09 BI 10-34-0 672 672 0 0 010 BA 10-34-0 672 672 0 0 011 BA 10-34-0 672 224 224 0 0
12 CK --- 0 0 0 0 013 BI 18-46-0 672 112 112 (yrs 2, 3,4,5,6) 0 014 BI 18-46-0 672 224 224 0 56
15 BI 18-46-0 672 224 224 560 0 S applied broadcast each year as hydrated gypsum, K applied broadcast each year as potassium chloride, BI - broadcast incorporated preplant, BA - band-applied 15 cm deep, CK - check (no nutrients applied). - Broadcast treatments not incorporated.

OSU Soil Fertility Research 1997 Page 343
Tota
l Yie
ld, M
g ha
-1
CHECK
112 p
p
+ 11
2 yr 2
,3,4
112 p
p
+ 112
yr 3
224 p
p
+ 224
yr 3
672 p
p
+ 0 yr
3
224 p
p knf
+ 224
yr 3
672 p
p knf
+ 0 yr
3
0
15
30
45
60DAP APP
kg P2O5 ha-1
SED = 2.9 Mg ha-1
Figure 1. Four year response of alfalfa to preplant and subsequent annual or biennial applied P (1993 to 1996).
CHECK pp bdcst 224 + 224 yr 3
pp bdcst 672 + 0 yr 3
pp knf 224 + 224 yr 3
pp knf 672 + 0 yr 3
Yiel
d, M
g ha
-1
kg P2O5 ha-1
0
5
10
15
20 19931994
19951996
SED = 0.85 Mg ha-1
SED = 1.0 Mg ha-1 SED = 0.95 Mg ha-1SED = 1.15 Mg ha-1
Figure 2. Annual response of alfalfa to broadcast and band-applied P fertilizer.

Page 344 1997 OSU Soil Fertility Research
Tota
l Yie
ld, M
g ha
-1
Total Fertilizer Applied 1993 to 1995, kg ha-1
Average A
nnual Profit, $ ha-1
YieldProfit
448 P2O5 + 1680 K
448 P2O5 + 168 S
448 P2O5Check0
11
22
33
44
55
0
30
45
60
75
($-20)
15
SED = 2.2 Mg ha-1
Figure 3. Yield response to applied S and K fertilizer and associated marginal profit (1993 to 1995).

OSU Soil Fertility Research 1997 Page 345
100
150
200
kg P2O5 ha-1
Yiel
d, M
g ha
-1
Average A
nnual Profit, $ ha-1
profit
CHECK 112 pp+ 112 yr 2,3,4
112 pp + 112 yr 3
224 pp + 224 yr 3
672 pp + 0 yr 3
0
6
12
18
24
0
50
1993
1994
SED = 0.9 Mg ha-1
SED = 1.0 Mg ha-1
19951996
SED = 1.2 Mg ha-1
SED = 1.0 Mg ha-1
Figure 4. Annual response of alfalfa to applied P fertilizer (DAP) and associated marginal profit.

Page 346 1997 OSU Soil Fertility Research
Modification of a Self-Propelled Rotary Mower for Wheat Forage Harvest
S.L. Norton, W.E. Thomason, S.B. Phillips, and W.R. Raun
ABSTRACTMany field experiments require the collection of forage yields in addition to grain yield (small grains). In small plot research, mechanized grain harvest is common. However, forage harvest is often accomplished by hand which is time consuming and labor intensive. Sample heterogeneity increases when forage harvest is obtained by hand. The objectives of this study were to construct a mechanized forage harvester that would simplify the harvesting process while providing a homogenous sample and to determine forage yield reduction associated with using the harvester compared to hand clipping at the soil surface. A John Deere GT262 self propelled rotary mower was modified to be used for small plot wheat forage harvesting. Field trials were established at two locations to determine the yield reduction associated with using the forage harvester versus hand clipping at the soil surface. Significant differences in yield were found at both locations. The mean dry matter yield averaged over two years and two locations obtained using the harvester was 63.1% of that obtained by hand clipping at the soil surface during growth stages Feekes 6 and Feekes 10. Total N in wheat forage collected was significantly different using the harvester versus hand clipping. This is partially explained by decreased N in the lower stems at later stages of reproductive growth. The design of the harvester makes it possible to harvest several plots in a short amount of time while also allowing a larger area to be harvested which increases experimental accuracy and sample homogeneity. When the efficiency of the forage harvester (0.631) is used as a correction factor, the difference between the estimated and actual amounts of forage present is 4% of the total forage present (Feekes 6 through Feekes 10).
INTRODUCTION
inter wheat (Triticum aestivum L.) is one of the main agronomic crops produced in the southern Great Plains. Since fall-spring grazing of wheat forage by beef cattle can be a significant source of income for producers,
wheat is often produced as a dual-purpose crop being grown for both forage and grain. Considering the low value of grain in recent years, producers are becoming more interested in wheat forage production, and larger percentages of the acreage planted to wheat are being grazed prior to harvesting the grain. This creates a demand for researchers to conduct winter wheat experiments which evaluate both forage and grain yield. In small plot wheat research, mechanized grain harvest is common, however, forage harvest is often done by hand clipping which is time consuming and labor intensive. Usually, forage harvests are conducted by clipping a small area at the soil surface. Following sub-sampling, only a few of these plants are included for chemical
W

OSU Soil Fertility Research 1997 Page 347
analysis, thus failing to minimize the variation within the harvested area. The objectives of this study were to construct a mechanized forage harvester that would simplify the harvesting process while providing a homogenous whole plot sample that could be reliably sub-sampled and to determine forage yield reduction associated with using the harvester compared with hand clipping at the soil surface.
MATERIALS AND METHODS
Forage Harvester ConstructionA John Deere GT262 self-propelled rotary mower was used as the primary
element in constructing the forage harvester. Specifications for the mower are listed in Table 1. The mower was initially equipped with a John Deere Power Flow collection system. This system was composed of a side mounted fan which conveyed the forage clippings through a plastic chute into a plastic hood onto which a collection bag was fastened. The first modification was to replace the collection bag with aluminum baskets. Two frames measuring 92.71 cm x 45.72 cm x 50.80 cm were constructed using 2.54 cm aluminum angle iron. The walls of the baskets were 0.32 cm2 mesh screen. The baskets were attached to the plastic hood via 2.54 cm angle iron secured to the ends of the hood. This design provided a lightweight yet durable receptacle which could be easily removed
Table 1. Specifications for the John DeereGT262 self propelled rotary mower.____________________________________Engine: Single-cylinder, 4-cycle,
John Deere K Horsepower: 17Transmission: 6-speed Forward speed: 1.13-10.62 km/hDimensions: Width, min/max: 0.74-1.05 m Height: 1.09 m Length: 1.75 m Mower deck: 0.96 m Wheel base: 1.19 m____________________________________
Table 2. Specifications for the Power-Pakengine.____________________________________
Manufacturer: KawasakiModel: FA210D
Horsepower: 6 Cylinders: 1
Engine Speeds: Slow: 1800 rpm Fast: 4500 rpm____________________________________
when full of forage and replaced with an empty basket, minimizing time spent between plots. After the forage harvester was used, it was determined that the plastic hood would

Page 348 1997 OSU Soil Fertility Research
not support the weight of a large sample. A new hood measuring 93.98 cm x 43.18 cm x 27.94 cm was constructed using 2.54 cm angle iron and Plexiglas. The hood was mounted to a 67.31 cm piece of 10.16 cm channel iron which attached to the mower using a spring loaded pin, making the hood removable. The final modification was replacing the fan on the Power Flow. The speed of the belt driven fan was only 3400 rpm. This was not fast enough to prevent forage from plugging the conveyor chute. An FA210D Power-Pak engine was chosen as the replacement blowing system. Specifications for this unit are listed in Table 2. The blower was secured to a 30.48 cm2 plate of sheet metal mounted on a two wheel 1.07 m x 12.7 cm channel iron chassis which was attached to the harvester by a 30.48 cm x 10.16 cm channel iron extension. The plastic conveyor chute was replaced by 17.78 cm flexible duct hose. Materials used in constructing the forage harvester and their associated costs are listed in Table 3.
Table 3. Parts list and cost of materialsused in constructing the forage harvester.______________________________________Parts Cost______________________________________John Deere GT262 $5551.00Power-Pak engine 848.00Aluminum 85.00Sq. mesh screen 42.00Steel: sheet metal, angle iron 110.00 channel ironPlexiglas 45.00Flexible duct hose 45.00Misc: bolts, nuts, screws, 150.00 silicone seal, tires, hose clamps, pinsLabor 280.00 40 hours @ $7.00/hr______________________________________Total $7156.00______________________________________
Field ExperimentsHarvesting forage at the soil surface using the harvester resulted in a large
quantity of soil being included in the sample due to the vacuum created by the deck and blower. To eliminate this potential contamination problem, the mower deck must be kept 7.62 cm above the soil surface. However, this results in a percentage of the total forage production being left in the field. Therefore, field trials were necessary to determine the yield reduction associated with using the forage harvester. Two locations were selected as experimental sites. One experiment was conducted at the Oklahoma State University Agricultural Experiment Station in Stillwater, Oklahoma. The second experiment was conducted at the Agronomy Research Station north of Perkins, Oklahoma. A randomized complete block experimental design was employed with the use of paired plots for specific treatment comparisons. The trials consisted of two treatments replicated four times in established wheat fields. Treatments compared were forage yield obtained by harvesting a 9.64 m2 area using the forage harvester and forage yield obtained by harvesting the same size area using hand clippers. Forage harvests were

OSU Soil Fertility Research 1997 Page 349
taken at both locations in 1995 and 1996 when the plants were between growth stages Feekes 5 and Feekes 10. Forage yields were determined on a dry weight basis (0% moisture). Total N in the forage was determined for each sample using a ‘Carlo-Erba 1500’ dry combustion analyzer.
RESULTS AND DISCUSSION
The major advantages of using the forage harvester are reduced labor and increased whole plot sample homogeneity. The design of the harvester makes it possible to harvest several plots in a short amount of time. It also allows a larger area to be harvested which increases experimental accuracy. The overall length of the machine is only 2.16 m, making the forage harvester extremely maneuverable and easy to transport. Forage collected was determined to be representative of the amount present in the field due to the fact that no plant material was observed to be lost during any phase of sampling when using the forage harvester. Estimates of wheat forage dry matter yields were reduced when using the forage harvester as compared to hand clipping (Table 4). This is largely due to the increased height (approximately 5.0 cm) using the forage harvester compared to hand clipping which can be accomplished at < 2.54 cm. Forage collected using the harvester during growth stages Feekes 6 through Feekes 10 averaged 63.1% of that obtained by hand clipping. Forage harvester use efficiency decreased to 42.4% when the wheat was at growth stage Feekes 5. This decrease is due to substantially less plant material existing above the 7.62 cm cutting height during early growth stages. Estimates of total N from forage harvested sub-samples (Feekes 6 through Feekes 10) were significantly different from those observed for hand clipped sub-samples (Table 4). The chopping and mixing of the forage which occurred with the forage harvester resulted in a more representative sample than the hand clipped sample which consisted of a only a few plants. Lower N concentrations in basal plant stems which would have been included in the hand clipped samples may also aid in explaining these results. At the early growth stages, N is more evenly distributed within the plant, explaining why no difference was observed in total N for the samples collected at Feekes 5. When the efficiency of the forage harvester (0.631) is used as a correction factor, the Table 4. Mean wheat forage yields and total N from Stillwater and Perkins.______________________________________________________________________________
Stillwater Perkins Stillwater PerkinsFeekes 5 Feekes 6 Feekes 10 Feekes 10
______________________________________________________________________________ Yield
------------------------------------------kg ha-1-----------------------------------------Forage Harvester 349.6 A 1295.5 A 772.1 A 1358.5 AHand Clipping 824.8 B 2124.9 B 1171.1 B 2132.5 B Total N ----------------------------------------g kg-1----------------------------------------Forage Harvester 16.2 A 13.9 A 9.9 A 9.7 AHand Clipping 15.2 A 16.3 B 8.8 B 7.4 B______________________________________________________________________________Means followed by the same letter are not significantly different.

Page 350 1997 OSU Soil Fertility Research
difference between the estimated and actual amounts of forage present is 4% of the total forage present (Feekes 6 through Feekes 10). When the same correction factor is used to estimate total forage present at Feekes 5, the error is 32.8%. The difference in the size of the errors indicates that while an accurate estimate of total forage can be made using 0.631 as a correction factor for samples harvested after Feekes 6, additional work may be necessary to establish a correction factor for samples collected during earlier growth stages.
It is important to note that in addition to wheat forage, the harvester has been used on alfalfa, bermudagrass, and bluestem, and no technical limitations have been observed for any crop harvested.

OSU Soil Fertility Research 1997 Page 351
Analysis of Spring Rainfall Patterns in Oklahoma
J.M. LaRuffa, W.R. Raun, S.B. Phillips, H.L. Lees, E.V. Lukina, and D.A. Keahey
ABSTRACTPrecipitation records are often analyzed to determine trends or shifts in rainfall patterns. The objective of this study was to determine if rainfall patterns have shifted between March, April, May, and June at two locations in Oklahoma. Monthly precipitation data was analyzed between 1937 and 1996 from weather stations in Altus and Stillwater, Oklahoma. Simple linear regression equations were evaluated whereby the difference in rainfall for March-April, April-May, and May-June were regressed on year. A slope significant from zero would indicate that over time more or less rainfall was received in one month or another and that this change could be quantified with time. Statistical results indicated that rainfall patterns have not significantly changed in the past 60 years at either location.
INTRODUCTION
t has been suggested that rainfall patterns have shifted, resulting in increased precipitation in late spring months compared to 30 to 40 years ago. Some fear that a shift in rainfall patterns may result in an agricultural drought (Sinclair, 1992),
thereby affecting crop yields. As noted by Sinclair (1992), climate change may significantly alter plant growth as plants respond to factors such as increasing atmospheric CO2 concentrations, increasing temperature, and to varying amounts of available water.
IThe objective of this study was to determine if significant shifts in spring rainfall
were present at two locations in Oklahoma since 1937.
MATERIALS AND METHODS
Precipitation data was gathered from Climatological Data (U.S. Department of Commerce, 1937-1996) on a monthly basis from 1937 to 1996 for weather stations in Altus and Stillwater, Oklahoma. Cumulative differences in rainfall between March and April, April and May, and May and June were calculated for each year (e.g., March rainfall - April rainfall). A simple linear regression was performed using SAS (SAS Institute Inc., 1988) on the three sets of differences. Statistical analysis was based on two tail t-tests for slopes different from zero. In other words, a null hypothesis of no change in rainfall patterns was tested versus the alternative hypothesis of a change in patterns (p<0.05).
RESULTS
Bogardi et al. (1994) stated that in addition to rainfall, agricultural drought may be influenced by temperature and potential evaporation. However, they concluded that

Page 352 1997 OSU Soil Fertility Research
these climatic factors may shift or change according to patterns different than rainfall patterns. Sinclair (1992) stated that mineral nutrition and availability may be limited by a changed climate; however, according to Liebig’s ‘limiting factor’ concept, the productivity of plants is tied to the availability of nutrients, and climate changes may have only minimal direct impact on plant growth. Another basis for climate and yield variations may be sunspot cycles. Sunspot cycles have been analyzed in order to determine correlations with temperature, precipitation, length of growing season, radiation levels, atmospheric pressure, and high-altitude wind speed (Harrison, 1976). Research in Canada and Australia indicates that crop production and rainfall may be related to sunspot cycles (Vines, 1977). Vines’ research indicated that there appears to be long-term oscillations in rainfall which affect wide areas, although these are manifested in varying degrees from place to place. These occurrences of drought are reflected in similar fluctuations in crop yield and forest fires (Vines, 1977).
Statistical analysis indicated no significant increase or decrease in slope; and therefore, no shift in rainfall patterns. All p-values were >0.05 which indicated that the null hypothesis should be accepted. Figure 1 illustrates the monthly differences for each location, the regression equation, p-value, and correlation coefficient. Figure 2 compares the monthly rainfall patterns for the past 60 years (1937 to 1996) to the past 10 years (1987 to 1996). This figure further illustrates that a shift in rainfall patterns has not occurred between March, April, May, and June. It is important to note that although statistical analysis did not indicate a shift in rainfall patterns, other factors could contribute to what may be some form of an agricultural drought.

OSU Soil Fertility Research 1997 Page 353
Figure 1. Linear regression of monthly rainfall differences by year. STILLWATER ALTUS
-12-10
-8-6-4-20246
1937 1947 1957 1967 1977 1987 1997
Rai
nfal
l, in
ches
y=-63.717+0.032(x)p=0.13r=0.20
March - April
-14-12-10-8-6-4-202468
1012
1937 1947 1957 1967 1977 1987 1997
Rai
nfal
l, in
ches
April - Mayy=61.996-0.032(x)p=0.33r=-0.13
-10-8-6-4-202468
101214
1937 1947 1957 1967 1977 1987 1997
Rai
nfal
l, in
ches
May - Juney=-71.684+0.037(x)p=0.24r=0.16
-12-10-8
-6-4-20
24
1937 1947 1957 1967 1977 1987 1997
Rai
nfal
l, in
ches
-5-4-3-2-1
01234
1937 1947 1957 1967 1977 1987 1997
Rai
nfal
l, in
ches
March - Aprily=-42.270+0.021(x)p=0.18r=0.18
April - May
y=70.368-0.037(x)p=0.14r=-0.20
-6-4-202468
101214
1937 1947 1957 1967 1977 1987 1997
Rai
nfal
l, in
ches
y=-18.640+0.010(x)p=0.70r=0.05

Page 354 1997 OSU Soil Fertility Research
Figure 2. Monthly rainfall averages for 1937-1996 and 1987-1996
0.00
1.00
2.00
3.00
4.00
5.00
6.00
Jan Feb Mar Apr May Jun Jul Aug Sep Oct Nov Dec
Month
Rai
nfal
l, in
ches
1937-19961987-1996
Stillwater
0.00
1.00
2.00
3.00
4.00
5.00
6.00
Month
Rai
nfal
l, in
ches
Altus
Jan Feb Mar Apr May Jun Jul Aug Sep Oct Nov Dec
1937-19961987-1996
REFERENCESBogardi, I., I. Matyasovszky, A. Bardossy, and L. Duckstein. 1994. Estimation of local and areal drought
reflecting climate change. Trans. ASAE 37(6):1771-1781.
Harrison, V.L. 1976. Do sunspot cycles affect crop yields? Agricultural Economic Report No. 327:1-23.
SAS Institute, Inc. 1988. SAS/STAT User’s Guide. 6.03 ed. SAS Institute Inc., Cary, NC, USA.
Sinclair, T.R. 1992. Mineral nutrition and plant growth response to climate change. J. Exp. Bot. 43:1141-1146.
U.S. Department of Commerce. 1937-1996. Climatological Data - Oklahoma.
Vines, R.G. 1977. Possible relationships between rainfall, crop yields and the sunspot cycle. J. Aust. Inst. Agric. Sci. 43:3-13.

OSU Soil Fertility Research 1997 Page 355
Winter Wheat Forage and Grain Yield Response to Joint Band Applied Phosphorus and Gypsum
S.B. Phillips, W.R. Raun, G.V. Johnson and R.L. Westerman
ABSTRACTWinter wheat (Triticum aestivum L.) production on acidic soils is greatly affected by P availability. At low pH (below 5.5), Fe and Al react with P to form highly insoluble compounds which severely reduce the amount of plant available P. Previous research suggests that supersaturating the soil with respect to Ca2+ could induce precipitation of applied P as dicalcium phosphate (DCP) or dicalcium phosphate dihydrate (DCPD) which are more soluble than aluminum phosphates and would be slowly available with time. The objective of this study was to determine the effect of joint-band applications of P and gypsum on winter wheat forage and grain yields. Methods included P and gypsum banded with the seed, P and gypsum broadcast and P banded-gypsum broadcast at rates of 67, and 134 kg P2O5
ha-1 and 22 and 44 kg S ha-1. Sources of P included diammonium phosphate (DAP) and triple superphosphate (TSP). Zero-P and 0-S checks were also evaluated. Grain and forage yields increased when P was applied. Joint-band-applied P and gypsum maximized wheat grain and forage yields compared to P banded and S broadcast (DAP and gypsum as P and S sources, respectively). Precipitation of ammonium phosphate, DCPD and DCP may have taken place within joint N-P-S and P-S bands, reducing fertilizer P fixed as Fe and/or Al hydroxides thus increasing long-term P availability in acid soils.
INTRODUCTION
inter wheat (Triticum aestivum L.) production on acidic soils is greatly affected by P availability. At low pH (below 5.5), Fe and Al react with P to form highly insoluble compounds such as variscite and strengite, thus
severely reducing the amount of plant available P. Phosphorus can also adsorb to surfaces of Fe and Al oxides and clay minerals. This inherent fixation capacity of soils must be satisfied in order to build available P levels for optimum P nutrition and efficient management of fertilizer-P. Fertilizer-P is generally in a readily available form such as monocalcium phosphate (MCP, Ca(H2PO4)2), but can be quickly converted to slowly available forms such as dicalcium phosphate dihydrate (DCPD, CaHPO42H2O) and dicalcium phosphate (DCP, CaHPO4). Dicalcium phosphate dihydrate was found to form in soils having a water-soluble Ca to Mg ratio of approximately 1.5 or greater when orthophosphates were added to soils with varying Ca and Mg levels (Racz and Soper, 1967). Lindsay (1979) reported that MCP, which is the principal P source in ordinary superphosphate (OSP) and triple superphosphate (TSP), contained sufficient Ca2+ to precipitate half of the P as DCP or DCPD. Lindsay (1979) also indicated that inclusion of cations such as NH4
+, K+, Ca2+, and Mg2+ in fertilizers enabled these cations to be included among the initial reaction products. This research suggests that supersaturating
W

Page 356 1997 OSU Soil Fertility Research
the soil with respect to Ca2+ could induce precipitation of P as DCP or DCPD which would be slowly available with time. Gypsum (CaSO42H2O) is a compound that when applied in a joint-band with P would provide an abundant supply of Ca2+ upon dissolution. Raun and Barreto (1991) reported maize (Zea mays L.) yields in Guatemala to be maximized when N, P, and S were applied in a joint-band. They hypothesized that precipitation of DCP and DCPD did, in fact, take place within the joint-band, subsequently reducing the amount of P fixed as Fe or Al compounds. Joint-band-applied gypsum, in addition to precipitating P, can also serve as an added source of S. Sulfur deficiencies in Oklahoma soils are rare due to adequate amounts of S being added annually in the form of rainfall. However, concerns regarding S deficiencies have become more prevalent in winter wheat production systems where both wheat forage and grain are removed. Therefore, the objective of this study was to determine the effect of joint-band applications of P and gypsum on winter wheat forage and grain yields.
MATERIALS AND METHODS
One field experiment was established in the fall of 1993 at the Oklahoma State University Eastern Research Station, Haskell, Oklahoma. The soil at this site was classified as a fine, mixed, thermic Mollic Albaqualf. The experimental design was a randomized complete block with three replications. Methods of application included P and gypsum banded together with the seed, P banded with the seed and gypsum broadcast, P and gypsum broadcast, and corresponding check treatment combinations where neither P nor gypsum was applied. In addition, several non-factorial treatments were evaluated to compare TSP (0-46-0) and diammonium phosphate (DAP, 18-46-0) sources at rates of 67.2 and 134.4 kg P2O5 ha-1. Gypsum (prilled source, 17%S) broadcast treatments (22.4 and 44.8 kg S ha-1) were applied by hand due to the small weights per plot. Broadcast P and N treatments were applied using a calibrated dry fertilizer spreader. Nitrogen was applied preplant and incorporated at a rate of 112 kg N ha-1 to all plots using ammonium nitrate (34-0-0). Nitrogen rates were adjusted accordingly for carrier N in DAP treatments. A John Deere 450 grain drill was used to apply the fertilizer treatments which were banded with the seed. The 450 grain drill contained separate compartments for seed and fertilizer which were individually calibrated. Six of the treatments required banding both P and gypsum together with the seed. To accomplish this, proportional mixtures of the two sources were prepared to meet the rate requirements for each nutrient as per treatment definition (Table 1). The fertilizer box was then calibrated for each mixture. To eliminate cross-contamination resulting from different sources and mixtures being applied from the same fertilizer box, the box was vacuumed after each treatment application. The remaining plots (check and broadcast) were subsequently planted using the 450 grain drill. Fertilizer treatments were applied for three years (1993 through 1995), with the 1996-1997 crop year being harvested for analysis of residual effects. The wheat variety ‘P2163’ was used each year and was planted in early October at a rate of 88 kg ha -1 in 21-cm rows. This variety has been shown to have moderate tolerance to soil acidity. Wheat forage was collected at Feekes physiological stage 10 (late-April, Large, 1954) from a 1 x 4.5 m area using a modified rotary mower harvester (Norton et al., 1996), and subsampled for moisture determination. Grain yields were determined by harvesting the center 2.0 m over the

OSU Soil Fertility Research 1997 Page 357
entire length of 10.6 x 5 m plots using a conventional combine. Wheat straw was uniformly redistributed in all plots each year. No tillage practices were performed during the summer, so as not to disturb the fertilizer band. Weed control on the experimental area was accomplished by applying 2,4-D as needed. The plots were disked prior to planting at a depth shallow enough to provide minimal disturbance of the band (< 2 inches). Total P in the grain and forage was determined colorimetrically by the vanadomolybdate method without the use of H2SO4 in the digest (Barton, 1942 and Bolin and Stamberg, 1944). Total N in grain and forage was determined using a Carlo-Erba NA 1500 dry combustion analyzer (Schepers et al., 1989). Grain and forage uptake for N and P were determined by multiplying the respective dry matter yields times nutrient concentration (data not reported). Statistical analysis of the data was performed using procedures outlined by the SAS institute (SAS, 1990).
RESULTS AND DISCUSSION
A significant response to band-applied P was observed in each year of the study for both forage and grain production (Table 2). This response continued to be present in the residual year indicating that P fertility foundations may not be completely depleted, thus additional residual harvests will be collected. Forage yields resulting from banding P with the seed were greatest in 1994 when 134 kg P2O5 ha-1 was band-applied (6048 kg ha-1). Grain yields were greatest in 1997, also resulting from the 134 kg P2O5 ha-1
treatment (2.78 Mg ha-1). No trend in yield response to S was observed for forage or grain harvests when gypsum was applied without P (Table 2). However, when P and gypsum were banded together with the seed, higher yields were observed versus P banded alone. This response was not observed in the first year of the study, indicating that the applied P could have initially been precipitated in unavailable forms. Upon dissociation of the CaSO4H2O in the joint DAP-gypsum or TSP-gypsum band, precipitation of DCP and DCPD may have taken place because of the presence of the added Ca2+. Given that these acidic soils are known to have high P fixation capacities, DCP and DCPD could have been slowly available with time, thus reducing the amount of applied P fixed as unavailable Fe, and Al hydroxides. This would explain the increases in yield due to the joint-band in the latter years of the study. Additional residual harvests should continue to result in increased yields due to the further dissolution of the joint P-gypsum band. Broadcast applications of gypsum resulted in smaller grain yield increases than the joint-band applications. This indicated that the gypsum should be included in the band for maximum benefit.
It is hypothesized that in addition to having P precipitated in initially unavailable forms (DCP and DCPD), ammonium phosphates may also be precipitated reaction products when DAP is used as opposed to TSP. Savant and Racz (1973) have discussed the importance of P reaction products, particularly metastable intermediate products which are expected to dissolve with time. Apparently, N applied within the band is having an effect on availability of the precipitated products since the joint DAP-gypsum band produced markedly different results when compared to TSP-gypsum from 1995 through 1997 (Table 3). In 1994, the TSP band resulted in higher yields than the DAP band, indicating that perhaps the presence of NH4
+ resulted in precipitation of greater amounts of P containing compounds when DAP was used as a P source. In 1995, the

Page 358 1997 OSU Soil Fertility Research
difference between DAP and TSP began to diminish, with DAP banded with gypsum at a rate of 22 kg S ha-1 becoming more productive in 1996 and 1997 (Table 3). The absence of gypsum in the N-P band resulted in significantly lower yields for both forage and grain in the first two years of the study. This also supports the idea that gypsum needs to be included in the band rather than broadcast for maximum benefit. Previous research has demonstrated that the same P fertilizer can form many different P compounds of different solubilities in different soils (Subbarao and Ellis, 1975). Characterization of the actual band in terms of precipitated forms of P and future nutrient supplying power remains to be investigated. By inducing precipitation of applied P as initially unavailable forms, this joint N-P-S band can increase long-term P availability on acid soils.
REFERENCESBarton, C.J. 1942. Photometric analyses of phosphate rock. Anal. Chem. 20:1068-1074.
Bolin, D.W., and O.E. Stamberg. 1944. Rapid digestion method for the determination of phosphorus. Ind. Eng. Chem. Anal. Ed. 16:345-346.
Large, E.C. 1954. Growth stages in cereals. Plant Pathol. 3:128-129.
Lindsay, W.L. 1979. Chemical equilibria in Soils. John Wiley & Sons, New York.
Norton, S.L., W.E. Thomason, S.B. Phillips, S.E. Taylor, and W.R. Raun. 1995. Modification of a self propelled rotary mower for bermudagrass, alfalfa, and wheat forage harvest. In Agronomy abstracts. ASA, Madison, WI.
Racz, G.J., and R.J. Soper. 1967. Reaction products of orthophosphates in soils containing varying amounts of calcium and magnesium. Can. J. Soil Sci. 47:223-230.
Raun, W.R., and H.J. Barreto. 1991. Maize yield response as affected by phosphorus, sulfur and nitrogen as banded applications on a volcanic ash derived tropical soil. Commun. Soil Sci. Plant Anal. 22:1661-1676.
SAS Institute. 1990. SAS/STAT user’s guide. Release 6.03 ed. SAS Inst., Cary, NC.
Savant, N.K., and G.J. Racz. 1973. Reaction products of applied pyrophosphates in some manitoba soils. Can. J. Soil Sci. 53:111-117.
Schepers, J.S., D.D. Francis, and M.T. Thompson. 1989. Simultaneous determination of total C and total N and 15N on soil and plant material. Commun. In Soil Sci. Plant Anal. 20:949-959.
Subbarao, Y.V., and, Roscoe Ellis, Jr. 1975. Reaction products of polyphosphates and orthophosphates with soils and influence on uptake of phosphorus by plants. Soil Sci. Soc. Amer. Proc. 39:1085-1088.

OSU Soil Fertility Research 1997 Page 359
Table 1. Treatment structure at Haskell, OK, 1993 to 1997._________________________________________________________________
Treatment P rate Gypsum rate Method of Application_______________________________________________________________________
---kg P2O5 ha-1--- ---kg S ha-1--- ---P--- ---S---1 67 0 BWS ---2 134 0 BWS ---3 67 22 BWS BWS4 134 22 BWS BWS5 67 44 BWS BWS6 134 44 BWS BWS7 67 22 BWS BC8 134 22 BWS BC9 67 22 BC BC10 134 22 BC BC11 0 0 --- ---12 0 22 --- BWS13 0 44 --- BWS14 67* 44 BWS BC15 67* 22 BWS BWS16 67* 44 BWS BWS
_______________________________________________________________________BWS- Banded with the seed, BC- Broadcast, All P applied as TSP (0-46-0) except **- P applied as DAP (18-46-0)
Table 2. Wheat forage and grain yield response to joint-band applied P and gypsum, 1994 to 1997.______________________________________________________________________________
1994 1995 1996 1997P Rate S Rate Forage Grain Forage Grain Forage Grain Forage Grain ------kg ha -1 ------ kg ha -1 Mg ha -1 kg ha -1 Mg ha -1 kg ha -1 Mg ha -1 kg ha -1 Mg ha -1
0 0 2212.0 1.33 500.6 0.70 104.0 0.29 269.7 1.180 22 2158.5 1.42 1265.6 0.77 179.1 0.61 403.2 1.700 44 2257.9 1.32 612.3 0.73 106.9 0.43 411.7 1.5667 0 4683.8 2.03 2433.8 1.11 1084.2 2.55 1393.3 2.5467 22 4594.2 2.16 2446.1 1.07 1746.1 2.85 1428.0 2.4467 22* 4802.6 2.19 2300.5 1.14 1002.4 2.62 1249.9 2.4367 44 5046.7 2.18 2664.5 1.15 1565.7 2.57 1339.5 2.32134 0 6048.0 2.24 2767.5 0.54 1510.9 2.59 1376.5 2.81134 22 5317.8 2.16 2819.0 0.71 1494.1 2.80 1434.7 2.94134 22* 5420.8 2.00 2905.3 0.88 1685.6 2.60 1654.2 2.64134 44 5472.3 2.12 2768.6 0.83 1639.7 2.84 1654.2 2.77
SED 413.3 0.16 395.0 0.16 226.2 0.19 168.0 0.18_________________________________________________________________________________________________* - S broadcast applied, SED - standard error of the difference between two equally replicated means.
Table 3. Wheat forage and grain yield response to joint-band applied P and gypsum, with and without N included in the band.______________________________________________________________________________
1994 1995 1996 1997P S Rate Forage Grain Forage Grain Forage Grain Forage GrainSource kg ha-1 kg ha-1 Mg ha-1 kg ha-1 Mg ha-1 kg ha-1 Mg ha-1 kg ha-1 Mg ha-1
_________________________________________________________________________________________________DAP† 22 5346.9 2.14 2667.8 0.94 1364.2 2.39 820.9 2.61TSP‡ 22 4594.2 2.16 2446.1 1.07 1746.1 2.85 1428.0 2.44DAP 44 5348.0 2.27 2224.3 1.11 1184.9 2.33 1030.4 2.49TSP 44 5046.7 2.18 2664.5 1.15 1565.7 2.57 1339.5 2.32DAP 44* 4026.4 1.97 1252.2 0.76 987.8 2.53 922.9 2.21
SED 413.3 0.16 395.0 0.16 226.2 0.19 168.0 0.18_________________________________________________________________________________________________*- S broadcast applied, SED - standard error of the difference between two equally replicated means. †- diammonium phosphate (18-46-0), ‡- triple superphosphate (0-46-0).

Page 360 1997 OSU Soil Fertility Research
Bermudagrass Pasture Forage Production as Affected by Interseeded Legumes and Phosphorus Fertilization
D.A. Keahey, S.B. Phillips, B. Woods, W.R. Raun, J.L. Caddel, and G.V. Johnson
ABSTRACTBermudagrass (Cynodon dactylon L.) is a warm season perennial that is well adapted in the southern Great Plains. It is one of Oklahoma’s most important forage crops used in livestock production. Past research has investigated ways of improving the quality and quantity of this forage. The objective of this study was to determine the effect of interseeded legumes and phosphorus fertilization on bermudagrass pasture forage production. One experiment was initiated in 1993 at the Eastern Research Station, Haskell, OK, in an established bermudagrass pasture. Phosphorus was applied using a conventional dry-fertilizer spreader at rates of 0 and 67.2 kg P2O5 ha-1. Red clover (Trifolium pratense L.), ladino clover (Trifolium repens L.), alfalfa (Medicago sativa L.), and grazing alfalfa were interseeded by hand into an established stand of bermudagrass. Forage yield was collected three times throughout the growing season each year from 1994 through 1996. Neither P fertilization nor interseeding of any legume species resulted in increased total yields over the 3-yr period. The protein content of both clover mixtures were greatest over the 3-yr period, averaging 156 and 159 g kg-1. All legume species persisted well over the course of the study and could provide a desired level of palatability for livestock production. While interseeding legumes into established bermudagrass pastures may not result in increased yields, the practice may provide an efficient way to improve pasture quality without the use of inorganic fertilizers.
INTRODUCTION
ermudagrass (Cynodon dactylon L.) is a warm season perennial that is well adapted in the southern Great Plains. It is one of Oklahoma’s most important forage crops used in livestock production. Present research has investigated
ways of improving the quality and quantity of this forage for animal consumption. Previous work found that overseeding legumes in grass can be a successful method of increasing overall forage production. Many legumes grow well when combined with bermudagrass, provided the soil moisture and plant nutrient requirements of the legume are met and the mixture is managed properly (Barnes et al., 1995). Haque and Jutzi (1984) estimated that between 50 and 400 kg N ha-1 can be annually fixed by legumes, making a significant contribution to soil fertility, pasture yield and its associated animal production, and any following food crop. Evers (1985) reported that overseeding clovers into bermudagrass and bahiagrass (Paspalum notatum L.) improved seasonal forage distribution by providing usable forage one to two months earlier. Stringer et al. (1994) noted that alfalfa (Medicago sativa L.) interseeded into bermudagrass rapidly reduced bermudagrass vigor, possibly due to a shading effect created by the alfalfa. This work
B

OSU Soil Fertility Research 1997 Page 361
also noted that grass-legume pastures should contain balanced mixtures of species for quality maintenance and bloat prevention. Knight (1970) reported that total forage production was 47% higher in a clover-bermudagrass mixture than in bermudagrass fertilized with 224 kg N ha-1. Baker (1980) noted that interseeding red clover (Trifolium pratense L.) and white clover (Trifolium repens L.) into established pastures increased yield and skewed the seasonal distribution pattern toward a higher percentage of total yields being produced earlier in the season. Dubbs (1971) found grasses to result in higher production when competing with legumes than when competing with other grasses. Forage legumes benefit pastures and hay crops by fixing N, improving seasonal distribution of growth, and enhancing animal performance, but their lack of persistence is viewed as a major limitation (Bueselinck et al., 1994). Barnes (1995) noted that after a good forage stand was established and properly managed throughout the seeding year, continued production and persistence depended on good management practices which included maintaining optimum levels of soil fertility, controlling weeds and insect pests, and implementing a proper harvest schedule. One of the main components of forage quality is percent crude protein content of the plant. Brown and Byrd (1990) reported that alfalfa had almost twice the crude protein concentration of bermudagrass fertilized with 100 kg N ha-1. Likewise, when fertilized with 500 kg N ha-1, crude protein content of bermudagrass was only 80% of the average of the alfalfa-bermudagrass mixtures. The objective of this study was to determine the effect of interseeded legumes and phosphorus fertilization on bermudagrass pasture forage production.
MATERIALS AND METHODS
One experiment was initiated in 1993 at the Eastern Research Station, Haskell, OK, in an established bermudagrass pasture on a Taloka silt loam (fine-mixed, thermic Mollic Albaqualf). The experimental design employed at this site was a randomized complete block with three replications. Plot size was 4.9 x 12.0 m. Shallow disking (5 to 7 cm) was performed on the bermudagrass prior to application of the triple superphosphate fertilizer. Phosphorus was applied using a conventional dry-fertilizer spreader at rates of 0 and 67.2 kg P2O5 ha-1. Red clover, ladino clover (Trifolium repens L.), alfalfa, and grazing alfalfa (Medicago sativa L.) were interseeded by hand into the established stand of bermudagrass. The ladino clover was seeded at a rate of 3.4 kg ha -1, while all other species were seeded at 9.0 kg ha-1. After interseeding, the experimental area was press-wheel packed. Forage yield was collected three times throughout the growing season each year from 1994 through 1996. Forage yield was determined by harvesting a 1.0 x 12.0 m area within each plot using a self propelled modified rotary mower (Norton et al., 1995) at a height of 7.6 cm. Harvested biomass was subsampled for moisture determination and chemical analysis. All forage samples were dried in a forced air oven at 70°C and ground to pass through a 100 mesh screen. Total N was determined on all samples using dry combustion (Schepers et al., 1989). Crude protein was determined by multiplying total N by 6.25 (Tkachuk, 1969). Analysis of variance and mean separation were performed using SAS (SAS, 1990).

Page 362 1997 OSU Soil Fertility Research
RESULTS AND DISCUSSION
Phosphorus fertilization did not result in increased yields in any year of the study. Analysis of the combined 3 year total yields also showed no differences between the check (no legume interseeding) when compared to the treatments with legume interseeding (Table 1). Some by-year treatment differences were observed, however, most were small and inconsistent with time. In 1994, the alfalfa-bermudagrass mixture had lower yields compared to the bermudagrass alone (Table 1). The quality of the alfalfa stand in these plots was observed to be poor when visually compared to the other legumes which had good stands. In 1995, red clover was the most prominent legume species. The red clover-bermudagrass mixture also resulted in the highest forage yield for the year (Table 1). The alfalfa stands improved in 1995, while the ladino clover remained good. By 1996, all legume species were well established in the study. Red clover remained the most prominent, covering as much as 60% of the plot area. Ladino clover coverage was estimated to be 15 to 30%, while alfalfa coverage was rated at 10 to 20%. No yield differences due to legume interseeding were observed in 1996. Average protein content of the forage over the 3-yr period was affected by legume interseeding (Table 1). Work by LaRue and Patterson (1981) noted that red clover can produce an average of 154 kg N ha-1 yr-1, while alfalfa and ladino clover can fix an average of 212 and 165 kg N ha-1 yr-1, respectively. This would suggest that the alfalfa-bermudagrass mixture should have had the highest protein content as a result of the additional plant available N. However, the protein content of both the red clover-bermudagrass and the ladino clover-bermudagrass mixtures were greater than the alfalfa-bermudagrass mixture or bermudagrass alone, averaging 156 and 159 g kg-1 over the 3-yr period, respectively. This was probably due to the early establishment success of the clovers compared to the alfalfa. In 1996, the alfalfa-bermudagrass mixture had slightly higher protein content (120 g kg-1) when compared to red clover-bermudagrass (116 g kg-1) and ladino clover-bermudagrass (114 g kg-1). The poor initial stand of alfalfa probably resulted in less than normal fixation taking place during the first year of the study. The first harvest in 1997 (data not reported) resulted in the alfalfa-bermudagrass mixture yields being greater than the bermudagrass alone. All legume species have persisted well over the four year study and should provide a desired level of palatability for livestock production. While interseeding legumes into established bermudagrass pastures may not result in increased yields, the practice may provide an efficient way to improve pasture quality. Soil test analysis was not complete at this writing, but, should assist in detecting added treatment differences.
REFERENCESBaker, B.S. 1980. Yield, legume introduction, and persistence in permanent pastures. Agron. J. 72:776-
780.
Barnes, R.F., D.A. Miller, and C.J. Nelson. 1995. Forages: An introduction to grassland agriculture. Fifth ed. Iowa State University Press, Ames, IA.
Bueselinck, P.R., J.H. Bouton, W.O. Lamp, A.G. Matches, M.H. McCaslin, C.J. Nelson, L.H. Rhodes, C.C. Sheaffer, and J.J. Volenec. 1994. Improving legume persistence in forage crop systems. J. Prod. Agric. 7:311-322.

OSU Soil Fertility Research 1997 Page 363
Brown, R.H. and G.T. Byrd. 1990. Yield and botanical composition of alfalfa-bermudagrass mixtures. Agron. J. 82:1074-1079.
Dubbs, A.L. 1971. Competition between grass and legume species on dryland. Agron. J. 63:359-362.
Evers, G.W. 1985. Forage and nitrogen contributions of arrowleaf and subterranean clovers overseeded on bermudagrass and bahiagrass. Agron. J. 77:960-963.
Haque, I. and S. Jutzi. 1984. Nitrogen fixation by forage legumes in sub-Saharan Africa: Potential and limitations. ILCA bulletin 20. Addis Ababa, Ethiopia.
Knight, W.E. 1970. Productivity of crimson and arrowleaf clovers grown in a coastal bermudagrass sod.
Agron. J. 62:773-775.
LaRue, Thomas A. and Thomas G. Patterson. 1981. How much nitrogen do legumes fix? In Advances in Agronomy. Vol. 34. Academic Press Inc. Ithaca, NY.
Norton, S.L., W.E. Thomason, S.B. Phillips, S.E. Taylor, and W.R. Raun. 1995. Modification of a self propelled rotary mower for bermudagrass, alfalfa, and wheat forage harvest. In Agronomy abstracts. ASA, Madison, WI.
SAS Institute. 1990. SAS/STAT user’s guide. Release 6.03 ed. SAS Inst., Cary, NC.
Schepers, J.S., D.D. Francis, and M.T. Thompson. 1989. Simultaneous determination of total C, total N, and 15N on soil and plant material. Commun. In Soil Sci. Plant Anal. 20:949-959.
Stringer, W.C., A. Khalilian, D.J. Undersander, G.S. Stapleton, and W.C. Bridges, Jr. 1994. Row spacing and nitrogen: Effect on alfalfa-bermudagrass yield and botanical composition. Agron. J. 86:72-76.
Tkachuk, R. 1969. Nitrogen-to-protein conversion factors for cereals and oilseed meals. Grain Research Laboratory. Winnipeg, Manitoba.
Table 1. Annual and total forage yields and protein contents for legume-bermudagrass mixtures, 1994 to 1996.______________________________________________________________________________P Rate Legume Yield Protein Yield Protein Yield Protein YieldProteinP2O5, Mg ha-1 g kg-1 Mg ha-1 g kg-1 Mg ha-1 g kg-1 Mg ha-1 g kg-1
kg ha-1 ------1994------ ------1995------ ------1996------ ------Total------______________________________________________________________________________0 none 5.7 166 6.9 163 4.6 110 17.2 14567 none 5.1 157 6.4 167 4.5 115 16.0 1460 ladino clover 5.9 185 6.2 184 4.6 115 16.7 16067 ladino clover 5.3 181 6.3 179 4.5 112 16.1 1570 red clover 5.2 188 6.5 179 4.3 119 16.0 16267 red clover 4.7 169 7.2 165 4.4 113 16.4 1490 grazing alfalfa 4.8 159 6.9 169 4.8 110 16.1 14567 grazing alfalfa 4.9 149 7.0 151 4.1 116 16.0 1390 alfalfa 4.5 162 6.3 169 4.7 130 15.5 15467 alfalfa 5.1 149 6.7 159 4.0 120 15.8 143
SED 0.6 21 0.5 24 0.6 16 1.4 29______________________________________________________________________________

Page 364 1997 OSU Soil Fertility Research
Switchgrass Response to Harvest Frequency, and Time and Rate of Applied Nitrogen
W.R. Raun, C.M. Taliaferro, G.V. Johnson and S.B. Phillips
ABSTRACTTwo field experiments were initiated in the spring of 1996 to evaluate switchgrass response to applied N (0, 100, 200, 400 and 800 lb N/ac), harvest frequency (once at the end of September, twice-mid June and September and three times-May, mid July and September) and time of application (all in April, 1/2 in April and 1/2 following the first harvest, and 1/3 in April, 1/3 following the first harvest and 1/3 applied following the second harvest). The experimental sites are located at Chickasha (Dale silt loam) and Perkins (Teller sandy loam, fine-loamy, mixed, thermic Udic Argiustoll), OK. An additional experimental site at Efaw was started but stand establishment restricted continuation at this location. A randomized complete block experimental design was used at both locations with an incomplete factorial arrangement of treatments. Individual plot sizes were 10'x10' with 20 foot alleys. Three replications were included at each site. The northern lowland variety 'Kanlow' was broadcast seeded at both sites at a rate of 8-10 lbs/acre. In the spring of 1996, preplant rates of 100 lb N/ac, 200 lb P2O5/ac and 500 lb K2O/ac were applied to the entire area. Switchgrass was harvested at a height of 4-6" using a conventional 'Carter' harvester. Only data for two harvests has been compiled for the Chickasha site. Harvest means and preliminary totals (all treatments lack one harvest) suggest that yield maximums will be achieved somewhere between 400 and 800 lb N/ac/year. Harvest frequency and time of N applied will be monitored at both sites for a minimum of 3 years.
Table 1. Treatment definitions, and switchgrass dry matter means for the first two harvests, Chickasha, OK, 1997._________________________________________________________________________________________________________Trt. N Method N rate Number of Harvests First Harvest Second Harvest Third Harvest Total 31-Jul 28-Aug 11-Sep
------------------------------- lb /acre ----------------------------------1 . 0 1 02 . 0 2 7567 75673 . 0 3 4984 3970 89544 April 100 1 05 April 200 1 06 April 400 1 07 April 800 1 08 April 100 2 5664 56649 April 200 2 9369 936910 April 400 2 10104 1010411 April 800 2 7548 754812 April 100 3 8783 2634 1141713 April 200 3 7751 3721 1147214 April 400 3 9106 3920 1302615 April 800 3 9024 3040 1206416 2-way split 100 2 8979 897917 2-way split 200 2 9293 929318 2-way split 400 2 8205 820519 2-way split 800 2 5860 586020 3-way split 100 3 7347 3175 10522

OSU Soil Fertility Research 1997 Page 365
21 3-way split 200 3 6699 3785 1048422 3-way split 400 3 9524 3892 1341623 3-way split 800 3 7765 3104 10869
Sulfur and Chloride Response in Winter Wheat
G.V. Johnson, S. B. Phillips and W.R. Raun
Sulfur and chloride are two essential plant nutrients, occasionally found to be deficient in winter wheat. These nutrients have received considerable attention in various parts of the United States in the past 20 to 30 years. Sulfur functions in plants as an important element in three amino acids and is thus critical to the normal development of proteins in plants (and animals). Chloride is believed to be essential in plant regulation of water. Both elements are absorbed as in chemical forms that are quite mobile in soils (move with water). Consequently, deficiencies of these elements should be expected when high yields are produced in deep, sandy soils that are low in soil organic matter.
MATERIALS AND METHODS
n the fall of 1995 three locations were identified for continued evaluation of wheat response to sulfur and chloride. The Carrier location is similar to the location where an earlier four year study was conducted (1992-1995). The Hennessey location is
typical of the environment for wheat production in the large Northcentral Oklahoma region. The Perkins location is on a deep, sandy, low organic matter soil, subject to leaching of mobile nutrients like Cl and S.
ISulfur trials are randomized complete block experiments with three reps and
sulfur levels of 0, 50, 100, and 200 lb S/acre applied preplant annually in the form of gypsum (Calcium sulfate, 17 % S). The chloride trials are similar to the sulfur trials except chloride is present at rates of 0, 30, and 60 lb Cl/acre, applied preplant as calcium chloride (60.7 % Cl), and only grain is harvested. Plot size for all trials is 16 by 20 feet. In 1995 only grain was harvested because the extremely dry weather did not produce significant fall and winter forage. Both grain and forage were harvested during the 1996-97 production year, during which rainfall was normal or above normal for forage production. Grain production for the 1996-97 season was negatively influenced by late freezing (April 13-15) but positively influenced by excellent grain filling conditions.
RESULTS AND DISCUSSION
1996 YieldsGrain yields were exceptionally good at the Carrier and Hennessey locations, in
spite of the relatively dry year. Nevertheless, even with these high yields there was no significant response to chloride at these two locations (Table 1). Chloride, at the 60 lb/acre rate resulted in a 25 bushel yield at Perkins. This yield was 6.0 bushels above the no-chloride control and 4.3 bushels above the 30 lb/acre chloride treatment. These yield

Page 366 1997 OSU Soil Fertility Research
responses to chloride were statistically significant, and are likely a result of the sandy location that allowed chloride to be leached out the previous year (above average rainfall) and the crop to be under unusual drought stress in the 1995-96 season.
There were no significant responses to sulfur applications at any of the three locations (Table 2) in 1995.
Table 1. Wheat Response* to Chloride at Three Locations in 1996Cl Rate Carrier Hennessey Perkins(lb Cl/acre) Wheat yields (bu/acre)0.0 42.1 42.9 19.030.0 41.5 41.6 20.760.0 43.5 41.9 25.0
SED* 6.8 3.7 2.1* SED = Standard Error of Difference between equally replicated means. Mean yields for a given location must differ by roughly 2 times the SED in order to be significantly different.
Table 2. Wheat Response* to Sulfur at Three Locations in 1996.S Rate Carrier Hennessey Perkins(lb S/acre) Wheat Yield (bu/acre)0.0 44.8 41.0 23.250.0 44.7 41.0 22.9100.0 41.7 40.7 25.8200.0 43.6 41.0 21.3
SED* 2.9 2.2 2.8* SED = Standard Error of Difference between equally replicated means. Mean yields for a given location must differ by roughly 2 times the SED in order to be significantly different.
1997 YieldsWheat grain response to chloride in 1997 was similar to that found for 1996.
Yields were relatively high at Carrier and Hennessey, but there was no response to chloride. At the Perkins location yields were extremely poor, but there was a small and significant response to the 60 lb Cl/acre application.
Table 3. Wheat Response to Chloride at Three Locations in 1997Cl Rate Carrier Hennessey Perkins(lb S/acre) Wheat Yield (bu/acre)0.0 54.0 30.7 9.430.0 55.0 32.2 9.860.0 55.3 39.5 12.4SED 4.8 7.5 1.0
Wheat grain yields responded significantly to the addition of 200 lb S/acre applied as gypsum at the Hennessey location where an 8.2 bu/acre increase was measured (Table 4). At the Carrier location, where yields averaged 60 bu/acre, there was no
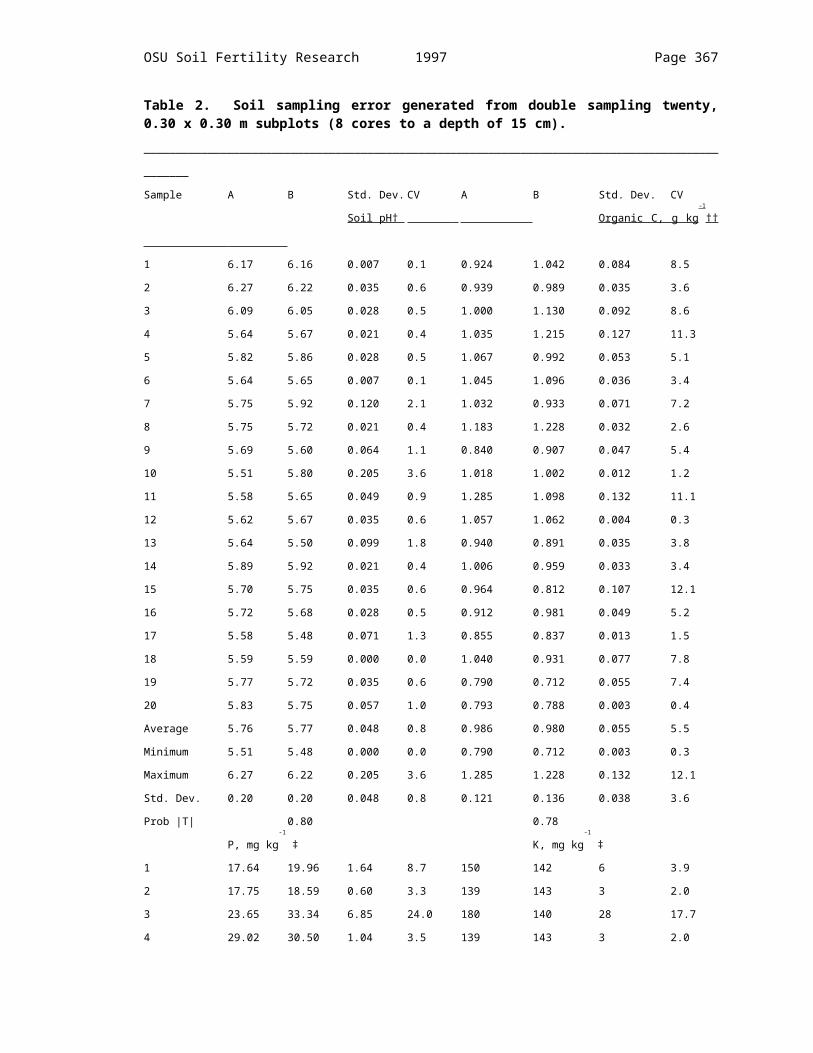
OSU Soil Fertility Research 1997 Page 367
response to sulfur. Similarly, although yields were much lower, there was no grain response to sulfur at Perkins.
Total forage production from fall (Feekes 4) and winter (Feekes 10) harvests showed no response to sulfur at either the Carrier or Hennessey sites. At the Perkins site there was a significant response to 100 lb S/acre but not to either 50 lb S or 200 lb S/acre. This is unusual, since gypsum is non-toxic and one would expect that if the 100 lb rate caused a positive response that the 200 lb rate would also cause a positive response.
Table 4. Wheat Response to Sulfur at Three Locations in 1997S Rate Carrier Hennessey Perkins(lb S/acre) Wheat Yield (bu/acre)0 60.4 37.5 15.850 60.2 38.6 16.0100 57.0 35.4 19.2200 61.4 45.7 16.3SED 4.2 1.4 2.3
Forage Yield (lb/acre)0 3309 10094 436350 2864 9720 3788100 4417 8987 5409200 3621 10193 3846SED 884 2092 331
SUMMARY AND CONCLUSIONS
Twelve site years of examining wheat grain response to chloride and sulfur have resulted in three positive responses. Two of these significant responses have been to the application of chloride, at the Perkins site, where yield levels have been relatively poor (11 to 22 bu/acre). One significant grain response to sulfur was found, and it was at the Hennessey site, but only at the 200 lb S/acre rate in 1997. In the same year forage yields were abnormally large, but there were no significant responses to applied sulfur at this site. The only significant forage response to sulfur came at the Perkins site, but only at the intermediate rate.
Continued inconsistencies, in the response of wheat grain and forage to the application of chloride and sulfur fertilizer, point to the need for additional research. This needs to be completed before reliable estimates of response to these elements can be predicted.

Page 368 1997 OSU Soil Fertility Research
Appendix Table 1. Conversion factors and relationships between English and metric units.______________________________________________________________________________Yield and Rate
lb/ac * 1.12 = kg/habu/ac * 67.2 = kg/ha (60 lb test weight)bu/ac * 0.0672 = Mg/ha (60 lb test weight)1 Mg/ha = 14.88 bu/ac (60 lb test weight)
Area
1 hectare = 1000 m2
1 acre = 43560 ft21 acre (ac) = 0.405 hectares (ha) 1 ha = 2.47 ac
Length
1 inch (in) = 2.54 centimeters (cm) 1 cm = 0.393 in1 foot (ft) = 30.48 centimeters (cm)1 mile (mi) = 1.609 kilometers (km); 1 mile=5280ft 1 km = 0.621 mi1 yard (yd) = 0.914 meters (m) 1 m = 1.094 yd1 mile2 (mi) = 259 hectares (ha)
Volume
1 gallon (gal) = 3.785 liters (l) 1 l = 0.264 gal1 quart (qt) = 1.057 liters (l) 1 l = 0.964 qt
Mass
1 kilogram (kg) = 1000 grams (g)1 Megagram (Mg) = 1000 kilograms (kg)1 ounce (oz) = 28.35 grams (g) 1 g = 0.03527 oz1 pound (lb) = 0.454 kilograms (kg) 1 kg = 2.205 lb1 ton (2000 lb) = 907 kilograms (kg)
Temperature
Centrigrade (°C) = 5/9 (°F - 32)Fahrenheit (°F) = (9/5 °C) + 32
______________________________________________________________________________