introduction on comorbidities in hiv ... - virology...
TRANSCRIPT

Introduction
on Comorbidities
in HIV-Infected Individuals
TAIWAN SYMPOSIUM ON HIV COMORBIDITIES 2016Kaohsiung, 1 October 2016
Esteban Martinez

Agenda
• Co-morbidities: HIV+ vs HIV-
• Mortality in HIV+ patients
• Effects of ageing on HIV
• Effects of HIV on ageing

Agenda
• Co-morbidities: HIV+ vs HIV-
• Mortality in HIV+ patients
• Effects of ageing on HIV
• Effects of HIV on ageing
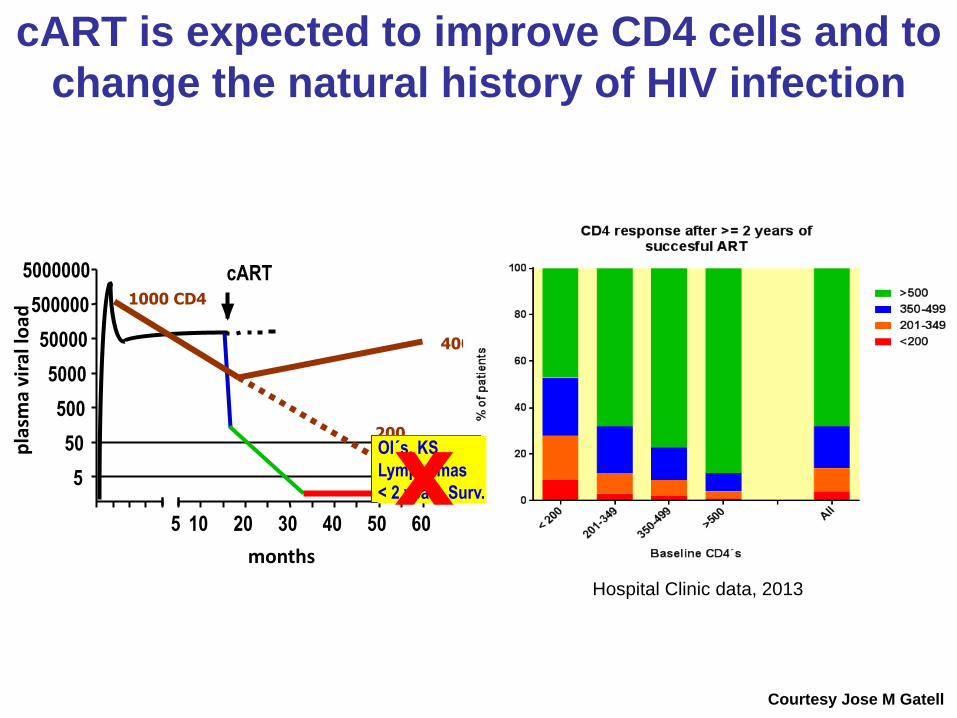
cART is expected to improve CD4 cells and to
change the natural history of HIV infection
Courtesy Jose M Gatell
5
50
500
5000
50000
500000
5000000
5 10 20 30 40 50 60
months
pla
sma
vira
l lo
ad
cART1000 CD4
400
200OI´s, KS
Lymphomas
< 2 years Surv.xHospital Clinic data, 2013

A
RR 1.75p <0.0001*
0
2
4
6
8
10
12
HIV+ HIV-
Even
ts P
er
100
0 P
Ys
B
0
20
40
60
80
100
18-34 35-44 45-54 55-64 65-74
Age Group (Years)
Triant V et al. J Clin Endocrinol Metab 2007
* Adjusted for age, gender, race, hypertension, diabetes and dyslipidaemia.
Proportion of patients with hypertension, diabetes and dyslipidaemia
significantly higher in HIV-positive vs HIV-negative cohort
n = 1,044,589
n = 3,851
# of MI 189 26,142E
ven
ts P
er
100
0 P
Ys
HIV-infected patients have a higher incidence
of myocardial infarction

0
0.5
1
1.5
2
2.5
3
3.5
All Vertebral Hip Wrist
Fra
ctu
re p
revale
nce/1
00 p
ers
ons
Triant VA et al. J Clin Endocrinol Metab 2008
Population-based study
8,525 HIV-infected patients
2,208,792 non HIV-infected patients
HIV+
HIV-
p<0.0001
P<0.0001
p<0.0001
p=0.001
Greater rate of fractures in HIV- infected
patients vs un infected individuals
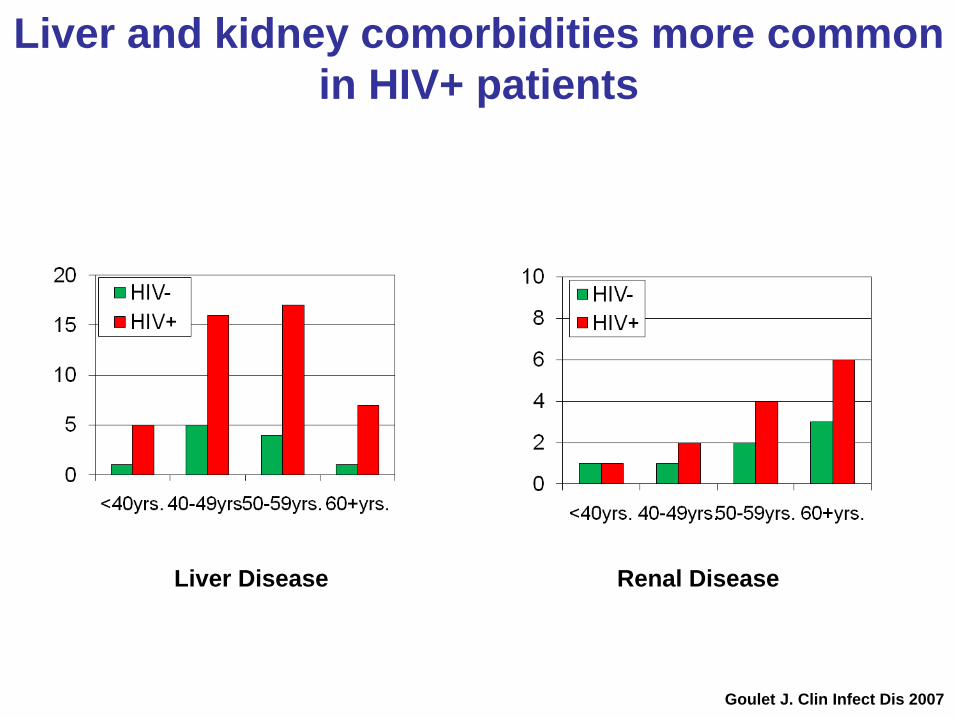
Liver Disease Renal Disease
Goulet J. Clin Infect Dis 2007
Liver and kidney comorbidities more common
in HIV+ patients

0
10
20
30
40
50
60
HIV- CDC-A CDC-B CDC-C
Heaton R et al. J Neurovirol 2011
Perc
ent im
pair
ed
Neurocognitive impairment remains highly
prevalent despite of cART
Pre-cART
cART
HIV+
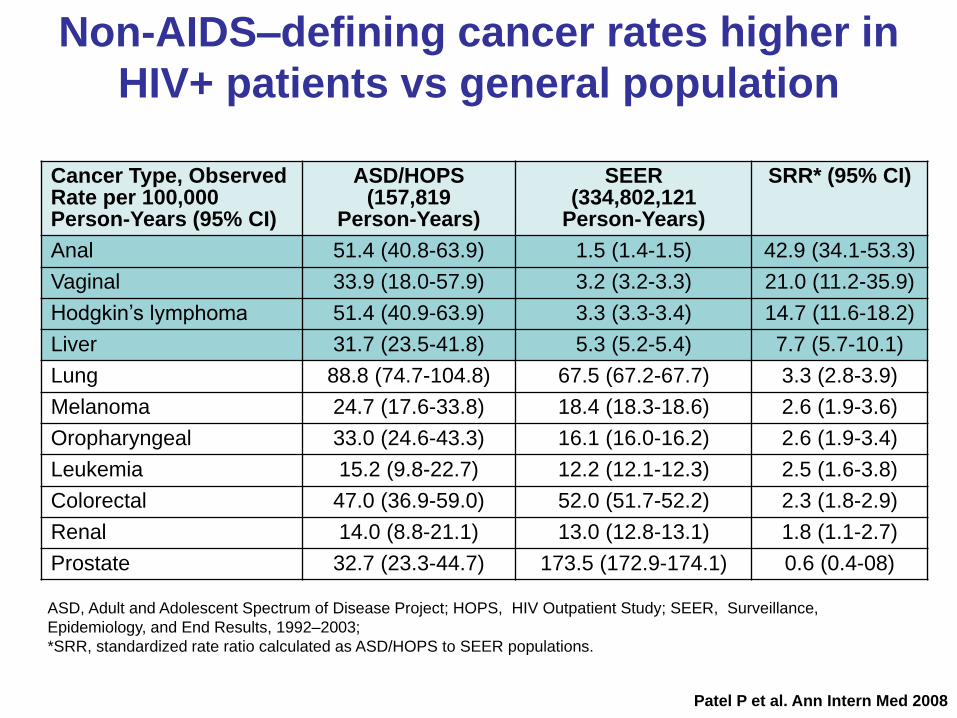
Patel P et al. Ann Intern Med 2008
Cancer Type, Observed Rate per 100,000 Person-Years (95% CI)
ASD/HOPS(157,819
Person-Years)
SEER(334,802,121
Person-Years)
SRR* (95% CI)
Anal 51.4 (40.8-63.9) 1.5 (1.4-1.5) 42.9 (34.1-53.3)
Vaginal 33.9 (18.0-57.9) 3.2 (3.2-3.3) 21.0 (11.2-35.9)
Hodgkin’s lymphoma 51.4 (40.9-63.9) 3.3 (3.3-3.4) 14.7 (11.6-18.2)
Liver 31.7 (23.5-41.8) 5.3 (5.2-5.4) 7.7 (5.7-10.1)
Lung 88.8 (74.7-104.8) 67.5 (67.2-67.7) 3.3 (2.8-3.9)
Melanoma 24.7 (17.6-33.8) 18.4 (18.3-18.6) 2.6 (1.9-3.6)
Oropharyngeal 33.0 (24.6-43.3) 16.1 (16.0-16.2) 2.6 (1.9-3.4)
Leukemia 15.2 (9.8-22.7) 12.2 (12.1-12.3) 2.5 (1.6-3.8)
Colorectal 47.0 (36.9-59.0) 52.0 (51.7-52.2) 2.3 (1.8-2.9)
Renal 14.0 (8.8-21.1) 13.0 (12.8-13.1) 1.8 (1.1-2.7)
Prostate 32.7 (23.3-44.7) 173.5 (172.9-174.1) 0.6 (0.4-08)
ASD, Adult and Adolescent Spectrum of Disease Project; HOPS, HIV Outpatient Study; SEER, Surveillance,
Epidemiology, and End Results, 1992–2003;
*SRR, standardized rate ratio calculated as ASD/HOPS to SEER populations.
Non-AIDS–defining cancer rates higher in
HIV+ patients vs general population

Comorbidities increase with age, but more
common in HIV patients
Guaraldi G et al. Clin Infect Dis 2011
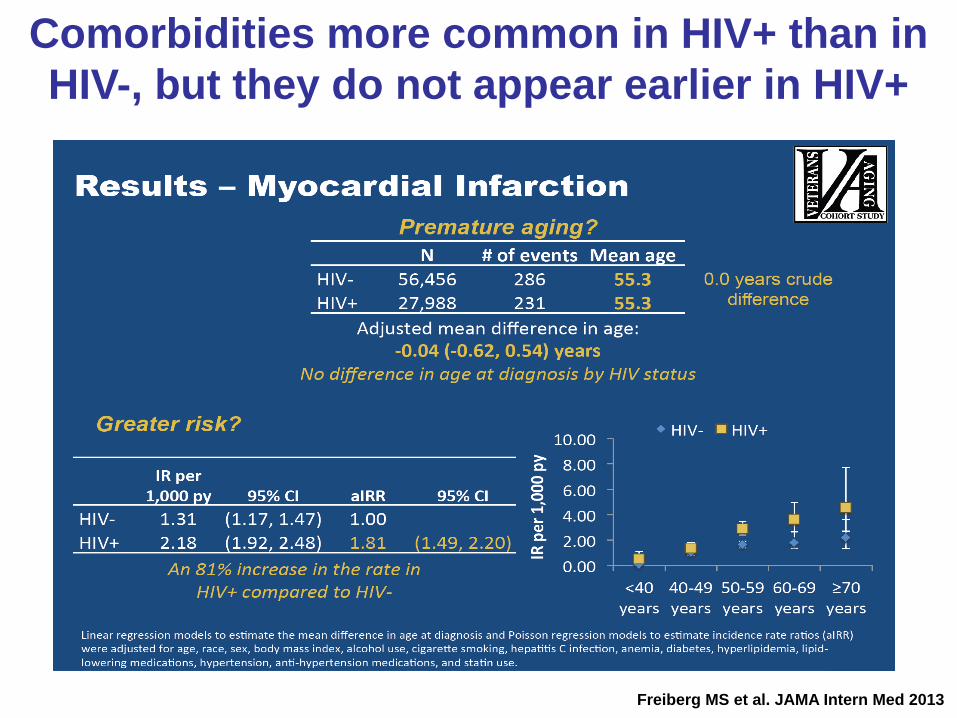
Comorbidities more common in HIV+ than in
HIV-, but they do not appear earlier in HIV+
Freiberg MS et al. JAMA Intern Med 2013

Agenda
• Co-morbidities: HIV+ vs HIV-
• Mortality in HIV+ patients
• Effects of ageing on HIV
• Effects of HIV on ageing

* Adjusted for: age, gender, ethnicity, mode of HIV acquisition (fixed) and HBV, HCV,
smoking, diabetes, hypertension, HIV RNA, BMI, CD4 count (time-updated)
1999/
2000
2001/
2002
2005/
2006
2007/
2008
2009/
2011
Calendar year
Unadjusted
5
3
2
4
1
0.1
0.5 Adjusted*
All-cause (both AIDS and non-AIDS) mortality
has decreased with cART
CJ Smith et al for the D:A:D Study Group. 19th IAC; Washington, DC; July 22-27, 2012; Abstract THAB0304
D:A:D Study
3,802 deaths in 49,734 HIV+ adults
followed for 304,695 PY:
12.5 per 1,000 person-years
2003/
2004

Crude mortality rate, 2010Per 1,000 population aged
15-59
General Population (all
cause)1.6
HIV-infected population
(Non-AIDS cause of death)3.6
• 3,814 deaths in 70,914 HIV+ adults followed for 319,082 PY
• 50.2% died of non-AIDS related causes
Kall M et al for the Health Protection Agency. 19th IAC; Washington, DC; July 22-27, 2012; Abstract MOAC0301
Mortality rates due to non-AIDS causes of
death are higher for HIV+ persons
Health Protection Agency (England and Wales)Retrospective analysis 1997-2010

Death in HIV-infected patients on cART is due
to prevalent diseases of aging
Rodger A et al. CROI 2012. Poster 638
Perc
en
tag
e o
f d
eath
s
*Non-AIDS malignancy.
**Accident, suicide or violent death.
SMART / ESPRIT: causes of death in N=3,280 HIV-infected persons
receiving suppressive cART with CD+ counts ≥ 350 cells/mm3

Obel N et al. PLoS ONE 2011
Survival trends in HIV+ patients after
widespread use of cART

Agenda
• Co-morbidities: HIV+ vs HIV-
• Mortality in HIV+ patients
• Effects of ageing on HIV
• Effects of HIV on ageing

Aging shares immunological and clinical
manifestations with HIV infection
Courtesy Suzanne Crowe

Courtesy Peter Reiss
Netherlands ATHENA Cohort 1986-2010
0%
10%
20%
30%
40%
50%
60%
70%
80%
90%
100%
% o
f p
ati
en
ts 60 =>
50-60
40-50
30-40
30 <
Increasing proportion of older HIV+ persons

4,5
4,6
4,7
4,8
4,9
5
5,1
5,2
5,3
Baseline HIV RNA
HIV
RN
A (
log
10
co
pie
s/m
L)
13-17
4.8
18-29 30-39 40-49 50-54 55-59 >60
4.8
5.0 5.0 5.0
5.1
4.9
COHERE Study Group. AIDS 2008
Age at Baseline (years)
160
170
180
190
200
210
220
230
240
250
260
CD
4 (
cell
s/m
m3)
13-17
222
18-29 30-39 40-49 50-54 55-59 >60
256
188
178 178173
210
Age at Baseline (years)
Baseline CD4 Count
COHERE Study: Baseline Virologic and Immunologic Profile by Age
Older diagnosed patients usually have a more
advanced HIV infection stage

50
60
70
80
90
100
Achieving CD4 Count
>200 Cells/mm3 at 12 Months
Pa
tien
ts (
%)
13-17
85.6%
18-29 30-39 40-49 50-54 55-59 >60
86.7%
76.3% 75.2%73.9% 74.7%
80.5%
Age at Baseline (years)
0
2
4
6
8
10
12
Pa
tien
ts (
%)
13-17 18-29 30-39 40-49 50-54 55-59 >60
Age at Baseline (years)
New AIDS Event
At 12 Months
P<0.0001 for trend
4.8%5.2%
8.5%
9.6%9.3%
7.0%
9.7%
P<0.0001 for trend
COHERE Study Group. AIDS 2008
COHERE Study: Response by Baseline Age
Older diagnosed patients have less immune
recovery with effective ART

Unadjusted (blue) and adjusted (purple) relative hazards for confirmed virological and immunological responses after 1 year of
ART in the different age groups.
Estimates are adjusted for year of starting cART, pre-cART CD4 and VL, AIDS, gender, origin and initial cART regimen,
COHERE 2006 Sabin C et al. AIDS 2009
This happens despite older patients show
better virological responses
Age group (years)
Virological response

0
20
40
60
80
100
Overall 95% Adherence
<50 >50
Hinkin CH et al. AIDS 2004
Older patients have better adherence to ART

Agenda
• Co-morbidities: HIV+ vs HIV-
• Mortality in HIV+ patients
• Effects of ageing on HIV
• Effects of HIV on ageing

Rodriguez-Martinez M. Rev Esp Com Sal 2010
Masia M et al. Enfer Infecc Microbiol Clin 2012
www.heartfoundation.org.au/hiv
Lifson AR et al. Curr HIV Rep 2012
Oh JY et al. The Open AIDS Journal 2012
Pre
vale
nce (
%)
Smoking is twice more common in HIV+
patients than in the general population

Smoking and aging interaction: More damage
in older HIV+ than in older HIV-
Fitch KV et al. AIDS 2012

AIDS defining
Non-AIDS defining
Incid
en
ce p
er
1000 P
YF
U (
95%
CI)
<50 51-100 101-200 201-350 351-500 501-700 >700
Current CD4 count (/mm3)
Mocroft A et al. J Acquir Immune Defic Syndr 2010
Low CD4 cells are associated with AIDS and
non-AIDS conditions
EuroSIDA Study

Guaraldi G et al. PLoS ONE 2015
HIV Aging (HIV+ for ≥20.6 years)
HIV Aged (HIV+ for <11.3 years)
HIV negative
Adjusted for age, gender, race, and geographic area
CV disease Hypertension Diabetes CK disease Multimorbidity
(concurrent presence
of >2 non-infectious
comorbidities)
The longer exposure to HIV&ART the higher
rate and number of comorbidities

Endotelin-1
Monocyte
Tat
Eugenin EA et al. Am J Pathol 2008; Liu K et al. Am J Physiol Lung Cell Mol Physiol 2005;
Park IW et al. Blood 2001; Kanmogne GD et al. Biochem Biophys Res Commun 2005
Rasheed S et al. PLoS ONE 2008; Parra S et al. Atherosclerosis 2007
CD4+ T
MCP-1, VCAM-1, ICAM-1
HIV infects arterial wall and promotes
atherosclerosis
AR
TE
RIA
L W
AL
L
AR
TE
RIA
L W
AL
L
Foam cell
Nef
LDL-ox
HDL
29

Courtesy Scott Letendre
HIV infects microglia and promotes neuronal
injury

HIV induces resting CD4 cells death and
persistent inflammation in lymph nodes
Doitsh G et al. Nature 2014

HIV-
HIV+
Chronic endotoxemia in elderly and
HIV+, not reversed by cART
Colon lamina propria, acute/early HIV
Red=CD4+ T cells
Damaged gut lymphoid tissue in HIV+ patients
promotes microbial translocation
Mehandru S et al. J Exp Med 2004; Hearps A et al. AIDS 2012

Mehandru S et al. PLoS Med 2006
AEI,
untreated
(N=32)
0
20
Perc
en
tag
e o
f acti
vate
d
CD
4+
T c
ells
40
60
80
AEI, treated
up to 1 year
(N=7)
AEI, treated
1–3 years
(N=7)
AEI, treated
3–7 years
(N=8)
HIV
uninfected
(N=18)
Peripheral blood Mucosa
AEI = acute/early HIV infected
ART restores gut lymphoid tissue but cannot
normalise it

* P<0.001 vs HIV uninfected
** P<0.001 vs HIV infected, untreatedKristoffersen US et al. HIV Med 2009
N=115 HIV-infected patients
N=30 HIV-uninfected matched controls40,000
35,000
30,000
25,000
20,000
15,000
10,000
5,000
0Pla
sm
a c
on
cen
tra
tio
n o
f h
sC
RP
(n
g/m
L)
HIV uninfected HIV infected,
untreated
HIV infected,
3 months of
ART
HIV infected,
12 months of
ART
**
*
Markers of inflammation may persist at
elevated levels despite ART

Hunt PW et al. J Infect Dis 2003
0
10
20
30
HIV infected
untreated
(N=13)
HIV infected
treated
(N=99)
HIV
uninfected
(N=6)
Pe
rce
nta
ge
of
acti
vate
d
CD
4+
T c
ells
P<0.001
P<0.001
0
10
20
30
HIV infected
untreated
(N=13)
HIV infected
treated
(N=99)
HIV
uninfected
(N=6)
Pe
rce
nta
ge
of
acti
vate
d
CD
8+
T c
ells
P<0.001
P<0.001
CD4+ CD8+
ART decreases immune activation but levels
remain still high

Cardiovascular biomarkers: median (95% CI) difference of percent change
from baseline to W48, RAL (N = 119) minus PI/r (N = 114)
Markers of inflammation Endothelial dysfunction Insulin
resistance
Hyper-
coagulability
MC
P-1
hsC
RP
OP
G
IL-6
IL-1
0
TN
F-a
ICA
M-1
VC
AM
-1
E-s
ele
cti
n
P-s
ele
cti
n
Ad
ipo
nec
tin
Insu
lin
D-d
imer
-70
-60
-50
-40
-30
-20
-10
0
10
20%
Martinez E et al. AIDS 2012
Switching from PI/r to raltegravir leads to
lower plasma markers of inflammation
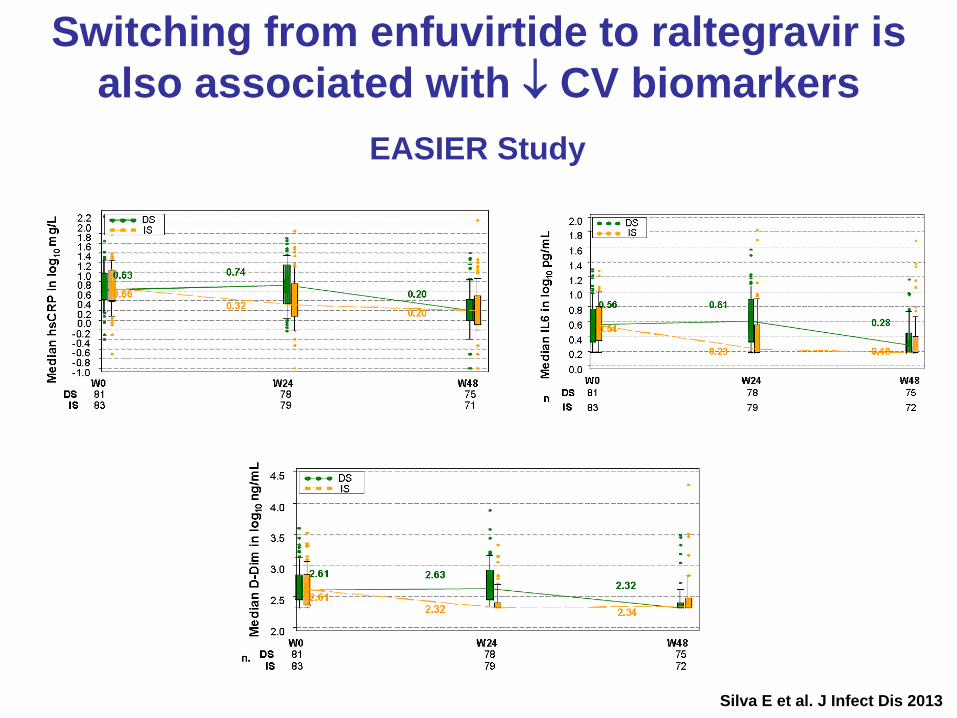
Silva E et al. J Infect Dis 2013
EASIER Study
Switching from enfuvirtide to raltegravir is
also associated with CV biomarkers

Statins decrease inflammation and immune
activation in HIV+ patients on cART
Funderburg NT et al. J Acquir Immune Defic 2015

Summary
• The HIV infected population is ageing.
• Ageing affects the natural history of HIV, and HIV
may affect the natural ageing process.
• Co-morbidities are increasingly apparent and their
therapies may lead to DDIs with ART.
• Specific ART adverse effects may negatively affect
co-morbidities
• Prevention and management of co-morbidities must
be an important part of routine clinical care for HIV
adults.