introduction to climate change - weebly
TRANSCRIPT
© 2014 The NEED Project P.O. Box 10101, Manassas, VA 20108 1.800.875.5029 www.NEED.org 23
Introduction to Climate Change
A Changing ClimateSince its formation, the climate of the Earth has been in a constant
state of change. Many factors have altered the climate, including
the Earth’s orbit and changing proximity to the sun, as well as the
amount of heat-trapping gases in the atmosphere.
Human societies have evolved during an extended period of
favorable climatic conditions. In fact, some researchers believe that
a period of favorable climate was the primary factor that allowed
the rise of civilization.
Over the past several decades, scientists have compiled an
increasing amount of data indicating that, for the "rst time in
Earth’s history, the activities of one species—homo sapiens—are
altering the climate. Research shows a signi"cant increase in the
concentration of heat-trapping gases, especially carbon dioxide
(CO2), in the Earth’s atmosphere since the beginning of the
Industrial Revolution. A rise in global temperatures corresponds to
the rise in carbon dioxide.
There are many complex forces, both natural and man-made, at
work governing our climate. Should we be concerned if human
activities are changing the climate? How might a changing climate
a!ect us?
Weather and ClimateClimate and weather are not the same thing; the di!erence is
simply a matter of time. Weather describes the conditions in the
atmosphere over a short period of time, and is usually described
in terms of its e!ects on human activities. Weather forecasts are
focused on temperature, humidity, precipitation, atmospheric
pressure, and wind conditions that occur over a time span of days.
Scientists usually look at averages over at least 30-year time spans to
determine long term trends and describe climate. Russian Wladimir
Köppen developed the most famous climate classi"cation chart
in 1884. Using annual and monthly temperatures, precipitation
patterns, and native vegetation, Köppen categorized the Earth into
"ve di!erent climate groups. He re"ned it over his lifetime with the
help of German scientist Rudolf Geiger. Their work is often called
the Köppen-Geiger Classi"cation System.
Climatologists have analyzed multiple sources to put together
a history of Earth’s climate. By looking at ice cores, boreholes,
tree rings, glacier lengths, pollen remains, ocean sediments, and
by studying Earth’s orbit, they have determined that the climate
naturally changes over time. There are multiple variables that
a!ect Earth’s natural climate patterns.
Earth’s Re#ectivityThe re&ectivity of the Earth’s surface plays an important part in
climate patterns. We all know that if you want to stay cooler on
a hot, sunny day, you should wear light colors—especially white.
We are kept cooler because more of the radiant energy from the
sun that strikes us re&ects o! instead of being transformed into
thermal energy. Earth works the same way. Some of the sun’s
radiant energy striking Earth is re&ected back into space. The
amount of re&ection that takes place o! any given point of the
Earth’s surface varies widely. A dark surface like a parking lot or a
body of water will re&ect less than 10 percent of the light, while
snow and ice can re&ect 90 percent. Earth's atmosphere re&ects 26
percent of the incoming radiation.The ability of a surface to re&ect
light is called its albedo.
During the ice ages when the initial decrease in solar radiation
allowed more snow to accumulate, this high albedo surface
re&ected more solar radiation, thus keeping the ground and the
air cooler. Scientists call this a ‘positive feedback loop’. As this loop
continued, it allowed snow and ice to accumulate for thousands
of years until the Milankovitch Cycles increased solar radiation
enough to promote warming of the climate.
A. Tropical Moist Climates: all months have average
temperatures above 18° Celsius or 64.6° Fahrenheit.
B. Dry Climates: with de"cient precipitation during most of
the year.
C. Moist Mid-Latitude Climates with Mild Winters
D. Moist Mid-Latitude Climates with Cold Winters
E. Polar Climates: with extremely cold winters and summers.
Climate Groups
RADIANT ENERGY
SUNAtmosphere
HEAT
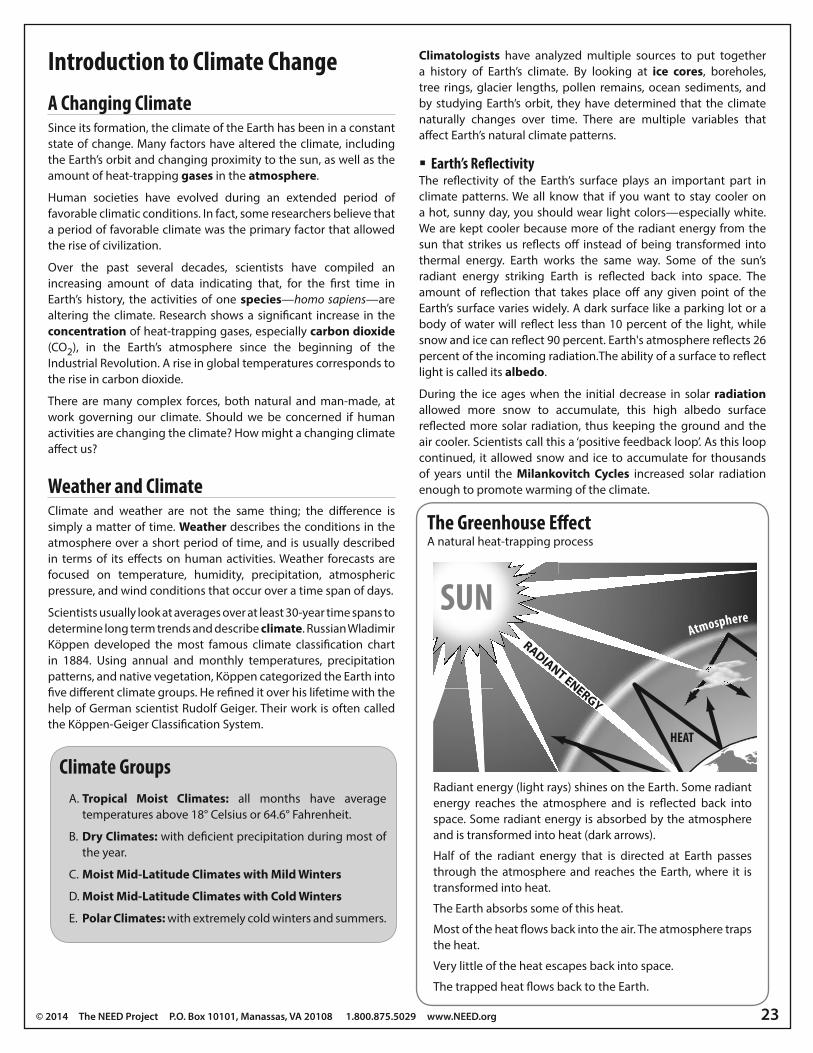
The Greenhouse E"ect
Radiant energy (light rays) shines on the Earth. Some radiant
energy reaches the atmosphere and is re&ected back into
space. Some radiant energy is absorbed by the atmosphere
and is transformed into heat (dark arrows).
Half of the radiant energy that is directed at Earth passes
through the atmosphere and reaches the Earth, where it is
transformed into heat.
The Earth absorbs some of this heat.
Most of the heat &ows back into the air. The atmosphere traps
the heat.
Very little of the heat escapes back into space.
The trapped heat &ows back to the Earth.
The Greenhouse E!ectA natural heat-trapping process
24 Exploring Climate Change
Now, the reverse is occurring. As the climate has warmed, there
has been a decrease in snow and ice coverage. Those surfaces that
previously had a high albedo are revealing low albedo surfaces,
such as soil and water, as they melt. This feedback loop is predicted
to increase the rate at which the Earth warms.
Earth’s OrbitSerbian mathematician Mulitin Milanković (1879-1958) was the "rst
to mathematically explain how the Earth’s orientation to and orbit
around the sun change regularly.
Milanković’s calculations explained three Earth movements—
Earth’s orbit (eccentricity), angle of tilt (obliquity), and wobble
on its axis (precession). These changes occur in cycles, called
Milankovitch Cycles, which last thousands of years. These cycles
a!ect the distribution of sunlight over the Earth’s surface and the
intensity of the seasons, and very slightly a!ect the total amount of
radiation received. Milanković theorized that it is these cycles that
are the driving force of ice ages.
The Earth is currently in an interglacial period. According to
Milanković’s theory, and if human factors are not taken into account,
this period of relative warmth is predicted to last at least another
50,000 years. Then, as the Milankovitch Cycles change, conditions
favorable for another ice age would be created.
Sun’s IntensityIt is also believed that variations within the sun can a!ect the
intensity of the sunlight reaching Earth’s surface. Low solar activity
will cause cooling, while stronger solar activity can cause warming.
Between the years 1350 and 1900, the Northern Hemisphere
experienced cooler temperatures, approximately 1-2°C lower than
present temperatures, which caused a time known as “The Little Ice
Age.” NASA research attributes the cooler temperatures in part to
reduced solar intensity.
Volcanic EruptionsShort term climate changes can occur with large, or multiple,
volcanic eruptions. When a volcano erupts, aerosols and carbon
dioxide are added to the air. Aerosols contribute to short term
cooling because they block the sun’s radiant energy. Aerosols do
not stay in the atmosphere long, which is why their impact is only
short term. Indonesia is a volcanic island nation. It is believed that
some of its larger eruptions, Mount Toba 71,000 years ago, Tambora
in 1815, and Krakatau in 1883, all contributed to world-wide cooling
in the years immediately following the eruptions. Other volcanism
along the Paci"c Ring of Fire and Greenland may have also led to
temporary cooler temperatures within longer climate cycles.
When volcanoes erupt, additional CO2 is sent into the atmosphere.
One theory is that numerous volcanic eruptions raised CO2 levels
enough to raise temperatures periodically over the last 400 million
years. However, research into the relationship of volcanic CO2 to
climate change has not shown a strong connection between the two.
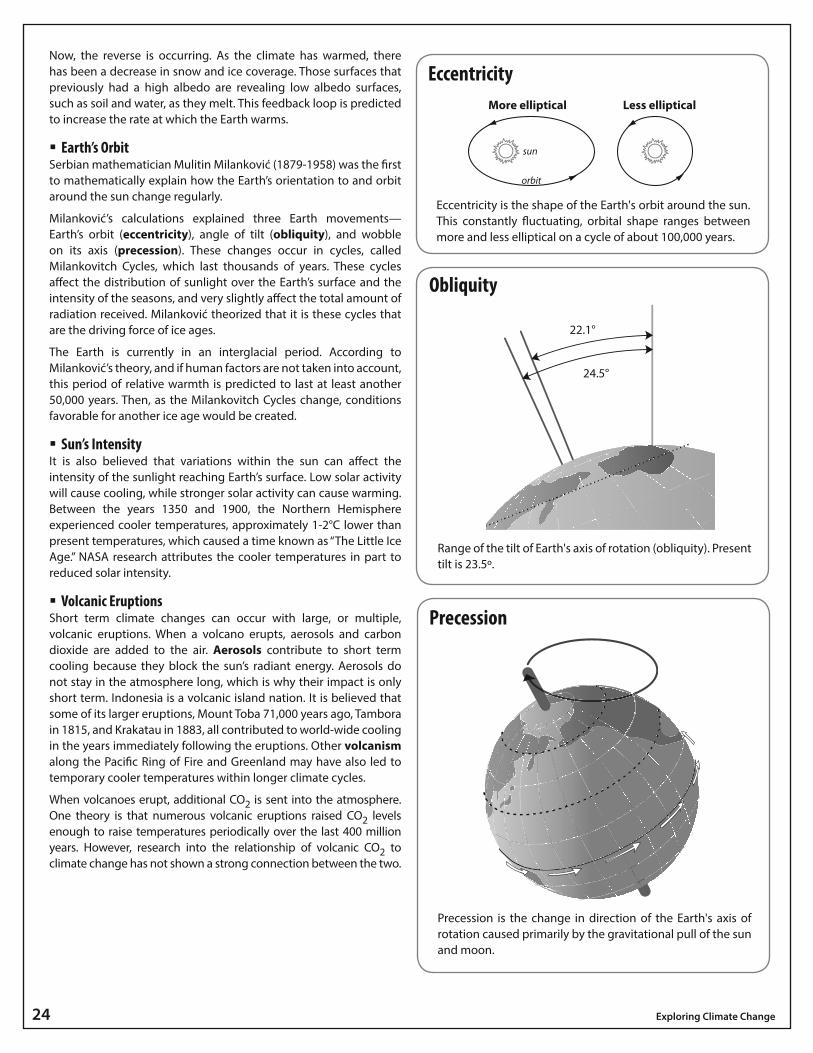
More elliptical Less elliptical
sun
orbit
Eccentricity
Eccentricity is the shape of the Earth's orbit around the sun.
This constantly &uctuating, orbital shape ranges between
more and less elliptical on a cycle of about 100,000 years.
Obliquity
Obliquity
Range of the tilt of Earth's axis of rotation (obliquity). Present
tilt is 23.5º.
PrecessionPrecession
Precession is the change in direction of the Earth's axis of
rotation caused primarily by the gravitational pull of the sun
and moon.
© 2014 The NEED Project P.O. Box 10101, Manassas, VA 20108 1.800.875.5029 www.NEED.org 25
Natural Climate Change and Climate Change From Human ActivityIt is estimated that ten thousand years ago there were "ve million
humans on Earth. One thousand years ago the population had
reached 254-245 million, and by 1900 the world’s population had
reached 1.6 billion. Today, there are more than seven billion people
on Earth. Natural climate cycles provided warmer climates and
allowed the human population to grow rapidly.
As some climatologists continued to analyze and record
temperatures they found a rising temperature trend, one that was
moving faster than they would have anticipated based on normal
Earth cycles. Most scientists believe that the way humans are
interacting with the Earth in their everyday lives is causing a faster
than natural climate change.
Earth’s SystemsThe Earth can be divided into four systems—the lithosphere, the
hydrosphere, the biosphere, and the atmosphere. Each of these
systems has a speci"c role in keeping the Earth going and in the
storage of carbon. They each play a part in a!ecting the weather, and
in turn, the climate. These systems, and cycles within the systems,
replenish the Earth with water, supply energy, and create a climate
that is able to sustain plant, animal, and human life. Each system has
many inputs and outputs, which can a!ect the overall Earth system.
Some of these systems are a!ected by inputs and outputs that have
been naturally transpiring for thousands of years. Some of these
systems are a!ected by inputs speci"cally from human activity.
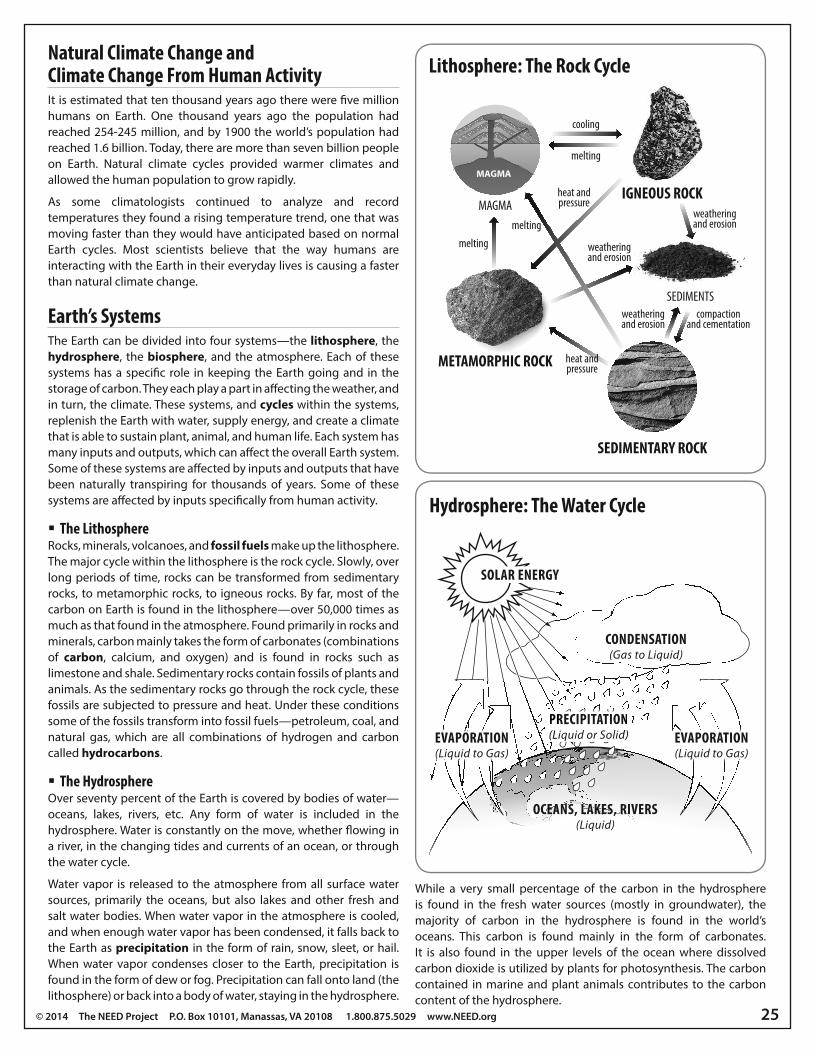
The Lithosphere Rocks, minerals, volcanoes, and fossil fuels make up the lithosphere.
The major cycle within the lithosphere is the rock cycle. Slowly, over
long periods of time, rocks can be transformed from sedimentary
rocks, to metamorphic rocks, to igneous rocks. By far, most of the
carbon on Earth is found in the lithosphere—over 50,000 times as
much as that found in the atmosphere. Found primarily in rocks and
minerals, carbon mainly takes the form of carbonates (combinations
of carbon, calcium, and oxygen) and is found in rocks such as
limestone and shale. Sedimentary rocks contain fossils of plants and
animals. As the sedimentary rocks go through the rock cycle, these
fossils are subjected to pressure and heat. Under these conditions
some of the fossils transform into fossil fuels—petroleum, coal, and
natural gas, which are all combinations of hydrogen and carbon
called hydrocarbons.
The HydrosphereOver seventy percent of the Earth is covered by bodies of water—
oceans, lakes, rivers, etc. Any form of water is included in the
hydrosphere. Water is constantly on the move, whether &owing in
a river, in the changing tides and currents of an ocean, or through
the water cycle.
Water vapor is released to the atmosphere from all surface water
sources, primarily the oceans, but also lakes and other fresh and
salt water bodies. When water vapor in the atmosphere is cooled,
and when enough water vapor has been condensed, it falls back to
the Earth as precipitation in the form of rain, snow, sleet, or hail.
When water vapor condenses closer to the Earth, precipitation is
found in the form of dew or fog. Precipitation can fall onto land (the
lithosphere) or back into a body of water, staying in the hydrosphere.
While a very small percentage of the carbon in the hydrosphere
is found in the fresh water sources (mostly in groundwater), the
majority of carbon in the hydrosphere is found in the world’s
oceans. This carbon is found mainly in the form of carbonates.
It is also found in the upper levels of the ocean where dissolved
carbon dioxide is utilized by plants for photosynthesis. The carbon
contained in marine and plant animals contributes to the carbon
content of the hydrosphere.
IGNEOUS ROCK
SEDIMENTARY ROCK
METAMORPHIC ROCK
SEDIMENTS
MAGMA
melting
melting
melting
cooling
heat andpressure
heat andpressure
weatheringand erosion
weatheringand erosion
weatheringand erosion
compactionand cementation
The Rock Cycle
MAGMA
Lithosphere: The Rock Cycle
SOLAR ENERGY
CONDENSATION(Gas to Liquid)
PRECIPITATION(Liquid or Solid)
PR(LiqEVAPORATION
(Liquid to Gas)
Nid) EVAPORATION
(Liquid to Gas)
OCEANS, LAKES, RIVERS(Liquid)
Hydrosphere: The Water Cycle
26 Exploring Climate Change
The BiospherePlants, animals, fungi, and microorganisms are examples of parts
of the biosphere. Included in this system are things that are living,
were alive a short time ago, or are derived from living organisms.
Cycles within the biosphere include the life cycle for both plants
and animals. The food chain is also an important event taking place
within the biosphere. Cycles from outside the biosphere are crucial
to the continuation of the biosphere cycles. These cycles include the
water cycle, nitrogen cycle, carbon cycle, and the &ow of energy
throughout them. The biosphere contains vast amounts of carbon.
It is found in the form of carbohydrates and proteins primarily in
both living and decaying organisms.
The AtmosphereInteracting with all of the other systems is the atmosphere. The
atmosphere acts like the glass of a greenhouse building; it surrounds
the Earth and keeps it warm, sustaining an environment that
promotes life. Composed of layers of gases surrounding the Earth,
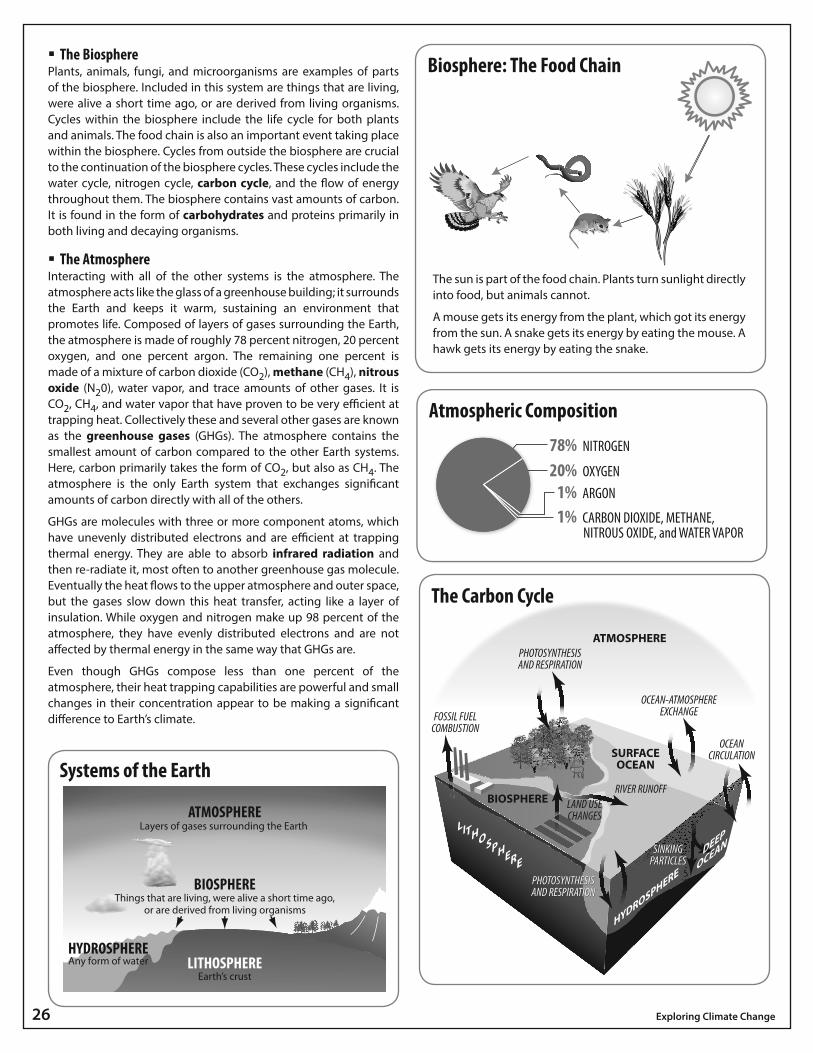
the atmosphere is made of roughly 78 percent nitrogen, 20 percent
oxygen, and one percent argon. The remaining one percent is
made of a mixture of carbon dioxide (CO2), methane (CH4), nitrous
oxide (N20), water vapor, and trace amounts of other gases. It is
CO2, CH4, and water vapor that have proven to be very e%cient at
trapping heat. Collectively these and several other gases are known
as the greenhouse gases (GHGs). The atmosphere contains the
smallest amount of carbon compared to the other Earth systems.
Here, carbon primarily takes the form of CO2, but also as CH4. The
atmosphere is the only Earth system that exchanges signi"cant
amounts of carbon directly with all of the others.
GHGs are molecules with three or more component atoms, which
have unevenly distributed electrons and are e%cient at trapping
thermal energy. They are able to absorb infrared radiation and
then re-radiate it, most often to another greenhouse gas molecule.
Eventually the heat &ows to the upper atmosphere and outer space,
but the gases slow down this heat transfer, acting like a layer of
insulation. While oxygen and nitrogen make up 98 percent of the
atmosphere, they have evenly distributed electrons and are not
a!ected by thermal energy in the same way that GHGs are.
Even though GHGs compose less than one percent of the
atmosphere, their heat trapping capabilities are powerful and small
changes in their concentration appear to be making a signi"cant
di!erence to Earth’s climate.
78% NITROGEN
20% OXYGEN
1% ARGON
1% CARBON DIOXIDE, METHANE, NITROUS OXIDE, and WATER VAPOR
Atmospheric Composition
HYDROSPHERE
ATMOSPHERE
BIOSPHERE
LITHOSPHEREEarth’s crust
Any form of water
Things that are living, were alive a short time ago,or are derived from living organisms
Layers of gases surrounding the Earth
Systems of the Earth
ATMOSPHERE
BIOSPHERE
SURFACEOCEAN
DEEP
OCEANDEEP
OCEAN
LITHOSPHERE
HYDROSPHERE
LAND USE
CHANGES
RIVER RUNOFF
OCEAN-ATMOSPHERE
EXCHANGEFOSSIL FUEL
COMBUSTION
PHOTOSYNTHESIS
AND RESPIRATION
PHOTOSYNTHESIS
AND RESPIRATION
PHOTOSYNTHESIS
AND RESPIRATION
SINKING
PARTICLES
SINKING
PARTICLES
OCEAN
CIRCULATION
The Carbon Cycle
The sun is part of the food chain. Plants turn sunlight directly
into food, but animals cannot.
A mouse gets its energy from the plant, which got its energy
from the sun. A snake gets its energy by eating the mouse. A
hawk gets its energy by eating the snake.
Biosphere: The Food Chain
© 2014 The NEED Project P.O. Box 10101, Manassas, VA 20108 1.800.875.5029 www.NEED.org 27
A Closer Look at Greenhouse GasesWhen energy is sent from the sun, the shorter wavelengths, such as
ultraviolet and visible light, pass through the atmosphere and strike
the surface of the Earth. The atmosphere and objects on the Earth’s
surface absorb this radiation. Much of this radiation is transformed
into thermal energy and the infrared energy is radiated back from
the surface of the Earth and some of it into space. The reason that
much of the heat is contained within our atmosphere is due to
the properties of greenhouse gases. The atmosphere is composed
mostly of nitrogen and oxygen. The bonding structure of nitrogen
gas (triple bonded) and oxygen (double bonded) does not have
a great deal of &exibility with the bending and stretching of their
bonds. The greenhouse gases, such as carbon dioxide, methane,
water vapor, and nitrous oxide, have a great deal of &exibility in the
vibrating, stretching, and bending of their bonds. Therefore, as the
molecules are exposed to infrared radiation, the bonds within these
molecules have a great deal of potential to absorb that energy.
This increases the kinetic energy of these molecules and raises
the internal heat in the molecules, which can then be transmitted
to other atmospheric gases to increase the temperature of the
atmosphere, and therefore the temperature of the surface of the
Earth.
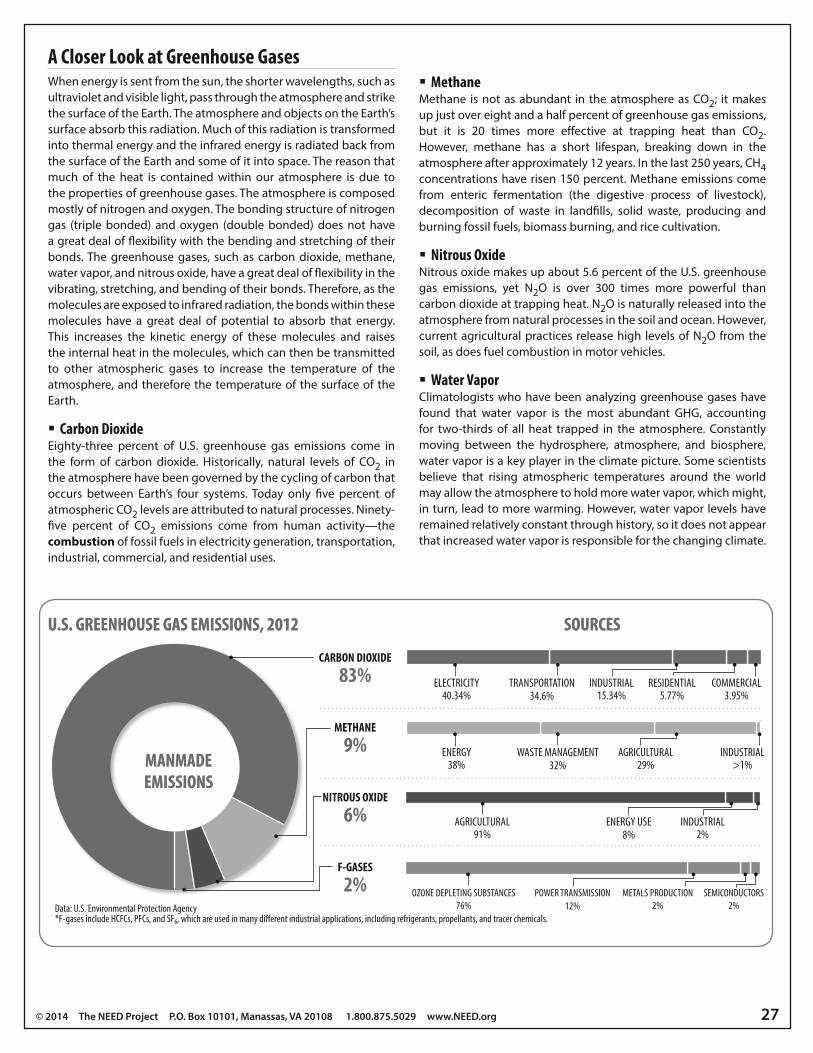
Carbon DioxideEighty-three percent of U.S. greenhouse gas emissions come in
the form of carbon dioxide. Historically, natural levels of CO2 in
the atmosphere have been governed by the cycling of carbon that
occurs between Earth’s four systems. Today only "ve percent of
atmospheric CO2 levels are attributed to natural processes. Ninety-
"ve percent of CO2 emissions come from human activity—the
combustion of fossil fuels in electricity generation, transportation,
industrial, commercial, and residential uses.
MethaneMethane is not as abundant in the atmosphere as CO2; it makes
up just over eight and a half percent of greenhouse gas emissions,
but it is 20 times more e!ective at trapping heat than CO2.
However, methane has a short lifespan, breaking down in the
atmosphere after approximately 12 years. In the last 250 years, CH4concentrations have risen 150 percent. Methane emissions come
from enteric fermentation (the digestive process of livestock),
decomposition of waste in land"lls, solid waste, producing and
burning fossil fuels, biomass burning, and rice cultivation.
Nitrous OxideNitrous oxide makes up about 5.6 percent of the U.S. greenhouse
gas emissions, yet N2O is over 300 times more powerful than
carbon dioxide at trapping heat. N2O is naturally released into the
atmosphere from natural processes in the soil and ocean. However,
current agricultural practices release high levels of N2O from the
soil, as does fuel combustion in motor vehicles.
Water VaporClimatologists who have been analyzing greenhouse gases have
found that water vapor is the most abundant GHG, accounting
for two-thirds of all heat trapped in the atmosphere. Constantly
moving between the hydrosphere, atmosphere, and biosphere,
water vapor is a key player in the climate picture. Some scientists
believe that rising atmospheric temperatures around the world
may allow the atmosphere to hold more water vapor, which might,
in turn, lead to more warming. However, water vapor levels have
remained relatively constant through history, so it does not appear
that increased water vapor is responsible for the changing climate.
MANMADE
EMISSIONS
MANMADE
EMISSIONS
U.S. GREENHOUSE GAS EMISSIONS, 2012U.S. GREENHOUSE GAS EMISSIONS, 2012 SOURCESSOURCES
CARBON DIOXIDE
83%
METHANE
9%
NITROUS OXIDE
6%
F-GASES
2%Data: U.S. Environmental Protection Agency*F-gases include HCFCs, PFCs, and SF6, which are used in many di"erent industrial applications, including refrigerants, propellants, and tracer chemicals.
5.77%RESIDENTIAL
3.95%COMMERCIAL
15.34%INDUSTRIAL
34.6%TRANSPORTATIONELECTRICITY
40.34%
>1%INDUSTRIAL
29%AGRICULTURAL
32%WASTE MANAGEMENTENERGY
38%
2%INDUSTRIAL
91%AGRICULTURAL
8%ENERGY USE
2%
SEMICONDUCTORS
76%
OZONE DEPLETING SUBSTANCES
12%
POWER TRANSMISSION
2%
METALS PRODUCTION
28 Exploring Climate Change
Fossil Fuels Past and Present359 million to 299 million years ago the world had a more
tropical and mild year-round climate than it does today. Called
the Carboniferous Period, the climate during this time enabled
the growth of expansive swamps and tropical forests "lled with
towering trees, massive ferns, large horsetails, and other leafy
vegetation.
These plants all relied on the sun’s radiant energy and the process of
photosynthesis to grow and &ourish. Through photosynthesis, the
plants use radiant energy from the sun to turn the carbon dioxide in
the air and water molecules into chemical energy, which they store
in their leaves, fruits, stalks, and roots in the form of carbohydrates.
Plants release oxygen back into the air. There were so many plants
during this period that large amounts of carbon dioxide were
removed from the atmosphere and large amounts of oxygen were
released back into the atmosphere. During the Carboniferous
Period, oxygen made up around 35 percent of the atmosphere.
Plants that grew in the swamps also died in the swamps. When the
plants died the unused carbohydrates largely remained in the plant.
Plant remains were covered by sand and clay from an ever changing
landscape. It formed a layer of peat, which kept getting pushed
farther and farther down as the land above shifted. Over millions of
years the pressure and heat from the Earth squeezed out all of the
water from the peat and it turned into coal.
Similarly, oil and natural gas are the result of small plants and
animals that lived in the sea and died hundreds of millions of years
ago, before dinosaurs lived. Remains of the plants and animals fell
to the sea &oor and over time were buried under sediment and
other rock. The heat and pressure turned the carbon into oil and
natural gas.
For millions of years the carbon dioxide found in fossil fuels was
trapped deep below the ground. Levels of carbon dioxide in the
atmosphere &uctuated with Earth’s natural processes of carbon
cycling. Humans relied on solar energy or burning biomass, usually
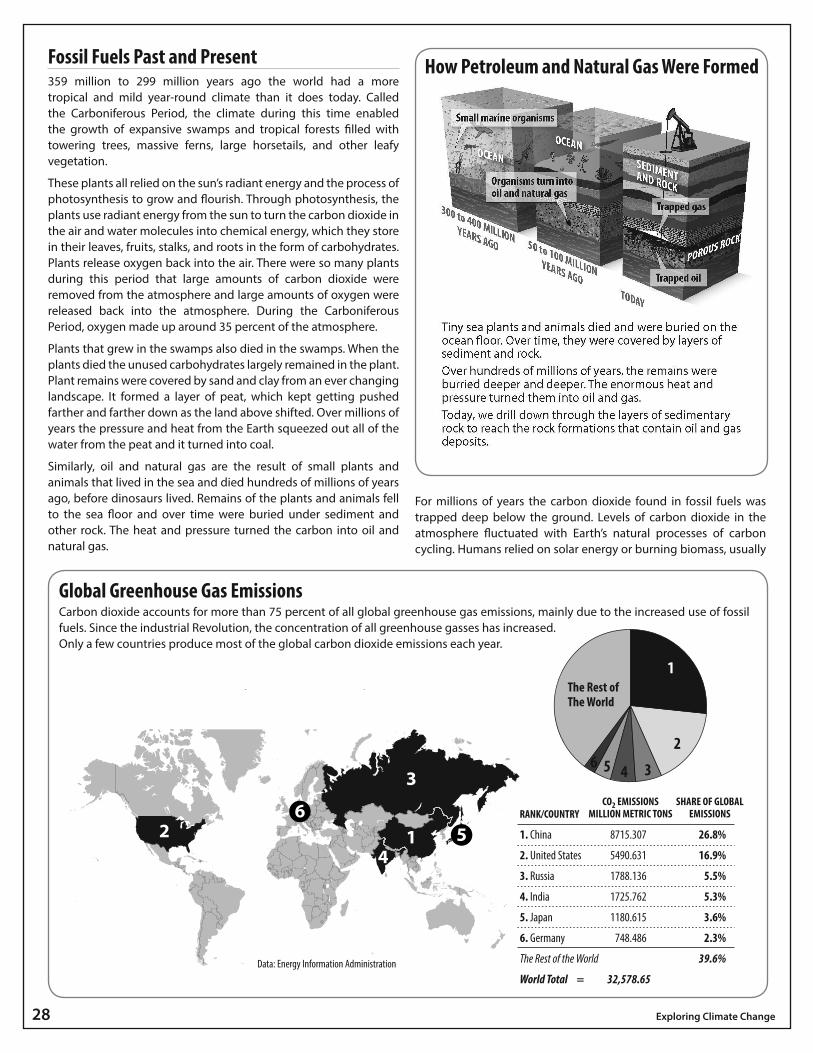
Global Greenhouse Gas Emissions
BRAZIL
CANADA
12
3
4
5
6
Only a few countries produce most of the global carbon dioxide emmissions each year. A look at the top six:
Global Carbon Dioxide Emissions, 2011
1. China 8715.307 26.8%
2. United States 5490.631 16.9%
3. Russia 1788.136 5.5%
4. India 1725.762 5.3%
5. Japan 1180.615 3.6%
6. Germany 748.486 2.3%
The Rest of the World 39.6%
World Total = 32,578.65
RANK/COUNTRYCO2 EMISSIONS
MILLION METRIC TONSSHARE OF GLOBAL
EMISSIONS
2
Data: Energy Information Administration
The Rest ofThe World
1
2
3456
Carbon dioxide accounts for more than 75 percent of all global greenhouse gas emissions, mainly due to the increased use of fossil
fuels. Since the industrial Revolution, the concentration of all greenhouse gasses has increased.
Only a few countries produce most of the global carbon dioxide emissions each year.
How Petroleum and Natural Gas Were Formed
© 2014 The NEED Project P.O. Box 10101, Manassas, VA 20108 1.800.875.5029 www.NEED.org 29
wood, for cooking, heating, and lighting. The relatively small in&ux
of carbon dioxide into the atmosphere from the burning of wood
does not seem to have had a signi"cant impact on Earth’s overall
climate.
When the Industrial Revolution began in the mid 1700s, energy
use began to change dramatically. In less than 200 years, coal,
petroleum, and natural gas became the primary sources for
industry, electricity, and transportation.
E!ects of Climate ChangeThe use of fossil fuels allows humans to see at night, to stay
comfortable in hot weather and cold, to cook food e%ciently, to
keep food for longer periods of time, and to travel quickly from place
to place. Fossil fuels allow us to work, move goods and products
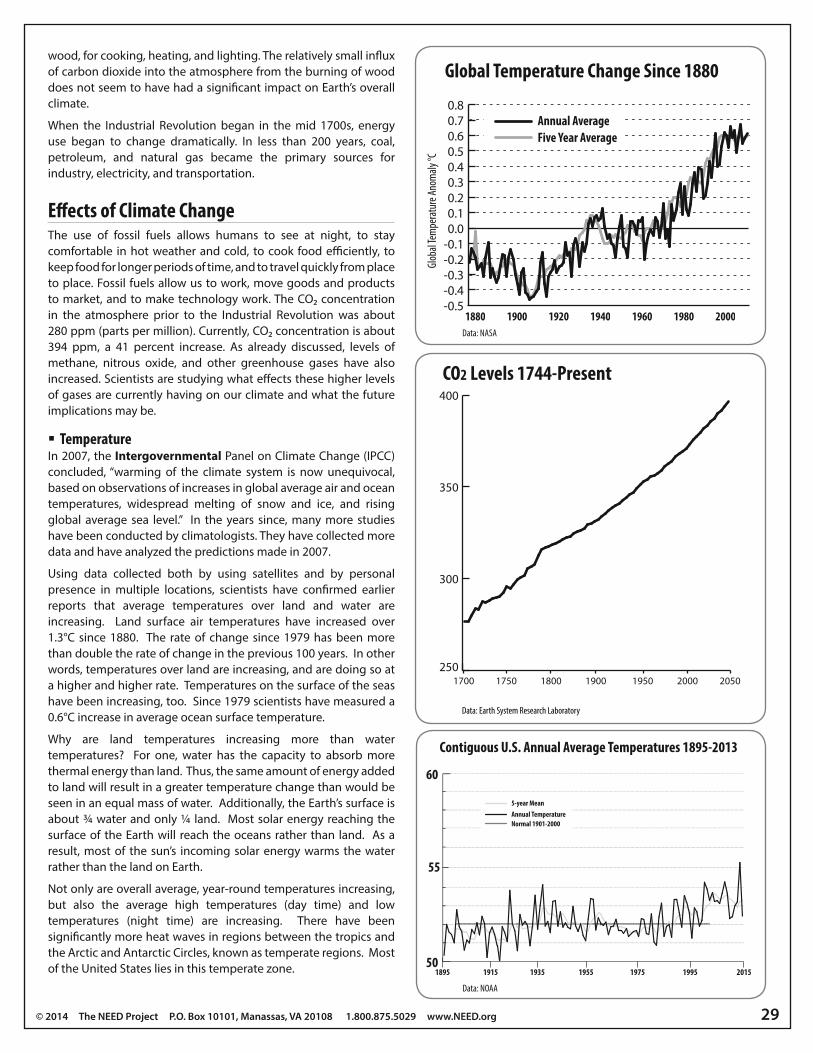
to market, and to make technology work. The CO2 concentration
in the atmosphere prior to the Industrial Revolution was about
280 ppm (parts per million). Currently, CO2 concentration is about
394 ppm, a 41 percent increase. As already discussed, levels of
methane, nitrous oxide, and other greenhouse gases have also
increased. Scientists are studying what e!ects these higher levels
of gases are currently having on our climate and what the future
implications may be.
TemperatureIn 2007, the Intergovernmental Panel on Climate Change (IPCC)
concluded, “warming of the climate system is now unequivocal,
based on observations of increases in global average air and ocean
temperatures, widespread melting of snow and ice, and rising
global average sea level.” In the years since, many more studies
have been conducted by climatologists. They have collected more
data and have analyzed the predictions made in 2007.
Using data collected both by using satellites and by personal
presence in multiple locations, scientists have con"rmed earlier
reports that average temperatures over land and water are
increasing. Land surface air temperatures have increased over
1.3°C since 1880. The rate of change since 1979 has been more
than double the rate of change in the previous 100 years. In other
words, temperatures over land are increasing, and are doing so at
a higher and higher rate. Temperatures on the surface of the seas
have been increasing, too. Since 1979 scientists have measured a
0.6°C increase in average ocean surface temperature.
Why are land temperatures increasing more than water
temperatures? For one, water has the capacity to absorb more
thermal energy than land. Thus, the same amount of energy added
to land will result in a greater temperature change than would be
seen in an equal mass of water. Additionally, the Earth’s surface is
about ¾ water and only ¼ land. Most solar energy reaching the
surface of the Earth will reach the oceans rather than land. As a
result, most of the sun’s incoming solar energy warms the water
rather than the land on Earth.
Not only are overall average, year-round temperatures increasing,
but also the average high temperatures (day time) and low
temperatures (night time) are increasing. There have been
signi"cantly more heat waves in regions between the tropics and
the Arctic and Antarctic Circles, known as temperate regions. Most
of the United States lies in this temperate zone.
-0.5-0.4-0.3-0.2-0.10.00.10.20.30.40.50.60.70.8
1880 1900 1920 1940 1960 1980 2000
Glob
al Te
mpe
ratu
re A
nom
aly
°C
Annual Average
Five Year Average
Global Temperature Change Since 1880
Data: Earth System Research Laboratory
CO2 Levels 1744-Present
250
300
350
400
1700 1750 1800 1900 1950 2000 2050
Contiguous U.S. Annual Average Temperatures 1895-2013
50
60
55
Normal 1901-2000
Annual Temperature
5-year Mean
1895 1915 1935 1955 201519951975
Data: NOAA

30 Exploring Climate Change
In the United States, the National Oceanic and Atmospheric
Administration (NOAA) National Climatic Data Center statistics show
that the average contiguous U.S. temperature is trending above
normal, increasing 0.13°F each ten years since 1895, and 0.48°F per
decade since 1979. All of the climate regions have been increasing in
temperature since 1895 except for the Southeast, but since 1979 this
region has shown temperature increases, too.
Increasing temperatures worldwide are making signi"cant impacts
in all areas, but are most marked in the cryosphere, or portion of
the Earth that is frozen most or all of the time. In these regions, sea
ice, glacier volume, land ice sheet size, and permafrost area have all
decreased dramatically since the Industrial Revolution. According
to the IPCC’s Fifth Assessment Report, released in 2013, sea ice has
decreased 3.5-4.1% each decade between 1979 and 2012. Multi-year
ice, or ice that has been in continuous existence for more than one
freezing season, has decreased by 13.5% per decade.
Glaciers are shrinking worldwide at a rate that has been raising sea
levels 0.83 mm/year since 2005, and this loss is likely irreversible.
When it was established in 1910, Glacier National Park in Montana
had nearly 150 glaciers. In 2010, the number of glaciers remaining
larger than 25 acres had been reduced to 25. Scientists believe
that by 2020 all of the glaciers in this park may be gone. In May,
2014, scientists from University of California-Irvine and NASA’s Jet
Propulsion Laboratory concluded that six glaciers in Antarctica were
degrading more rapidly than previously expected, and that the
loss of the glaciers is inevitable. Ice sheets in Greenland have been
decreasing in mass, too. Between 1992 and 2001, 34 gigatons (one
billion tons, Gt) of ice were lost each year. However, between 2002
and 2011, 215 Gt were lost each year. More than 2/3 of the Earth’s
fresh water is found in glaciers and ice sheets.
Permafrost in northern Russia, the southern limit of continuous
permafrost, has migrated northward by 50 km. As permafrost
thaws, it releases additional carbon dioxide and methane that would
otherwise have remained trapped in the frozen ground. However,
it is di%cult to identify exactly the amount of these two gases that
have been released into the atmosphere as a result of permafrost
thawing. Structures and roadways that were built on land that
was previously permafrost and now undergo seasonal thawing can
become unstable as the ground beneath them melts.
Sea Level ChangesIn the last century, data shows that the sea level has risen worldwide
approximately 12-22 centimeters. The rate and amount the sea
level has changed varies greatly depending on the region. In some
regions levels are quickly rising, while in others sea levels are actually
falling. Previously, monitoring devices were lacking outside of the
U.S., Europe, and Japan, making it di%cult to gather data about long-
term trends in regional sea level rise. However, a number of methods
using satellite data and mathematical modeling have concluded that
sea levels rose between 1900 and 2010 at a rate of 1.7 mm/year, and
between 1993 and 2010 at a rate of 3.2 mm/year. While scientists do
not know all of the reasons behind the increased levels, they have
a high con"dence that they are indeed rising, and are con"dent in
some of the primary factors.
First, the oceans are warming. From the surface to a depth of 700
meters, global ocean temperature has risen by 0.10°C between 1961
and 2010. When matter undergoes a temperature change its volume
changes. In this case, when water is heated, the particles are more
active and maintain a greater average separation, causing the water
to expand and the sea level to rise. The IPCC believes that thermal
expansion accounts for about 57 percent of sea level rise each year.
Melting of glaciers and ice sheets is another major factor contributing
to rising sea levels. As stated before, much of the loss of ice in
Greenland and Antarctica has been ruled irreversible. The degradation
of glaciers worldwide will continue even if global temperatures stop
rising because of changes in precipitation patterns in regions where
glaciers and ice sheets exist.
Weather EventsClimatologists previously hypothesized that an increase in
greenhouse gases and the subsequent increase in temperatures
would lead to an increase in evaporation and precipitation. While this
has not been shown to be true on a global scale, in certain regions
precipitation has increased since the 2007 IPCC report. In temperate
regions of the Northern Hemisphere, precipitation has increased,
and some winter precipitation that would have previously fallen as
snow is now falling as rain. However, in the tropics and Southern
Hemisphere, precipitation amounts have remained unchanged. In
the Mediterranean and West Africa, droughts have increased.
Extreme weather events have been increasing. The number of heat
waves per year has increased since 1950, and while the frequency of
tropical storms and hurricanes has not noticeably increased, there is
a trend towards increased storm intensity and duration. The number
of Category 4 and 5 storms has increased by about 75 percent since
1970, driven by a rise in water temperature at the surface of the
Image courtesy of National Oceanographic and Atmospheric Administration
Ocean acidi#cation can a%ect the formation of coral and other marine calci#ers.
Image courtesy of NASA
This photo from the International Space Station shows Hurricane Isabel, a 2003 Category 5 storm. Climatologists believe climate change may generate more intense storms.
© 2014 The NEED Project P.O. Box 10101, Manassas, VA 20108 1.800.875.5029 www.NEED.org 31
ocean. Furthermore, the pathways these extreme storms travel has
shifted toward the poles. Worldwide there is a general increase in
precipitation intensity. In North America, heavy downpours have
become more frequent and more intense in the Eastern United
States, while droughts in Western states are becoming more frequent
and intense.
Weather events, precipitation amounts, and surface temperatures
are all interrelated. Hot days and droughts are linked together, too.
Isolating one e!ect of global climate change from another is di%cult.
It is important to remember that a change in one e!ect will result in
changes to many other Earth systems.
Ocean Acidi$cationThe oceans are a natural carbon reservoir and they have been
able to absorb extra amounts of CO2 being emitted. Between 1750
and 1994, the inorganic carbon content of the ocean increased by
about 118 gigatons of carbon. This amount had increased in 2010 to
160 gigatons. The oceans have absorbed carbon dioxide from the
atmosphere, which has lowered the oceans' pH by 0.1 pH units and
has made the oceans more acidic. Scientists predict that this higher
acidity will make calci"cation more di%cult, a!ecting the formation
of corals and marine calci"ers, including shells and skeletons by
corals, crabs, marine snails, and clams. If these organisms are a!ected,
the entire reef ecosystem (consisting of many other organisms) can
also su!er.
Furthermore, the oceans will not be able to continue to absorb carbon
in the amounts seen in the last 150 years. As the water temperature
decreases, the solubility of gases, including carbon dioxide, also
increases. The northern Atlantic Ocean has been absorbing 240
megatons less carbon each year. As sea temperatures increase, the
oceans’ ability to absorb excess carbon from the atmosphere will be
decreased.
Worldwide ImpactsScientists have data showing that greenhouse gases, particularly
CO2, are more concentrated than ever before recorded in historical
data. They have been observing di!erent indicators, including
temperatures, weather events, sea levels, and ocean acidi"cation, to
determine what e!ect greenhouse gases are having on Earth and its
inhabitants; yet much is still unknown. When it comes to predicting
the impact of this concentration of carbon dioxide, scientists are
unsure of exactly what may happen. Looking back through history
and at current patterns, climatologists, biologists, geologists,
meteorologists, and sociologists are making predictions. In the
seven years between the Fourth Assessment Report and the Fifth
Assessment Report, more data, analysis, and interpretation has
con"rmed the e!ects "rst predicted by climatologists in the 1990s.
Scientists are concerned that the indicators mentioned above, as well
as other impacts, will continue to become more pronounced in the
future. Because of these predictions, policy-makers worldwide have
increased discussions on how best to monitor, manage, and mitigate
carbon dioxide emissions, while maintaining quality of life and
economic stability.
Mitgating Climate ChangeCarbon dioxide stays in the atmosphere for a long time. The carbon
dioxide we emit and continue to emit will be present in Earth’s
systems for some time to come. While emissions can be slowed, it
will take time before e!orts that reduce emissions translate into a
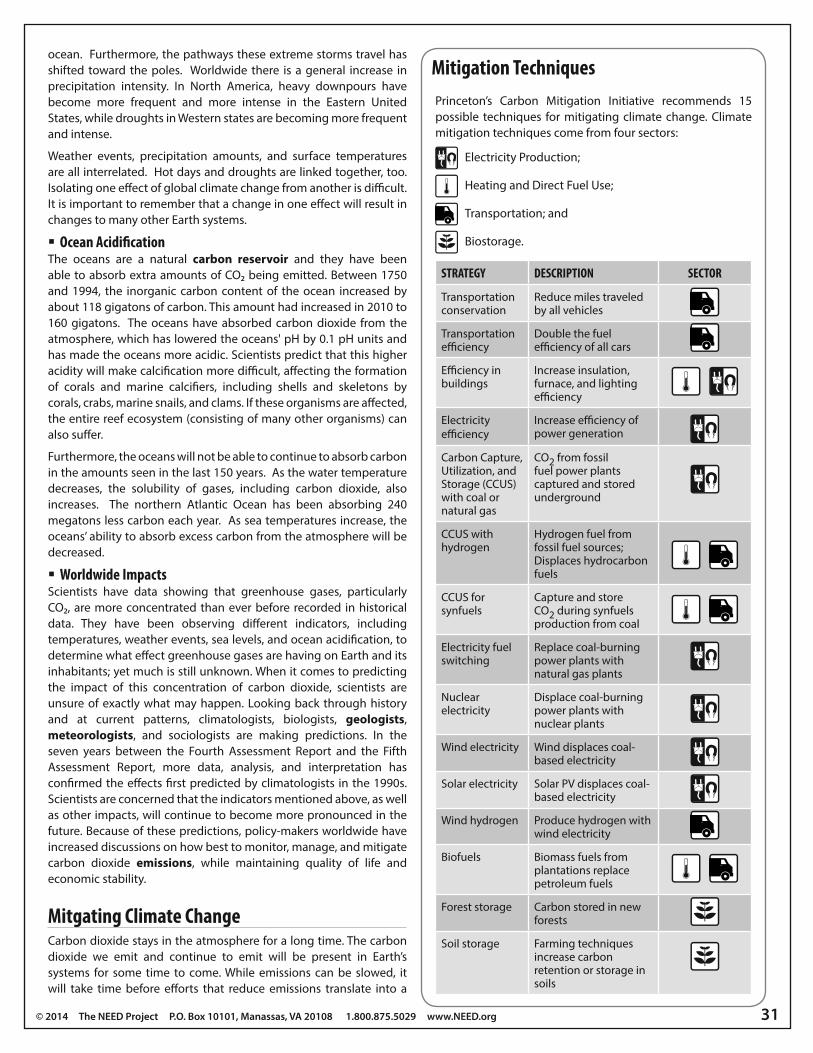
Princeton’s Carbon Mitigation Initiative recommends 15
possible techniques for mitigating climate change. Climate
mitigation techniques come from four sectors:
STRATEGY DESCRIPTION SECTOR
Transportation conservation
Reduce miles traveled by all vehicles
Transportation e%ciency
Double the fuel e%ciency of all cars
E%ciency in buildings
Increase insulation, furnace, and lighting e%ciency
Electricitye%ciency
Increase e%ciency of power generation
Carbon Capture, Utilization, and Storage (CCUS) with coal or natural gas
CO2 from fossil fuel power plants captured and stored underground
CCUS with hydrogen
Hydrogen fuel from fossil fuel sources; Displaces hydrocarbon fuels
CCUS for synfuels
Capture and store CO2 during synfuels production from coal
Electricity fuel switching
Replace coal-burning power plants with natural gas plants
Nuclear electricity
Displace coal-burning power plants with nuclear plants
Wind electricity Wind displaces coal-based electricity
Solar electricity Solar PV displaces coal-based electricity
Wind hydrogen Produce hydrogen with wind electricity
Biofuels Biomass fuels from plantations replace petroleum fuels
Forest storage Carbon stored in new forests
Soil storage Farming techniques increase carbon retention or storage in soils
Electricity Production;
Heating and Direct Fuel Use;
Transportation; and
Biostorage.
Mitigation Techniques
32 Exploring Climate Change
reduction of carbon dioxide in the system. With this knowledge,
policy-makers must consider ways to adapt to any future impacts
of climate change while planning ways to reduce emissions today.
Throughout history, societies around the world have adapted to
changes in their environment and have taken steps to reduce the
impact of those changes on their communities.
MitigationTo mitigate climate change means to make its impact less severe.
Many scientists believe that climate change can be mitigated through
advances in technology and individual lifestyle modi"cations.
Ultimately, to reduce carbon emissions to sustainable levels, we will
need to increase use of, and transition to, energy sources that do
not emit carbon such as uranium, solar, hydropower, and wind.
A combination of these types of actions will need to be taken on the
international and governmental level, and at the individual level as
well.
International AwarenessClimate change impacts every person around the globe, so climate
change is an international issue. There has been a history of the
international community coming together to try and make plans
to combat rising levels of greenhouse gases. In 1997, the Kyoto
Protocol was a "rst step in coming to an international agreement on
greenhouse gas levels. The United States has not rati"ed the Kyoto
Protocol because it did not have targets or timetables outlined for
developing nations as well as industrialized nations.
This agreement expired in 2012; however, participants of the Kyoto
Protocol have agreed to an extension until 2020. World leaders
have met periodically and continue to discuss the regulation of
emissions. One of the main roadblocks is regulating GHG emissions
from developing countries. These nations argue that since current
climate change was primarily caused by emissions from the
developed countries, those countries should bear the responsibility
of lowering emissions. They see limits on GHGs as a limit to their
development and their e!orts to bring millions of their citizens out
of poverty.
While the developed nations accept that they need to curb their
emissions, they feel that developing nations will have an unfair
economic advantage if they are not regulated. An international
conference in Copenhagen, Denmark in 2009 ended without a
strong agreement on how to regulate emissions globally. Many, but
not all, countries made commitments to speci"c GHG targets, but
there is no international system to monitor or regulate their e!orts.
Debate continues as to whether there should be an international
system to monitor and regulate e!orts to lower emissions.
Personal AwarenessPart of battling climate change is to have a better awareness and
understanding of how individual actions a!ect climate change.
People often talk about having a “carbon footprint.” A carbon
footprint refers to the greenhouse gas emissions caused directly
and indirectly by an individual, a product, an organization, or
an event. Each person has an individual carbon footprint. Each
classroom, school, family, and home have speci"c carbon footprints.
A total carbon footprint is based on several factors—how much
energy is used, the way electricity is generated, water use, the types
of transportation used, foods that are eaten, and products and
services used. By decreasing your carbon footprint you can help
decrease the production of carbon dioxide.
Greenhouse gas emissions from electricity production vary
depending upon the sources of energy your utility provider uses
for generation. Fossil fuels used to generate electricity produce
carbon dioxide; however, hydropower, solar, and nuclear energy
are considered carbon neutral. Using less energy, more e%cient
appliances, and using electricity from low or no-carbon sources are
among ways to decrease your carbon footprint.
Transportation is another large part of your carbon footprint
because energy is needed for almost every form of transportation.
Most cars and buses use gasoline or diesel fuel and these produce
GHGs as they combust. Walking or using a bicycle has no carbon
impact, and carpooling and using public transportation are more
e%cient ways to use energy and thus contribute less GHGs than
other transportation options.
Water usage is another area that in&uences the size of your
carbon footprint. The processes of "nding, purifying, treating, and
transporting water involve energy and procedures that have a
carbon footprint. When we are done with water, if it is transported
to a sewage or water treatment plant, these steps also add to water’s
carbon footprint.
It is harder for people to think of individual products, like games or
pencils, as adding to their carbon footprint, but our product choices
impact our carbon footprint as well. Every product has a “life cycle”
that includes everything that had to happen to make, deliver, and
dispose of the item. Recycling products is an easy way to decrease
the size of your footprint. For example, if you recycle your aluminum
can you are helping save energy. Using recycled aluminum requires
about 95 percent less energy than used in the original process of
converting bauxite into metal. The size of your carbon footprint is
adjusted based on if you reuse products, recycle them, or throw
them away.
Like products, the food you eat plays a role in determining your
carbon footprint. When analyzing food’s impact you also have
to look at the life cycle of the food you consume (an apple, for
example), the amount of water and type of fertilizer used, along
with the machinery and vehicles used to pack and transport the
food from where it is grown to your hand—each step is part of
the food’s carbon footprint life cycle. After you are done eating the
food, do you send it through the garbage disposal, into the trash
bin, or into a compost pile?
Looking to the FutureOur environment provides us with all of the essential resources we
need. It provides us with sources of food, water, and oxygen, as well
as reservoirs that can store and process the waste or byproducts
created by our activities. How do we balance our need for energy
with the importance of e%ciency and conservation? While this issue
is very complex, creative solutions by government and industry can
lead to a thriving economy and stable climate. It is the choice of
individuals that makes the most di!erence. Using energy wisely and
conserving our resources is a good idea.