introduction to decision trees and random...
TRANSCRIPT

Introduction to decision trees and random forests
Ned Horning
American Museum of Natural History's Center for Biodiversity and Conservation
What are decision trees?
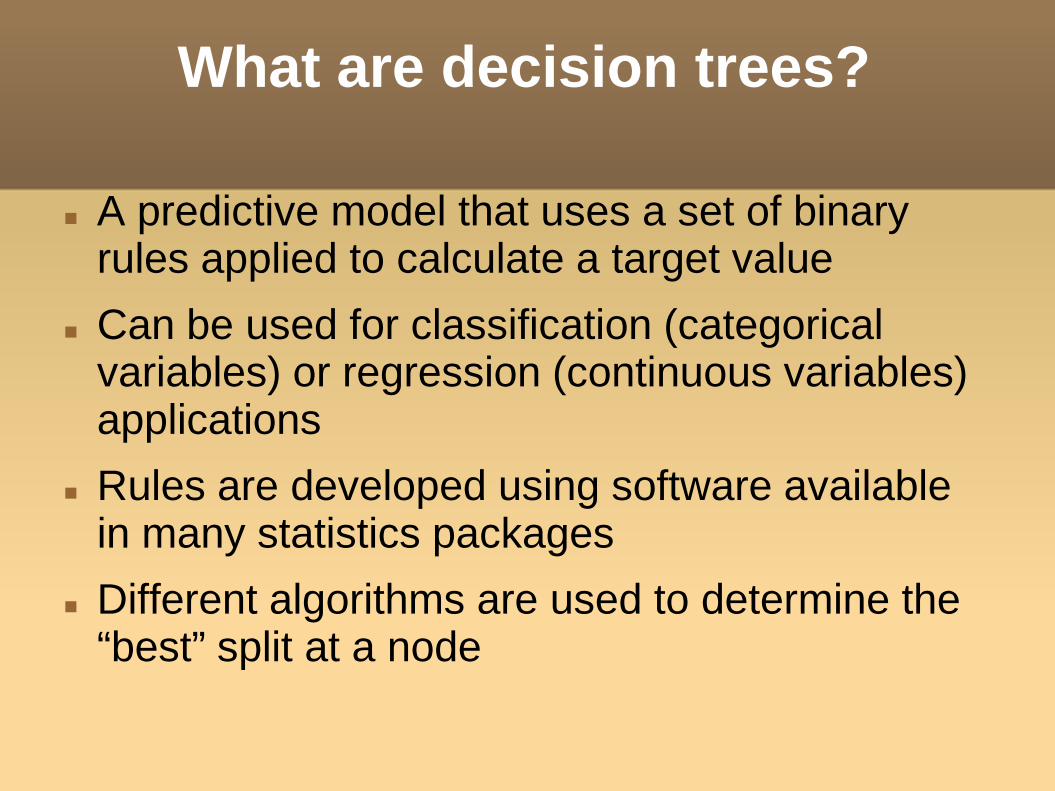
A predictive model that uses a set of binary rules applied to calculate a target value
Can be used for classification (categorical variables) or regression (continuous variables) applications
Rules are developed using software available in many statistics packages
Different algorithms are used to determine the “best” split at a node

Example classification tree

How do classification trees work?
Uses training data to build model
Tree generator determines: Which variable to split
at a node and the value of the split
Decision to stop (make a terminal note) or split again
Assign terminal nodes to a class
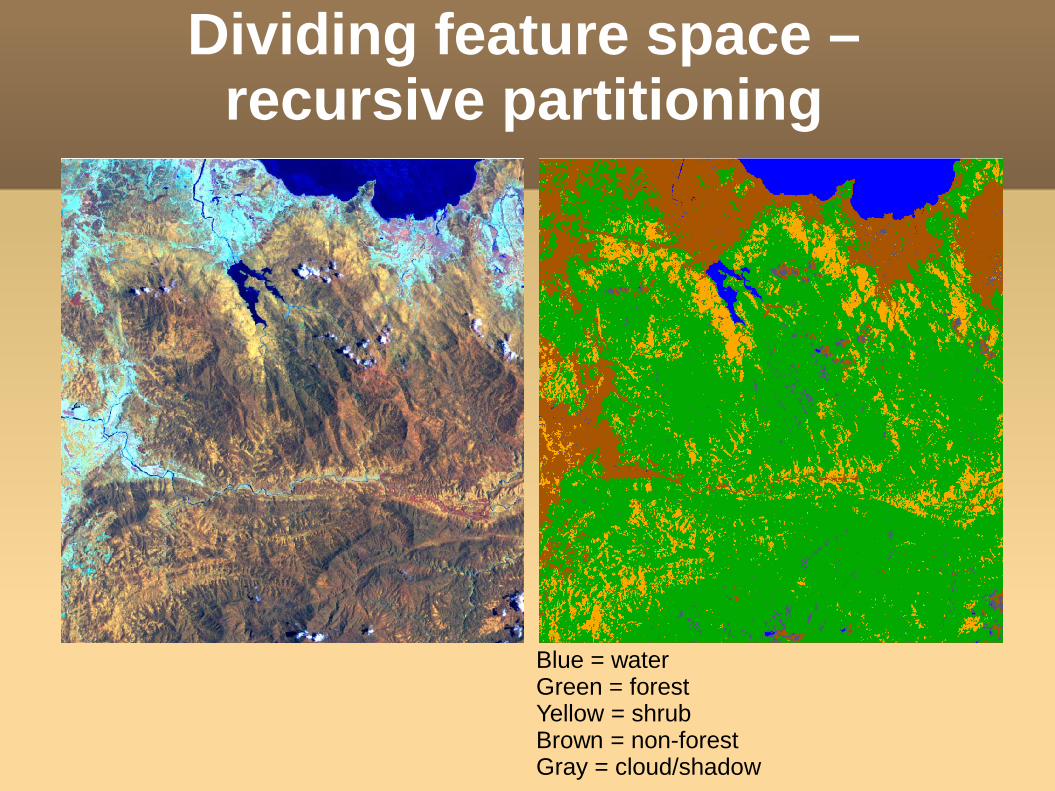
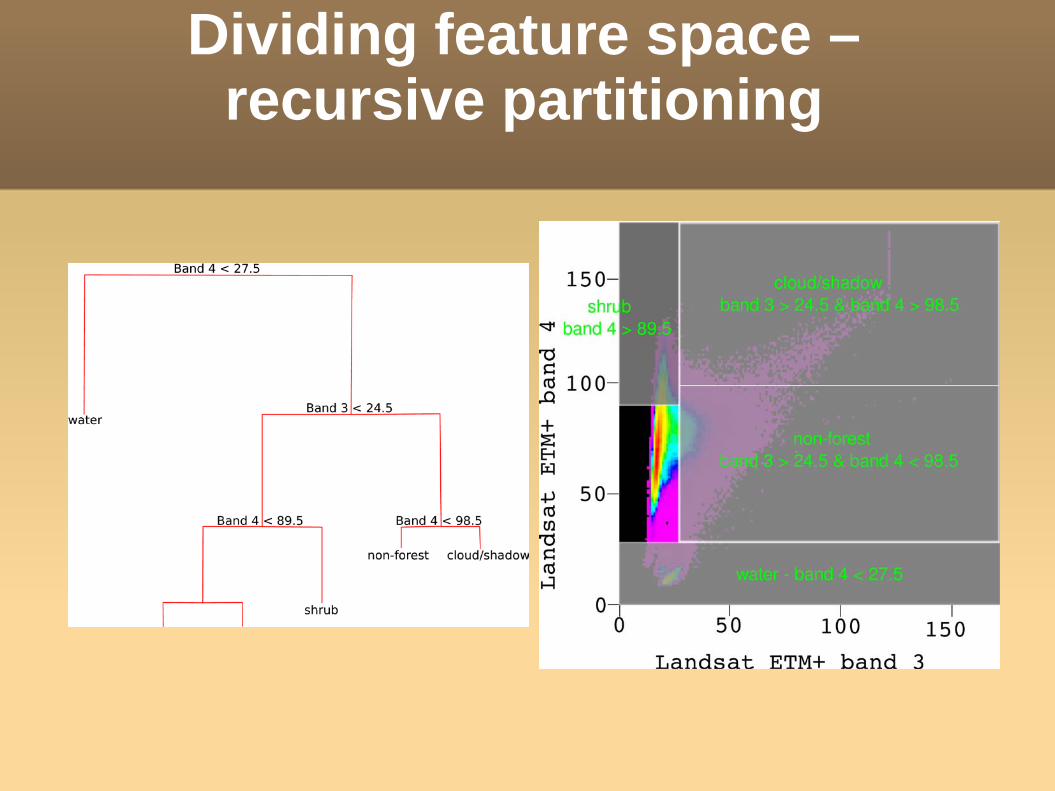
Dividing feature space –recursive partitioning
Blue = waterGreen = forest Yellow = shrubBrown = non-forestGray = cloud/shadow
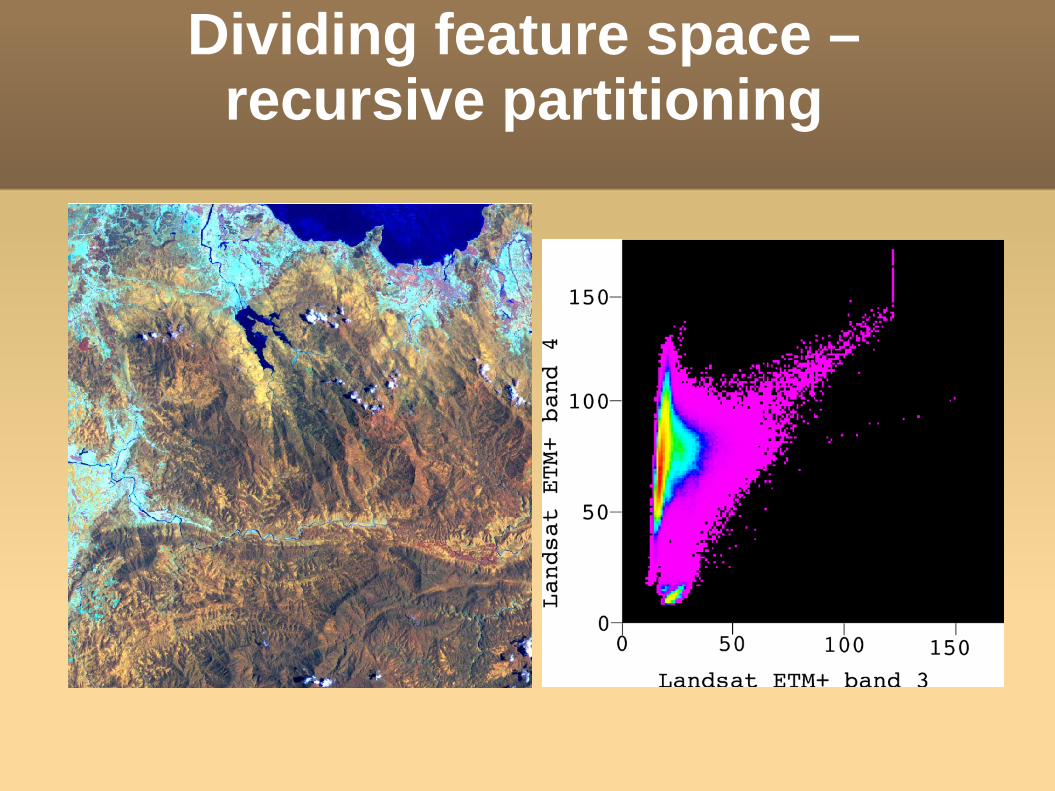
Dividing feature space –recursive partitioning
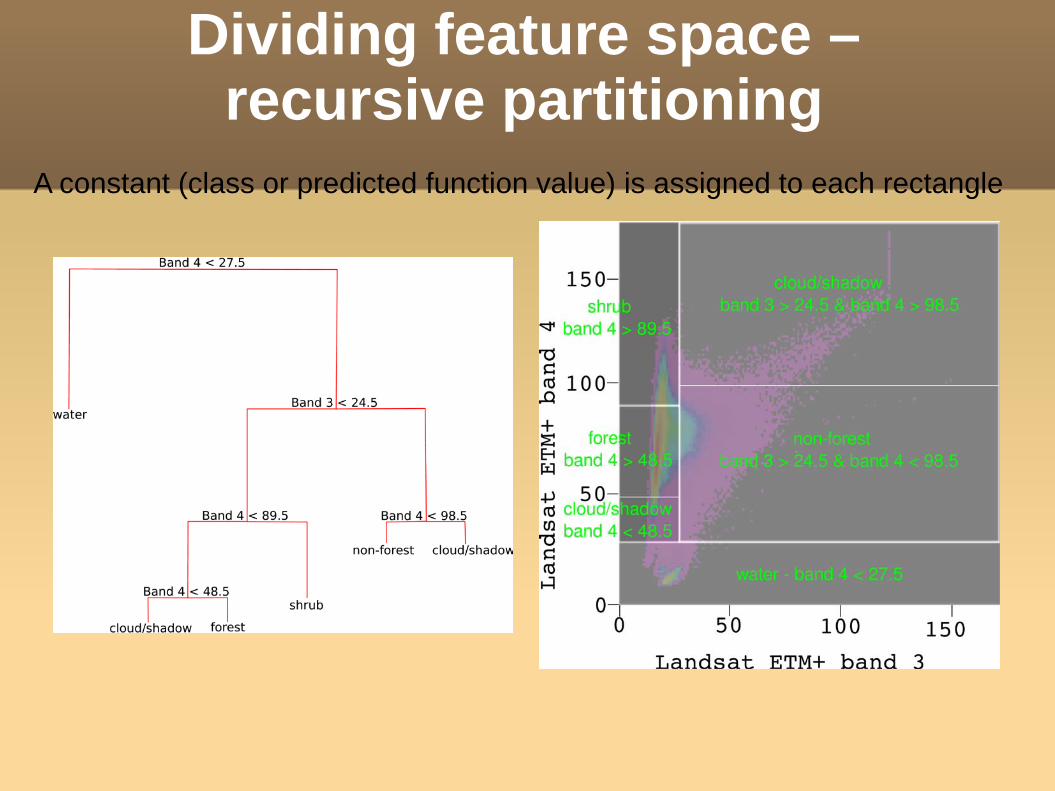
Dividing feature space –recursive partitioning
A constant (class or predicted function value) is assigned to each rectangle

Dividing feature space –recursive partitioning

Dividing feature space –recursive partitioning
Dividing feature space –recursive partitioning

Dividing feature space –recursive partitioning

Editing (pruning) the tree
Overfitting is common since individual pixels can be a terminal node
Classification trees can have hundreds or thousands of nodes and these need to be reduced by pruning to simplify the tree
Pruning involves removing nodes to simplify the tree
Parameters such as minimum node size, and maximum standard deviation of samples at a node can restrict tree size

Regression trees
Regression calculates relationship between predictor and response variables
Structure is similar to classification tree
Terminal nodes are predicted function (model) values
Predicted values are limited to the values in the terminal nodes

Decision tree advantages
Easy to interpret the decision rules Nonparametric so it is easy to incorporate a
range of numeric or categorical data layers and there is no need to select unimodal training data
Robust with regard to outliers in training data Classification is fast once rules are developed

Drawbacks of decision trees
Decision trees tend to overfit training data which can give poor results when applied to the full data set
Splitting perpendicular to feature space axes is not always efficient
Not possible to predict beyond the minimum and maximum limits of the response variable in the training data

Packages in R
tree – The original decision tree package rpart – A slightly newer and more aggressively
maintained package

What are ensemble models?
Combines the results from different models
Models can be a similar type or different
The result from an ensemble model is usually better than the result from one of the individual models

What is random forests
An ensemble classifier using many decision tree models
Can be used for classification or regression
Accuracy and variable importance information is provided with the results

How random forests work
A different subset of the training data are selected (~2/3), with replacement, to train each tree
Remaining training data (OOB) are used to estimate error and variable importance
Class assignment is made by the number of votes from all of the trees and for regression the average of the results is used
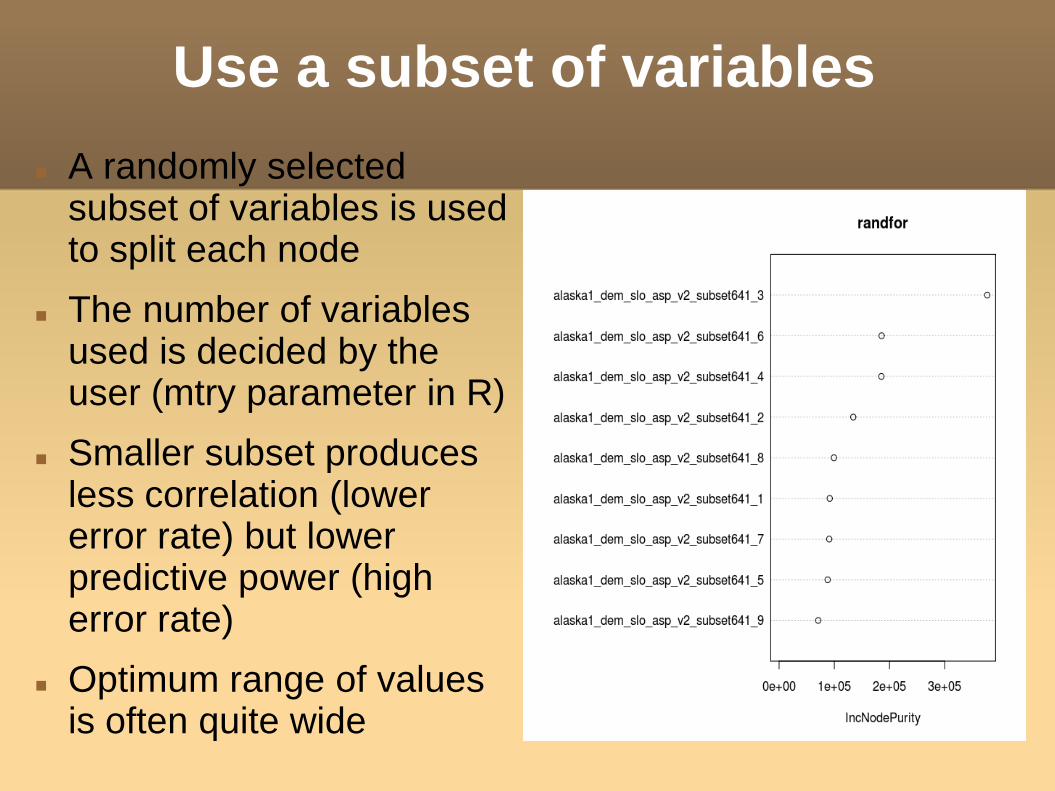
Use a subset of variables A randomly selected
subset of variables is used to split each node
The number of variables used is decided by the user (mtry parameter in R)
Smaller subset produces less correlation (lower error rate) but lower predictive power (high error rate)
Optimum range of values is often quite wide

Common variables for random forests
Input data (predictor and response)
Number of trees Number of variables
to use at each split Options to calculate
error and variable significance information
Sampling with or without replacement
randomForest(x, y=NULL, xtest=NULL, ytest=NULL, ntree=500,
mtry=if (!is.null(y) && !is.factor(y))max(floor(ncol(x)/3), 1) else
floor(sqrt(ncol(x))),replace=TRUE, classwt=NULL, cutoff,
strata,sampsize = if (replace) nrow(x) else
ceiling(.632*nrow(x)),nodesize = if (!is.null(y) && !is.factor(y))
5 else 1,importance=FALSE, localImp=FALSE,
nPerm=1,proximity, oob.prox=proximity,norm.votes=TRUE, do.trace=FALSE,keep.forest=!is.null(y) && is.null(xtest),
corr.bias=FALSE,keep.inbag=FALSE, ...)
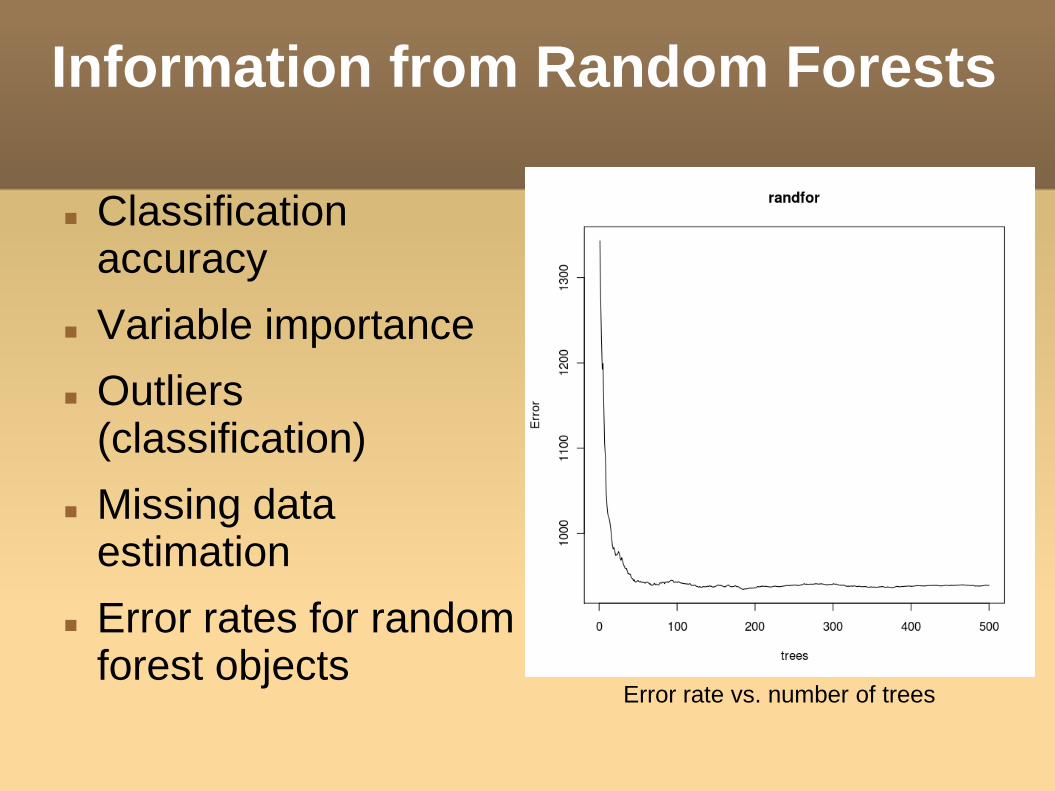
Information from Random Forests
Classification accuracy
Variable importance Outliers
(classification) Missing data
estimation Error rates for random
forest objectsError rate vs. number of trees

Advantages of random forests
No need for pruning trees
Accuracy and variable importance generated automatically
Overfitting is not a problem
Not very sensitive to outliers in training data
Easy to set parameters

Limitations of random forests
Regression can't predict beyond range in the training data
With regression extreme values are often not predicted accurately –underestimate highs and overestimate lows

Common remote sensing applications of random forests
Classification Land cover
classification Cloud/shadow
screening Regression
Continuous fields (percent cover) mapping
Biomass mapping

Resources to learn more about random forests
http://www.stat.berkeley.edu/~breiman/RandomForests/cc_home.htm#prox
http://en.wikipedia.org/wiki/Random_forest The randomForest Package (for R) description