introduction to lean. the rational person adapts themselves to the world the irrational person tries...
Post on 20-Dec-2015
217 views
TRANSCRIPT

Introduction To Lean

The rational person adapts themselves to the world
The irrational person tries to adapt the world to themselves

Therefore all progress depends on the irrational person

Copyright ©2006 Lean Advisors Inc.
Cost Profit Selling Price+ =
Selling Price Profit=Cost-

Copyright ©2006 Lean Advisors Inc.
Cost Profit Selling Price+ =
Selling Price Cost- Profit=

What’s Included in Cost?
Copyright ©2006 Lean Advisors Inc.

www.leanadvisors.com
Reality - The Cost Squeeze
1st Qtr 2000 – 2nd Qtr 2002:
Selling Prices -2.5%
Wage Rates +8.2%
Raw Materials +12.4%
Payroll Taxes & Benefits +13.5%
Electricity +18.5%
Industrial Fuel +34.5%

www.leanadvisors.com
Macro Focus vs. Isolation
Cisco inventory - $1.2 billion on July 29, 2000. “ “ - $2 “ on Oct. 31, 2000. “ “ - $2.5 “ early Feb., 2001.Macro Level – Contracted SuppliersSolectron - $1.8 billion Feb. 2000 to $4.5 billion at year
end. (Sept. 02 reported loss of >2 B$ for 1st Q)Flextronics - $450 million Jan. 2000 to $1.73 billion at
year end.Note- Sales increased 25% over same period
Fortune, March 5, 2001

www.leanadvisors.com
A Simple Can of Pop
MineReduction
millSmelter Hot roller
Coldroller
Canmaker
Canware-house
Bottler Bottlerware-house
Tescoware-house
Home
Recyclecenter
Remelter
Tescostore

www.leanadvisors.com
Simple Value Stream:A Can of Pop
• Eight firms
• Fourteen storage points
• Picked up & put down 30 times
• 24% of raw material scrapped
• 319 days to do 3 hours work

www.leanadvisors.com
What’s The Answer?1. Wait it out2. Ignore it3. Borrow money 4. Fire people5. Sell parts of the business6. Reduce margin – go for volume7. Pray – wait for a miracle8. Give upOr do something about it that transforms your company
into the leader in your industry.

www.leanadvisors.com
Challenge
“No company can earn above-average profits in the absence of unique
competitive advantage – something that creates value for customers (or
lowers the cost of providing that value) and is difficult for competitors to
imitate.” Michael Porter, Harvard Business School (20 Years ago)

Some Terms Inventory Turns: The amount of time to fully use
your inventory before having to replenish it.
Takt Time: The pace you need to produce at to meet your customers demand.
Lead time: The time from a request for material until the customer purchases that material.
Copyright ©2006 Lean Advisors Inc.

Copyright ©2006 Lean Advisors Inc.
Lean Results
• Lead Time• Cost• Labor Required• Space• Inventory• Defects
• Customer Responsiveness• Capacity• Employee Satisfaction• Flexibility – Demand Flux

www.lean1.org
15
Three Types of Leaders
“There are three kinds of people;those who make it happenthose who watch it happenand those who wonder what happened”
--William Levinson

Copyright ©2006 Lean Advisors Inc.
Lean Results: Actual
Metric BASELINE New Change Process Time 164.28 secs 86.5 secs 77.78 secs 47%
Lead Time 19.32 days 7.13 days 12.19 days 63%
WIP US $26,934 US $17,542 US $9,397 34%
Distance Traveled 314.11 feet 173.2 feet 140.91 feet 45%
Floor Space 2000 sq. ft. 1200 sq. ft. 800 sq. ft. 40%
Process steps 13 9 4 30%
Labor savings US $732,108 US $622,108 US $110,000 31%

Copyright ©2006 Lean Advisors Inc.
Lean Results: Actual
Metric Feb ‘03 Nov ‘03 Dec ’04 Actual Process Time 1444 hrs 1255 hrs (13%) 378 hrs (74 %) Lead Time 340 days 160 days (53%) 40 days (88%)
WIP (units) 946 units 432 units (54%) 242 units (74%) WIP ($) est. $6,480,352 $2,958,413 (54%) $1,656,745 (75%)
Dist Traveled 4571 ft 2797 ft (39%) 1997 ft (56%)
Sq. Ft Used 9244 sq. ft 7696 sq. ft. (17%) 7496 sq. ft. (19%)

Copyright ©2006 Lean Advisors Inc.
Metric Sept ‘02 Oct ‘03 Dec ’04 Actual Process Time 69.4 hrs 57.9 hrs (16%) 48.6 hrs (30 %)
Lead Time 23 days 11 days (52%) 9 days (60%)
WIP (units) 261 units 130 units (50%) 65 units (75%)
Unit Labor (hours) 6.6 h 4.0 h (39%) 3.6 (45%)
Dist Traveled 3045 ft 1547 ft (49%) 1066 ft (65%) Defects/Mo. 455 Defects 150 Defects (67%) 114 Defects (75%)
Lean Results: Actual

Copyright ©2006 Lean Advisors Inc.
Lean Results: Actual
Metric Feb ’04 Baseline Dec ’04 Actual % Change Avg Cycle Time (days) 51.4 31.7 -38.3%
WIP (serialized assets) 4393 2117 -51.8%
Pnp Changeover 240 min 9 min -96.3%
Monthly Runs 30 98 +69.4%
Overtime/Mo. 290 hrs 130 hrs -55.2%
Hrs per Assy 5.07 2.82 -44.4%

Copyright ©2006 Lean Advisors Inc.
Defining Lean Lean is a simple strategy that focuses on the
elimination of waste, variation, and work imbalance.
Each step must create value for the Customer! It is a way of life.

Copyright ©2006 Lean Advisors Inc.
Lean is Fundamentally Different
Insight #1
See from Customer perspective
Insight #2
See from part / product or service perspective
Insight #3
See from an end to end perspective

Copyright ©2006 Lean Advisors Inc.
Types of Activities Value Added Work
Any activity transforming the part, product or service that a Customer is willing to pay for.

Copyright ©2006 Lean Advisors Inc.
Types of Activities Incidental Work
Any activity that does not add value but it is currently necessary.

WasteWaste
Elements of work adding no value to the Customer.
Adds cost and time.
Things to remember about waste:
Symptom – not Root Cause At System and Process level Eliminate Root Cause

Copyright ©2006 Lean Advisors Inc.
Types of Activities Pure Waste
Any activity that does not add value and is not
necessary to meet the needs of the Customer.
Typical Company
Pure Waste
Value
Incidental Work

Copyright ©2006 Lean Advisors Inc.
Waste: Overproduction Causes
Producing faster than the next step
Batching work or moves for economic reasons
Unbalanced resources Producing extra
Effects Queues Intermediate stocks Finished inventory

Copyright ©2006 Lean Advisors Inc.
Waste: Inventory Causes
Takes too long to make or get product
Economic order quantity
Effects Cash tied up Space to store Obsolescence and time
expiries Handling cost
(receiving, counting, issuing)

Finished Product to Customer
Raw Material
Sea of Inventory
PoorScheduling Quality
Problems
Machine Breakdown
Long Transportation
LongSet-upTime
Vendor Delivery
LineImbalance
Absenteeism
Lack ofHousekeeping
Communication Problems
Inventory Hides WasteInventory Hides Waste

Finished Product to Customer
Raw Material
Sea of Inventory
PoorScheduling Quality
Problems
Machine Breakdown
Long Transportation
LongSet-upTime
Vendor Delivery
LineImbalance
Absenteeism
Lack ofHousekeeping
Communication Problems
Inventory Hides WasteInventory Hides Waste

Copyright ©2006 Lean Advisors Inc.
Waste: Waiting Causes
Responding or producing slower than needed
Unavailable resources Waiting for answers
Effects People wait Machines wait Material wait

Copyright ©2006 Lean Advisors Inc.
Waste: Transportation Causes
Long distances between work area
Work areas set up by similarities rather than product flow
Distance to customers and suppliers
Effects Inventories Batching High cost

Copyright ©2006 Lean Advisors Inc.
Waste: Motion Causes
Poor organization Lack of visual controls Lack of standard methods Can’t readily find things
Effects Searching Back and forth movement Waiting

Copyright ©2006 Lean Advisors Inc.
Waste: Motion Typical Office or Factory Movement

Copyright ©2006 Lean Advisors Inc.
Waste: Defects Causes
Lack of skill or knowledge Poor design Damage while waiting Rushing
Effects Extra resources for
inspection and rework Delays Warranty claims Unhappy customers

Copyright ©2006 Lean Advisors Inc.
Waste: Over Processing Causes
Lack of knowledge No standard work Failure to know what
the customer wants
Effects Added time Added costs Variability

Copyright ©2006 Lean Advisors Inc.
1
11
10
2
3
45
9
8
7
6
14
1312
15
17
16
$36,000

Copyright ©2006 Lean Advisors Inc.
Waste: Reprioritization Causes
Too much work in progress
Poor planning Overproduction
Effects Lost time Customer/employee
frustrations Cost

Copyright ©2006 Lean Advisors Inc.
Waste: People’s Skills Causes
No time No mechanism Belief they don’t know
enough Don’t have the big
picture knowledge
Effects Lost opportunities Lowers morale Builds barriers

Copyright ©2006 Lean Advisors Inc.
Types of Waste: Shop Floor
Over Production
Inventory
Waiting
Transportation
Motion
Over Processing
Quality Defects
Reprioritization
People’s Skills
Copyright ©2006 Lean Advisors Inc.
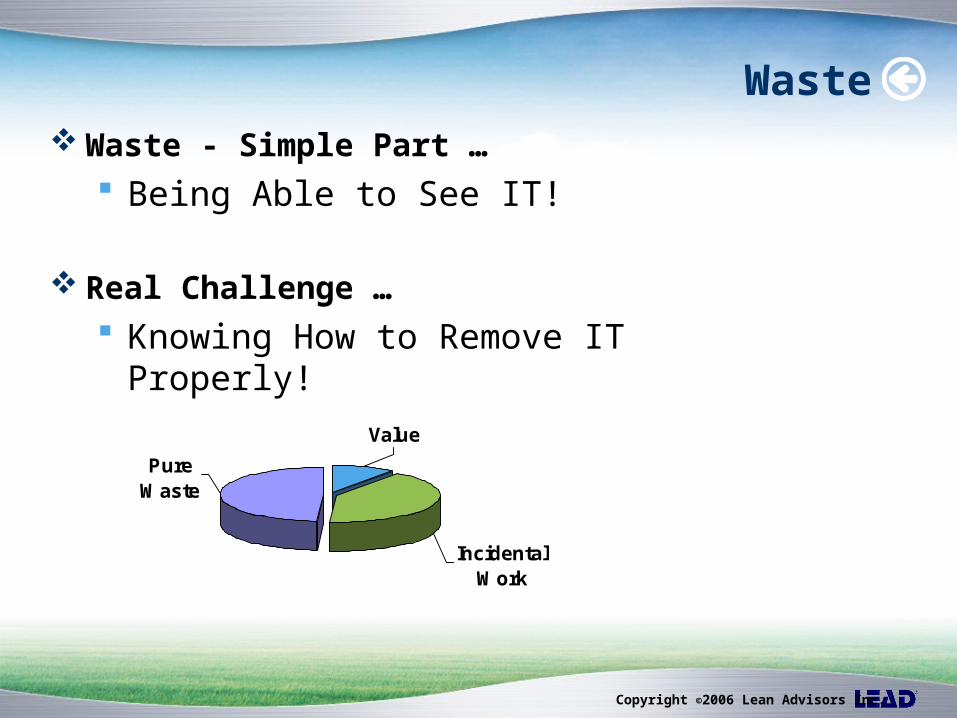
Waste Waste - Simple Part …
Being Able to See IT!
Real Challenge … Knowing How to Remove IT Properly!
Pure Waste
Value
Incidental Work

Point EfficiencyPoint EfficiencyPoint efficiency happens when a company makes changes to the value stream without knowing what the end to end impact is.
Point efficiency can be an individual process, a department in manufacturing or the Office.
What if we change one rower?
Which one should we change?

www.leanadvisors.com
Caution - Point Improvement
The average speed of traffic in London, England 100 years ago was 12 mph.
The average speed today is 12 mph!!
E-Check in is similar – speed up the boarding pass process but the traditional processes of dropping off the luggage remains the same.

MOVING FAST IS NOT THE SAME AS GOING SOMEWHERE
Copyright ©2006 Lean Advisors Inc.
The Lean Solution Lean will fundamentally change the way a
business operates!
Yet surprisingly, it is based on 5 simple principles
Copyright ©2006 Lean Advisors Inc.
Principle 1: Value What is Value?
Value is simply defined as any work or activity that the customer would knowingly
pay for.

Copyright ©2006 Lean Advisors Inc.
Principle 2: Map the Flow of Value
Process A Process B Process CCustomerOrder
CustomerFinished Product
Value Stream
Value Stream: Is set of all activities both value add and non value add required to bring product from Raw material to Customer.

Copyright ©2006 Lean Advisors Inc.
Principle 3: Make Value Flow
How long to make a pack of 10 units?
Batch Processing Each step makes a batch of 10 60 second cycle time (Each coloured circle represents 1 minute of time)

Copyright ©2006 Lean Advisors Inc.
Principle 3: Make Value Flow
Continuous Flow Make 1 Move 1
How long to make a pack of 10 units?

Copyright ©2006 Lean Advisors Inc.
Takt Time Synchronizes pace of production to
pace of sales. Rate of assembly based on customer demand
Takt Time = Effective working time per shiftClient demand per shift
= 460 minutes920 pieces = 30 sec
QUESTION : If my area worked one 8 hour shift and had 2 X 10 minute paid breaks with a requirement to produce 920 results, then what would my TAKT time be?

Copyright ©2006 Lean Advisors Inc.
Principle 4: Pull from the Customer
Okay! One more please!
CustomerSupplier

Principle 5: Seek Perfection
There is always more waste Involve employees in the process,
training them as you proceed. Use root cause analysis to solve
problems promptly and permanently. Make objectives visible.