introduction to mass spectrometry - agilent · pdf fileintroduction to mass spectrometry...
TRANSCRIPT

Introduction to Mass Spectrometry
Ionization Sources, Ion
Trajectory, and Method
Development
Patrick Cronan
October 16, 2012
Agenda
• Introduction to mass spectrometry
– Benefits of using mass spectrometry
– Ionization techniques
– Mass Analyzer
• Parameters for the Agilent 6100 Mass Spectrometers
• Tuning the mass spectrometer
• Optimizing MSD Analyses
Myths of LC/MS
“LC/MS is not routine”
“LC/MS is not sensitive”
“LC/MS is not quantitative”
“LC/MS is not cost-effective”
Benefits of LC/MS
For the chromatographer Complements existing LC detectors
Does not depend on particular functional group
Can be used as a mass-specific detector
Provides both qualitative and quantitative information
For the mass spectrometrist
Can analyze compounds not amenable to GC (large, polar,
thermally labile)
Allows direct coupling of LC separation; produces better
information faster than "offline" LC/MS
Automates probe analysis via flow injection
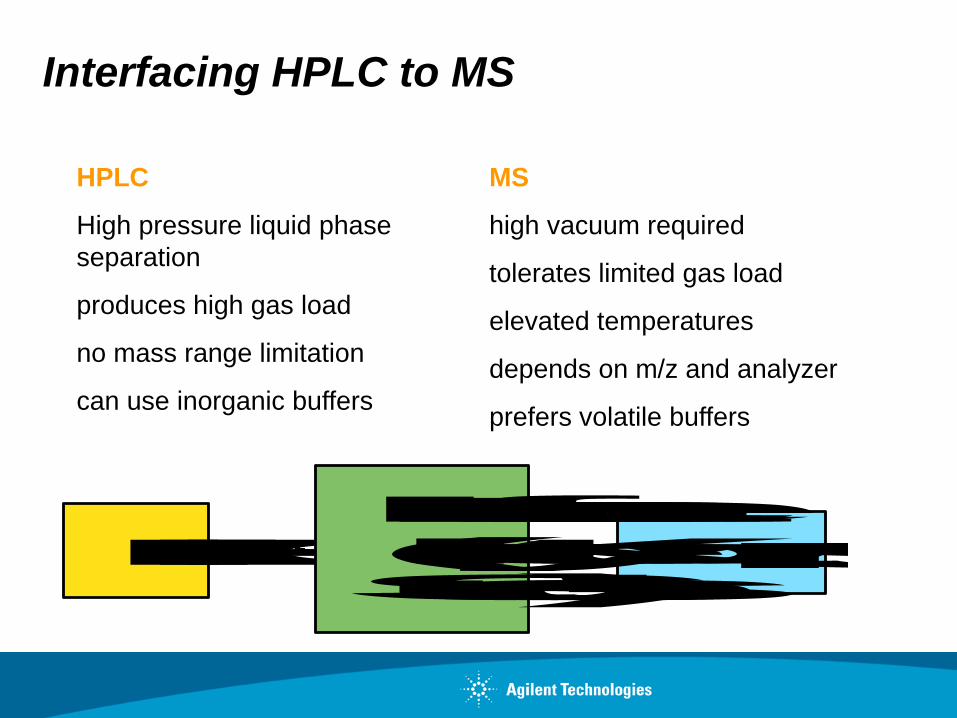
Interfacing HPLC to MS
HPLC
High pressure liquid phase
separation
produces high gas load
no mass range limitation
can use inorganic buffers
MS
high vacuum required
tolerates limited gas load
elevated temperatures
depends on m/z and analyzer
prefers volatile buffers
HPLC MS
Interface(Key to Success!)
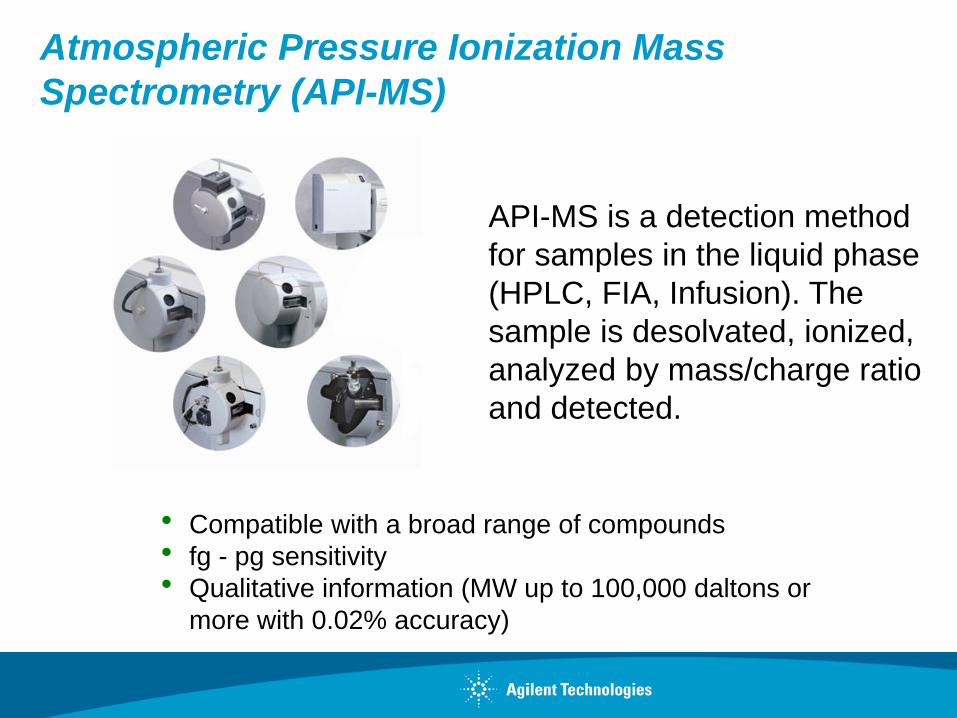
API-MS is a detection method
for samples in the liquid phase
(HPLC, FIA, Infusion). The
sample is desolvated, ionized,
analyzed by mass/charge ratio
and detected.
Compatible with a broad range of compounds
fg - pg sensitivity
Qualitative information (MW up to 100,000 daltons or
more with 0.02% accuracy)
Atmospheric Pressure Ionization Mass
Spectrometry (API-MS)
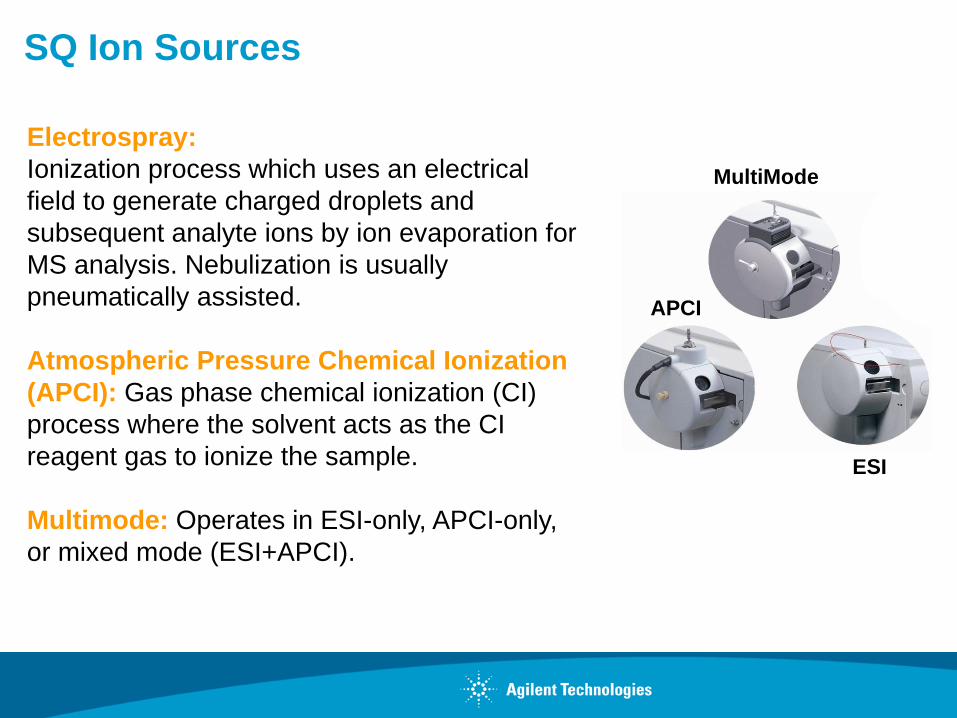
SQ Ion Sources
Electrospray:
Ionization process which uses an electrical
field to generate charged droplets and
subsequent analyte ions by ion evaporation for
MS analysis. Nebulization is usually
pneumatically assisted.
Atmospheric Pressure Chemical Ionization
(APCI): Gas phase chemical ionization (CI)
process where the solvent acts as the CI
reagent gas to ionize the sample.
Multimode: Operates in ESI-only, APCI-only,
or mixed mode (ESI+APCI).
APCI
MultiMode
ESI
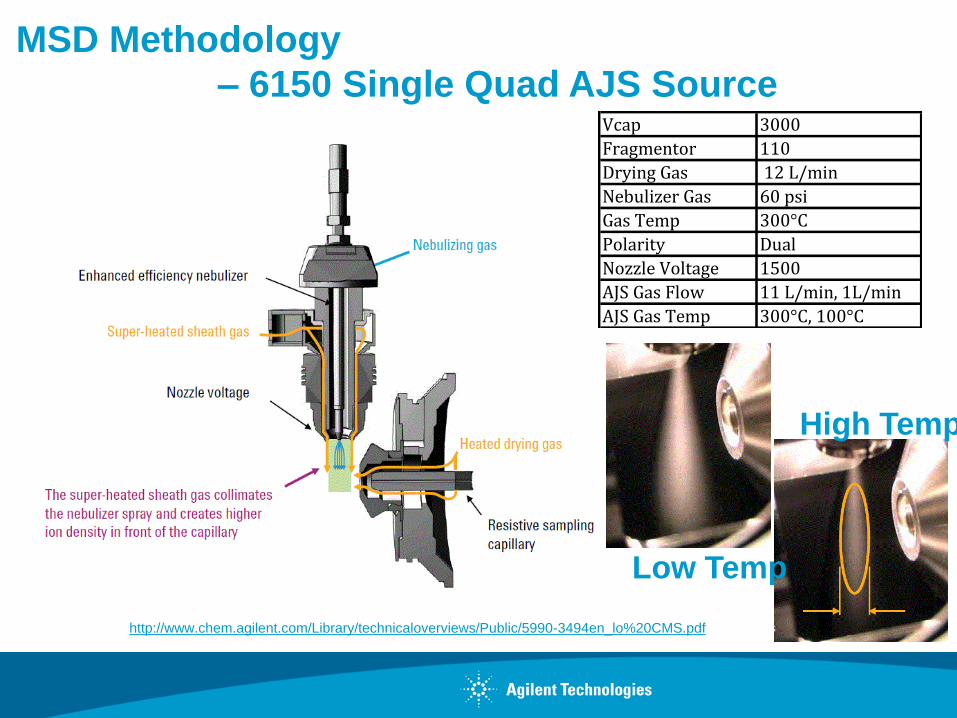
MSD Methodology
– 6150 Single Quad AJS Source
Low Temp
High Temp
http://www.chem.agilent.com/Library/technicaloverviews/Public/5990-3494en_lo%20CMS.pdf
Vcap 3000
Fragmentor 110
Drying Gas 12 L/min
Nebulizer Gas 60 psi
Gas Temp 300°C
Polarity Dual
Nozzle Voltage 1500
AJS Gas Flow 11 L/min, 1L/min
AJS Gas Temp 300°C, 100°C
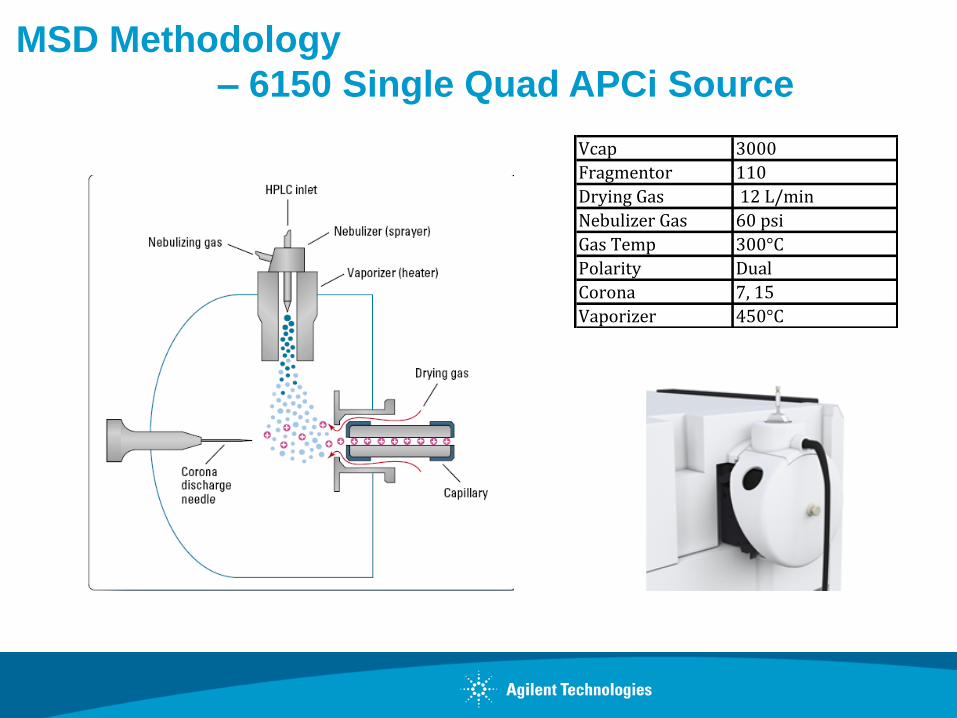
MSD Methodology
– 6150 Single Quad APCi Source
Vcap 3000
Fragmentor 110
Drying Gas 12 L/min
Nebulizer Gas 60 psi
Gas Temp 300°C
Polarity Dual
Corona 7, 15
Vaporizer 450°C
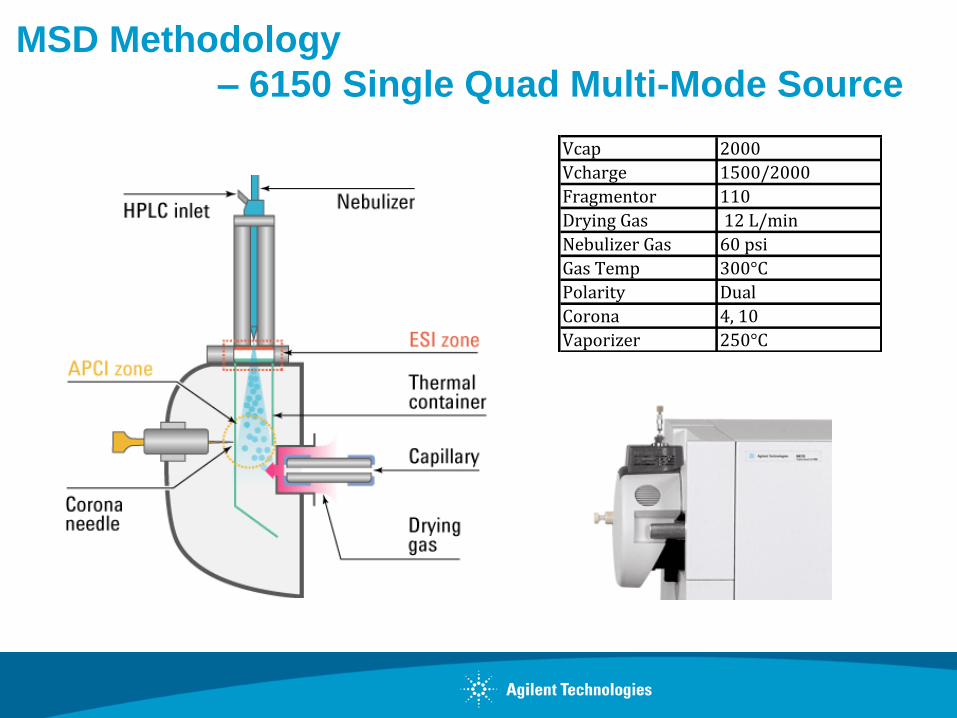
MSD Methodology
– 6150 Single Quad Multi-Mode Source
Vcap 2000
Vcharge 1500/2000
Fragmentor 110
Drying Gas 12 L/min
Nebulizer Gas 60 psi
Gas Temp 300°C
Polarity Dual
Corona 4, 10
Vaporizer 250°C

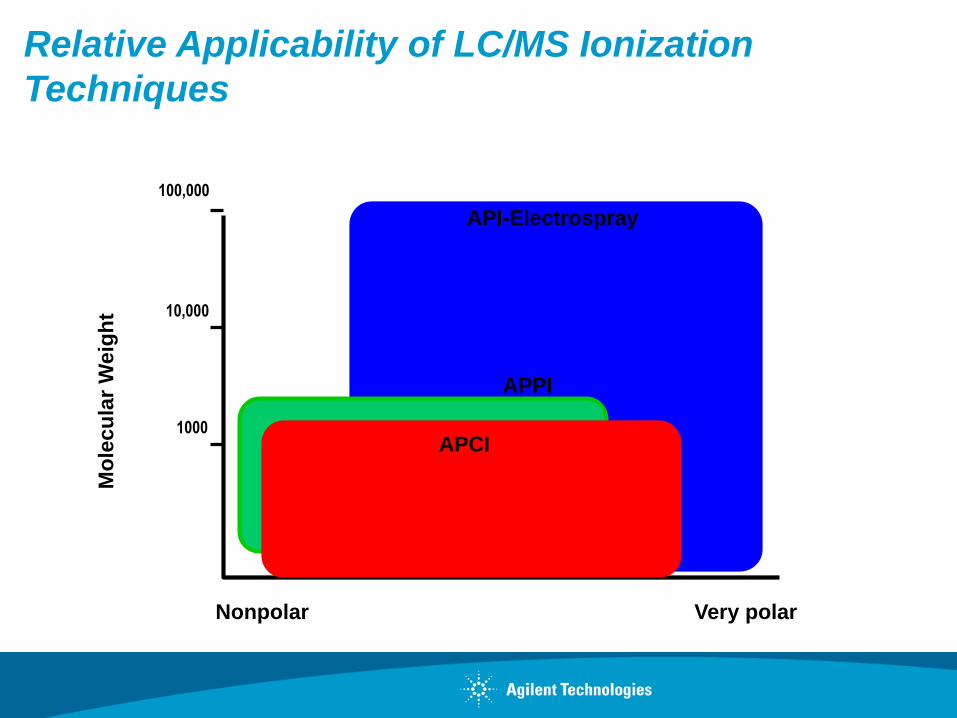
API-Electrospray
1000
100,000
10,000
Nonpolar Very polar
Mo
lec
ula
r W
eig
ht
Relative Applicability of LC/MS Ionization
Techniques
APPI
APCI
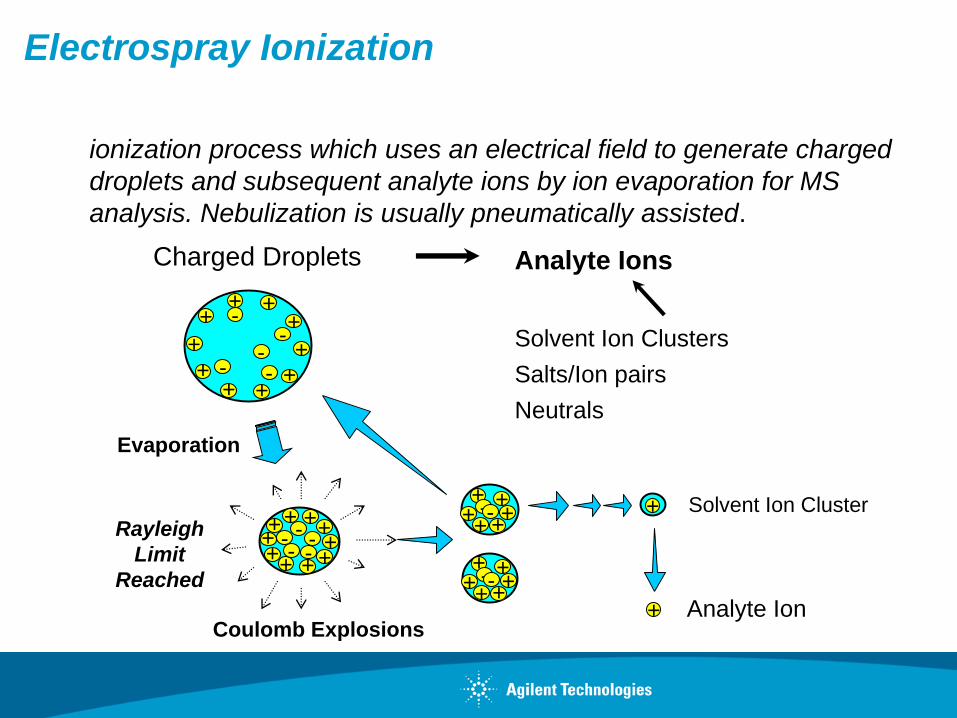
Coulomb Explosions
Rayleigh
Limit
Reached
+ + +
+ +
+ +
+ +
+ -
- -
-
-
+ + +
+ +
+ +
+ +
+ - - - -
- +
+
+ + + + - -
+
+
+ + + + - -
Evaporation
+
+
Charged Droplets
Analyte Ion
Solvent Ion Cluster
Analyte Ions
Solvent Ion Clusters
Salts/Ion pairs
Neutrals
Electrospray Ionization
-Theory
ionization process which uses an electrical field to generate charged
droplets and subsequent analyte ions by ion evaporation for MS
analysis. Nebulization is usually pneumatically assisted.
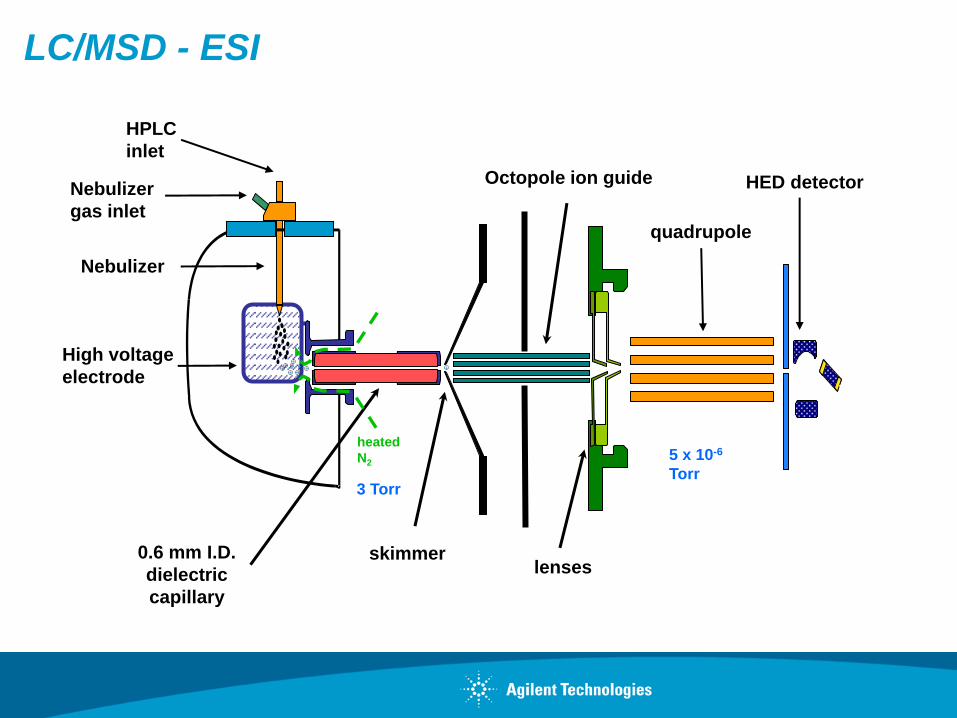
LC/MSD - ESI
skimmer
Octopole ion guide
0.6 mm I.D.
dielectric
capillary
+ + + +
+ + + +
+
5 x 10⁻⁶
Torr 3 Torr
quadrupole
HED detector
lenses
HPLC
inlet
Nebulizer
Nebulizer
gas inlet
heated
N2
High voltage
electrode
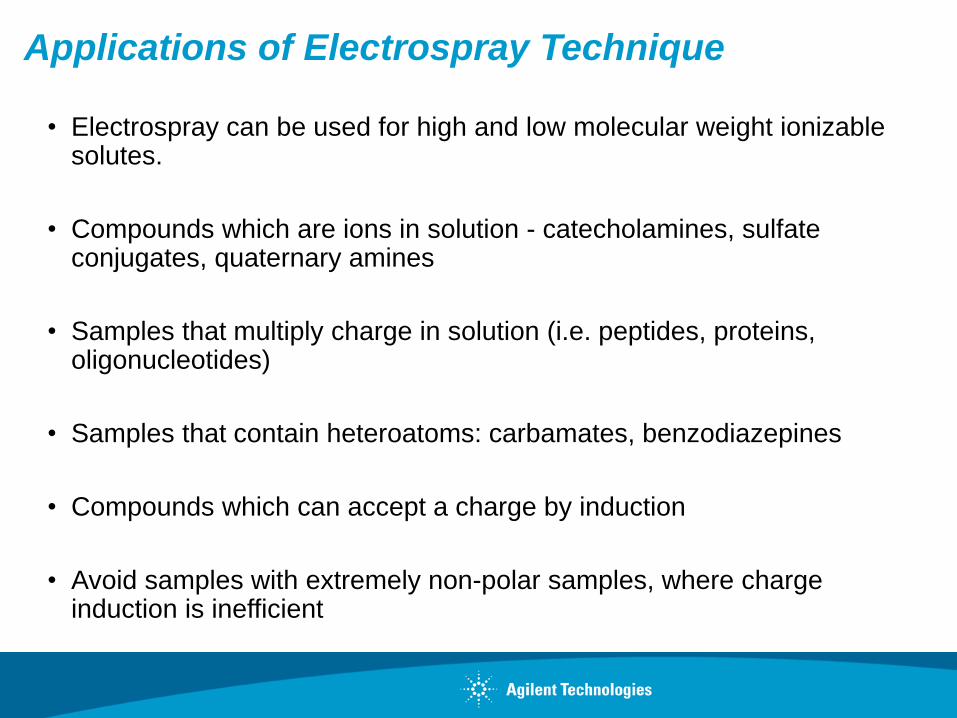
Applications of Electrospray Technique
• Electrospray can be used for high and low molecular weight ionizable solutes.
• Compounds which are ions in solution - catecholamines, sulfate conjugates, quaternary amines
• Samples that multiply charge in solution (i.e. peptides, proteins, oligonucleotides)
• Samples that contain heteroatoms: carbamates, benzodiazepines
• Compounds which can accept a charge by induction
• Avoid samples with extremely non-polar samples, where charge induction is inefficient
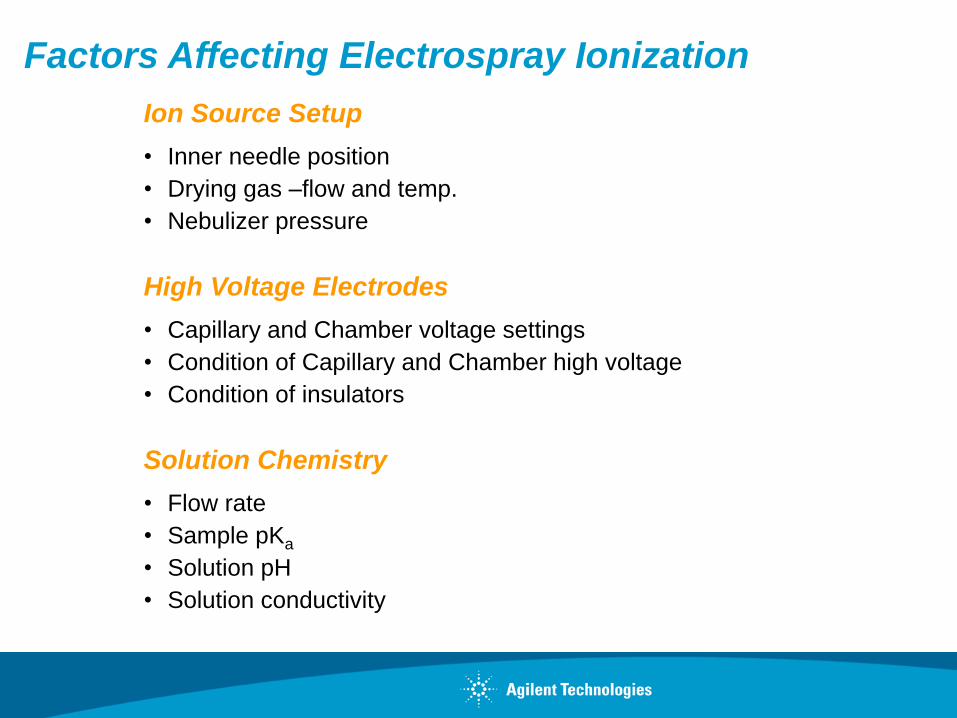
Factors Affecting Electrospray Ionization
Ion Source Setup
• Inner needle position
• Drying gas –flow and temp.
• Nebulizer pressure
High Voltage Electrodes
• Capillary and Chamber voltage settings
• Condition of Capillary and Chamber high voltage
• Condition of insulators
Solution Chemistry
• Flow rate
• Sample pKa
• Solution pH
• Solution conductivity
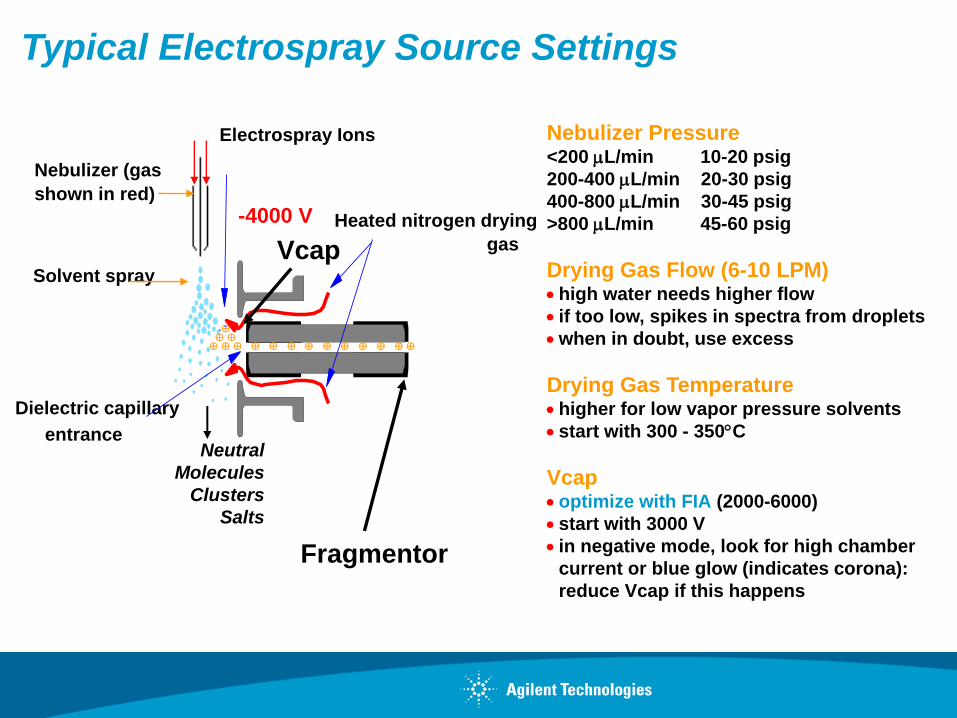
Typical Electrospray Source Settings
+ +
Heated nitrogen drying
gas
Dielectric capillary
entrance
Nebulizer (gas
shown in red)
Solvent spray
Electrospray Ions
-4000 V
Neutral
Molecules
Clusters
Salts
Nebulizer Pressure <200 L/min 10-20 psig
200-400 L/min 20-30 psig
400-800 L/min 30-45 psig
>800 L/min 45-60 psig
Drying Gas Flow (6-10 LPM) high water needs higher flow
if too low, spikes in spectra from droplets
when in doubt, use excess
Drying Gas Temperature higher for low vapor pressure solvents
start with 300 - 350C
Vcap optimize with FIA (2000-6000)
start with 3000 V
in negative mode, look for high chamber
current or blue glow (indicates corona):
reduce Vcap if this happens
Vcap
Fragmentor
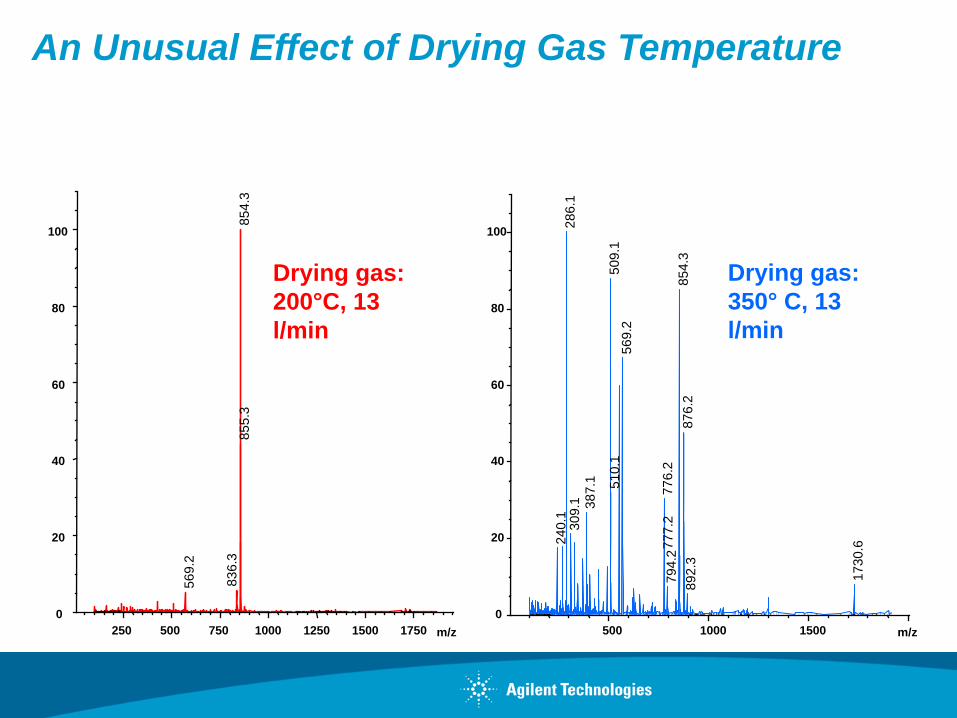
An Unusual Effect of Drying Gas Temperature
-Paclitaxel (Taxol®) by ESI-LC/MS
m/z 250 500 750 1000 1250 1500 1750
0
20
40
60
80
100 8
54.3
8
55.3
8
36.3
56
9.2
Drying gas:
200°C, 13
l/min
m/z 500 1000 1500
0
20
40
60
80
100 28
6.1
50
9.1
85
4.3
56
9.2
87
6.2
51
0.1
77
6.2
38
7.1
3
09.1
2
40.1
77
7.2
17
30.6
79
4.2
89
2.3
Drying gas:
350° C, 13
l/min
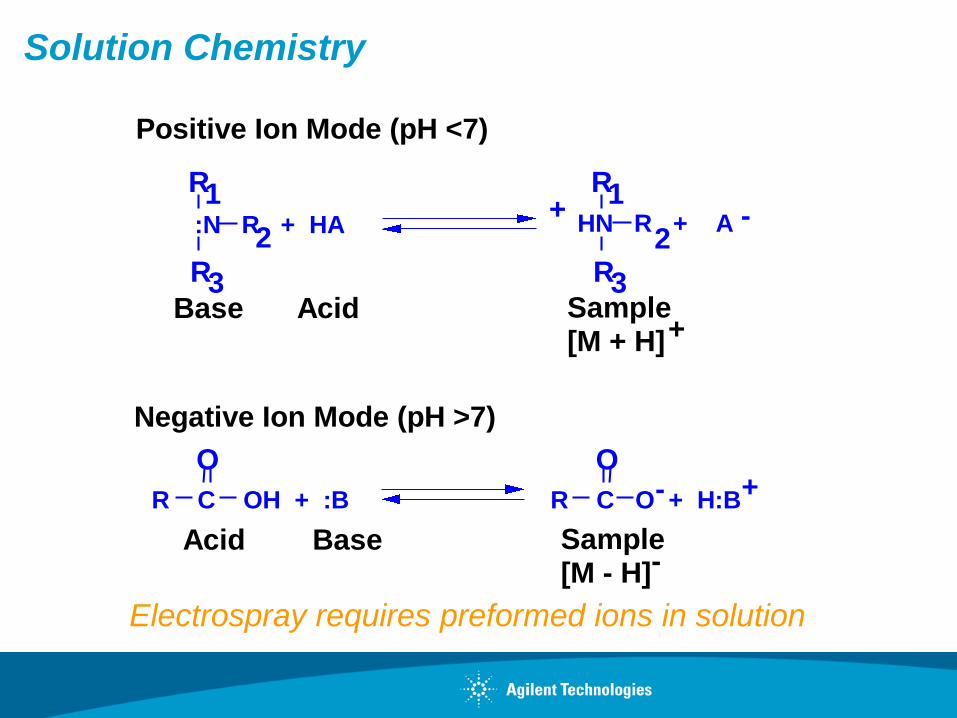
Electrospray requires preformed ions in solution
Positive Ion Mode (pH <7)
Negative Ion Mode (pH >7)
R C OH + :B
O
R C O + H:B
O+-
BaseAcid Sample[M - H]
+HN R + A
2R3
R1-
Sample[M + H]
Base Acid
:N R + HA2
R3
R1
-
+
Solution Chemistry
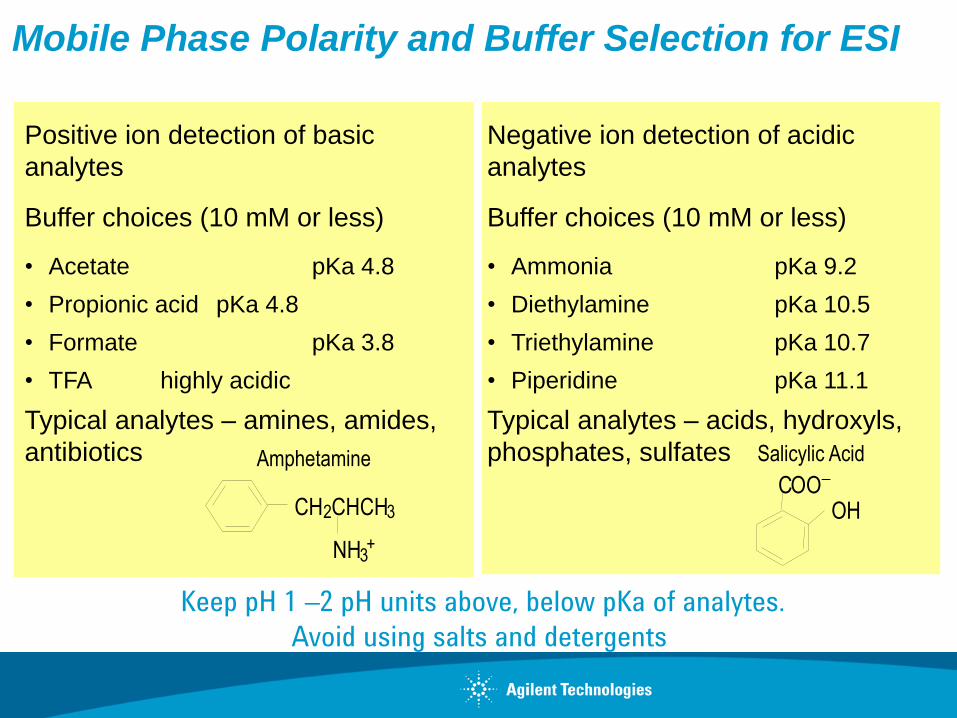
Mobile Phase Polarity and Buffer Selection for ESI
Positive ion detection of basic
analytes
Buffer choices (10 mM or less)
• Acetate pKa 4.8
• Propionic acid pKa 4.8
• Formate pKa 3.8
• TFA highly acidic
Typical analytes – amines, amides,
antibiotics
Negative ion detection of acidic
analytes
Buffer choices (10 mM or less)
• Ammonia pKa 9.2
• Diethylamine pKa 10.5
• Triethylamine pKa 10.7
• Piperidine pKa 11.1
Typical analytes – acids, hydroxyls,
phosphates, sulfates
Keep pH 1 –2 pH units above, below pKa of analytes.
Avoid using salts and detergents
C O O _
OH
Salicylic Acid Amphetamine
CH 2 CHCH 3
NH 3 +
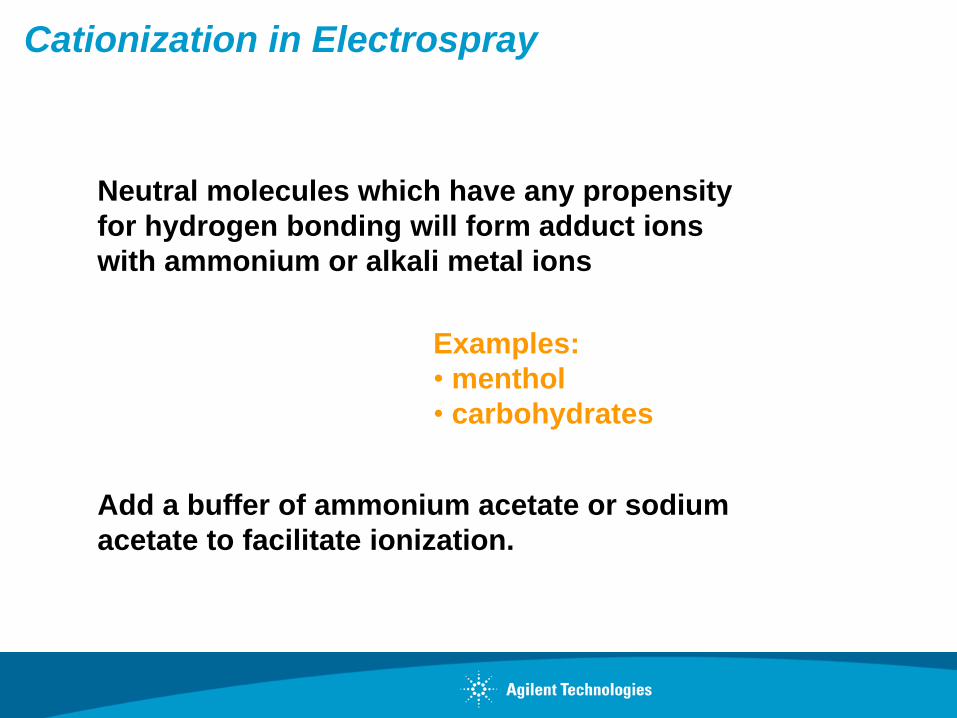
Cationization in Electrospray
Neutral molecules which have any propensity
for hydrogen bonding will form adduct ions
with ammonium or alkali metal ions
Examples:
• menthol
• carbohydrates
Add a buffer of ammonium acetate or sodium
acetate to facilitate ionization.

Key Chromatographic Points in Use of Electrospray
• Mobile phase can provide charged analytes
– Mobile phase pH is critical
– Know the pKa values of sample components
– Analyze acids, bases – anything with a charge
• Operates over a wide flow rate range – 1 L/min up to 1 mL/min (with Agilent LC/MS)
• Accommodates columns from nano/capillary (proteins and peptides) up to analytical 4.6 mm id with smaller id’s usually preferred for best sensitivity
• Compatible with reversed-phase solvents
• Reversed phase column selection for some charged analytes may be difficult due to limited retention
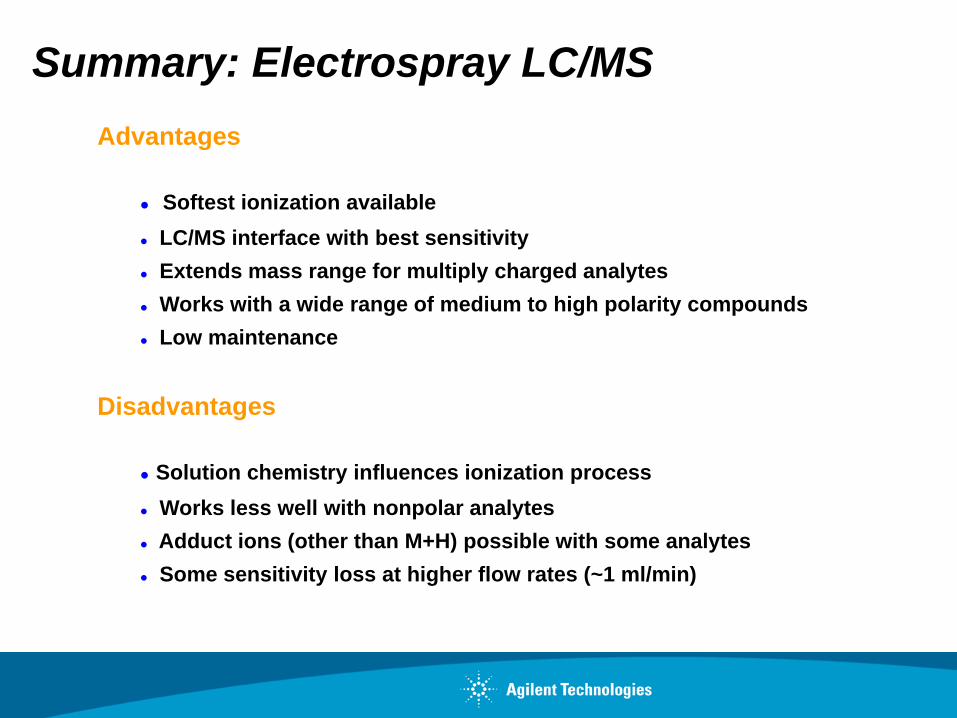
Advantages
Softest ionization available
LC/MS interface with best sensitivity
Extends mass range for multiply charged analytes
Works with a wide range of medium to high polarity compounds
Low maintenance
Disadvantages
Solution chemistry influences ionization process
Works less well with nonpolar analytes
Adduct ions (other than M+H) possible with some analytes
Some sensitivity loss at higher flow rates (~1 ml/min)
Summary: Electrospray LC/MS
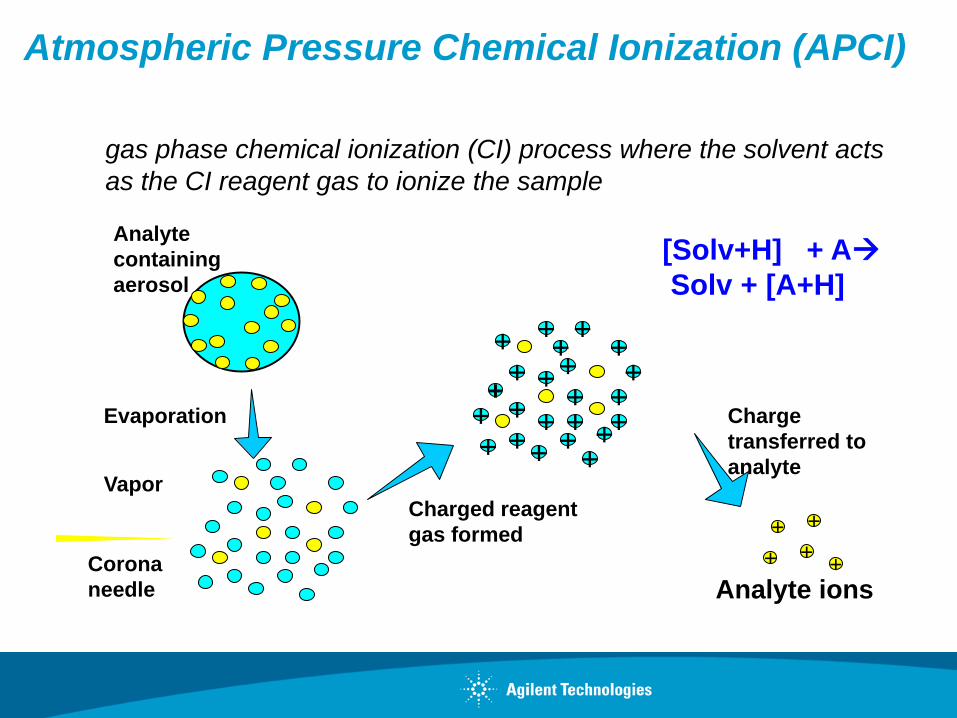
Atmospheric Pressure Chemical Ionization (APCI)
- Theory
Vapor Charged reagent
gas formed
Evaporation
+
Analyte
containing
aerosol
Analyte ions
+
+ +
+
+
+ + + +
+ +
+
+ +
+ +
+ +
+
+ + +
+
Charge
transferred to
analyte
+ + +
+
gas phase chemical ionization (CI) process where the solvent acts
as the CI reagent gas to ionize the sample
[Solv+H] + A
Solv + [A+H]
Corona
needle
Heater
Waste
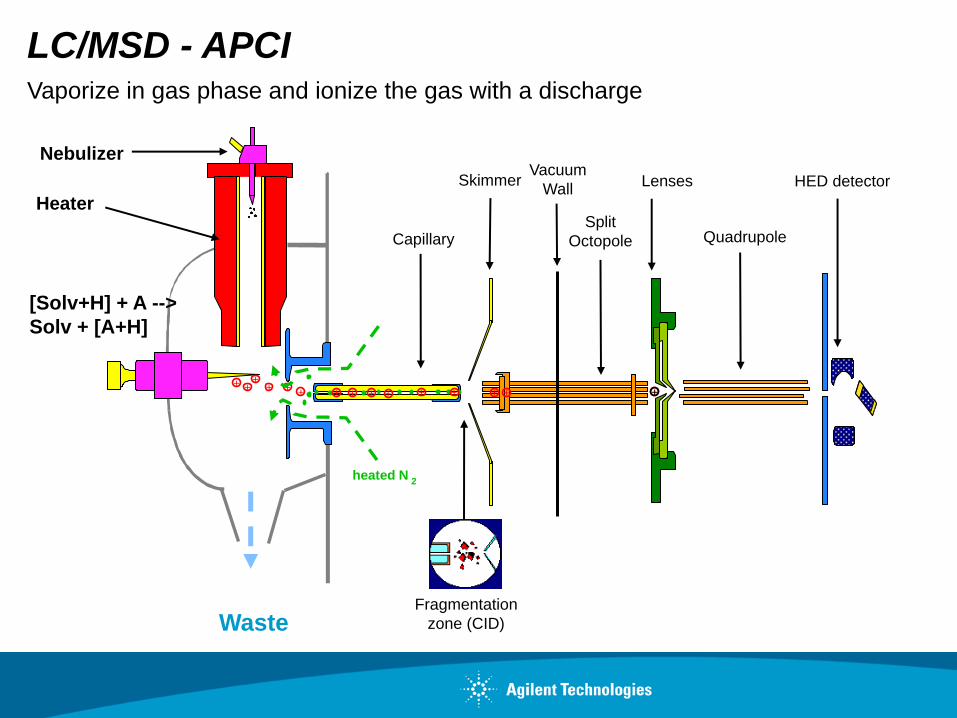
Capillary
LC/MSD - APCI Vaporize in gas phase and ionize the gas with a discharge
Fragmentation
zone (CID)
[Solv+H] + A -->
Solv + [A+H]
Corona
needle
+ + + + + + + +
+ + + +
heated N 2
Nebulizer
Skimmer
Split
Octopole Quadrupole
HED detector
+ + + +
Lenses Vacuum
Wall
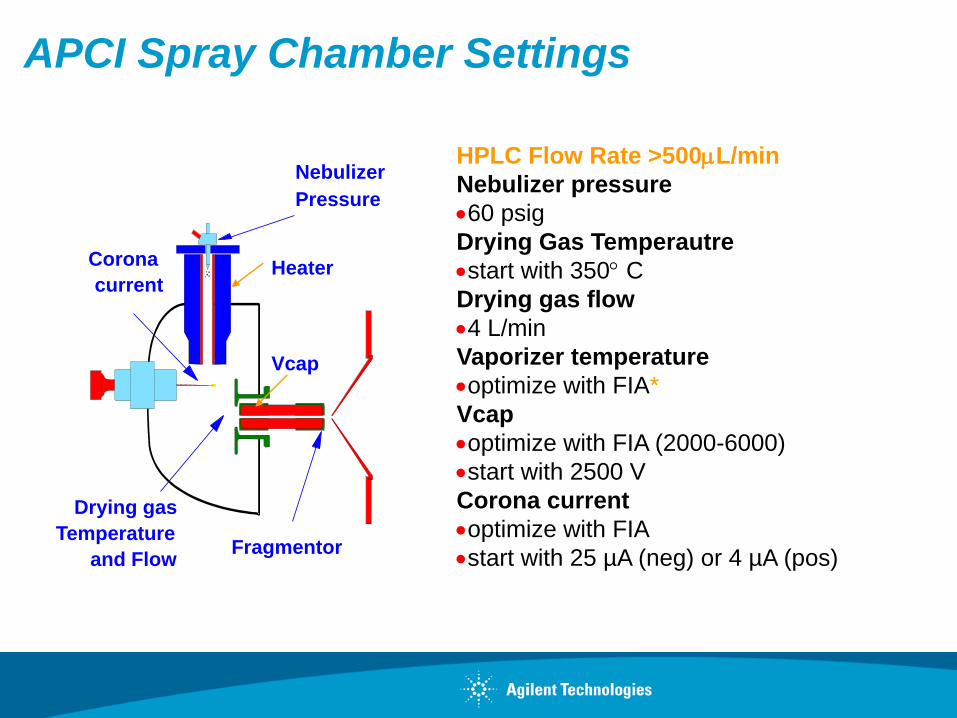
HPLC Flow Rate >500L/min
Nebulizer pressure
60 psig
Drying Gas Temperautre
start with 350 C
Drying gas flow
4 L/min
Vaporizer temperature
optimize with FIA*
Vcap
optimize with FIA (2000-6000)
start with 2500 V
Corona current
optimize with FIA
start with 25 µA (neg) or 4 µA (pos)
Vcap
Corona
current
Nebulizer
Pressure
Fragmentor
Drying gas
Temperature
and Flow
Heater
APCI Spray Chamber Settings
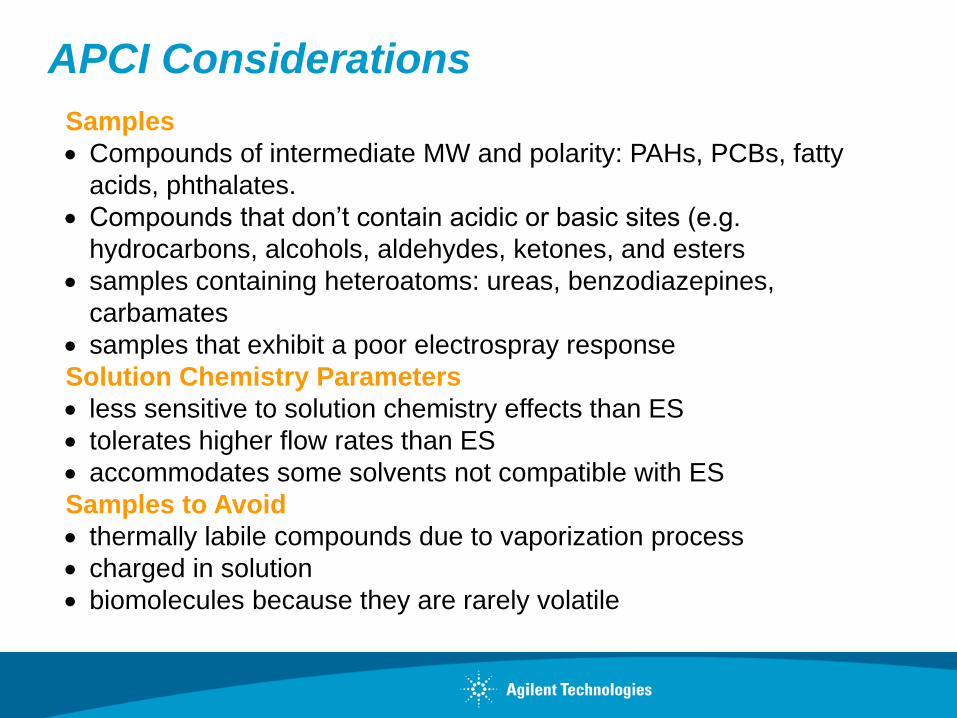
Samples
Compounds of intermediate MW and polarity: PAHs, PCBs, fatty
acids, phthalates.
Compounds that don’t contain acidic or basic sites (e.g.
hydrocarbons, alcohols, aldehydes, ketones, and esters
samples containing heteroatoms: ureas, benzodiazepines,
carbamates
samples that exhibit a poor electrospray response
Solution Chemistry Parameters
less sensitive to solution chemistry effects than ES
tolerates higher flow rates than ES
accommodates some solvents not compatible with ES
Samples to Avoid
thermally labile compounds due to vaporization process
charged in solution
biomolecules because they are rarely volatile
APCI Considerations
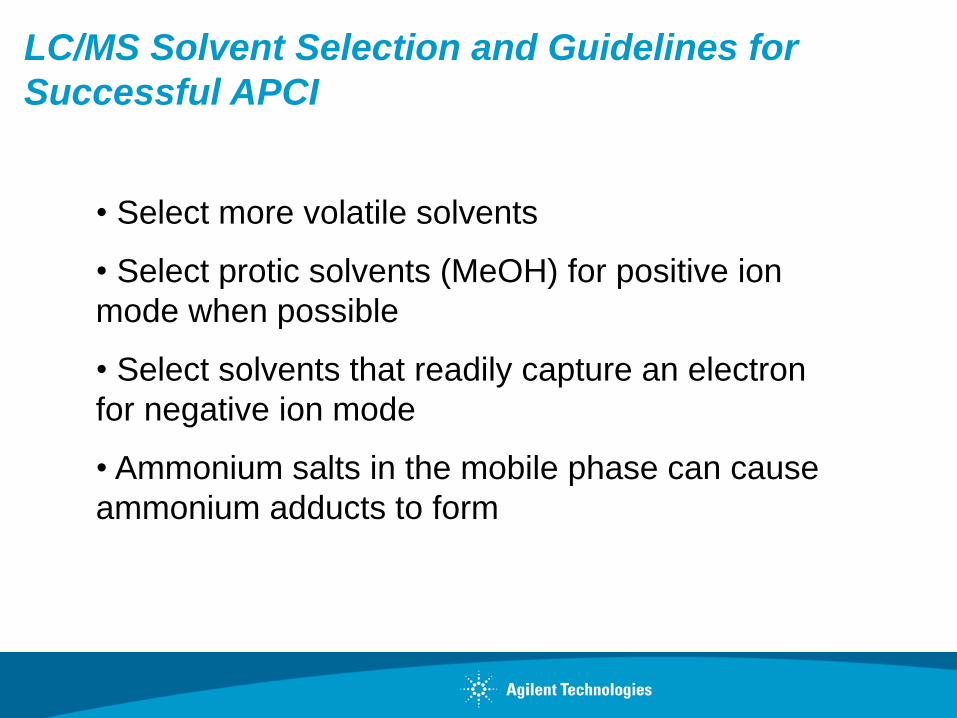
LC/MS Solvent Selection and Guidelines for
Successful APCI
• Select more volatile solvents
• Select protic solvents (MeOH) for positive ion
mode when possible
• Select solvents that readily capture an electron
for negative ion mode
• Ammonium salts in the mobile phase can cause
ammonium adducts to form
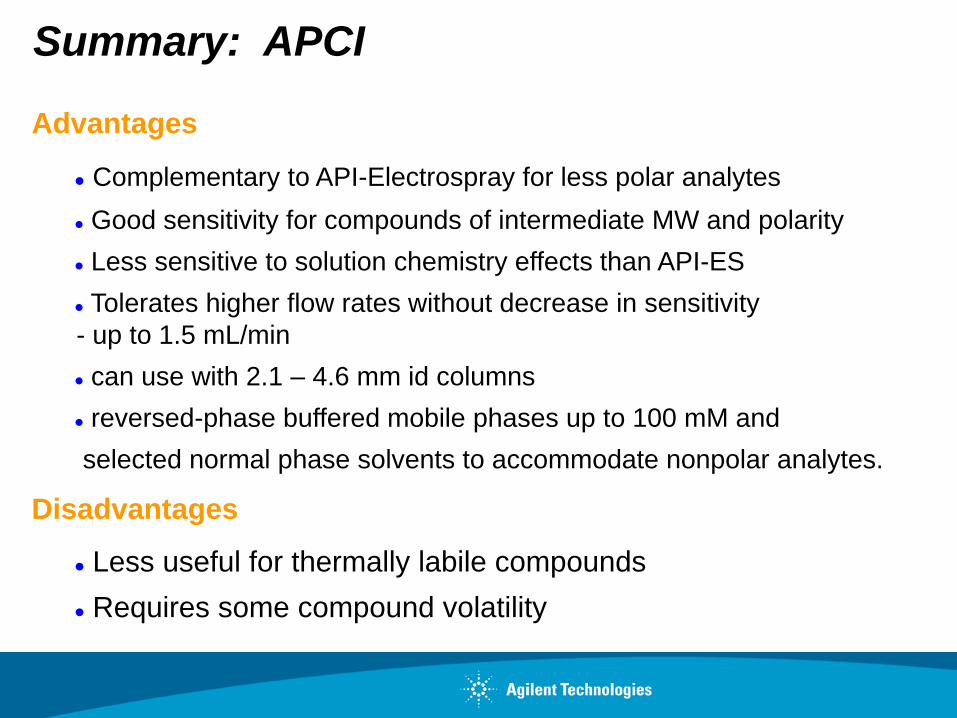
Advantages
Complementary to API-Electrospray for less polar analytes
Good sensitivity for compounds of intermediate MW and polarity
Less sensitive to solution chemistry effects than API-ES
Tolerates higher flow rates without decrease in sensitivity
- up to 1.5 mL/min
can use with 2.1 – 4.6 mm id columns
reversed-phase buffered mobile phases up to 100 mM and
selected normal phase solvents to accommodate nonpolar analytes.
Disadvantages
Less useful for thermally labile compounds
Requires some compound volatility
Summary: APCI
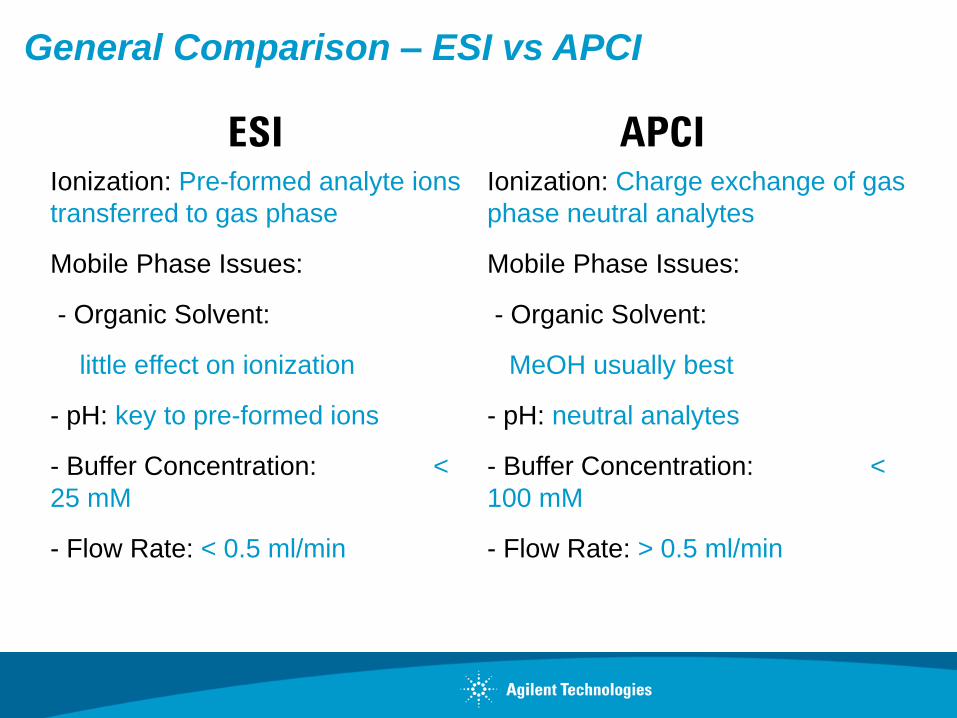
General Comparison – ESI vs APCI
Ionization: Pre-formed analyte ions
transferred to gas phase
Mobile Phase Issues:
- Organic Solvent:
little effect on ionization
- pH: key to pre-formed ions
- Buffer Concentration: <
25 mM
- Flow Rate: < 0.5 ml/min
Ionization: Charge exchange of gas
phase neutral analytes
Mobile Phase Issues:
- Organic Solvent:
MeOH usually best
- pH: neutral analytes
- Buffer Concentration: <
100 mM
- Flow Rate: > 0.5 ml/min
ESI APCI
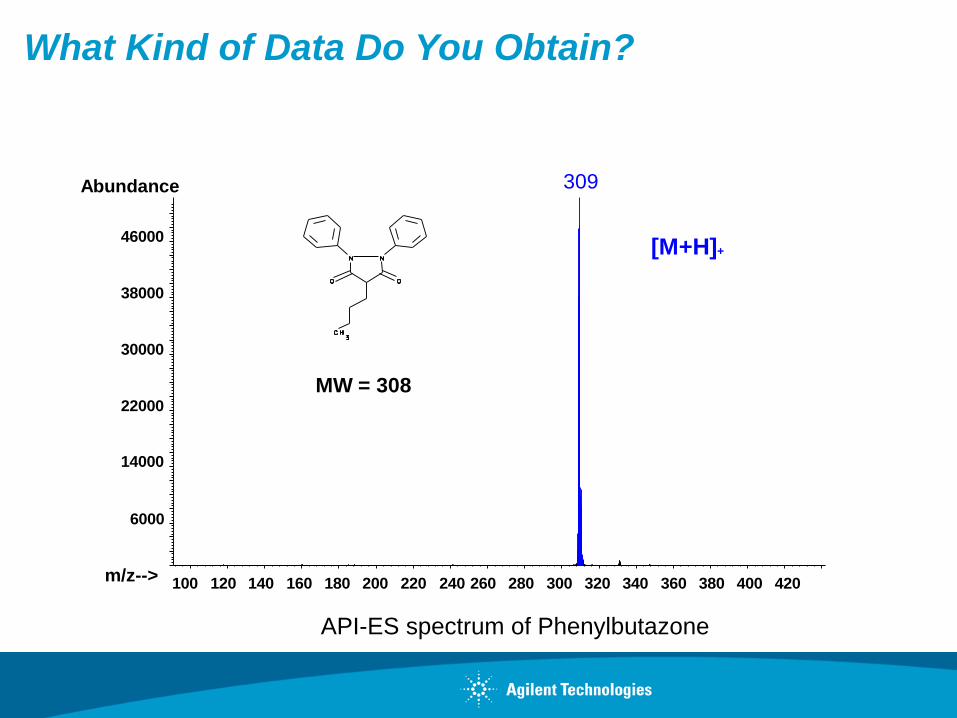
MW = 308
100 120 140 160 180 200 220 240 260 280 300 320 340 360 380 400 420
6000
14000
22000
30000
38000
46000
m/z-->
Abundance 309
[M+H]+
API-ES spectrum of Phenylbutazone
What Kind of Data Do You Obtain?
-Singly Charged Ions in ESI or APCI

650 700 750 800 850 900 950 1000 1050 1100 1150 1200 1250
Abundance
5000
10000
15000
20000
25000
30000
35000
40000
m/z-->
A+25
679.45
A+24
707.65
A+23
738.45
A+22
771.90
A+21
808.60 A+20
848.95A+19
893.55A+18
943.15A+17
998.55A+16
1060.85A+15
1131.50 A+14
1212.30
Abundance
16400 16600 16800 17000 17200 17400 17600m/z-->
40000
80000
120000
160000
200000
240000
280000A
16959.09Assume adduct is a proton:
M1=(A+n)/n
M2=(A+n+1)/(n+1)
Solve for A
API-ES spectrum of Myoglobin
What Kind of Data Do You Obtain?
-Multiply-Charged Ions in Electrospray Mode
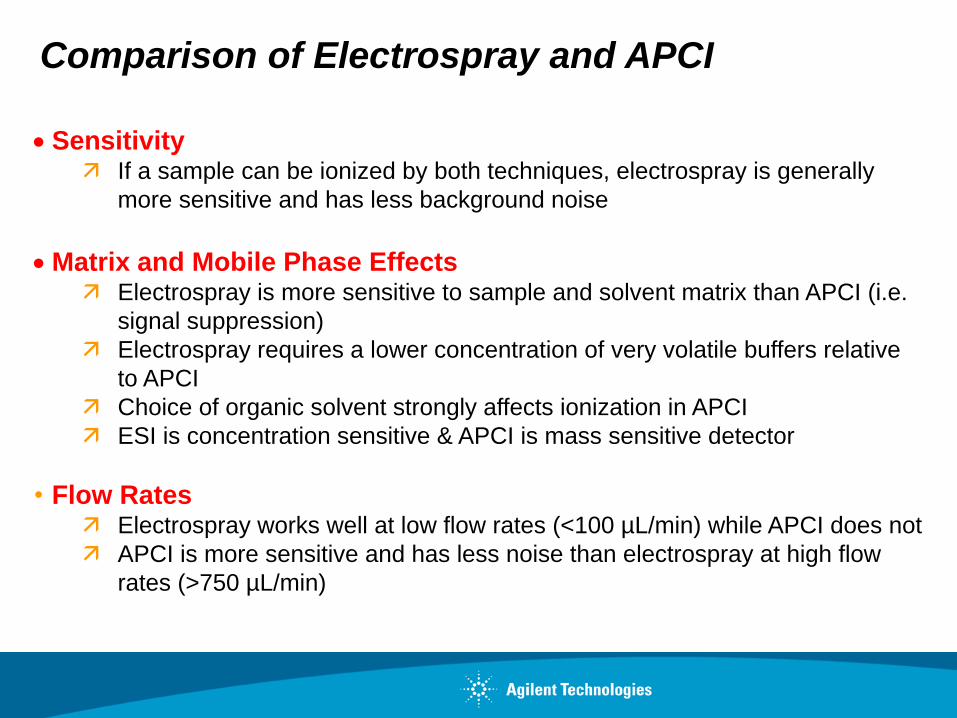
Sensitivity If a sample can be ionized by both techniques, electrospray is generally
more sensitive and has less background noise
Matrix and Mobile Phase Effects Electrospray is more sensitive to sample and solvent matrix than APCI (i.e.
signal suppression)
Electrospray requires a lower concentration of very volatile buffers relative
to APCI
Choice of organic solvent strongly affects ionization in APCI
ESI is concentration sensitive & APCI is mass sensitive detector
• Flow Rates Electrospray works well at low flow rates (<100 µL/min) while APCI does not
APCI is more sensitive and has less noise than electrospray at high flow
rates (>750 µL/min)
Comparison of Electrospray and APCI
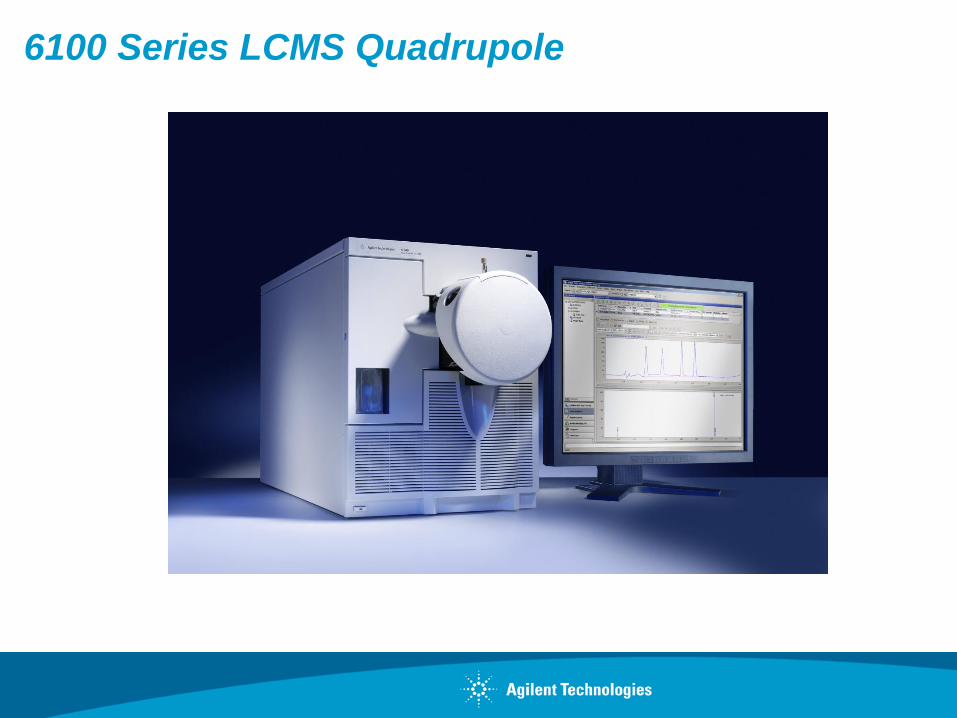
6100 Series LCMS Quadrupole
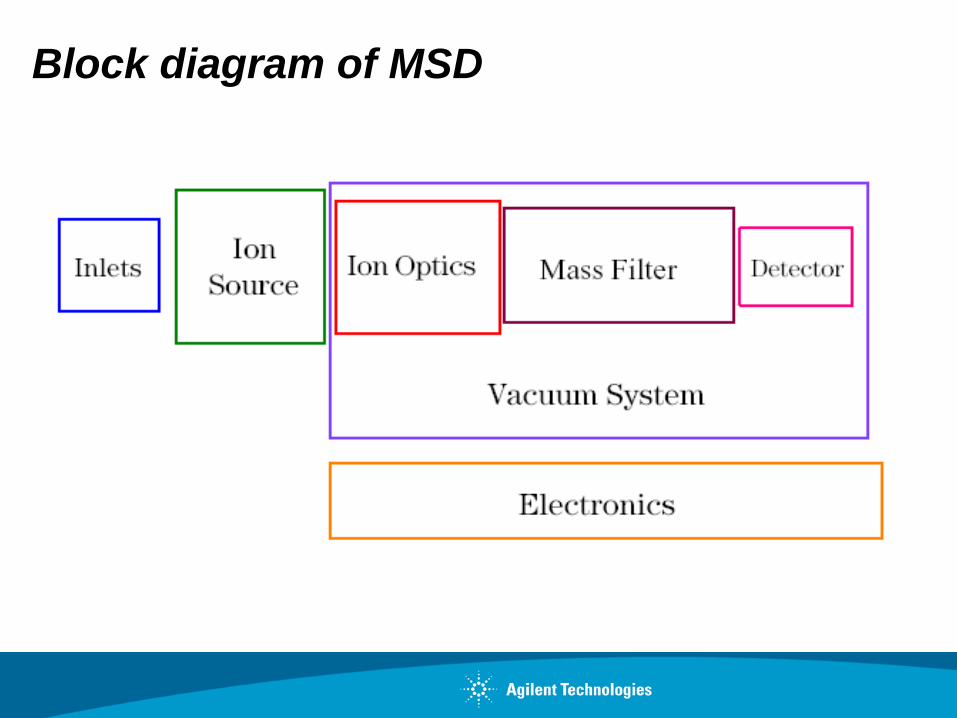
Block diagram of MSD
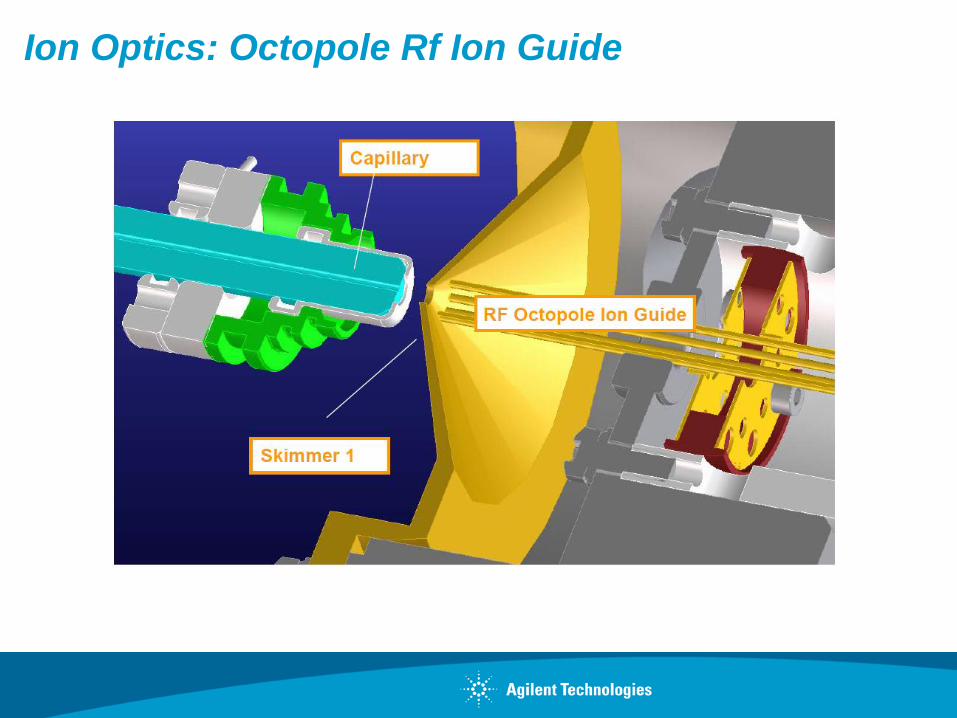
Ion Optics: Octopole Rf Ion Guide
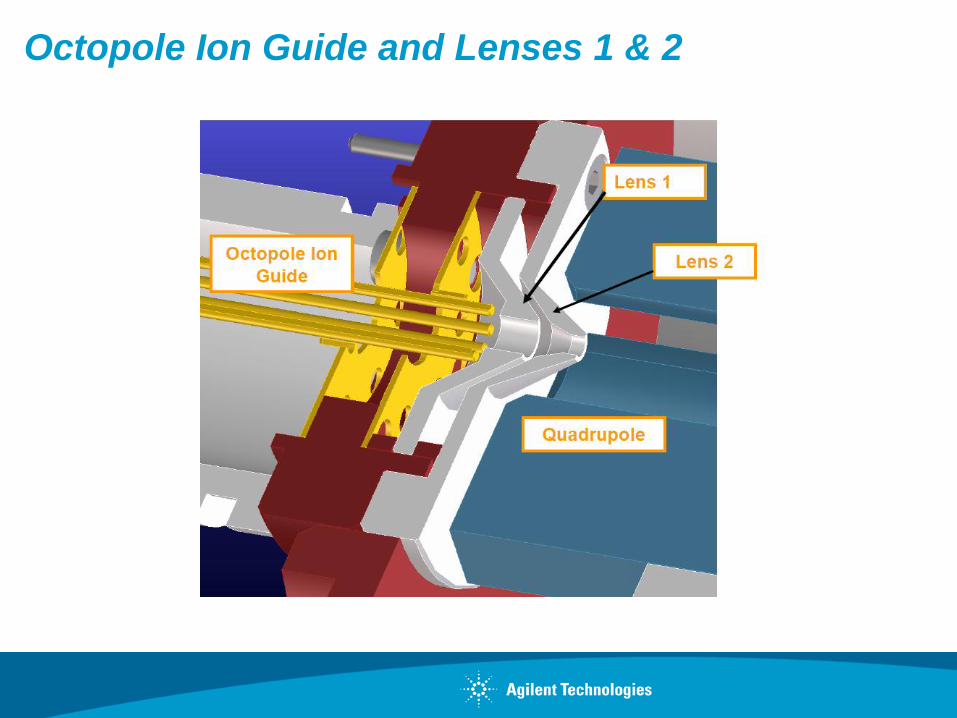
Octopole Ion Guide and Lenses 1 & 2
Mass Analyzer Terminology
m/z - mass-to-charge ratio
• mass of an ion (Daltons or u) divided by the number of charges on the ion
SIM - selected ion monitoring
• selecting a particular ion or ions to monitor which improves sensitivity
Scan -
• monitoring a range of m/z ions
TIC - total ion chromatogram
• the total signal (current) generated by all ions monitored
EIC - extracted ion chromatogram
• the signal over a limited m/z range (traditionally, 1 m/z with a -0.3/ +0.7 window)
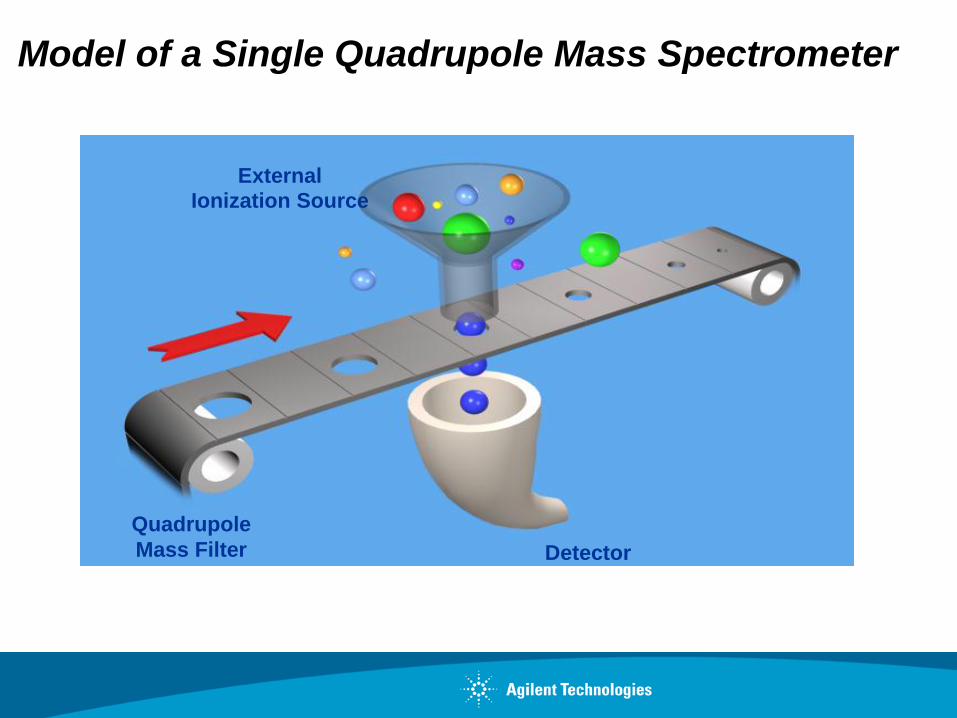
Quadrupole
Mass Filter
External Ionization Source
Detector
Model of a Single Quadrupole Mass Spectrometer
Quadrupole Mass Analyzer Operation
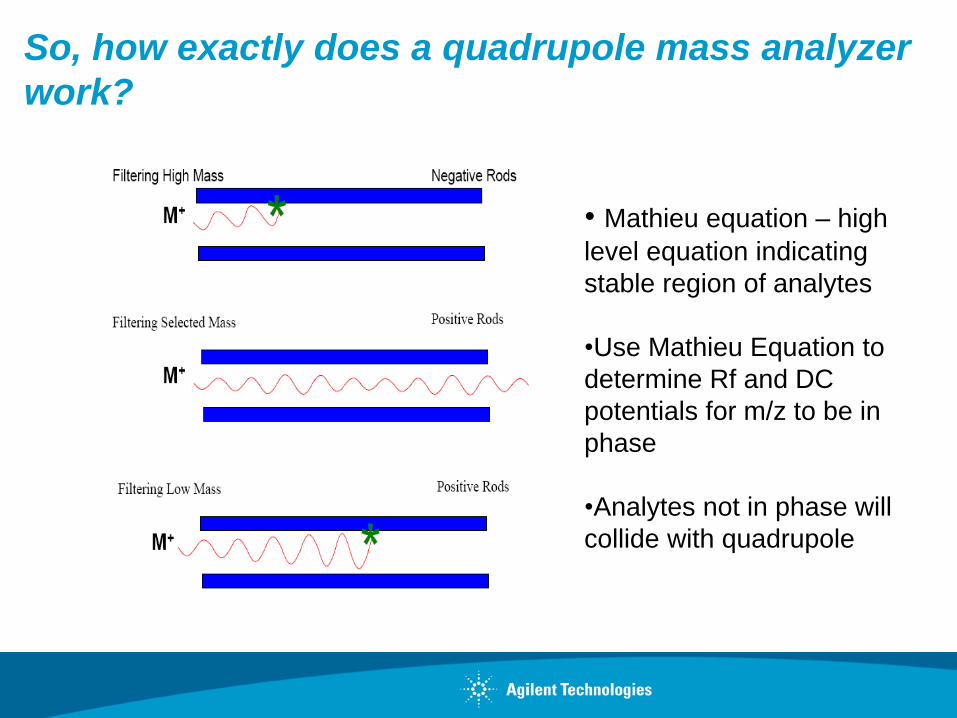
So, how exactly does a quadrupole mass analyzer
work?
• Mathieu equation – high
level equation indicating
stable region of analytes
•Use Mathieu Equation to
determine Rf and DC
potentials for m/z to be in
phase
•Analytes not in phase will
collide with quadrupole
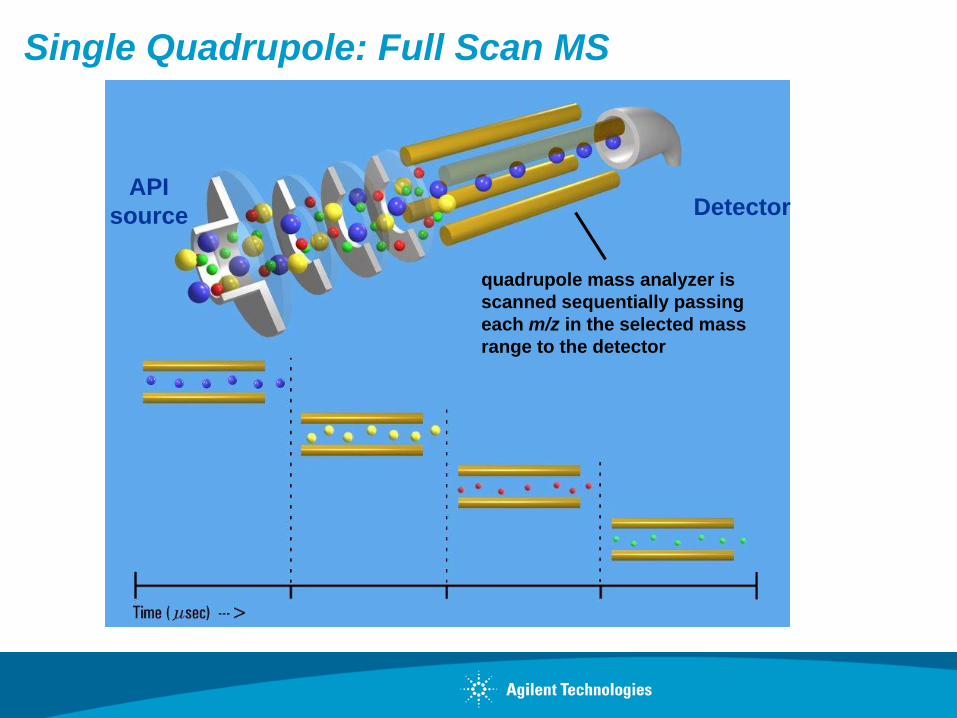
API
source Detector
quadrupole mass analyzer is
scanned sequentially passing
each m/z in the selected mass
range to the detector
Single Quadrupole: Full Scan MS
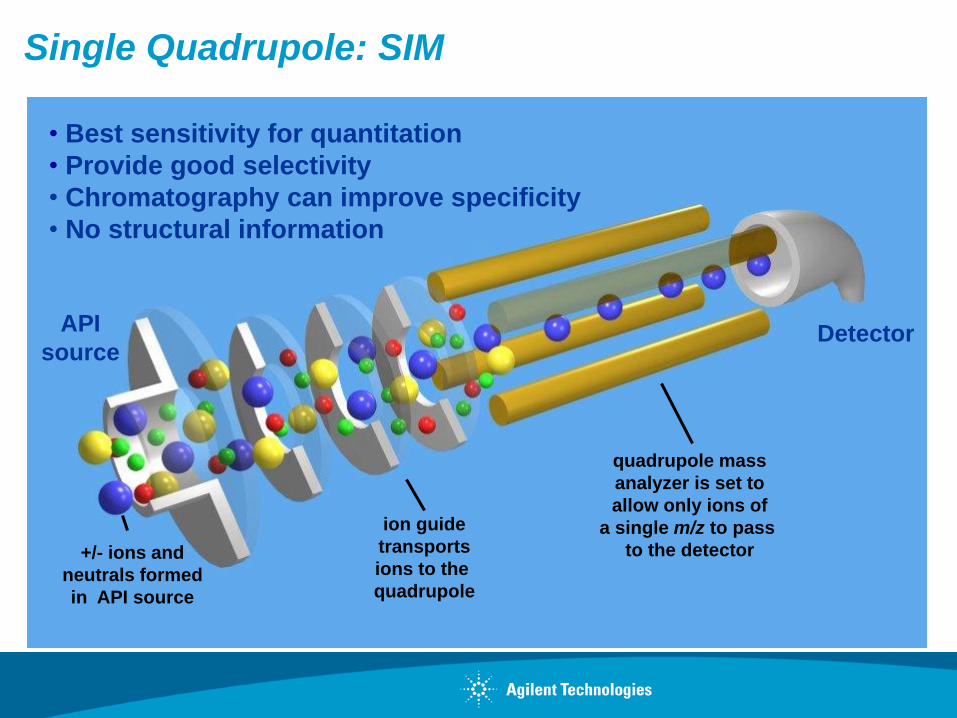
• Best sensitivity for quantitation
• Provide good selectivity
• Chromatography can improve specificity
• No structural information
API
source Detector
ion guide
transports
ions to the
quadrupole
quadrupole mass
analyzer is set to
allow only ions of
a single m/z to pass
to the detector +/- ions and
neutrals formed
in API source
Single Quadrupole: SIM
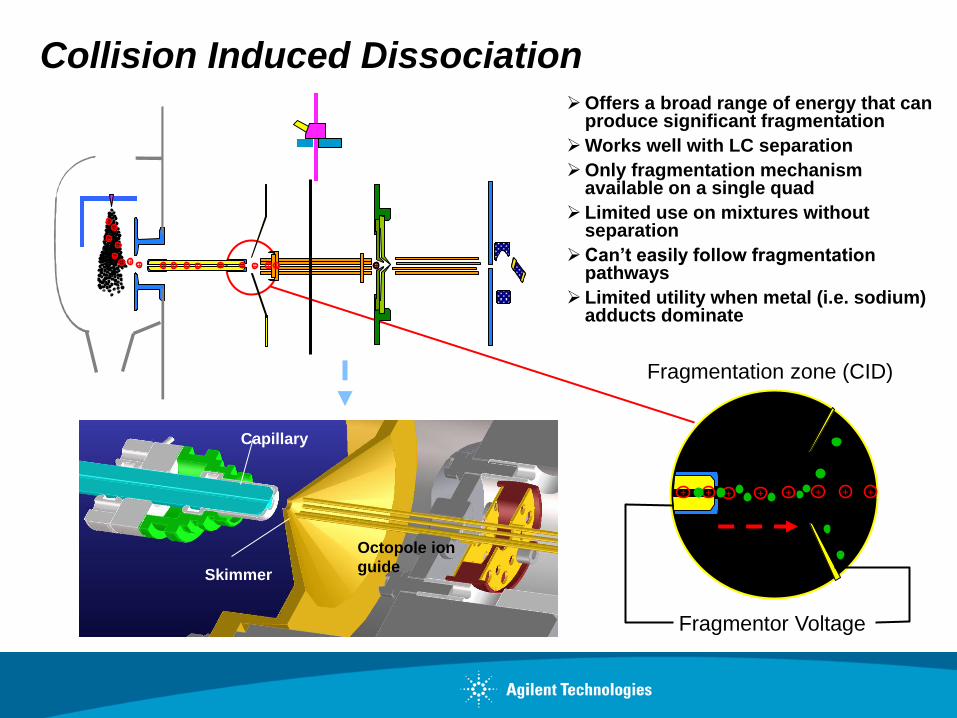
Collision Induced Dissociation
Fragmentation zone (CID)
+ + + + + + + +
Fragmentor Voltage
Offers a broad range of energy that can produce significant fragmentation
Works well with LC separation
Only fragmentation mechanism available on a single quad
Limited use on mixtures without separation
Can’t easily follow fragmentation pathways
Limited utility when metal (i.e. sodium) adducts dominate
Was
te
+ +
+
+ +
+ + + + + + + + + + + + + +
Capillary
Skimmer
Octopole ion
guide
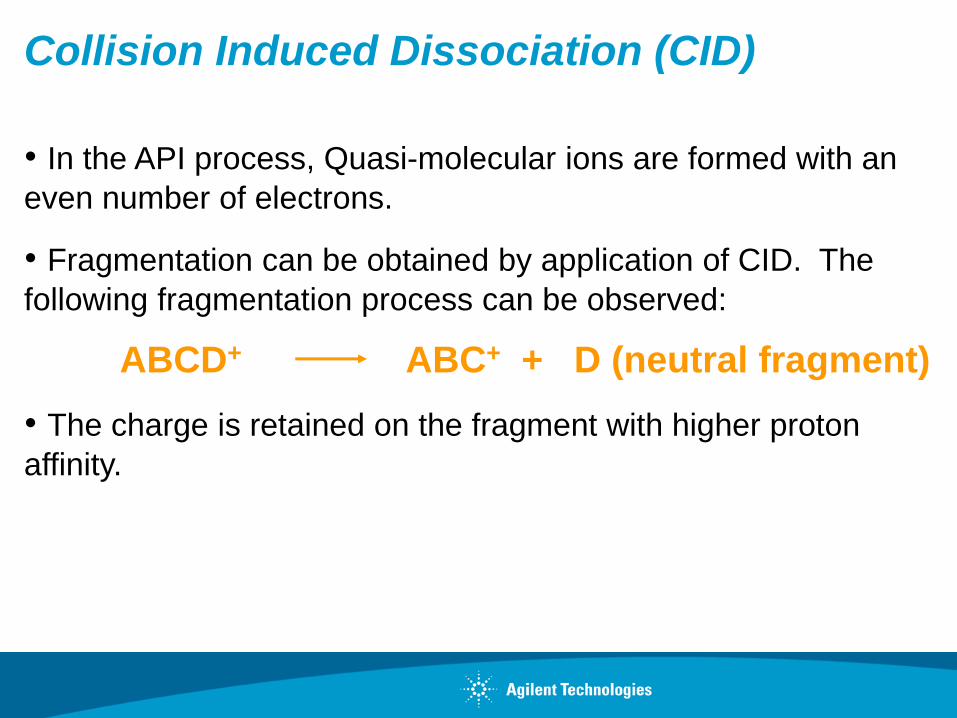
Collision Induced Dissociation (CID)
• In the API process, Quasi-molecular ions are formed with an
even number of electrons.
• Fragmentation can be obtained by application of CID. The
following fragmentation process can be observed:
ABCD+ ABC+ + D (neutral fragment)
• The charge is retained on the fragment with higher proton
affinity.
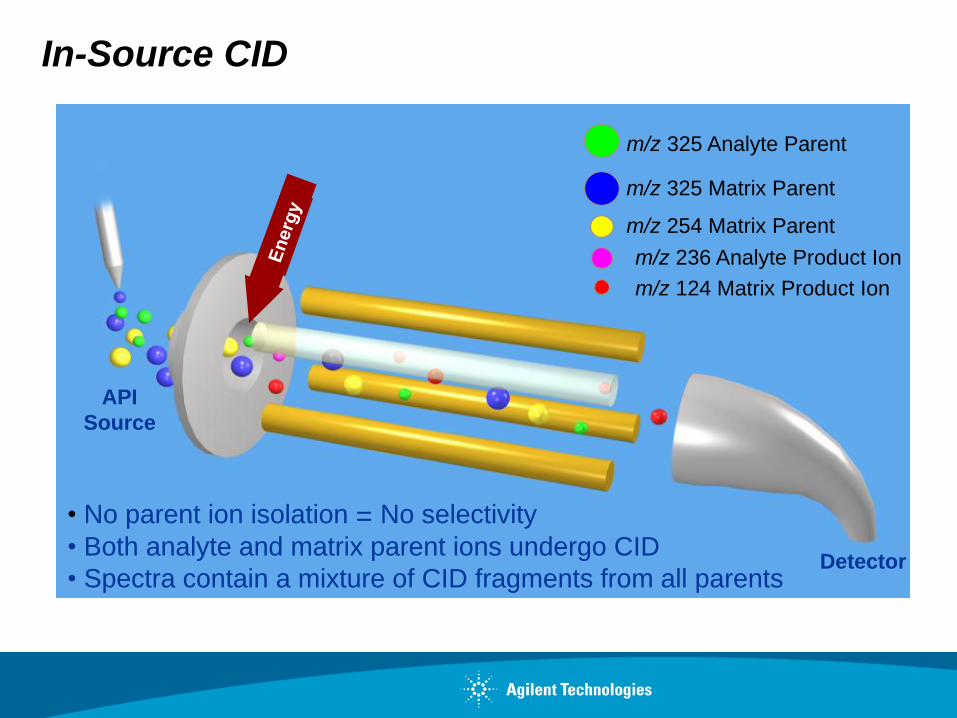
In-Source CID
m/z 325 Analyte Parent
m/z 124 Matrix Product Ion
m/z 325 Matrix Parent
m/z 254 Matrix Parent
m/z 236 Analyte Product Ion
API
Source
Detector
• No parent ion isolation = No selectivity
• Both analyte and matrix parent ions undergo CID
• Spectra contain a mixture of CID fragments from all parents
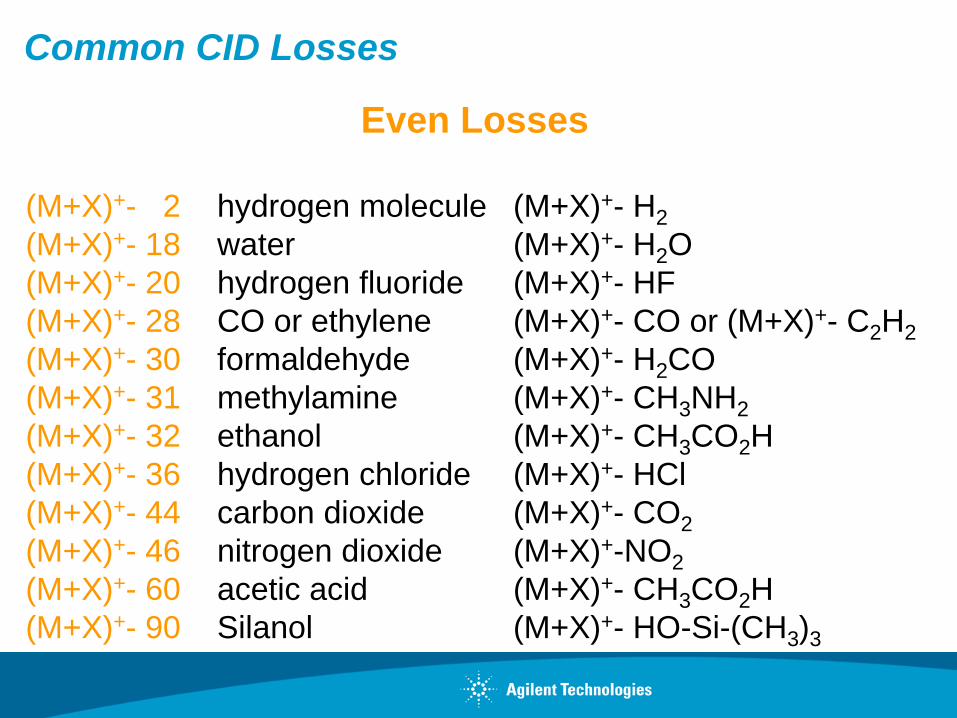
Common CID Losses
Even Losses
(M+X)+- 2 hydrogen molecule (M+X)+- H2
(M+X)+- 18 water (M+X)+- H2O
(M+X)+- 20 hydrogen fluoride (M+X)+- HF
(M+X)+- 28 CO or ethylene (M+X)+- CO or (M+X)+- C2H2
(M+X)+- 30 formaldehyde (M+X)+- H2CO
(M+X)+- 31 methylamine (M+X)+- CH3NH2
(M+X)+- 32 ethanol (M+X)+- CH3CO2H
(M+X)+- 36 hydrogen chloride (M+X)+- HCl
(M+X)+- 44 carbon dioxide (M+X)+- CO2
(M+X)+- 46 nitrogen dioxide (M+X)+-NO2
(M+X)+- 60 acetic acid (M+X)+- CH3CO2H
(M+X)+- 90 Silanol (M+X)+- HO-Si-(CH3)3
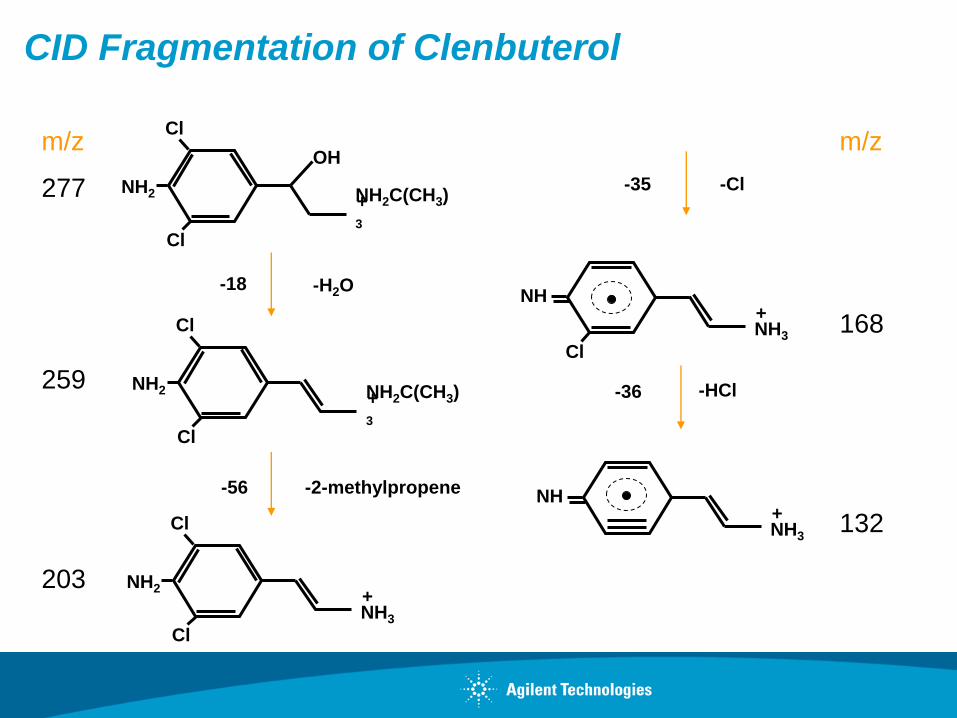
CID Fragmentation of Clenbuterol
NH2C(CH3)
3
Cl
Cl
NH2
OH
+
NH2C(CH3)
3
Cl
Cl
NH2 +
-H2O
NH3
Cl
Cl
NH2 +
-2-methylpropene
m/z
277
259
203
-18
-56
m/z
168
132
-Cl
-36
NH3
Cl
NH +
-HCl
-35
NH3
NH +
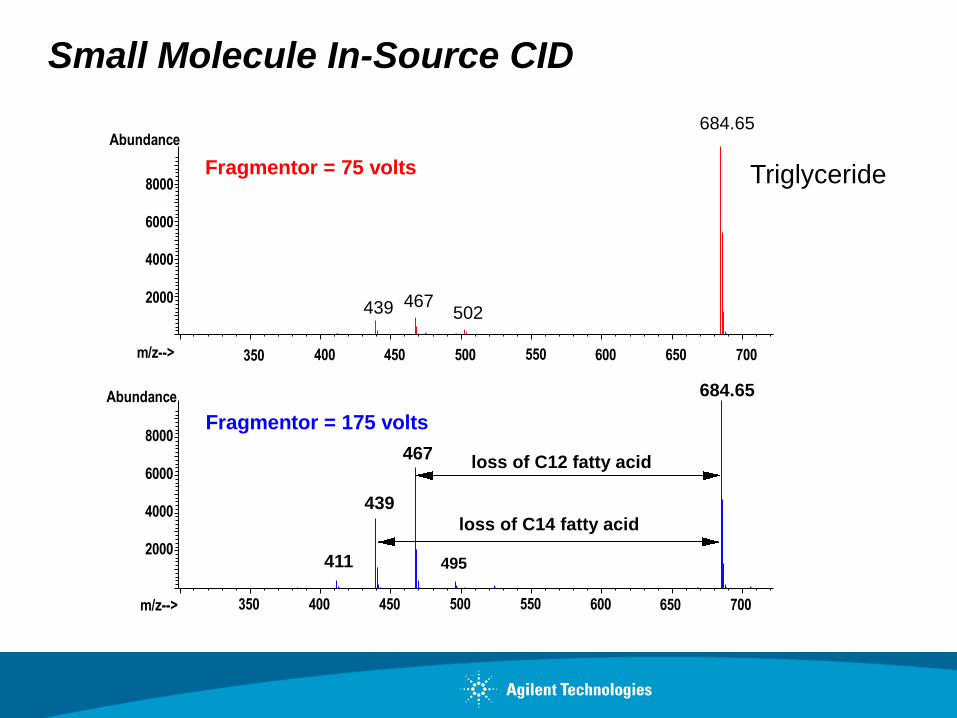
350 400 450 500 550 600 650 700
2000
4000
6000
8000
m/z-->
Abundance
439 467502
684.65
350 400 450 500 550 600 650 700
2000
4000
6000
8000
m/z-->
Abundance
411
439
467
495
684.65
Fragmentor = 175 volts
Fragmentor = 75 volts
loss of C14 fatty acid
loss of C12 fatty acid
Triglyceride
Small Molecule In-Source CID
Fragmentor Voltage
6120
•Ion abundance is fragmentor voltage setting dependent. •Dynamic ramping allows you to maximize both parent and
fragment ions in same scan.
6130 and 6150
•Ion abundance is less fragmentor voltage dependent •A typical value is 100 V.
•Dynamic ramping of the fragmentor offers little advantage.
•Fragmentation (CID) requires higher fragmentor voltages.
Therefore:
Generic methods are possible
Better survival of [M+H]+ ions for fragile compounds such
as carbamates
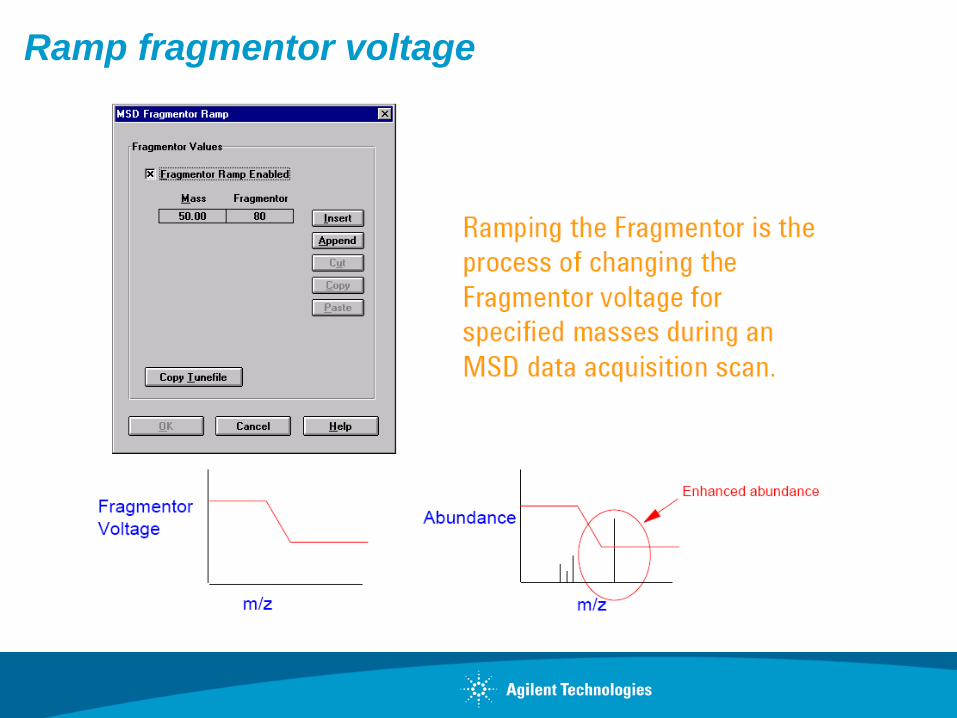
Ramp fragmentor voltage
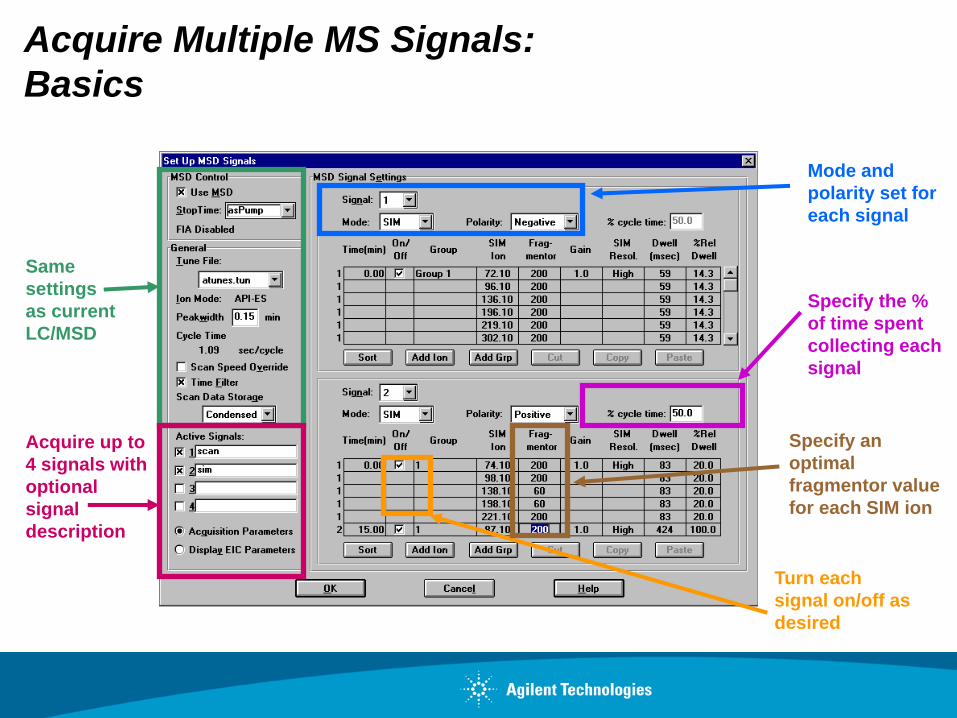
Acquire Multiple MS Signals:
Basics
Same
settings
as current
LC/MSD
Acquire up to
4 signals with
optional
signal
description
Specify the %
of time spent
collecting each
signal
Mode and
polarity set for
each signal
Turn each
signal on/off as
desired
Specify an
optimal
fragmentor value
for each SIM ion
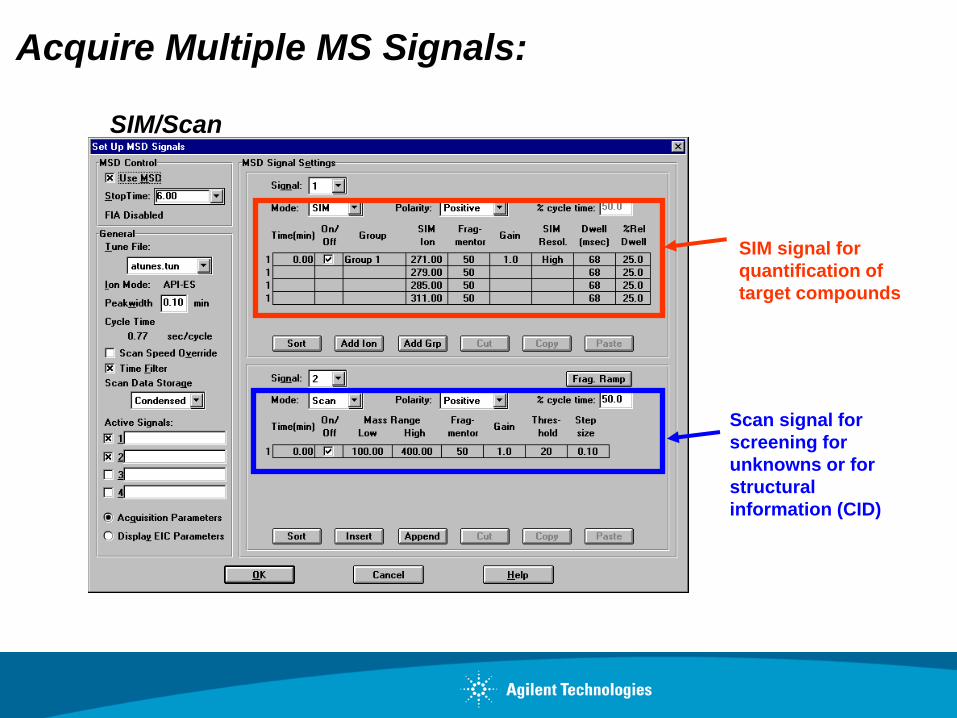
SIM signal for
quantification of
target compounds
Scan signal for
screening for
unknowns or for
structural
information (CID)
Acquire Multiple MS Signals:
SIM/Scan
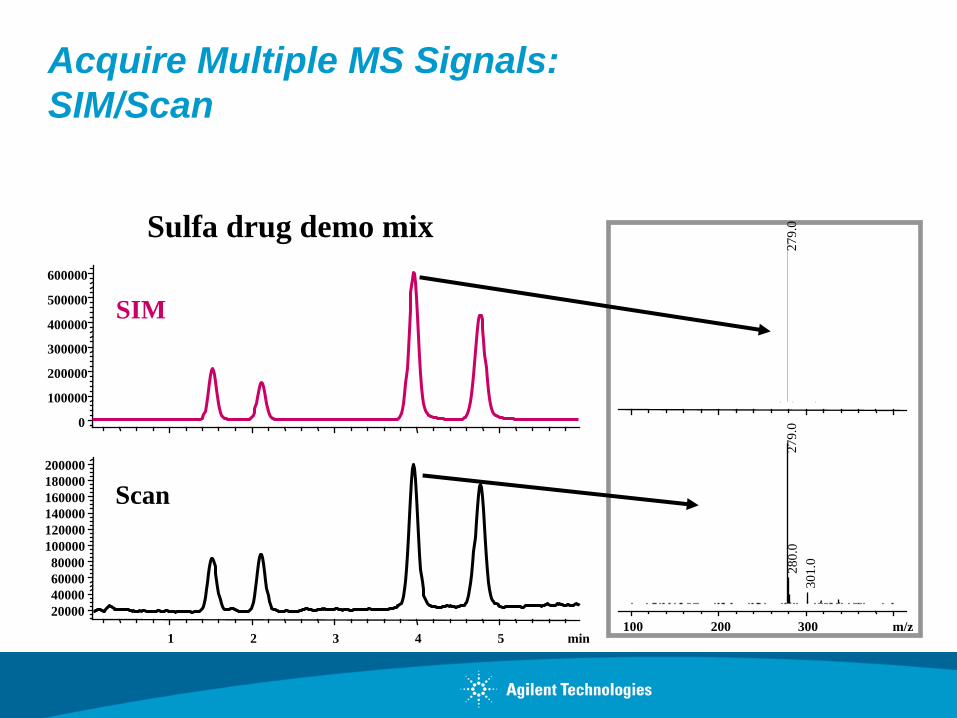
Acquire Multiple MS Signals:
SIM/Scan
Sulfa drug demo mix
Scan
SIM
0
100000
200000
300000
400000
500000
600000
min 1 2 3 4 5
20000
40000
60000
80000
100000
120000
140000
160000
180000
200000
27
9.0
m/z 100 200 300
27
9.0
2
80
.0
30
1.0
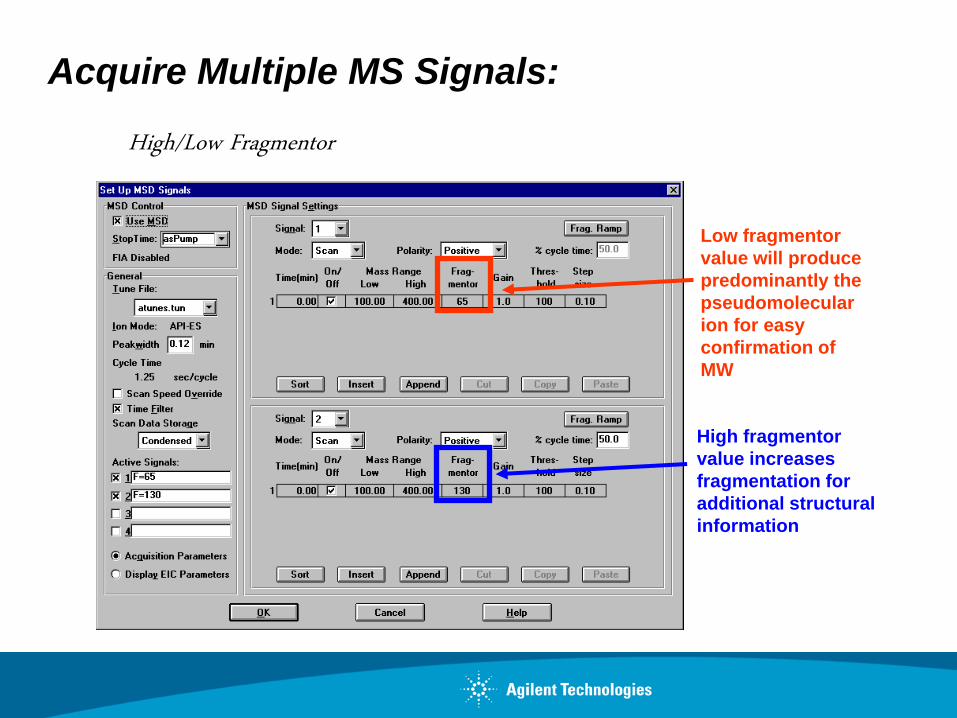
Acquire Multiple MS Signals:
Low fragmentor
value will produce
predominantly the
pseudomolecular
ion for easy
confirmation of
MW
High fragmentor
value increases
fragmentation for
additional structural
information
High/Low Fragmentor
Sulfa drug demo mix
0
200000
400000
600000
800000
min 1 2 3 4 5 6 7
0
100000
200000
300000
400000
500000
600000
700000
800000
High fragmentor: 130 V
Low fragmentor: 65 V
m/z 100 200 300
31
1.1
3
12.1
15
6.1
31
1.1
10
8.1
24
5.1
21
8.1
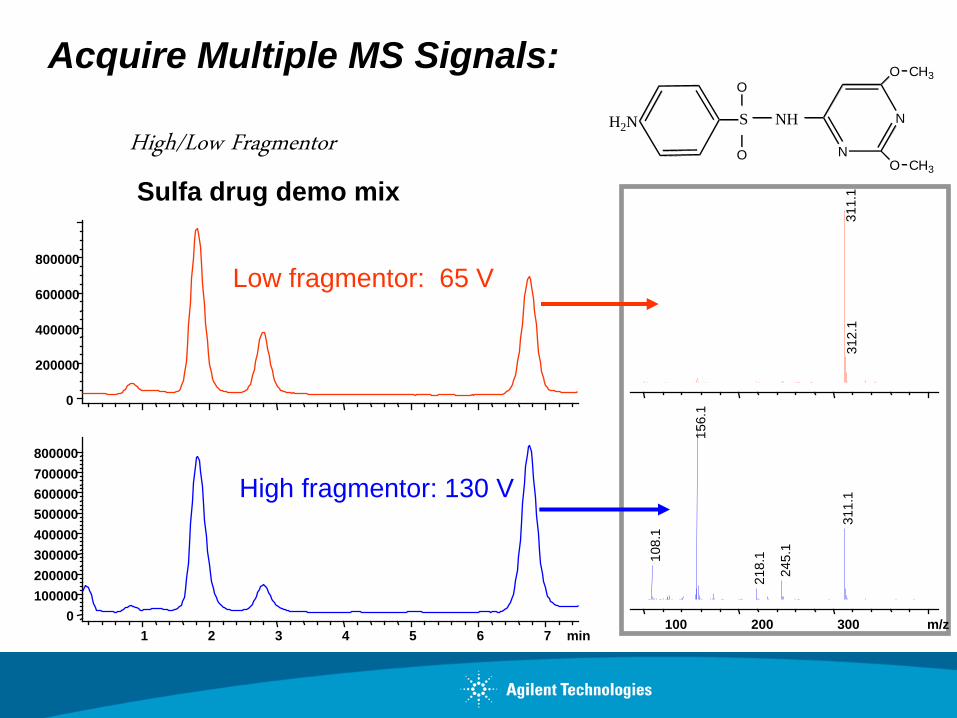
Acquire Multiple MS Signals:
High/Low Fragmentor H2N S NH
O
O N
N
O
O CH3
CH3
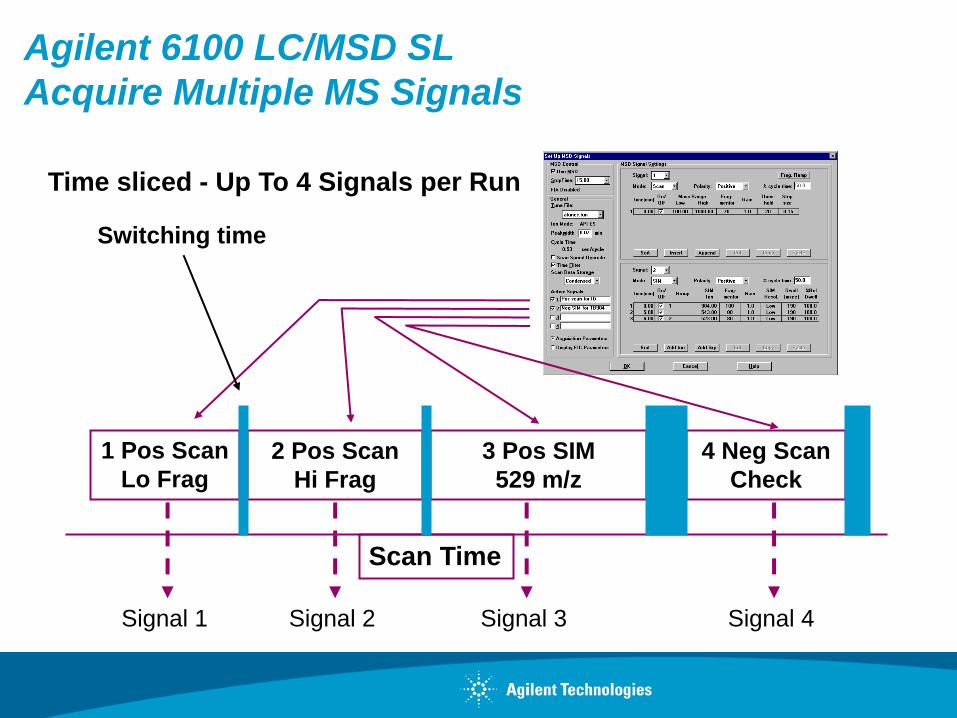
Agilent 6100 LC/MSD SL
Acquire Multiple MS Signals
Scan Time
1 Pos Scan
Lo Frag
2 Pos Scan
Hi Frag
3 Pos SIM
529 m/z
4 Neg Scan
Check
Switching time
Signal 1 Signal 2 Signal 3 Signal 4
Time sliced - Up To 4 Signals per Run
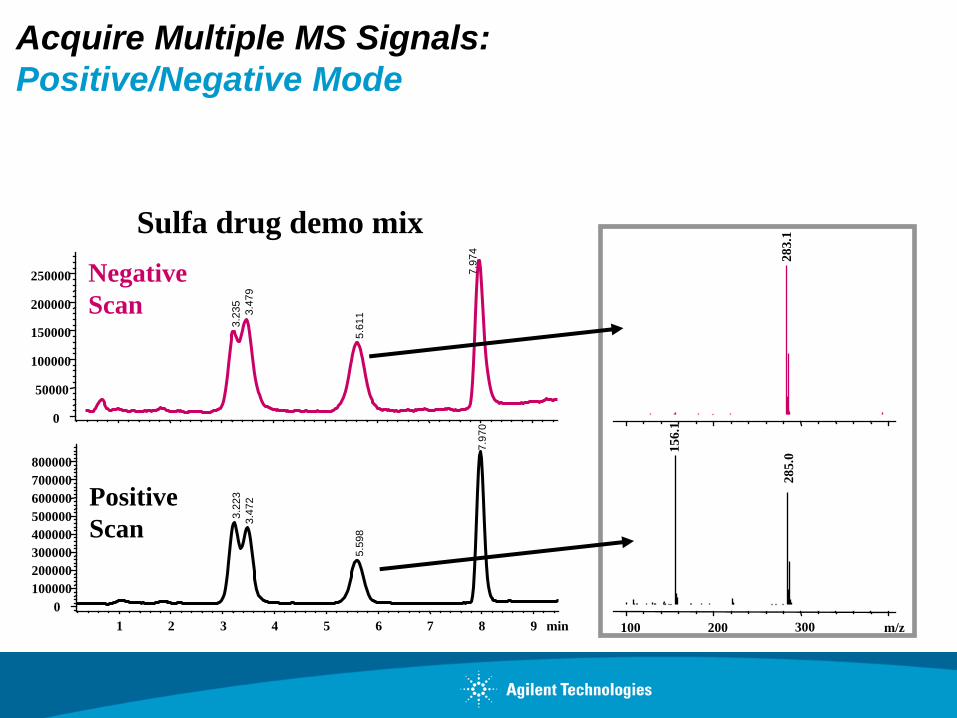
Acquire Multiple MS Signals:
Positive/Negative Mode
min 1 2 3 4 5 6 7 8 9
0
50000
100000
150000
200000
250000
3.2
35
3.4
79
5.6
11
7.9
74
Negative
Scan
0
100000
200000
300000
400000
500000
600000
700000
800000
3.2
23
3.4
72
5.5
98
7.9
70
Positive
Scan
Sulfa drug demo mix
28
3.1
m/z 100 200 300
15
6.1
28
5.0
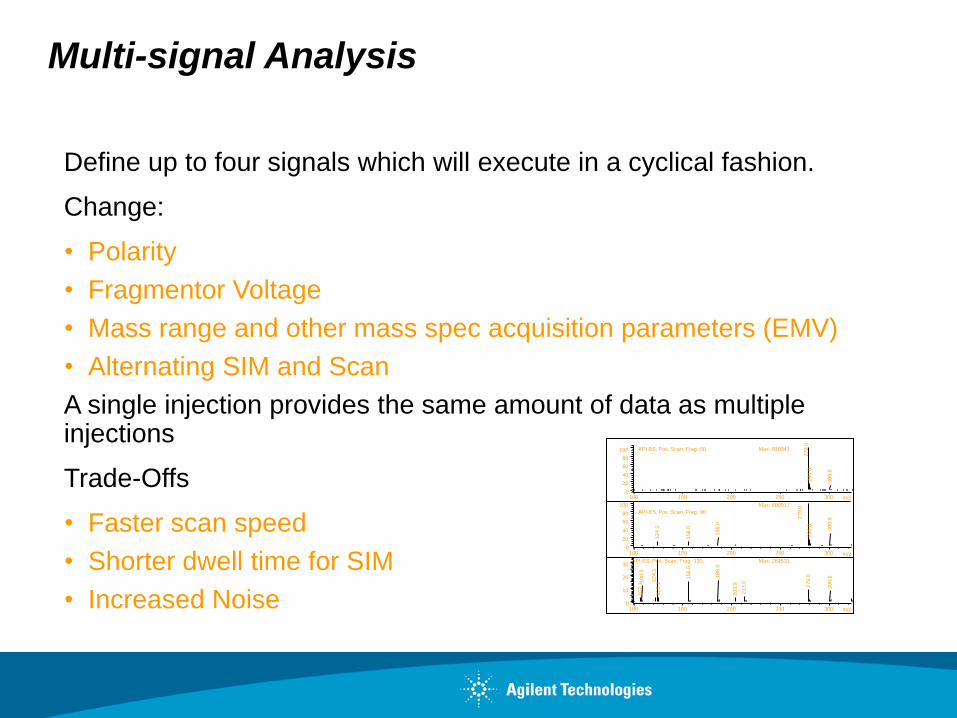
Multi-signal Analysis
Define up to four signals which will execute in a cyclical fashion.
Change:
• Polarity
• Fragmentor Voltage
• Mass range and other mass spec acquisition parameters (EMV)
• Alternating SIM and Scan
A single injection provides the same amount of data as multiple injections
Trade-Offs
• Faster scan speed
• Shorter dwell time for SIM
• Increased Noise
m/z 100 150 200 250 300 0
20
40
60
80
100 API-ES, Pos, Scan, Frag: 50 Max: 810941
279.0
2
80.0
300.9
m/z 100 150 200 250 300 0
20
40
60
80
100
API-ES, Pos, Scan, Frag: 90
Max: 800917
279.0
300.9
186.0
280.0
124.1
156.0
m/z 100 150 200 250 300 0
10
20
30 API-ES, Pos, Scan, Frag: 130, Max: 261531
124.1
186.0
156.0
108.0
279.0
300.9
213.0
125.1
107.1
203.9
MS Parameter Setup: Summary
General Approach
Nebulizer pressure, drying gas temperature and drying gas flow
rate are determined by HPLC flow rate
Compound Dependent Parameters
ESI: Capillary Voltage (Vcap), and Fragmentor
APCI: Vaporizer temperature, Vcap, Corona current, and
Fragmentor
Qualitative Mass Spectral Analysis
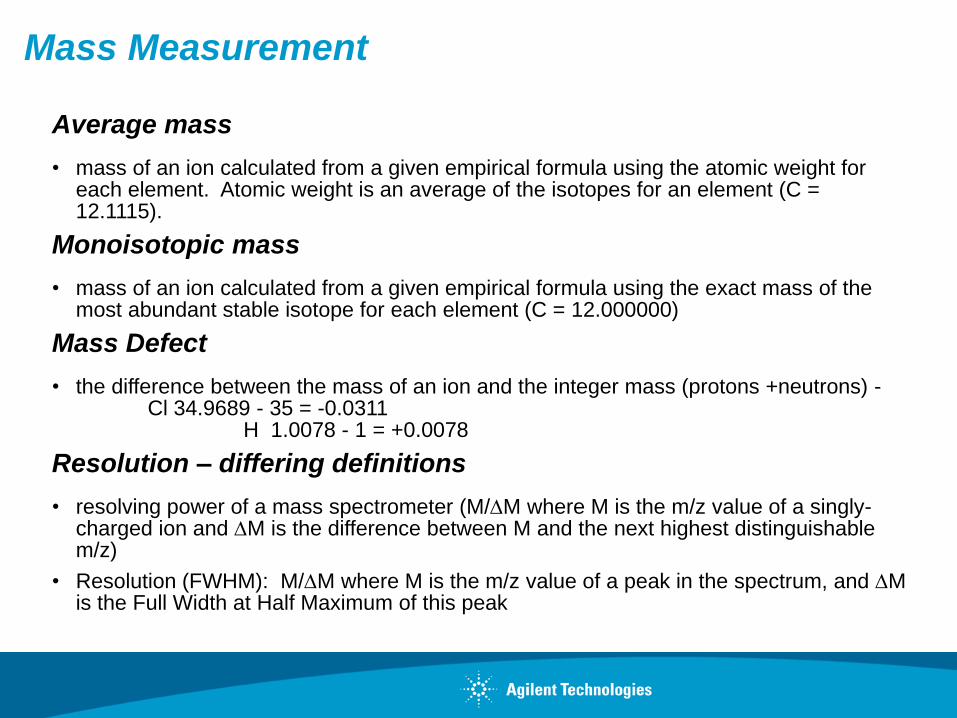
Mass Measurement
Average mass
• mass of an ion calculated from a given empirical formula using the atomic weight for each element. Atomic weight is an average of the isotopes for an element (C = 12.1115).
Monoisotopic mass
• mass of an ion calculated from a given empirical formula using the exact mass of the most abundant stable isotope for each element (C = 12.000000)
Mass Defect
• the difference between the mass of an ion and the integer mass (protons +neutrons) - Cl 34.9689 - 35 = -0.0311 H 1.0078 - 1 = +0.0078
Resolution – differing definitions
• resolving power of a mass spectrometer (M/M where M is the m/z value of a singly-charged ion and M is the difference between M and the next highest distinguishable m/z)
• Resolution (FWHM): M/M where M is the m/z value of a peak in the spectrum, and M is the Full Width at Half Maximum of this peak
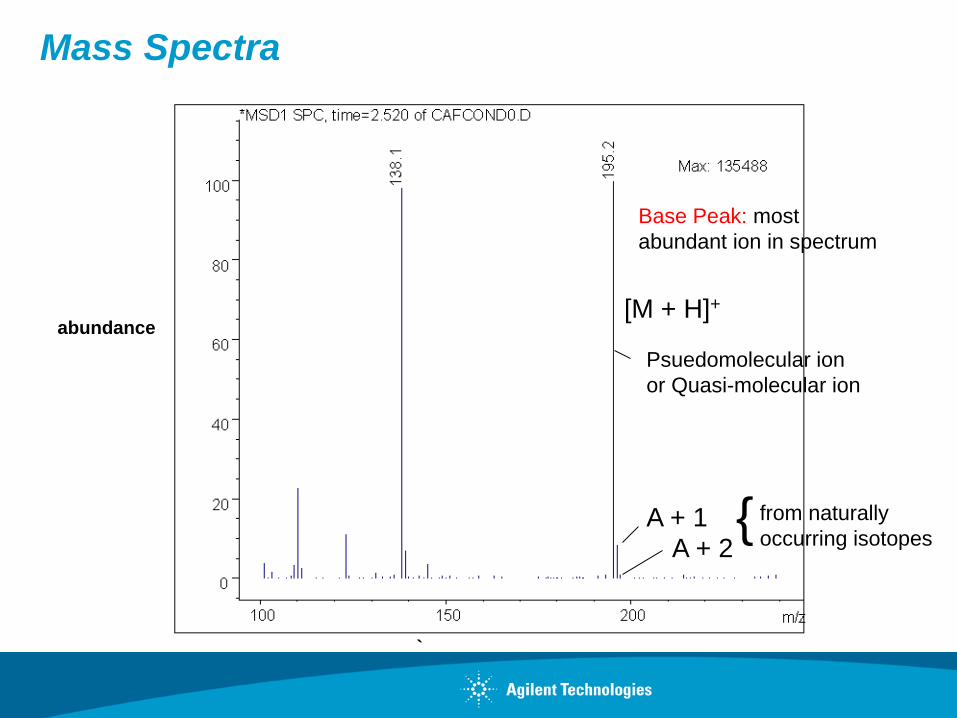
`
abundance
Base Peak: most
abundant ion in spectrum
[M + H]+
Psuedomolecular ion
or Quasi-molecular ion
A + 1 A + 2
from naturally
occurring isotopes {
Mass Spectra
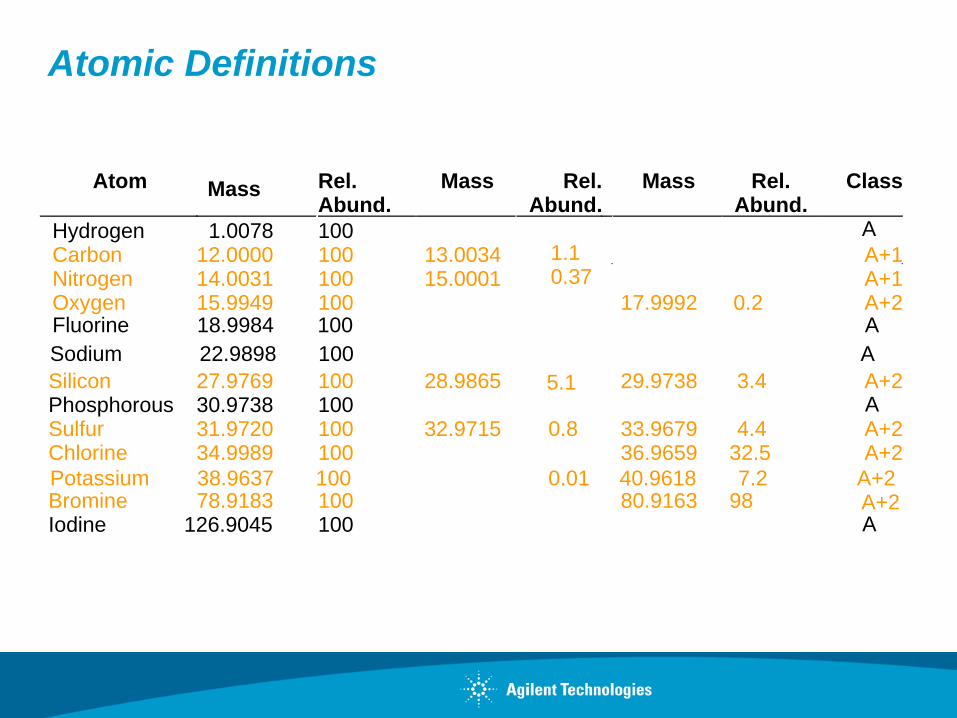
Atom Mass Rel. Abund.
Mass Rel. Abund.
Mass Rel. Abund.
Class
Hydrogen 1.0078 100 A
Carbon 12.0000 100 13.0034 1.1 A+1 Nitrogen 14.0031 100 15.0001 0.37 A+1 Oxygen 15.9949 100 17.9992 0.2 A+2
Fluorine 18.9984 100 A
Silicon 27.9769 100 28.9865 5.1 29.9738 3.4 A+2 Phosphorous 30.9738 100 A Sulfur 31.9720 100 32.9715 0.8 33.9679 4.4 A+2 Chlorine 34.9989 100 36.9659 32.5 A+2
Bromine 78.9183 100 80.9163 98 A+2 Iodine 126.9045 100 A
Sodium 22.9898 100 A
Potassium 38.9637 100 0.01 40.9618 7.2 A+2
Atomic Definitions
Optimizing MSD Analyses
Adapting Existing LC Methods to LC/API-MS
Replace non volatile buffers with volatile buffers at a
concentration of <10 mM for ESI or <100 mM for APCI
• Substitute phosphates and borates with ammonium acetate, ammonium
formate, TFA
• If a non-volatile buffer must be used, select a buffer with only the anionic
or cationic part is non-volatile (i.e. ammonium phosphate and keep
concentration very low) and keep column id and flow rate low (2.1 or 1.0
mm id)
Keep the pH the same as in the original separation with volatile
additives – formic acid, acetic acid, TFA, ammonium hydroxide
Use volatile ion-pair reagents only when needed –
heptaflurobutyric acid (HFBA) and tributylamine (TBA)
MS Friendly Modifiers
Acetic, formic acid
Avoid TFA or keep below 1 mM
• Use TFA “fix” – post column addition of acetic or propionic acid
Ammonium acetate, formate
• < 10 mM for ESI
• < 100 mM for APCI
pH should be appropriate for desired ion polarity
• Won’t see negative ions with formic acid, TFA. Raise pH or use post
column addition of base
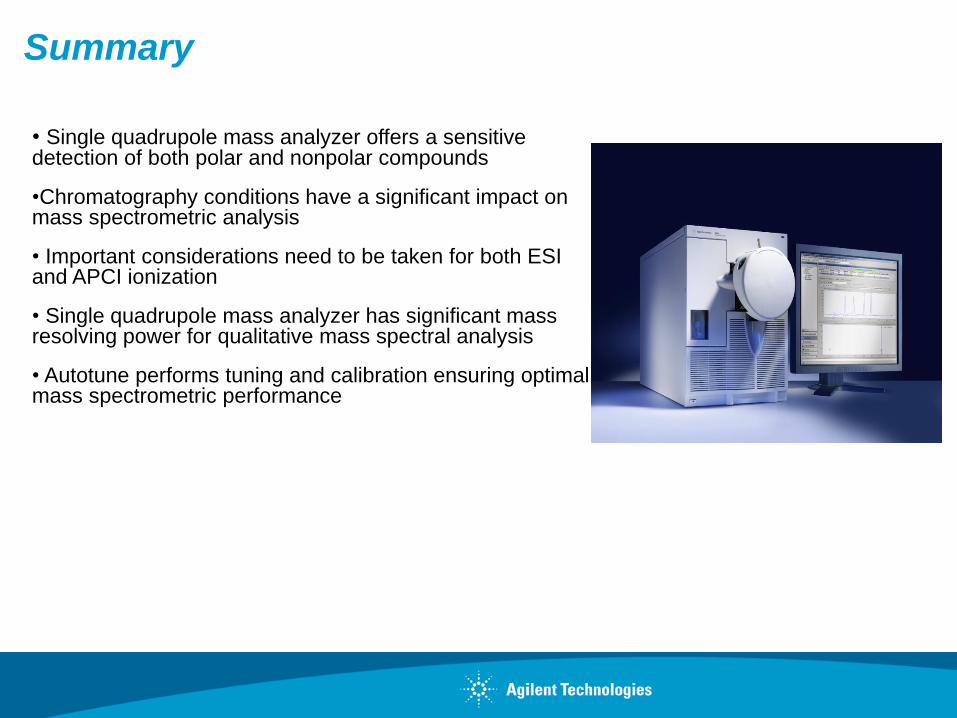
Summary
• Single quadrupole mass analyzer offers a sensitive detection of both polar and nonpolar compounds
•Chromatography conditions have a significant impact on mass spectrometric analysis
• Important considerations need to be taken for both ESI and APCI ionization
• Single quadrupole mass analyzer has significant mass resolving power for qualitative mass spectral analysis
• Autotune performs tuning and calibration ensuring optimal mass spectrometric performance