introduction to mechanical ventilation spontaneous breathing
TRANSCRIPT

Introduction to Mechanical Introduction to Mechanical VentilationVentilation

Spontaneous BreathingSpontaneous Breathing

Positive Pressure BreathPositive Pressure Breath

Goals of Mechanical Goals of Mechanical VentilationVentilation
Maintain ABG’s
Optimize V/Q
Decrease Myocardial Workload

Indications for Mechanical Indications for Mechanical VentilationVentilation
ApneaAcute Ventilatory Failure
– Ph 7.30 or <, with PaCO2 50 or >– Clinical Signs
Impending Ventilatory FailureAcute Respiratory Failure

Two Ways to Achieve Two Ways to Achieve Continuous Mechanical Continuous Mechanical
Ventilation, ie CMVVentilation, ie CMV
Negative pressure
Positive pressure

Positive Pressure Flow Positive Pressure Flow Pattern ConsiderationsPattern Considerations
Flow = Pressure divided by resistance

Positive Pressure Flow Positive Pressure Flow PatternsPatterns
Constant flow or Square Wave
Flow stays constant as resistance varies
Thus pressure and resistance vary directly

Positive Pressure Flow Positive Pressure Flow PatternsPatterns
Accelerating/decelerating or sine wave
Peak flow occurs at mid-inspiration
Mimics spontaneous breathing

Positive Pressure Flow Positive Pressure Flow PatternsPatterns
Constant Pressure or tapered flow
Flow (and hence tidal volume) vary with resistance

Flow Patterns SummaryFlow Patterns Summary
Constant flow or square wave
Sine Wave Constant Pressure or
tapered wave

Compare & ContrastCompare & Contrast

Cycling Cycling
Cycling refers to how the ventilator ends the inspiratory phase of the
breath

Cycling MechanismsCycling Mechanisms
Volume cycling – inspiration ends when a preset tidal volume is delivered
Pressure cycling – inspiration ends when a preset pressure is reached on the airway
Time cycling – inspiration ends when a preset inspiratory time has elapsed
Flow cycling – inspiration ends when a preset flow has been reached

TriggeringTriggering
The mechanism that starts the inspiratory phase

Trigger MechanismsTrigger MechanismsPressure triggered – a drop in airway
pressure triggers the ventilatorFlow triggered – a constant (bias) flow of
gas passes through the ventilator circuit. When the patient starts to inhale the ventilator detects the drop in bias flow and triggers
Types of triggered breaths: patient = assisted; ventilator = controlled, operator = manual

Hazards – Positive Pressure Hazards – Positive Pressure CMVCMV
Increased mean intrathoracic pressure– Decreased venous return– Increased intracranial pressure– Pulmonary Volu/Barotrauma– Fluid retention
Gastric Ulcers Muscle Atrophy & Patient Dependence Mechanical Failure Mismanagement Contamination/Infection

Preventing HazardsPreventing Hazards
Maintain good I:E ratioMake sure flow meets patient’s demandAttention to patient and ventilatorFREQUENT HANDWASHING!

Ventilator “Modes”Ventilator “Modes”

Control ModeControl Mode

Assist ModeAssist Mode

Assist/ControlAssist/Control

IMV – Intermittent Mandatory IMV – Intermittent Mandatory VentilationVentilation

PEEPPEEP

CPAPCPAP

Other ModesOther Modes
High Frequency Ventilation (HFV)Pressure Control ( time cycling)Pressure Support (flow cycling)Airway Pressure Release Ventilation
(APRV)

Some Practical ApplicationsSome Practical Applications

Peak PressurePeak Pressure
Pressure on manometer immediately at end of inspiratory phase
Represents pressure needed to overcome both elastic and airway resistance
Used to calculate dynamic compliance– Cdyn = VT/Peak pressure
PEAK PRESSURE WILL CHANGE WHEN EITHER ELASTIC OR AIRWAY RESISTANCE CHANGES!

Plateau PressurePlateau Pressure
Pressure on manometer after inspiration has ended but before expiration has started
Represents pressure needed to overcome elastic resistance only
Used to calculate static compliance– Cstat = VT/plateau pressure
PLATEAU PRESSURE CHANGES ONLY WHEN ELASTIC RESISTANCE CHANGES

Clinical Analysis By Clinical Analysis By Comparing Peak and Plateau Comparing Peak and Plateau
Pressure ChangesPressure ChangesRemember – a change in elastic resistance
will affect both peak and plateau pressureRemember – a change in airway resistance
only affects the peak pressureCompare the change in plateau pressures
first, then compare the changes in peak pressure

Resistance and Pressure Vary Resistance and Pressure Vary DirectlyDirectly
Resistance and Pressure Vary Inversely With Compliance
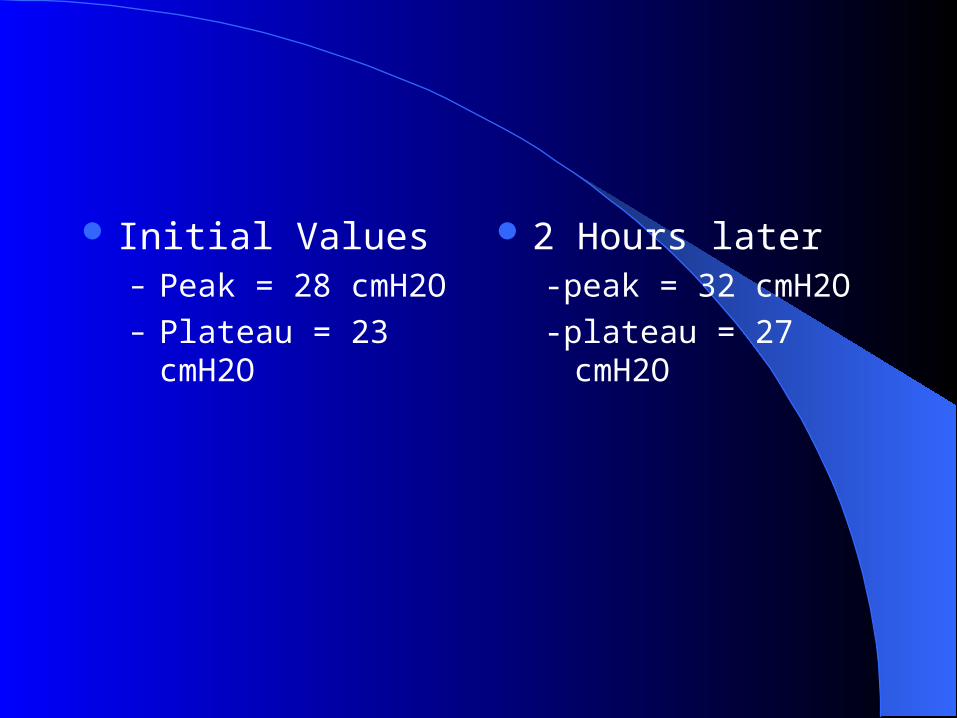
Initial Values– Peak = 28 cmH2O– Plateau = 23 cmH2O
2 Hours later-peak = 32 cmH2O
-plateau = 27 cmH2O

Initial Values– Peak = 31 cmH2O– Plateau = 25 cmH2O
2 Hours Later– Peak = 40 cmH2O– Plateau = 25 cmH2O

Initial Values– Peak = 49 cmH20– Plateau = 30 cmH2O
2 Hours Later– Peak = 49 cmH2O– Plateau = 26 cmH2O

Initial Values– Peak = 36 cmH2O– Plateau = 29 cmH2O
2 Hours Later– Peak = 32 cmH2O– Plateau = 29 cmH20

Initial Values– Peak = 29 cmH2O– Plateau = 22 cmH2O
2 Hours Later– Peak = 41 cmH2O– Plateau = 28 cmH2O

Initial Values– Peak = 33 cmH2O– Plateau = 21 cmH2O
2 Hours Later– Peak = 34 cmH2O– Plateau = 19 cmH2O

Now lets have someFun with more math!