introduction to napls review of general concepts lnapl and dnapl migration patterns behavior in the...
TRANSCRIPT
Introduction to NAPLs
• Review of general concepts• LNAPL and DNAPL migration patterns• Behavior in the subsurface• Measurement in wells• Emerging remediation methods• Detailed case study - Hill Air Force Base

What are NAPLs ?
• Immiscible hydrocarbons in the subsurface which can partially dissolve into water at very slow rates
• Can be either lighter than water (LNAPL) or denser than water (DNAPL)
• Form a visible, separate oily phase in the subsurface
• Complex migration governed by gravity, buoyancy, and capillary forces, and soil texture
Phase Distribution
• Free phase, aqueous, gaseous, and solid
• Distribution dictated by four processes:
– Volatilization (Henry’s Law)– Dissolution (solubility)– Sorption (tailing effects in pump/treat systems)– Biodegradation (aqueous phase mostly)
LNAPL Transport Properties
• Density (LNAPL vs DNAPL)• Viscosity (governs mobility in subsurface)• Interfacial tension (pore scale effect)• Wettability (affinity of soil for fluids)• Capillary pressure (pressure across an interface)• Saturation (fraction of pore space containing fluid)• Relative permeability (function of saturation)
Mobile vs. Residual NAPL
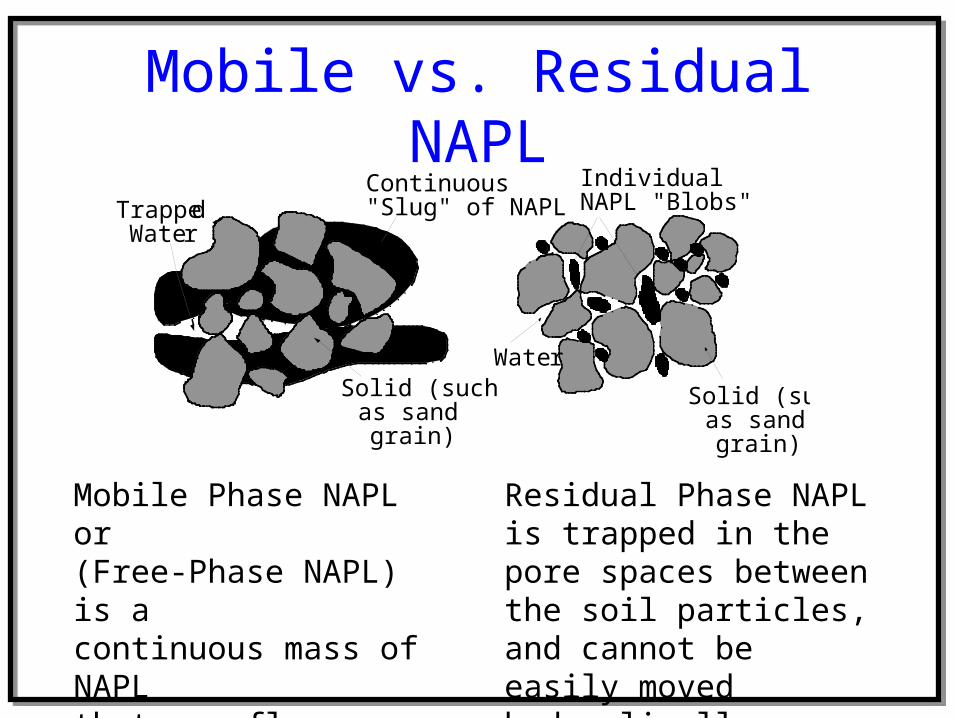
TrappedWater
Solid (suchas sandgrain)
Water
IndividualNAPL "Blobs"
Continuous"Slug" of NAPL
Solid (suchas sandgrain)
Mobile Phase NAPL or (Free-Phase NAPL) is a continuous mass of NAPLthat can flow under a hydraulic gradient
Residual Phase NAPL is trapped in the pore spaces between the soil particles, and cannot be easily moved hydraulically

Long-Term Sources
• Total mass of NAPL at a site is often many times the total dissolved mass at the same site
• The EPA in 1989 and 1992 concluded that poor performance of pump-and-treat systems was due to NAPLs acting as a continuing source
• One kg of NAPL can contaminate: – 100,000 L of groundwater at 10 mg/L, or – 100,000,000 L of groundwater at 10 µg/L
• It can take many years to dissolve a large NAPL source
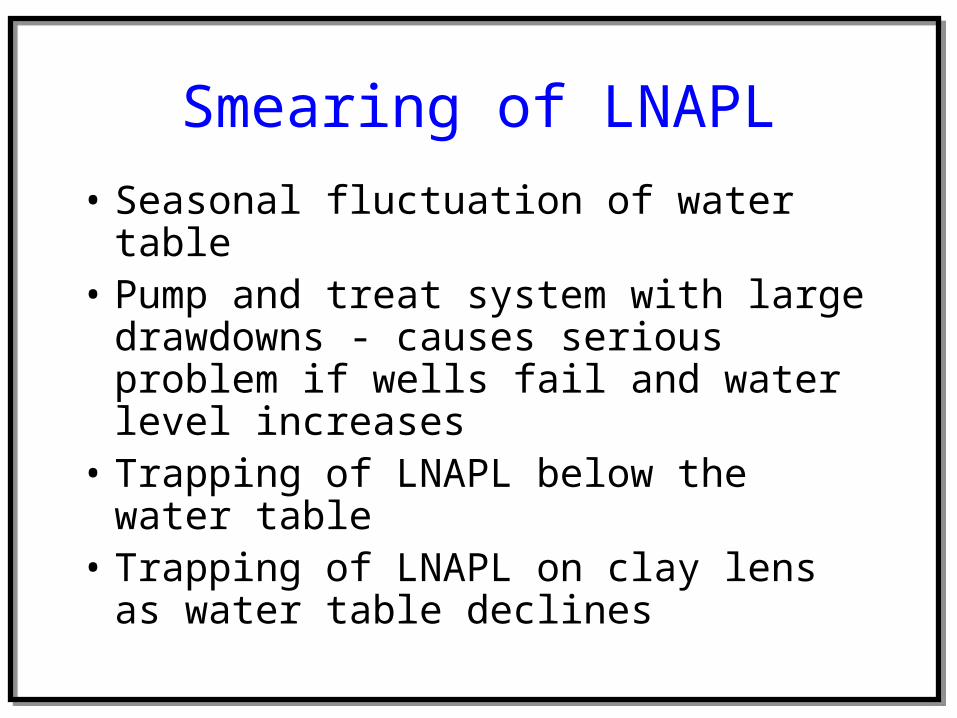
Smearing of LNAPL
• Seasonal fluctuation of water table• Pump and treat system with large
drawdowns - causes serious problem if wells fail and water level increases
• Trapping of LNAPL below the water table• Trapping of LNAPL on clay lens as water
table declines

LNAPL Release to Vadose Zone
VadoseZone
ResidualSaturation of
NAPL inVadose Zone
Infiltration, Leaching
Ground WaterFlow
Dissolved ContaminantPlume From NAPL Residual
Saturation

LNAPL at the Water Table
VadoseZone
GroundwaterFlow
Infiltration andLeaching
Free-Phase Product Layerin Saturated Zone
DissolvedContaminant Plume
ResidualSaturationof LNAPLin soil
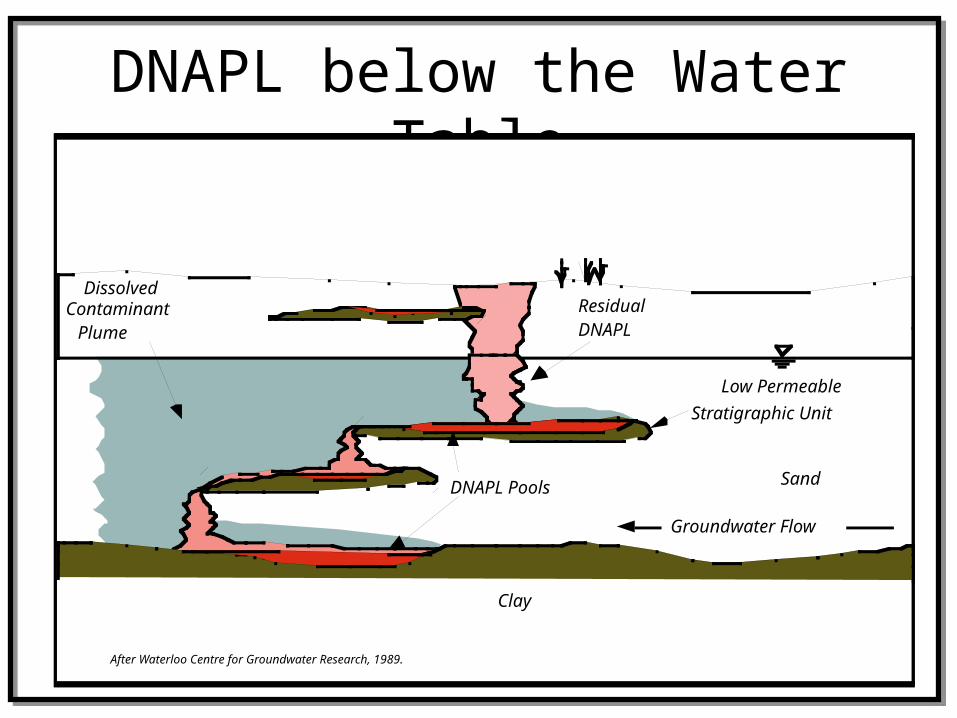
DNAPL below the Water Table
After Waterloo Centre for Groundwater Research, 1989.
ResidualDNAPL
DNAPL Pools Sand
Low Permeable
Stratigraphic Unit
Clay
Groundwater Flow
DissolvedContaminant
Plume

Wettability
• Capillary pressure proportional to interfacial tension and inverse to radius of curvature
• Fluid drawn into pore is the wetting fluid• Fluid repelled by capillary forces is the non-
wetting fluid• Water is almost always wetting when mixed with
air or NAPLs in the subsurface• NAPL is generally the wetting fluid in air but non-
wetting fluid in water

Wetting Relationships
WaterΦ
: Testing fluid water : Background fluid NAPL
< 70°Φ > 110°Φ
Φ
AIR
System
:air water: air NAPL
:water NAPL: :air NAPL water
Wetting Fluid
waterNAPLwater> >water organic air
- Non Wetting Fluid
airair
NAPLair
, , :General Wetting Relationships for Air Water NAPL
Φ = Contact Angle
NAPL
SOLID
: Conclusion Water is the wetting fluid
: Testing fluid NAPL : Background fluid air
: Conclusion NAPL is the wetting fluid
NAPL
SOLID
NAPL is Non wetting fluid

NAPL migration in primary vs. secondary porosity.
(A) NAPL migration through primary porosity.
(B) NAPL migration through secondary porosity features
(fractures, root holes, etc.).
A B
Source Source
DNAPLDNAPL

LNAPL Moving Upgradient
ConfiningLayer
GroundwaterFlow
LNAPL Plume Moving"Upgradient" to
Stratigraphic TrapDissolved
Contaminant Plume
SourceZone ForcingLNAPL into
Confined Aquifer

Fractured Rock System
SandVadose
Zone
ResidualDNAPL
FracturedRock or
FracturedClay
After Waterloo Centre for Ground Water Research, 1989.
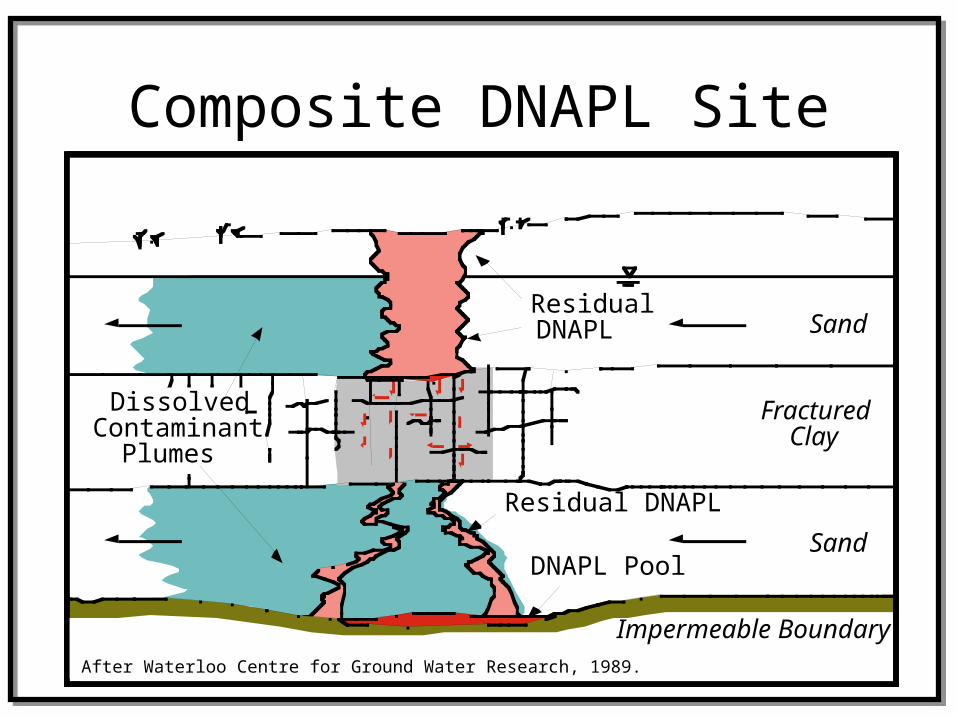
Composite DNAPL Site
ResidualDNAPL
FracturedClay
Residual DNAPL
DNAPL Pool
Sand
Sand
DissolvedContaminant
Plumes
Impermeable BoundaryAfter Waterloo Centre for Ground Water Research, 1989.
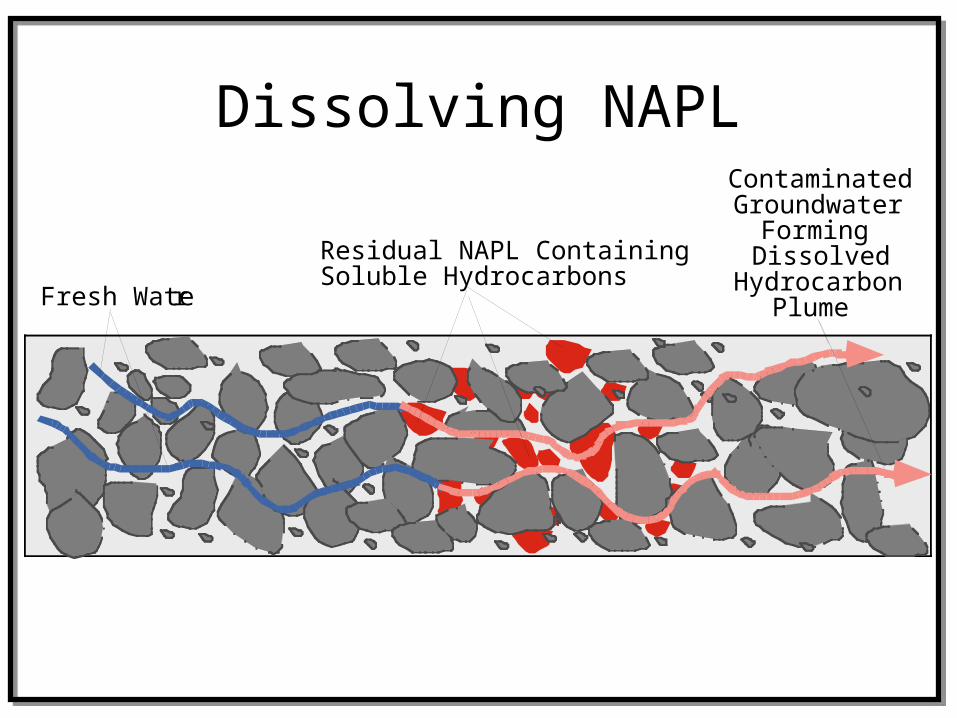
Dissolving NAPL
Fresh Water
Residual NAPL ContainingSoluble Hydrocarbons
ContaminatedGroundwater
FormingDissolved
HydrocarbonPlume

Relative Permeability
100%0Water Saturation
100% NAPL Saturation0
0
100%
NAPL Water
ResidualSaturation
of NAPL
RelativePermeability
80%
60%
40%
20%
Sor
IrreversibleSaturation
of Water

Flow Regimes
IIMixedFlow
IDNAPL
Flow IIIWaterFlow
Increasing Water Saturation
Kr = relativepermeability
1.00
0.80
0.60
0.40
0.20
0.10
0.08
0.06
0.04
0.02
0.01
1.00
0.80
0.60
0.40
0.20
0.10
0.08
0.06
0.04
0.02
0.01
Increasing DNAPL Saturation
Kr = relativepermeability

Hydraulic Mobilization of NAPL
100
10
0.1
10-3 10-2 10-1
1
CLEAN SANDSILTY SAND
HYDRAULIC CONDUCTIVITY(cm/sec)
1GRAVEL
No Blobs Mobilized - NAPLTrapped by Capillary Forces
10
0.1
1
100100 :1
ΔZ
Δ X
10:1ΔZ
Δ X
1:1
Δ X
ΔZ
1:10ΔZ
Δ X
SLOPE OF WATER TABLE
RequiredHydraulicGradient(ft/ft)
All Blobs MobilizedEasiest-
to-Move Blobs Are Mobilized
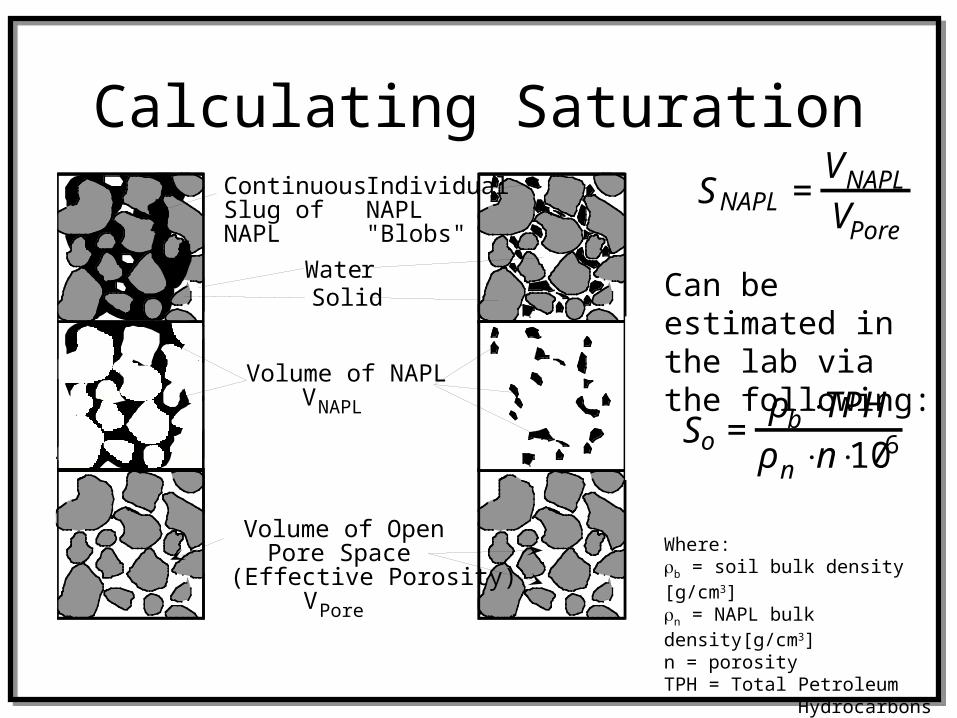
Calculating Saturation
Water
ContinuousSlug ofNAPL
Volume of NAPLVNAPL
Volume of OpenPore Space
(Effective Porosity)VPore
Solid
IndividualNAPL"Blobs"
SNAPL=VNAPLVPore
Can be estimated in the lab via the following:
Where:b = soil bulk density [g/cm3]n = NAPL bulk density[g/cm3]n = porosityTPH = Total Petroleum Hydrocarbons [mgNAPL/kgdry soil]
So =ρb ⋅TPHρn ⋅n⋅10
6

Partitioning Tracer Test for SN
• Chemicals are introduced consisting of conservative and partitioning tracers (PTT)
• NAPL - Water Partition Coefficient KN.
• KN = CN/Cw where CN is the conc. in NAPL and Cw is water conc.
• At steady state, the effect is to delay or retard the PT transport rate according to a retardation factor
• R = 1 + (KN SN)/(1 - SN) = tp/tn

Partitioning Tracer Test for SN
• Tp is travel time for the Partitioning tracer
• Tn is the travel time for the conservative tracer (Br-)
• Sorption is assumed insignificant• PT compounds often used include alcohols such as
– ethanol(0.1) KN values in parentheses
– n-pentanol (1.4)
– n-hexanol (4.6)
– 2,2 dimethyl-3-pentanol (12.9)
– n-heptanol (20.0)
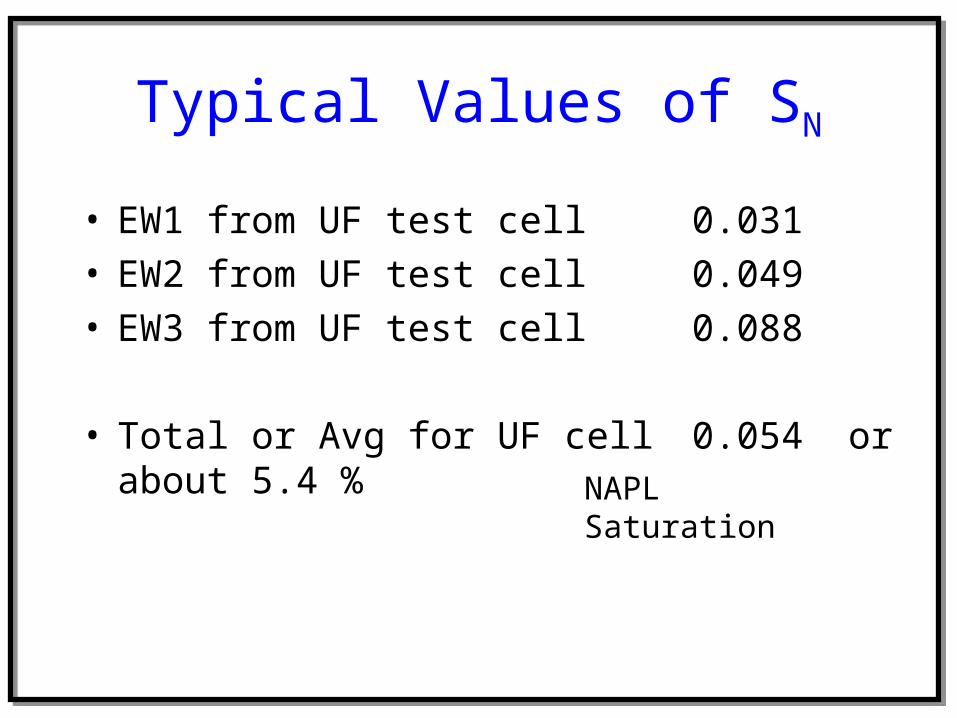
Typical Values of SN
• EW1 from UF test cell 0.031• EW2 from UF test cell 0.049• EW3 from UF test cell 0.088
• Total or Avg for UF cell 0.054 or about 5.4 %NAPL Saturation
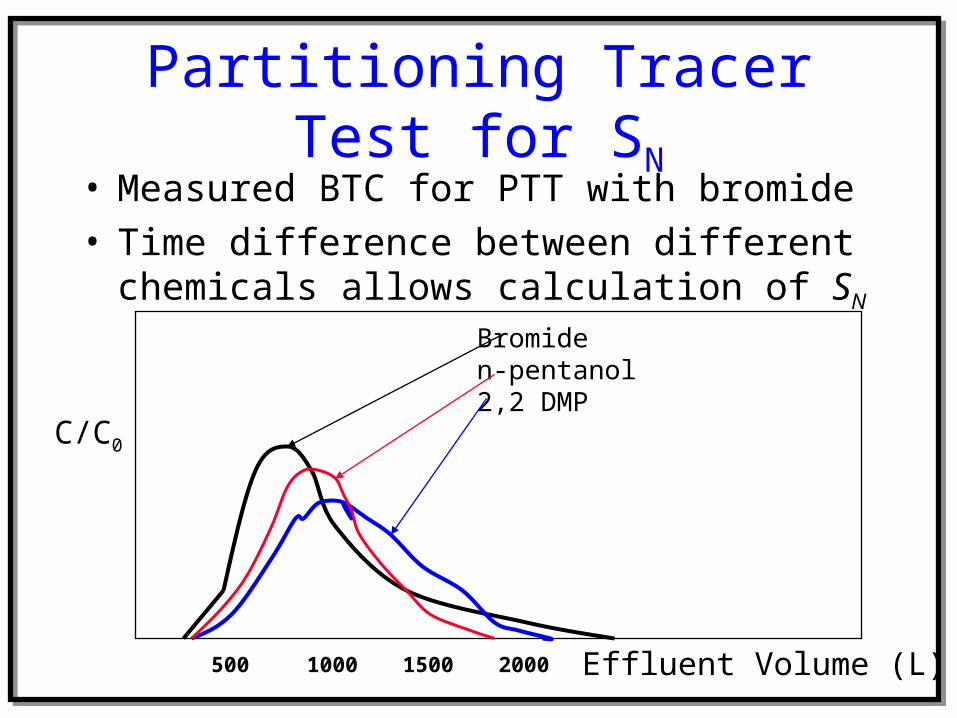
Partitioning Tracer Test for SN
• Measured BTC for PTT with bromide• Time difference between different chemicals allows
calculation of SN
C/C0
Effluent Volume (L)500 1000 1500 2000
Bromiden-pentanol 2,2 DMP
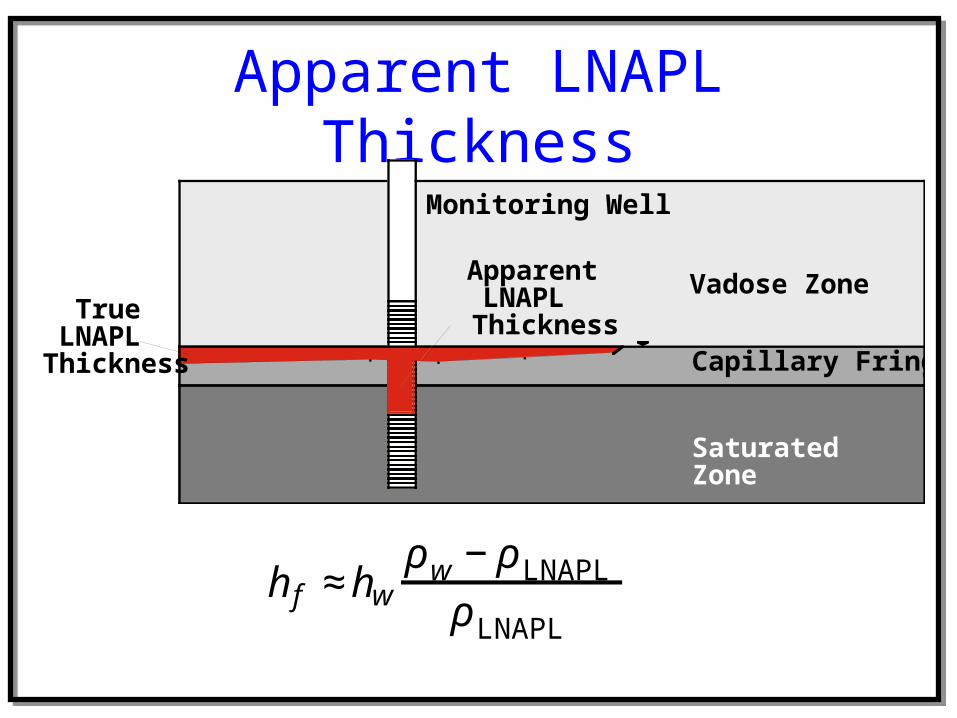
Apparent LNAPL Thickness
True LNAPL Thickness
Monitoring Well
Vadose Zone
Capillary Fringe
SaturatedZone
ApparentLNAPL
Thickness
hf ≈hwρw−ρLNAPLρLNAPL

Apparent LNAPL Thickness
• Thickness in screened well casing only indicator of actual thickness in the unit
• Thickness in the well may be 2 to 10 times larger than actual thickness of mobile LNAPL in the surrounding aquifer
• No methods exist to improve these estimates
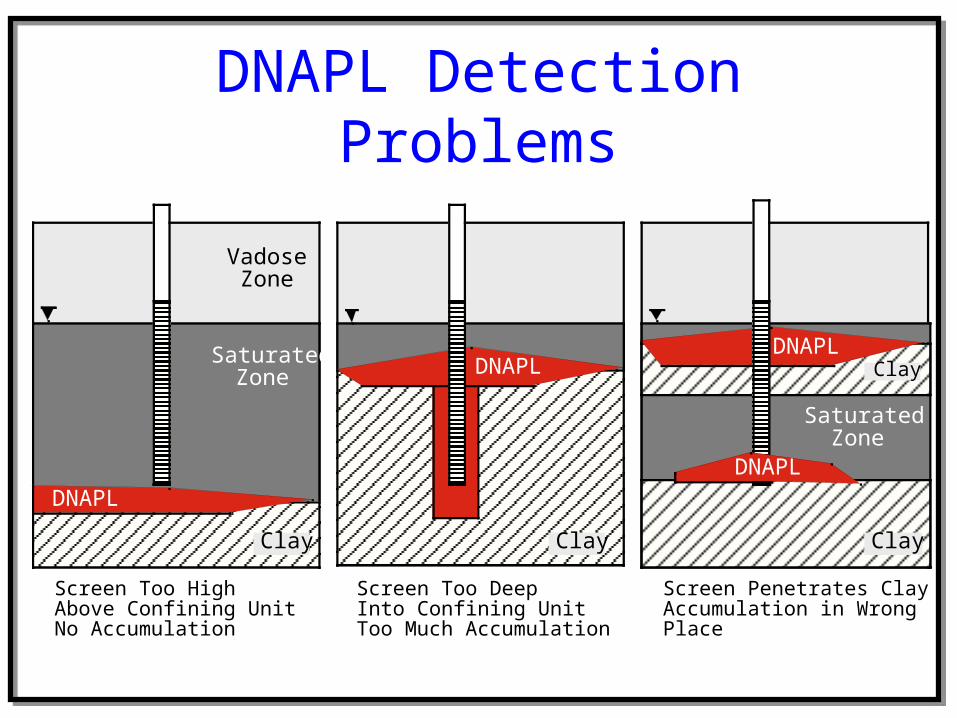
DNAPL Detection Problems
Screen Too HighAbove Confining UnitNo Accumulation
Screen Too DeepInto Confining UnitToo Much Accumulation
Screen Penetrates Clay LensAccumulation in WrongPlace
SaturatedZone
VadoseZone
SaturatedZone
Clay Clay Clay
Clay
DNAPL
DNAPLDNAPL
DNAPL

Remediation of LNAPL
• Excavation• Trenches, drains, and wells• Soil vapor extraction (SVE)• Air sparging• Enhanced oil recovery (water, steam, cosolvents,
surfactants, etc)• Bioremediation• Physical barriers

Hill AFB in Utah Largest Remediation Project for
NAPL in a Source Zone - Joint project with several
universities, U.S. EPA, U.S. Air Force, and private industry
1994 - 1998