introduction to priority mapper - infoharvest mapper introduction.pdf · infoharvest’s priority...
TRANSCRIPT

Introduction to the GIS-based Priority Mapper
Integrating InfoHarvest’s Priority Analyst with ESRI’s ArcMap® GIS
Background In 2003, InfoHarvest worked with ESRI to integrate InfoHarvest’s commercial multi-criteria decision analysis (MCDA) product, Criterium DecisionPlus (CDP), with the USDA Forest Services’ Ecosystem Management Decision Support (EMDS) system. The EMDS runs as an extension under ESRI’s ArcMap® product and combines InfoHarvest’s MCDA technology with a fuzzy logic rules engine and a scenario analysis approach. The core of the implementation of our MCDA engine in the EMDS is the Priority Analyst engine. We are now making the Priority Analyst directly available for use in ArcMap, with a focus on prioritizing actions and visually displaying budget implications on a map. We call this integrated solution the Priority Mapper. It is implemented as an extension to ArcMap and as a geo-processing tool for use with ArcGIS’s ModelBuilder. This document provides an overview of this extended implementation by walking through a (fictitious) damage recovery example.
System Overview The Priority Mapper supports the user in applying MCDA decision models to prioritize features on a map. Using it involves the following steps
A) Create an MCDA model using Criterium DecisionPlus a. Identify what is the goal in prioritizing the features b. Identify what criterion you need to prioritize the features c. Enter how import each of those criteria are in prioritizing the features
B) Obtain a Map of the area loadable in ArcMap C) Obtain a feature class of the features you wish to prioritize – e.g., schools, river reaches D) Create a Priortization using the Priority Mapper
a. Associate the MCDA model with the feature set b. Map the attributes in the feature set to lowest criteria in the MCDA model c. Run the MCDA model against the feature set to prioritize the features
E) Show the prioritized features on the original map F) Explore how changing the weights G) Optionally see how many of these tasks could be funded when resources are finite
a. specify a budget constraint field and b. the amount available to expend, and c. assuming highest priority features would be addressed first, have the Priority Mapper
calculate which features fall within the budget d. see on the map which features fall within the budget e. Generate Budget Action list
In the next section, we follow these steps through prioritizing a fictitious dataset from New Orleans.
© InfoHarvest Inc. 2008 1/14 Priority Mapper Introduction.doc

Priority Mapper Example – Prioritizing Restoration of Police Stations in New Orleans There are over 30 police stations in downtown New Orleans that were affected by the recent hurricane. We obtained a map of their locations in New Orleans, then generated fictitious data that we imagine could easily obtained for each station. The goal is to establish a list of the stations that should be restored first, given a finite budget, and validate the list based on reviewing the locations on a map. Note: While the location of the police stations is derived from actual maps, the data we associated with them was artificially created to show the main steps in map-based prioritization.
A) Create an MCDA model to prioritize the restoration Using Criterium DecisionPlus, we generated the following MCDA model
The goal is identified to be to prioritize the police stations for restoration. The prioritization will be based on the number of people each station served, the number of officers supported at each station, estimates of the degree of damage received from the hurricane, and estimates restoration costs. The Criteria and the scales used to measure them are:
Criterion Scale Units Low High Restoration Cost $K 3000 0Degree of Damage Degree of Damage Undamaged DestroyedNumber of Officers Officers 0 100Population Served People 0 10000
The Criteria Restoration Costs represent estimates of how much money will be required to restore each police station’s physical infrastructure to working order. Estimates are in thousands of dollars ($K). The Degree of Damage criterion is assessed against an ordered qualitative scale measuring the degree of damage sustained by the buildings in the police station: {undamaged, wet, damaged, structural, destroyed}. The Number of Officers counts the number of police officers that are based in each police station. The Population Served criterion is an estimate of the number of people in the community served by the police station. This field data would typically be generated by doing a GIS analysis based on census data.
© InfoHarvest Inc. 2008 2/14 Priority Mapper Introduction.doc

Weighting the Criteria The importance of these criteria in prioritizing the stations for restoration was then entered. In this example the Population Served criterion was deemed the most important criterion with respect to which the Degree of Damage was considered to be 75% as important, etc.
B) Obtain a Map of the area loadable in ArcMap
ity Mapper Introduction.doc
wn in blue.
Using ArcMap, an aerial picture of downtown New Orleans taken on September 2nd, 2005 was geo-referenced using FEMA damage data. The flooding is sho
© InfoHarvest Inc. 2008 3/14 Prior

C) Obtain a feature class of the features you wish to prioritize A feature class showing the location of 34 downtown police stations was obtained and overlaid on the map of New Orleans. Some stations are clearly within the flood zone, while other are clear of it, though they still may have sustained damage from high winds.
Still in ArcMap, we then added a number of attribute fields corresponding to the criteria we had identified when creating the MCDA model. We then entered sample data to populate those fields. Using ArcMap’s extensive data import or table join capabilities, this data could easily have been imported from actual data sources.
© InfoHarvest Inc. 2008 4/14 Priority Mapper Introduction.doc
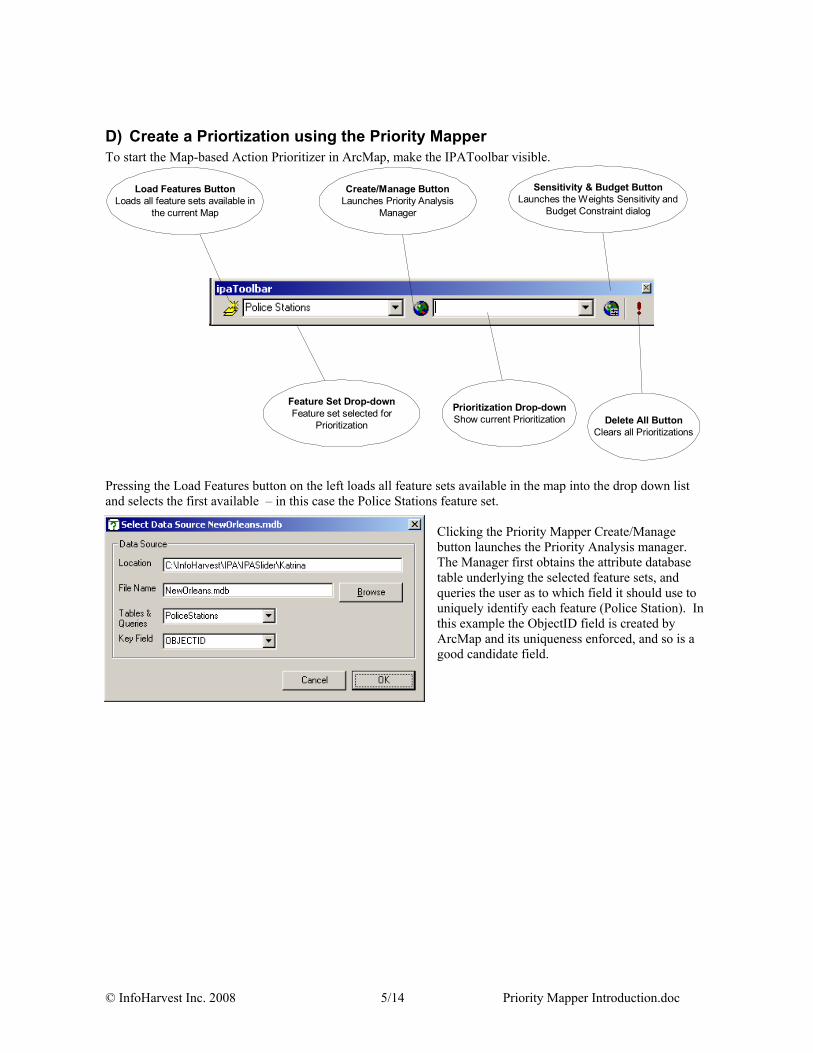
D) Create a Priortization using the Priority Mapper To start the Map-based Action Prioritizer in ArcMap, make the IPAToolbar visible.
Load Features ButtonLoads all feature sets available in
the current Map
Feature Set Drop-downFeature set selected for
Prioritization
Create/Manage ButtonLaunches Priority Analysis
Manager
Prioritization Drop-downShow current Prioritization
Sensitivity & Budget ButtonLaunches the Weights Sensitivity and
Budget Constraint dialog
Delete All ButtonClears all Prioritizations
Pressing the Load Features button on the left loads all feature sets available in the map into the drop down list and selects the first available – in this case the Police Stations feature set.
r.
to ). In
a ield.
Clicking the Priority Mapper Create/Manage button launches the Priority Analysis manageThe Manager first obtains the attribute database table underlying the selected feature sets, and queries the user as to which field it should use uniquely identify each feature (Police Stationthis example the ObjectID field is created by ArcMap and its uniqueness enforced, and so isgood candidate f
© InfoHarvest Inc. 2008 5/14 Priority Mapper Introduction.doc

Associate the MCDA model with the feature set
With the Police Station Feature set chosen, the systems asks you to enter a name for the prioritization, and browse for the MCDA model you wish to use for the prioritization. Knowing that the MCDA model we created gives greatest weight to the number of people served by the Police Station, we enter the name “Service-driven Prioritization”.
Map the attributes in the feature set to lowest criteria in the MCDA model As is often the case, the name of the attribute fields may differ from those in the selected MCDA model, so the user needs to use the Map Fields dialog to map one to the other:
© InfoHarvest Inc. 2008 6/14 Priority Mapper Introduction.doc

Run the MCDA model against the feature set to prioritize the features
You can stay in the Priority Analyst and use its various validation screens to make sure the results make sense.
© InfoHarvest Inc. 2008 7/14 Priority Mapper Introduction.doc

E) Show the prioritized features on the original map On closing the Priority Analyst Manager, the Police Station Feature set is redrawn to show the results of the current prioritization.
With this fictitious data, the higher priority stations appear in the flooded, more populous areas.
© InfoHarvest Inc. 2008 8/14 Priority Mapper Introduction.doc

F) Explore how changing the weights affects Prioritization On clicking the Sensitivity and Budget Button, a dialog appears in which you are able to vary the weights. Initially it reflects the weights of the MCDA model associated with the current prioritization.
Changing the weights to a more damage-driven prioritization, could be achieved by setting the weight of Degree of Damage to 100, and reducing the weight of Population Served to half of that.
Clicking the Apply button would produce the following Prioritization on the map:
© InfoHarvest Inc. 2008 9/14 Priority Mapper Introduction.doc

Most stations would be of medium priority, and more scattered throughout the flood area, with less correlation with populations served.
© InfoHarvest Inc. 2008 10/14 Priority Mapper Introduction.doc

G) Optionally see how many of these tasks could be funded when resources are finite In many cases we are prioritizing features in anticipation of taking action with respect to them (e.g., disaster recovery, habitat restoration, threat reduction, school building improvements). But usually there are constraints in terms of resources available. The Map-based Action Prioritizer supports budget development visually on a map.
Identify the Constraint field and enter budget limit Click on the Sensitivity and Budget button again and select Restoration Cost as our constraint (limited resource) field. Enter a budget limit of one million dollars ( = 10,000 $K)
Calculate which features fall within the budget Click the Apply button to have Priority Mapper run down the list of features from high priority to low, until the budget limit is reached.
© InfoHarvest Inc. 2008 11/14 Priority Mapper Introduction.doc

See on the map which features fall within the budget
Police Stations whose is priority is sufficiently low that they do not make the budget cut are indicated in black. Were the budget cap to be increased to $1.5 million, all of the low priority stations could also be restored:
© InfoHarvest Inc. 2008 12/14 Priority Mapper Introduction.doc

Generate Budget Action Report Clicking the Generate List button copies the prioritized list and budget information to the clipboard. Police Stations Included in a budget of 10000 $K
OBJECTID Restoration Costs
Priority_Scores Resource Usage (K$)
21 100 0.61 10028 800 0.6 90035 700 0.6 160036 1700 0.57 3300
8 500 0.56 38006 0 0.55 3800
30 300 0.55 410014 750 0.54 485034 500 0.54 535026 0 0.53 535031 1200 0.53 655013 30 0.52 658037 1200 0.52 7780
9 0 0.49 778038 600 0.48 838027 40 0.46 8420
© InfoHarvest Inc. 2008 13/14 Priority Mapper Introduction.doc

© InfoHarvest Inc. 2008 14/14 Priority Mapper Introduction.doc
Police Stations Excluded in a budget of 10000 $K
OBJECTID Restoration Costs
Priority_Scores Resource Usage (K$)
33 1800 0.46 1022012 40 0.45 1026029 0 0.45 1026011 50 0.44 1031015 60 0.44 1037010 0 0.43 1037025 0 0.43 1037019 70 0.42 10440
7 0 0.41 1044032 0 0.4 1044020 0 0.39 1044039 30 0.39 1047016 0 0.38 1047022 0 0.37 1047024 0 0.36 1047017 40 0.35 1051018 30 0.35 1054023 0 0.33 10540
Summary InfoHarvest’s Priority Mapper supports users in quickly applying the science of multi-criteria decision making to features on a Map. It helps the user understand the effects of the weightings they entered in the MCDA model on the resulting prioritization. When resources are finite, it helps the user visualize the geographic impact of both the prioritization and the resource limits. It is particularly useful in helping prioritize large numbers of features for inclusion in a budget. By providing a quick, transparent approach to prioritization, Priority Mapper supports timely, even-handed way for non-programmers to develop and communicate prioritizations of actions, assets or tasks.