introduction to pttep
TRANSCRIPT
Energy Partner of Choice
Introduction to PTTEP15 September 2020

Energy Partner of Choice
Forward-looking Information
The information, statements, forecasts and projections contained herein reflect the Company’s current views with respect to future events and financial performance. These views are based
on assumptions subject to various risks. No assurance is given that these future events will occur, or that the Company’s assumptions are correct. Actual results may differ materially from
those projected.
Petroleum Reserves Information
In this presentation, the Company discloses petroleum reserves that are not included in the Securities Exchange and Commission of Thailand (SEC) Annual Registration Statement Form 56-
1 under “Supplemental Information on Petroleum Exploration and Production Activities”. The reserves data contained in this presentation reflects the Company’s best estimates of its
reserves. While the Company periodically obtains an independent audit of a portion of its proved reserves, no independent qualified reserves evaluator or auditor was involved in the
preparation of reserves data disclosed in this presentation. Unless stated otherwise, reserves are stated at the Company’s gross basis.
This presentation may contain the terms “proved reserves” and “probable reserves”. Unless stated otherwise, the Company adopts similar description as defined by the Society of Petroleum
Engineers.
Proved Reserves - Proved reserves are defined as those quantities of petroleum which, by analysis of geological and engineering data, can be estimated with reasonable certainty to be
commercially recoverable, from a given date forward, from known reservoirs and under current economic conditions, operating methods, and government regulations.
Probable Reserves - Probable reserves are defined as those unproved reserves which analysis of geological and engineering data suggests are more likely than not to be recoverable.
Disclaimer
2

Energy Partner of Choice
Key Financial Factors
Oil&Gas Overview
PTTEP’s Overview

Energy Partner of Choice
PTT’s Business Value Chain
4
Energy Partner of Choice
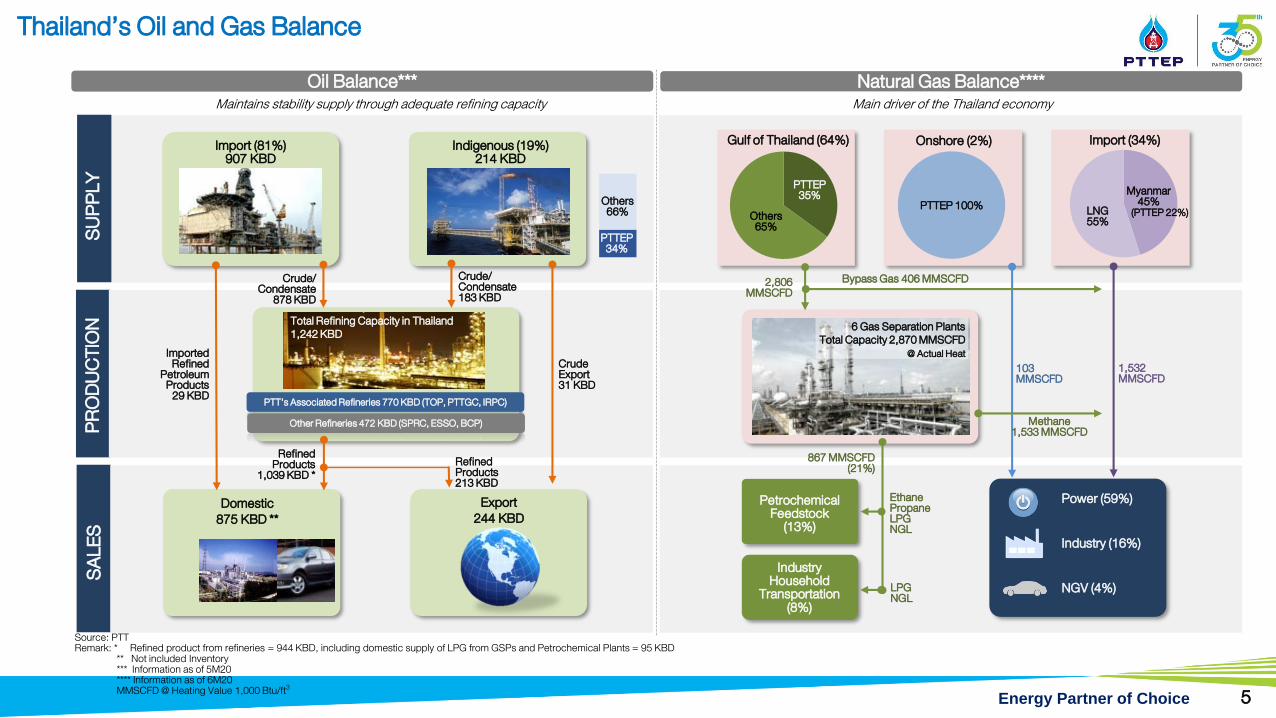
Thailand’s Oil and Gas Balance
SUPP
LYPR
ODUC
TION
SALE
SOil Balance*** Natural Gas Balance****
Import (81%)907 KBD
Indigenous (19%)214 KBD
PTT’s Associated Refineries 770 KBD (TOP, PTTGC, IRPC)
Other Refineries 472 KBD (SPRC, ESSO, BCP)
Crude/Condensate
878 KBDCrude/Condensate183 KBD
ImportedRefined
PetroleumProducts
29 KBD
CrudeExport31 KBD
Export244 KBD
Domestic875 KBD **
Refined Products
1,039 KBD *RefinedProducts213 KBD
Source: PTTRemark: * Refined product from refineries = 944 KBD, including domestic supply of LPG from GSPs and Petrochemical Plants = 95 KBD
** Not included Inventory*** Information as of 5M20**** Information as of 6M20MMSCFD @ Heating Value 1,000 Btu/ft3
PTTEP35%
Others65%
Gulf of Thailand (64%) Onshore (2%) Import (34%)Onshore (2%)
Myanmar45%
(PTTEP 22%)LNG55%
2,806MMSCFD
Bypass Gas 406 MMSCFD
103MMSCFD
PetrochemicalFeedstock
(13%)
Industry Household
Transportation(8%)
EthanePropaneLPGNGL
LPGNGL
867 MMSCFD(21%)
1,532MMSCFD
Methane1,533 MMSCFD
Maintains stability supply through adequate refining capacity Main driver of the Thailand economy
Total Refining Capacity in Thailand1,242 KBD
Power (59%)
Industry (16%)
NGV (4%)
6 Gas Separation PlantsTotal Capacity 2,870 MMSCFD
@ Actual Heat
PTTEP 100%
PTTEP34%
Others66%
5

Energy Partner of Choice
E&P BusinessCapital intensive and high risk
การส ารวจทางธรณวทยาและธรณฟสกสดวยการวดคลนไหวสะเทอน (Seismic Survey)
การเจาะหลมส ารวจ (Drill exploration well)
การเจาะหลมประเมนผล (Drill appraisal wells)
การพฒนาแหลงปโตรเลยม (Field Development)
การผลตปโตรเลยม (Production)
การรอถอน (Abandonment)
การค
นพนท
(R
elin
qu
ish
me
nt)
มศกยภาพ (Good Prospect)
พบปโตรเลยม (Discovery)ไมพบ (Dry)
ไมมศกยภาพ(Not good)
คมคาในเชงพาณชย (Commercial)ไมพบหรอ ไมคมคา
(Dry / Subcommercial)
โอกา
สทจะ
ส าเรจ
นอย
มาก
6

Energy Partner of Choice
Production Phase
20 + 10 Years
Development Phase
3 to 5 Years
Exploration Phase
6 + 3 Years
High
1 Year
Risk
Accumulated Cost
Low
Petro
leum
Conc
essio
n Pe
riod
Upstream Oil & Gas Exploration and ProductionPhases vs. Risks
7

Energy Partner of Choice
Petroleum Classification
8
Energy Partner of Choice
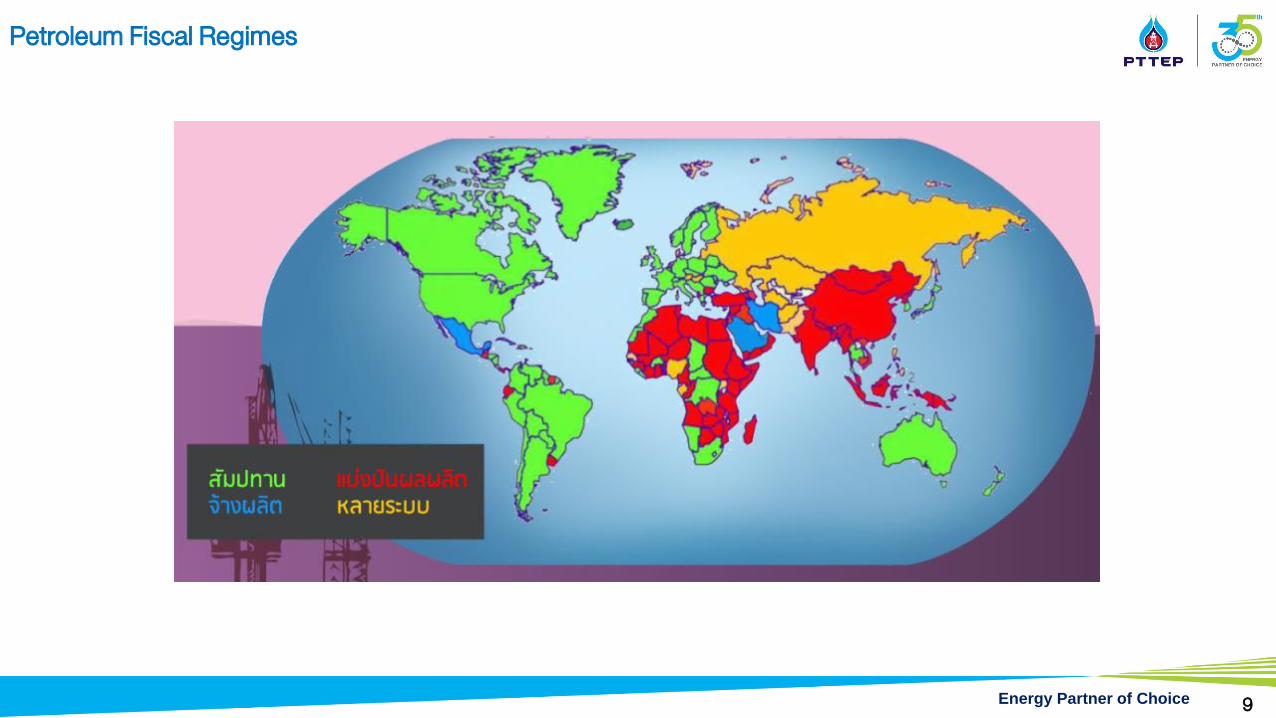
Petroleum Fiscal Regimes
9

Energy Partner of Choice
Concessions vs. PSCsSimilarities and Differences
หวขอ ประเดน สมปทาน สญญาแบงปนผลผลต1 Risk and Reward ผรบสมปทานรบความเสยงในการด าเนนงานฝายเดยว ขนอยกบเงอนไขในสญญา
2 ความเปนเจาของ/กรรมสทธ
ปโตรเลยมทผลตได เปนกรรมสทธของผรบสมปทาน รฐกบผรบสญญาแบงกน ตามขอตกลง
ทรพยสน เปนของผรบสมปทาน เปนของรฐ
ขอมล เปนของผรบสมปทาน เปนของรฐ
3 การบรหารจดการ
แผนงานและงบประมาณ N/A ขออนมตจากรฐ
การบรหารจดการ เปนอ านาจของผรบสมปทานมคณะกรรมการจดการตงขนจากตวแทนของรฐ และผรบสญญา
การจดซอจดจาง เปนอ านาจของผรบสมปทานจดท าและน าสงแผนการจดซอจดจางประจ าป พรอมกบแผนงานและงบประมาณเพอใหรฐอนมต
4 คาใชจายในการด าเนนงาน ExpensesCost recovery หกไดไมเกนตามทก าหนด และตองเปนไปตามแผนงานและงบประมาณทไดรบอนมต
10

Energy Partner of Choice
Low Moderate High
MalaysiaIndonesia Std.
ChinaTimor
TurkmenistanBangladesh Guatemala
Egypt Trinidad Azerbaijan
Nicaragua
Belize
AustraliaThailand
US Gulf
Bolivia NZ
Spain
Ireland
Argentina
E. Indo
Columbia
Nigeria
Venezuela
ChilePhilippines
Norway
IndiaG
ove
rnm
en
t Ta
ke(สดส
วนรายไดร
ฐตอผ
ลก าไร)
Low Moderate High
100%
90%
80%
70%
60%
50%
40%
30%
20%
Royalty SystemProduction Sharing Contract (PSC)Service ContractRoyalty + Service Contract
SWEET
TOUGH
แหลงทมาขอมล: Daniel Johnston (2008), กรมเชอเพลงธรรมชาต
Government Revenue Government Take vs. Petroleum Prospectivity
Prospectivity (ศกยภาพปโตรเลยม)
11

Energy Partner of Choice
Thailand Petroleum Act Update Key terms for concession and PSC have been finalized
Concession: Thailand I PSC
Remark: Assuming that cost can be fully recovered. 12
Revenues
Net to Concessionaire
Royalty
Tax
12.5%
100
12.5
Cost
12.5 ((100 - 50)*50%) -12.5
25
50% of taxable income
50
Sales = 100
Royalty= 100*10%=10
Contractor’s Entitlement = 62% 62/100
3
Sales Revenue
10%
Cost recovery Max 50%1
Profit Sharing= 100-10-50=40
30% 70%
Government= 40*70% = 28
Contractor= 40*30% = 12
2 Profit split
Contractor’s Entitlement= 50+12 = 62
20% Tax = (62-50)*20% = 2.4
Cost = 50
Government take = 81%(10+28+2.4)/(100-50)
Net to Contractor = 62-50-2.4 = 9.6
Net to Contractor = 19%9.6/(100-50)
4
Cost Recovery*= 100*50%=50
Net to Concessionaire = 50%25/(100-50)
Government take = 50%(12.5+12.5)/(100-50)
Sales Revenue

Energy Partner of Choice
Example of Gas Price Formula in Thailand
Note: This is simplified price formula, not the actual price
13
Dubai or
HSFO
With lag time adjustment

Energy Partner of Choice
10
30
50
70
90
Jan-19 Apr-19 Jul-19 Oct-19 Jan-20 Apr-20 Jul-20 Oct-20
US$ / Barrel
Oil Price and Global Demand and Supply outlookOil markets fundamentally volatile
Oil price Global Liquid Supply and Demand Outlook
Remark: * Bloomberg Analyst Consensus (CPFC) as of 31 July 2020
Q3 Q42019
Q2Q1 Q3 Q42020
Q2Q1
Analyst Consensus
2019 actualBrent 64.0 US$/BBLDubai 63.0 US$/BBLSpread 1.0 US$/BBL
2020 consensus*
Q3 Brent 38 US$/BBL
FY Brent 40 US$/BBL
2020 1H actualBrent 40.07 US$/BBLDubai 40.72 US$/BBLSpread +0.65 US$/BBL
Million Barrels per Day
Source: Short-term energy outlook, EIA, July 2020
Keys to WatchOPEC+ production
cuts and complianceCOVID-19 Outbreak
& Preventive MeasuresEconomic Recession & Stimulus Measures
Rising tensions between US – China
US shale producers shut-in /bankruptcies
DubaiBrent Min-Max Brent Analyst Consensus*
14

Energy Partner of Choice
Announced New Target
0
2
4
6
8
10
12
14
Jan-18 Jun-18 Nov-18 Apr-19 Sep-19 Feb-20
Operational Impact from lower LNG PricesLower volumes with downside protection from minimum offtake requirements
$/MM
BTU
JKM Spot
PTT Avg. Pool Price
JLC-LNG*
* JLC = Japan LNG Cocktail : Landed LNG price in Japan
Global LNG Outlook
Thailand Gas Demand Outlook
Source: EPPO and PTT (Forecast information as of June 2020)
Source: PTT
Historical Natural Gas and LNG Prices
• The drop in LNG spot prices has encouraged additional LNG imports in Thailand
• Lower gas demand & more LNG imports effect sales volume forecast to be down by 9%
• Impacts are lessen due to the minimum offtake requirements with take-or-pay obligations in the gas sales agreements
Unit: KBOED9% Reduction391
2020 Targeted Sales Volume
• Oversupply likely to continue in short term • In 2023-2024 , demand-supply expected to rebalance and
price to recover
355
Jun-20
15

Energy Partner of Choice
Key Financial Factors
Oil&Gas Overview
PTTEP’s Overview

Energy Partner of Choice
PTTEP: the E&P Flagship of PTT GroupPlays a pivotal role in Thailand’s oil and gas production
Notes:1. 51.1% is directly held by the Government of Thailand (Ministry of Finance), with the remaining 12.2% held by the state-controlled Vayupak Fund I as of 29 May 20202. Ownership as of 14 August 2020
Government of Thailand
Thailand’s national energy company
63.3%1
63.8%2
Credit ratings equivalent to parent and country
S&P Moody’s FITCH TRIS (national rating)
BBB+ Baa1 BBB+ AAA
As PTT’s Upstream Flagship Largest oil and gas producer in Thailand and Myanmar
Synergy with PTT’s gas value chain through its dominant position in the regional gas market
Opportunities to expand into regional investments
94% +99%
78% 14 USD/ BOE
of PTTEP’s total sales volume
Reliability of plants and field facilities*
of PTTEP’s sales volume sold to PTT
Average regional cash cost
Approx. 20 KBOEDof net sales volume
Gas-weighted
Oil-weighted
PTTEP’s operations in SEA
* of PTTEP-operated projects in Gulf of Thailand, excl. planned shutdownAll figures are as of 6M2020
17

Energy Partner of Choice
631 677
1,140
400 351
507
0
500
1,000
1,500
2017 2018 2019
Significantly improved reserve life to over 7 yearsReserves at the Year-end 2019
MMBOE
1,0281,031
Reserves Life*
Proved (P1) Probable (P2)
7.5 Years
10.9 Years2019 by Geography
P1 P1 + P2
2019 by Product Type
Domestic International
Gas Liquid
50%
50% 51%
31%
1,647
1,140
1,647
• Based on total production of natural gas, condensate, and crude oil (including LPG) of 414 KBOED for the year ended December 31, 2019• Figures include reserves from equity method
5-Year Average Proved Reserves Replacement Ratio (RRR) 69%
49%
27%
73%2017 2018 20190.58x 0.74x 1.53X
P1 P1 + P2
1,140
1,647
18

Energy Partner of Choice
2030 Aspiration TargetsAchievable through “Execute” and “Expand” Strategy
Energy Partner of Choicethrough competitive performance and innovation for long-term value creation
Strengthen Core Business
• Top Quartile Unit Cost (25 US$/BOE)
• Production 5% CAGR • Cost optimization• Synergy value creation
Diversify toNew Business
• Scale up ARV• Expand to Power Business • Invest in future technology
20% Net Incomefrom New Business
Transform to the New Normal
• Implement Transformation project
• Redesign Human Resources
• Efficiency improvement• Top Quartile Manpower
GrowE&P portfolio
R/P 7 years
Capture opportunity during crisis (Exploration, M&A)
Drive LNG Value Chain
• Reshape LNG strategy • Synergy with PTT group
JV Investment & Marketing Capability
19

Energy Partner of Choice
Diversified international portfolio
Opportunities in an early phase:• Deepwater exploration in Brazil
and Mexico with prominent and prudent operators
North & South America
An area for growth, key projects include:• Production: Algeria’s Bir Seba oil field with
current flow rate of approximately 17 KBPD • Development : Algeria’s Hassi Bir Rakaiz
with target 1st phase production in 2021 Mozambique Area 1 with target first cargo in 2024
AfricaPotential gas development• Sizable undeveloped gas
resources in Timor Sea
Australasia
Second heartland to PTTEP• 24% of total sales volume mainly from
Malaysia and Myanmar• 3rd Largest by resources size in Malaysia
with significant gas discovery in Sarawak SK 410B Project
• Gas production in Myanmar mostly supplied into Thailand
• Other producing assets in Vietnam (oil) and Indonesia (gas)
Southeast Asia
LNGOil
Oil sands
ThailandPTTEP’s core production base• 70% of total sales volume • Key producing assets include Bongkot,
Arthit, Contract 4 and S1• Bongkot (G2/61) and Erawan (G1/61) are
in transition process to ensure production continuity
Thailand50%
Other4%
Africa&ME17%
SE Asia29%
Total Assets USD 21.8 billion
Book Value of Assets (by region)
as of 6M 2020
Deepwater
Piped Gas
Presence in UAE and Oman:• 2 offshore exploration blocks partnered
with experienced operator, ENI in Jan 2019• 3 onshore blocks including PDO (Block 6),
the largest producing oil asset in Oman
Middle East
Deepwater Gas(LNG)
First presence in Kazakhstan:• Production: Dunga onshore oil
field from the acquisition of Partex in 2019
Central Asia
Information as of 30 June 2020
20

Energy Partner of Choice
Key Financial Factors
Oil&Gas Overview
PTTEP’s Overview

Energy Partner of Choice
15.11 15.88 14.33
0
10
20
30
246,457 273,980 242,072
51,57170,560
82,6927,494 6,111 20,443
0
100,000
200,000
300,000
400,000
Rest of World
Other SEA
Thailand
BOED 305,522
2018
350,651
6M 20202019
Sales Volume & Unit CostLower sales volume from lower demand with competitive cost
DD&A 16.58 15.83 16.29
Finance Cost 2.14 1.84 2.00
Royalties 4.21 4.27 3.20
G&A 2.57 2.91 1.98
Exploration Expenses 0.41 1.00 1.10
Operating Expenses 5.78 5.86 6.05
Lifting Cost 4.33 4.31 4.40
Gas ($/MMBTU) 6.42 6.92 6.64Liquid ($/BBL) 67.40 61.18 40.80Weighted Avg. ($/BOE) 46.66 47.24 40.15Avg. Dubai ($/BBL) 69.65 63.51 40.72Avg. HSFO ($/BBL) 67.01 58.60 36.26(High Sulphur Fuel Oil)
Volume Mix (Gas : Liquid) 72 : 28 71 : 29 67 : 33Revenue Mix (Gas : Liquid) 59 : 41 62 : 38 66 : 34
Unit Cost
Note: Exclude costs related to new business and applied Thai Financial Reporting No. 16 (TFRS 16: Lease), effective 1 Jan 2020 The formulas for calculating ratios are provided in the supplementary section for your reference
$/BOE
6M 2020
Cash Cost
Unit Cost
31.7131.69
Sales Volume and Price
2018 2019
30.62
345,207
22

Energy Partner of Choice
Weighted AverageCost of Debt (%) 4.41 3.74
[Fixed : Floating] [82 : 18] [82 : 18]Average Loan Life (Years) 13.84 14.59
US$100% US$
100%
11,841 11,691
3,442 3,882
7,002 6,195
0.29 0.33
0.00
0.20
0.40
0.60
0.80
1.00
0
5,000
10,000
15,000
20,000
25,000
FY 2019 Q2 2020Equity (LHS) Interest Bearing Debt (LHS)Other Liabilities (LHS) Gearing Ratio D/E (RHS)
MMUSD D/E Ratio
Remark: Debt profile excludes Hybrid bonds
Capital Structure
Debt Profile
Assets
22,285 21,768
Cash flows and Financial Position
Healthy balance sheet at competitive leverage level6M 2020 : Source and Use of Funds
0
1,000
2,000
3,000
4,000
5,000
2019 Sources Uses Q2 2020
3,0233,090
Operating cash flow
2,063*
CAPEX
Repayment of Bonds and Hybrid Bonds
Dividend paid
1,996**
Remark: * Net of adjustment for the effect of exchange rate changes on cash and cash equivalents** Excludes cash flows for investing in short-term investments (Fixed deposit > 3 months)
Healthy operating cash flow
MMUSD
Debenture issuanceOthers
23

Energy Partner of Choice
Dividends and Outlook
2020 Guidance
~ 6.0
Average Sales Volume*KBOED
Average Gas PriceUSD/MMBTU
Unit CostUSD/BOE
65-70 %EBITDA Margin% of sales revenues
~ 355FY 2020
Strong gas price with competitive unit cost
Note: * Include sales volume from ADNOC Gas Processing (AGP)
Based on average Dubai oil price in 2020 at 38 $/BBL
~ 30
~ 6.1
~ 340Q3 2020
Dividend Payment History
Payout Ratio (% of net income)
98 90 35 55 46
Payout Ratio (% of recurring
net income)
79 64 38 51 45
0.75 1.50 1.75 2.25 1.50
2.502.75
3.253.75
0.00
2.00
4.00
6.00
2016 2017 2018 2019 2020
Policy : No Less Than 30% of Net Income
1H 2H
THB per share
3.25
5.004.25
XD Date 13 August 2020Record date 14 August 2020Payment Date 28 August 2020
6.00
24

Energy Partner of Choice
Info Graphic- สาระนารกบ ปตท.สผ. ตอนท 1: วธบรหารจดการเพอ
ลดผลกระทบของราคาน ามนทตกตา- สาระนารกบ ปตท.สผ. ตอนท 2: มาทาความรจกกบ
DD&A- สาระนารกบ ปตท.สผ. ตอนท 3: ปตท.สผ. ทา Oil
Price Hedging เพออะไร
Please see in link https://www.pttep.com/th/Investorrelations/Generalinformation/Toolkits.aspx
Video - “มาทาความเขาใจกบ Non-recurring Items ทสงผล
กระทบตอผลประกอบการของ ปตท.สผ.” (มการอธบายถง impairment กบ deferred tax ดวย)
- PTTEP 101 ตอนท 1 : กวาจะมาเปนกาไรสทธ (Net Income)
Please see in link https://pttep.listedcompany.com/mediacast/company/infographic.mp4
https://www.youtube.com/watch?v=dM2ayG3SJQU&feature=youtu.be
25

Energy Partner of Choice
+66 2 537 4000
http://[email protected]
You can reach the Investor Relations team for more information and inquiry
through the following channels
Thank you and Q&A

Energy Partner of Choice
Thailand UpdatesDomestic gas volume suppressed by LNG import; THB fluctuation continues
Consensus on the exchange rate mostly depends on o The concern on the second wave of COVID-19 outbreako Additional monetary policies from BOT and easing lockdown
restriction will boost economic growtho Capital outflows of bond and stock markets into safer assets
Source: Bank of Thailand, Bloomberg
Exchange Rate Movement (THB/USD)
Forecast based on Bloomberg Consensus as of 30 August 2020
57%
57%
56%
4%
3%
3%
18%
17%
18%
13%
12%
12%
9%
10%
10%
0% 20% 40% 60% 80% 100%
FY20
18FY
2019
6M20
20
Natural Gas Hydro Electricity Coal & LigniteImported Renewable Energy
Thailand Energy Overview
Natural Gas Consumption
GWH
204,428
212,050
105,231
Natural Gas Supply
Electricity Generation
o Lower energy demand from COVID-19 outbreak
o More LNG imports from low LNG spot prices
o Slight decline from Myanmar piped gas imports due to natural decline
Source: EPPO
Domestic
Domestic
Domestic
Myanmar
Myanmar
Myanmar
LNG
LNG
LNG
0 1,000 2,000 3,000 4,000 5,000
FY 20
18FY
2019
6M20
20
MMSCFD
4,676
5,017
4,912
Electricity
Electricity
Electricity
Industry
Industry
Industry
GSP
GSP
GSP
NGV
NGV
NGV
0 1,000 2,000 3,000 4,000 5,000
FY 20
18FY
2019
6M20
20
MMSCFD
4,424
4,762
4,676
27

Energy Partner of Choice
Thailand’s Energy Value ChainPTTEP contributes almost 1/3 of Thailand’s petroleum production
Source: Energy Policy and Planning Office (EPPO) and Department of Mineral Fuels (DMF)
6M2020 Thailand’s Oil and Gas Demand Midstream6M2020 Thailand Petroleum Production
8%
PTTEP34%
Others66%
% by Petroleum Type and Area
% Production by Company
Transmission PipelinesGas Separation Plants
Gas: operated by PTT
Refineries
Oil: PTT participates through subsidiaries
Petrochemicals Oil and gas marketing
by Type by Area
Liquid 29%
Gas 71% Offshore
92%
Onshore 8%Crude Oil & Condensate
Natural Gas
Imports~ 81%
Domestic ~ 19%
Imports ~ 31%
Domestic~ 69%
~ 1.0m BOE/D
~ 0.8m BOE/D
Downstream
28