introduction to research - dietetic internships intern site · introduction to research robert...
TRANSCRIPT

REPLACE
THE IMAGE:
Right click >
Background
layout…
Select Filling
with image or
texture
Insert from…
File button
Select your
picture
Close window
On a dark
background
remove the
STOP Hunger
color logo
Introduction to Research Robert Zurfluh, RDN

About me
• Undergrad from Rutgers University • Dietetic internship Allentown campus • Worked as a Registered Dietitian in
sub-acute rehabilitation, LTC, private practice • Clinical research at Rutgers • Completing MS in Nutrition at University of Saint Joseph
Contact info

Objectives
• Review • Research Terminology • Statistics
• Practice finding Peer Reviewed Research
• Discuss how to critically evaluate Research
• Review PRP Assignment Expectations

Why you should care about research

Why you should care about research
• Dietetics and Nutrition is Science based
• It is a “new” Science
• Clinical practice and standards constantly change
• Need to know research for RD/RDN exam
Some Questions to start us off

What is a hypothesis?

What is a hypothesis?
What does RCT stand for?

What is a hypothesis?
What does RCT stand for?
What does “peer-reviewed” journal mean?
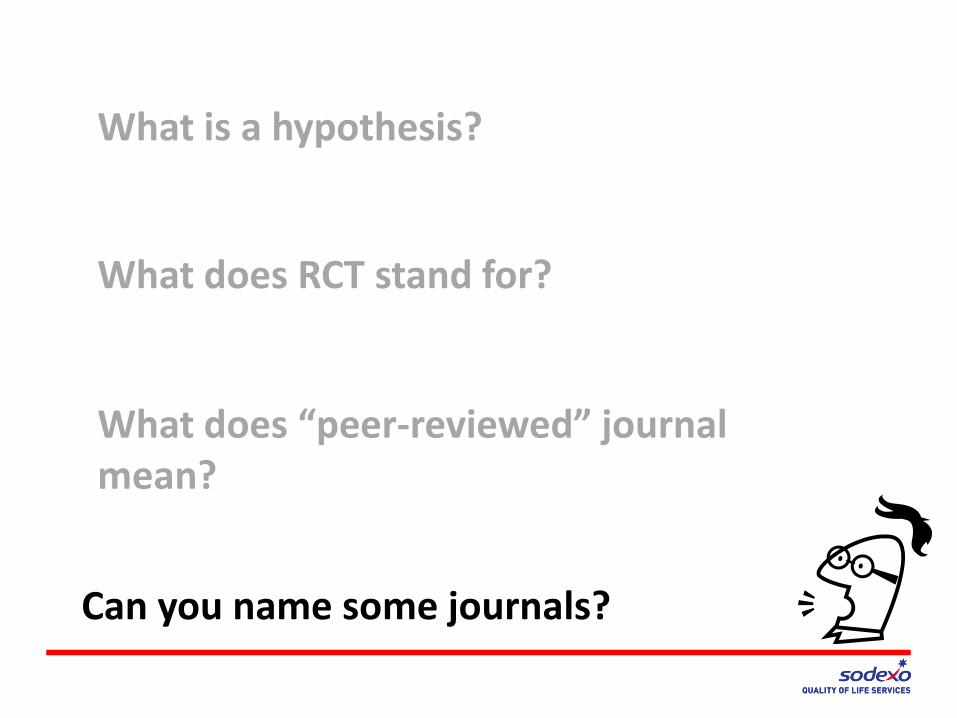
What is a hypothesis?
What does RCT stand for?
What does “peer-reviewed” journal mean?
Can you name some journals?

Types of Research
• Historical
Looks at historical sources; examines the past.
• Basic
Also known as fundamental or pure research. Increases basic understanding of principles.
• Applied
Uses research to examine real world problems through. Randomized Clinical Trials Outcomes Research
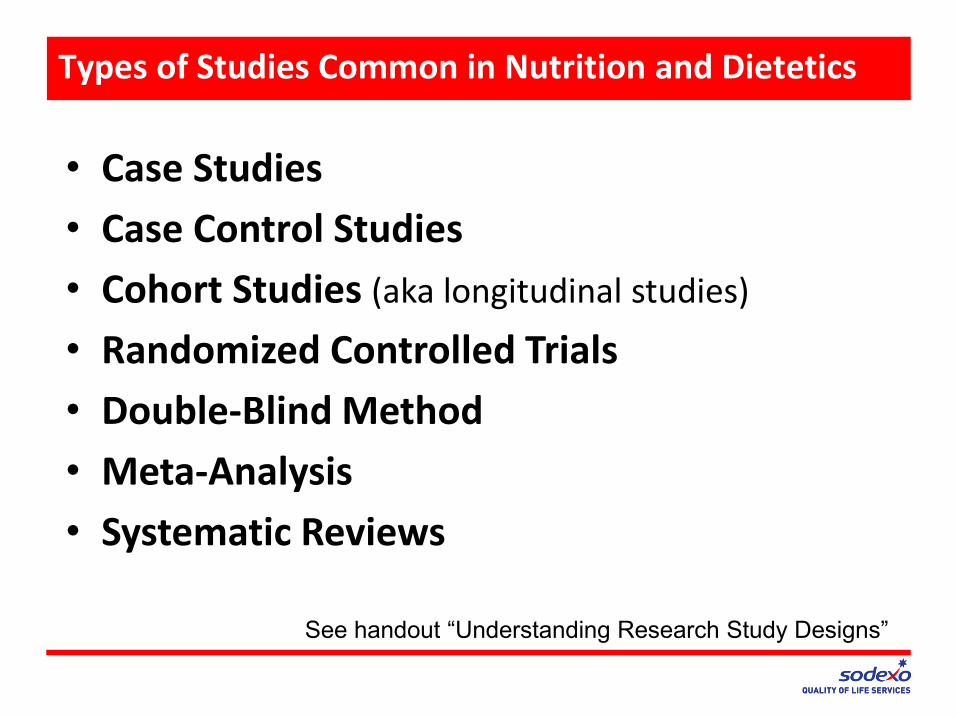
Types of Studies Common in Nutrition and Dietetics
• Case Studies
• Case Control Studies
• Cohort Studies (aka longitudinal studies)
• Randomized Controlled Trials
• Double-Blind Method
• Meta-Analysis
• Systematic Reviews
See handout “Understanding Research Study Designs”
Lies, Damned Lies and Statistics -Mark Twain

Basic Statistics
• Descriptive: describes characteristics of a sample
• Measures of Central Tendency: shows what is the most typical data
Mean Median Mode Range

Basic Statistics
• Descriptive: describes characteristics of a sample
• Measures of Central Tendency: shows what is the most typical data
Mean Median Mode Range
Example:
13,13,13,13,14,14,16,18,21
Mean = 15
Median = ___
Mode = ___
Range = ___

Standard Deviation – “Average Distance from Mean”
The standard normal distribution has a standard deviation of 1 with a mean of 0
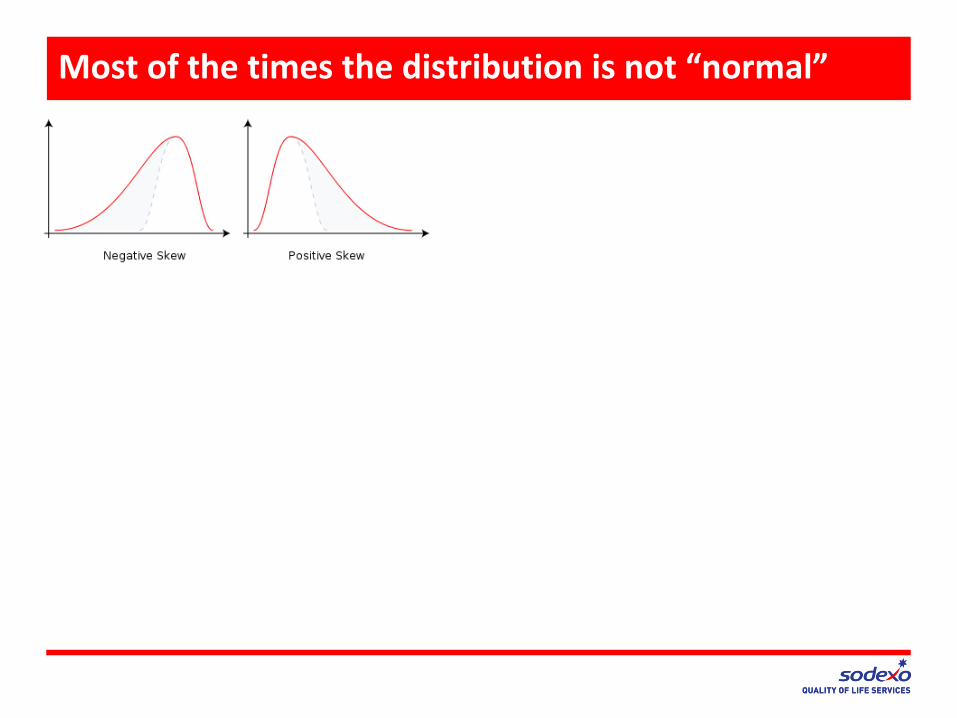
Most of the times the distribution is not “normal”
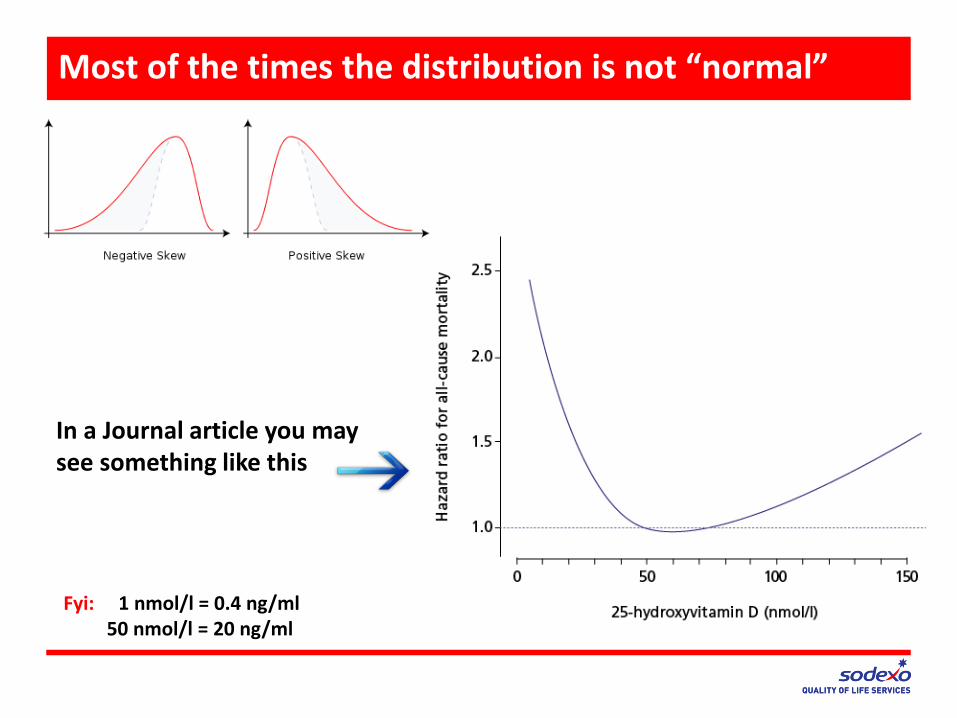
Most of the times the distribution is not “normal”
In a Journal article you may see something like this
Fyi: 1 nmol/l = 0.4 ng/ml 50 nmol/l = 20 ng/ml

Correlations
Measure of association between two continuous variables-common in nutrition
• Positive correlation (+) both variables are either high or low
• Negative correlation (-) one variable is high and the other is low
• No correlation no linear association between variables

Correlations
Measure of association between two continuous variables-common in nutrition
• Positive correlation (+) both variables are either high or low
• Negative correlation (-) one variable is high and the other is low
• No correlation no linear association between variables
Positive Negative No correlation
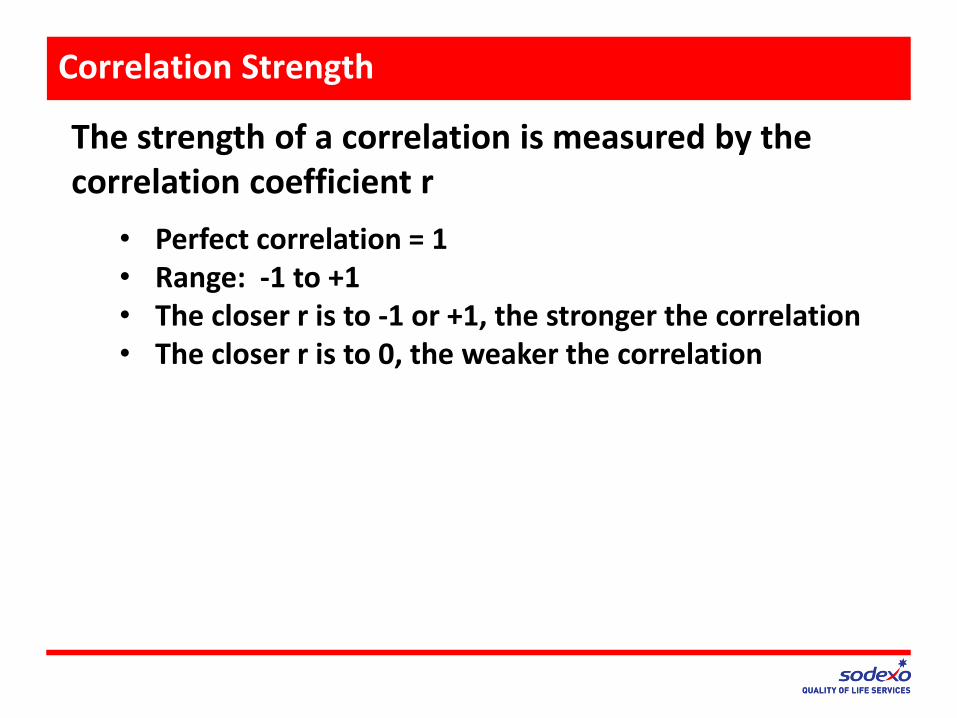
Correlation Strength
The strength of a correlation is measured by the correlation coefficient r
• Perfect correlation = 1 • Range: -1 to +1 • The closer r is to -1 or +1, the stronger the correlation • The closer r is to 0, the weaker the correlation

Correlation Strength
The strength of a correlation is measured by the correlation coefficient r
• Perfect correlation = 1 • Range: -1 to +1 • The closer r is to -1 or +1, the stronger the correlation • The closer r is to 0, the weaker the correlation

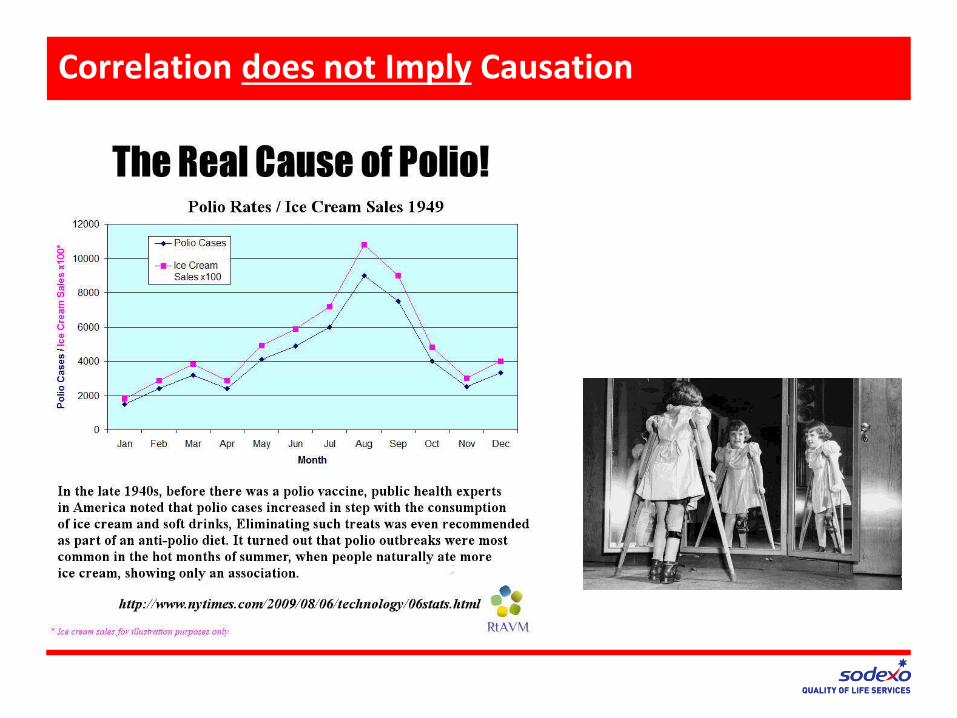
Correlation does not Imply Causation

Correlation does not Imply Causation
Correlation does not Imply Causation

Inferential Statistics
Select Sample from Population
Sample (Stats)
Inferential Stats
Population (start)
Studies can be used to make inferences (predictions) about a population based on a study sample.

Inferential Statistics
Select Sample
(Allentown orientation)
Sample stats (100% of you don’t
smoke cigarettes)
Inferential stats (dietetic interns don’t
smoke cigarettes)
Population of interest (all dietetic
interns)
For example: Q: Do dietetic interns smoke cigarettes?
Statistical Methodology
Statisticians have countless ways to analyze data. You may have learned about student t-test, ANOVA, and significance in your undergrad. Other terms commonly encountered include Chi Square, Spearman’s rank, Statistical Power, t-score, Tukey’s test of significance, Z-score, …

Statistical Methodology
Statisticians have countless ways to analyze data. You may have learned about student t-test, ANOVA, and significance in your undergrad. Other terms commonly encountered include Chi Square, Spearman’s rank, Statistical Power, t-score, Tukey’s test of significance, Z-score, …
You do not need to know any of these, except…
Statistical Significance (p-value)
• Usually p of less than 0.05 means there is statistically significant difference
• p is a measure of probability / chance. A p-value of < 0.05 means that the difference between the groups due to chance would be observed less than 5 out of 100 times (less than 5%).
If you remember one thing from this class, make sure you understand the p-value
Statistical Significance (p-value)
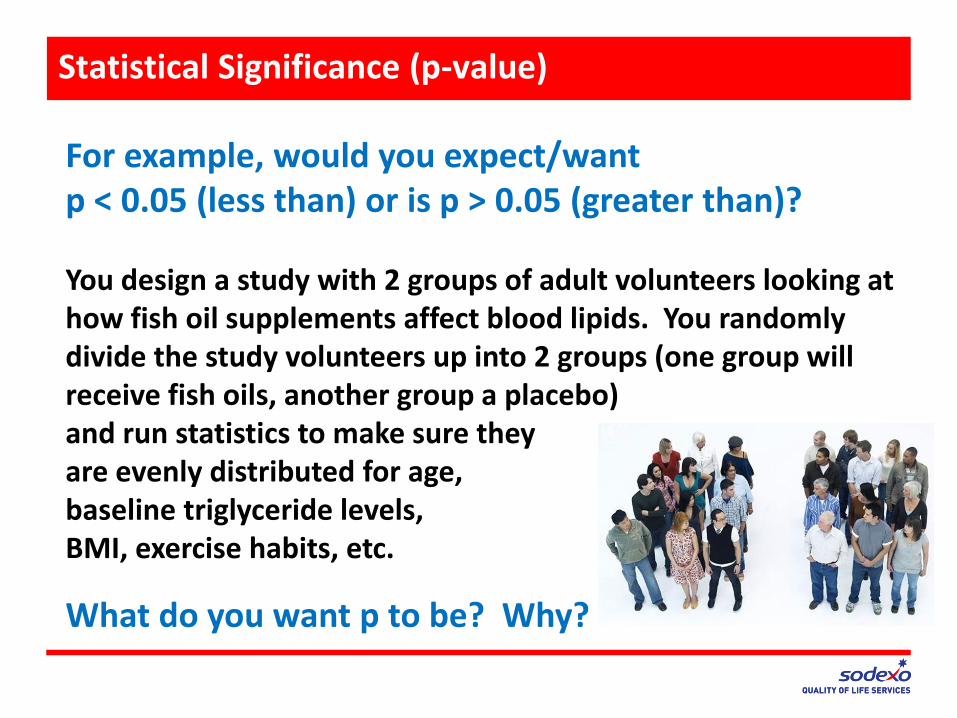
For example, would you expect/want p < 0.05 (less than) or is p > 0.05 (greater than)?
You design a study with 2 groups of adult volunteers looking at how fish oil supplements affect blood lipids. You randomly divide the study volunteers up into 2 groups (one group will receive fish oils, another group a placebo) and run statistics to make sure they are evenly distributed for age, baseline triglyceride levels, BMI, exercise habits, etc.
What do you want p to be? Why?

Statistical Significance (p-value)
Statistical Significance (p-value)
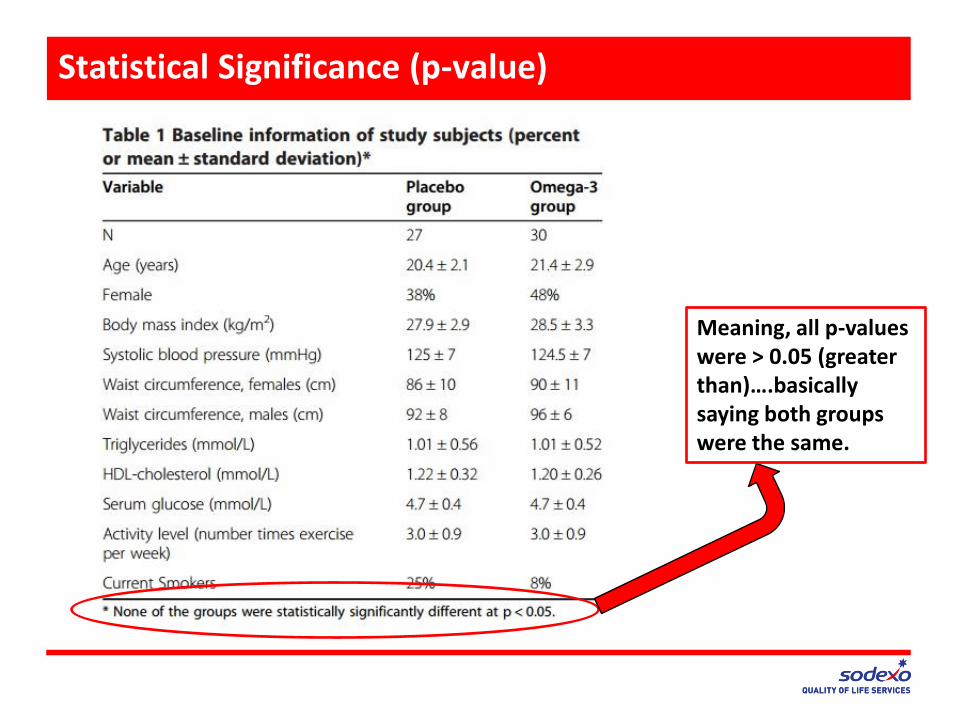
Meaning, all p-values were > 0.05 (greater than)….basically saying both groups were the same.

Statistical Significance (p-value)
That was for your 2 volunteer groups, but what about the results of your study?
Let’s say your study measures fatty acids in the red blood cell phospholipid bilayer of the study participants.
What do you want p to be for the results between the placebo group and the treatment group? Why?

Statistical Significance (p-value)
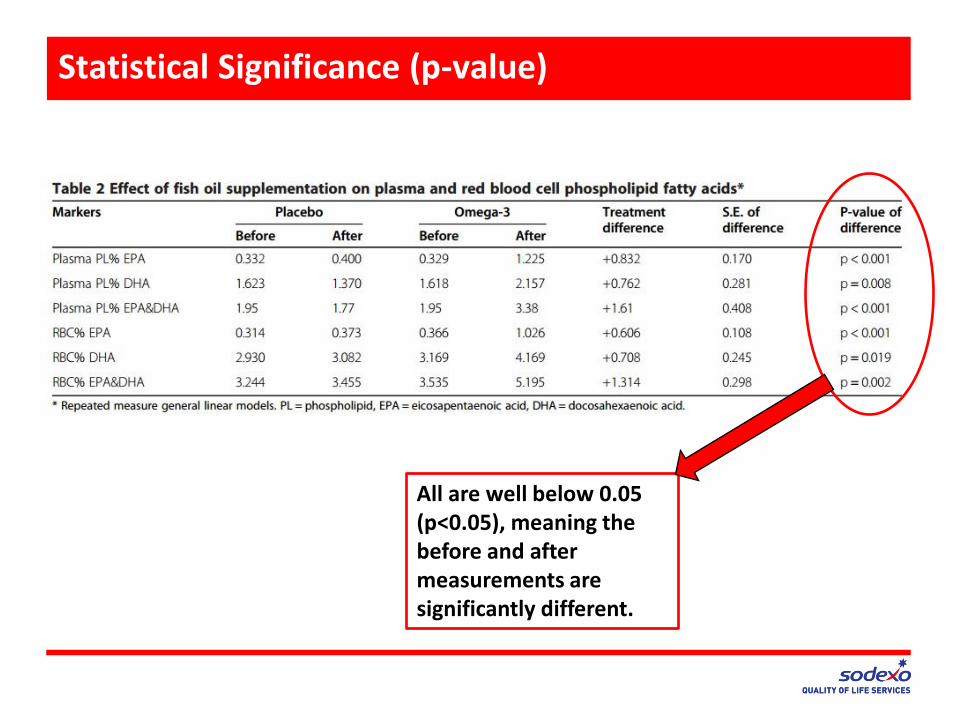
Statistical Significance (p-value)
All are well below 0.05 (p<0.05), meaning the before and after measurements are significantly different.

Statistical Significance (p-value)
One more results slide. What does this tell us?

Statistical Significance (p-value)
Does statistical significance mean clinical significance?

Let’s watch a Ted Talk
Take a 5-minute break
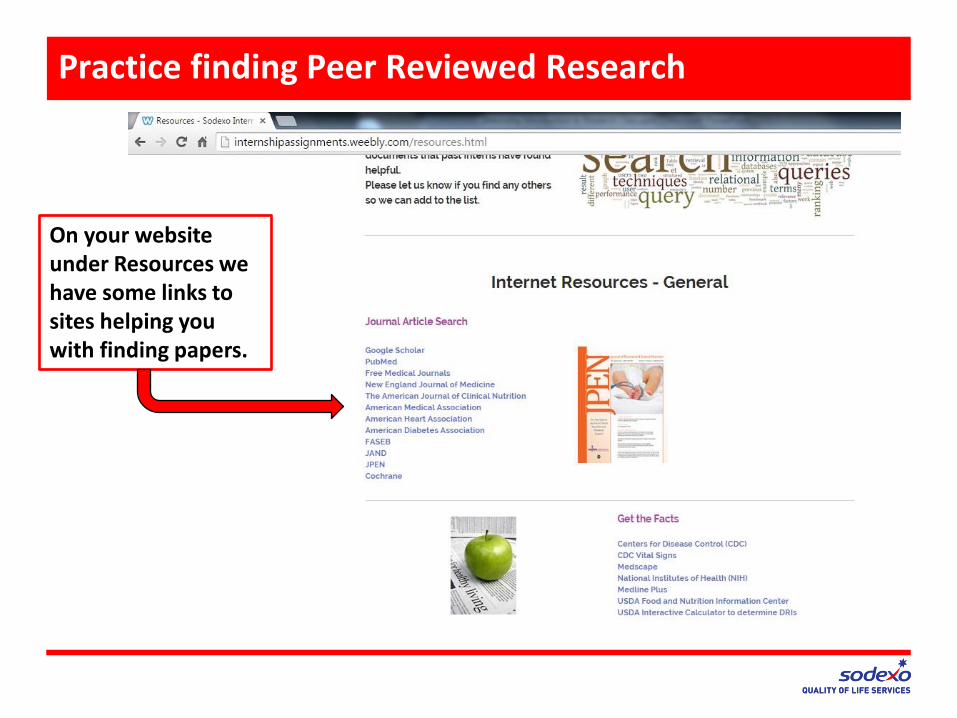
Practice finding Peer Reviewed Research
On your website under Resources we have some links to sites helping you with finding papers.

Practice finding Peer Reviewed Research
Let search online for and using …
and
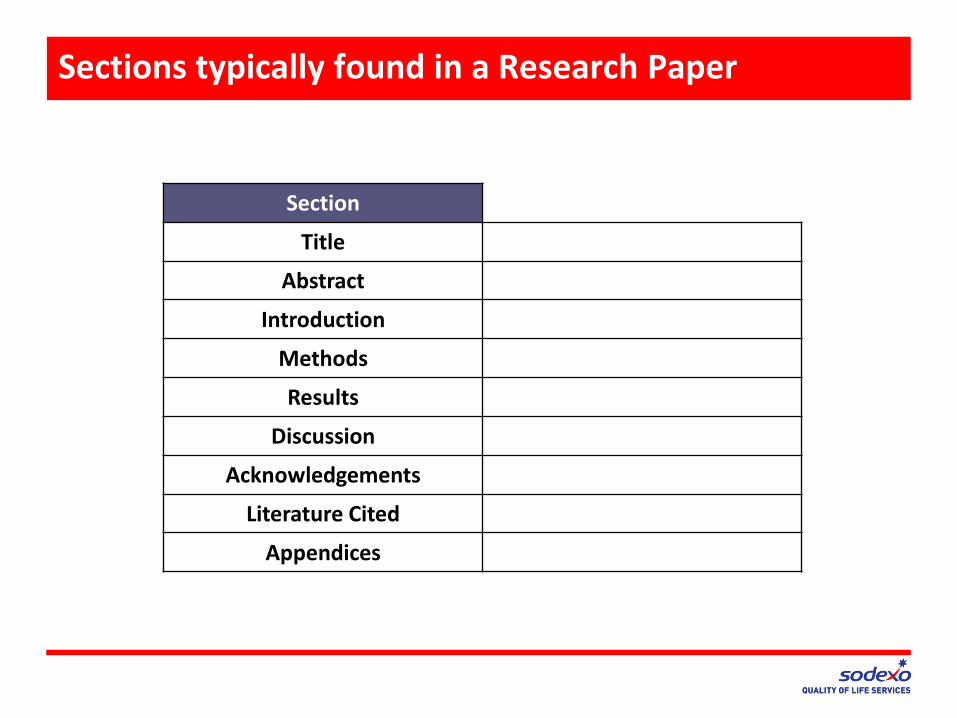
Sections typically found in a Research Paper
Section
Title
Abstract
Introduction
Methods
Results
Discussion
Acknowledgements
Literature Cited
Appendices
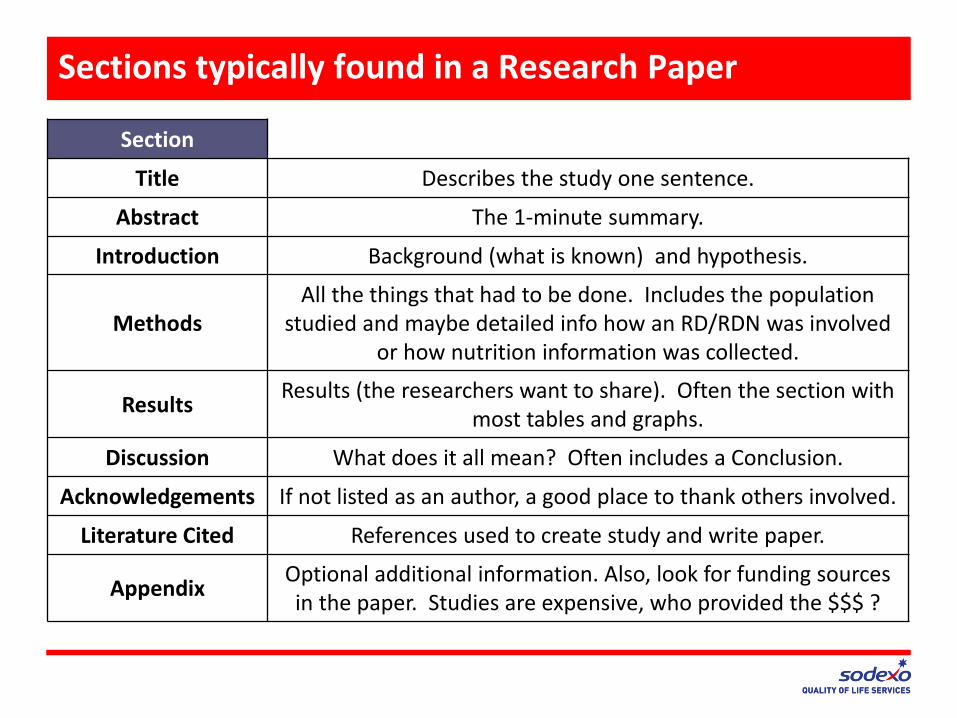
Sections typically found in a Research Paper
Section
Title Describes the study one sentence.
Abstract The 1-minute summary.
Introduction Background (what is known) and hypothesis.
Methods All the things that had to be done. Includes the population
studied and maybe detailed info how an RD/RDN was involved or how nutrition information was collected.
Results Results (the researchers want to share). Often the section with
most tables and graphs.
Discussion What does it all mean? Often includes a Conclusion.
Acknowledgements If not listed as an author, a good place to thank others involved.
Literature Cited References used to create study and write paper.
Appendix Optional additional information. Also, look for funding sources in the paper. Studies are expensive, who provided the $$$ ?
Read the Paper critically
A few (of many) questions to keep in mind while reading peer-reviewed journal articles

Read the Paper critically
A few (of many) questions to keep in mind while reading peer-reviewed journal articles How recent is the study, and what was the population?
(is it applicable to the US?)
Who funded the study?
Could someone else re-create it using the Methods (and Materials) section?
Were the results easy to understand or confusing?
What were the limitations of the study mentioned? Were there other ones not mentioned?

One final slide before reviewing PRP assignment
One more Question Researchers ask: When reading an article the question comes up if this peer-reviewed published study is valid and reliable?
Validity a test’s ability to measure what it is
supposed to measure • Accuracy
quantitative measure of the validity of the test
Reliability reproducibility of test results
• Precision quantitative measure of reliability
Acc
ura
cy
Precision

Your PRP assignment
Find it under
Core Assignments
Clinical Rotations
General Clinical
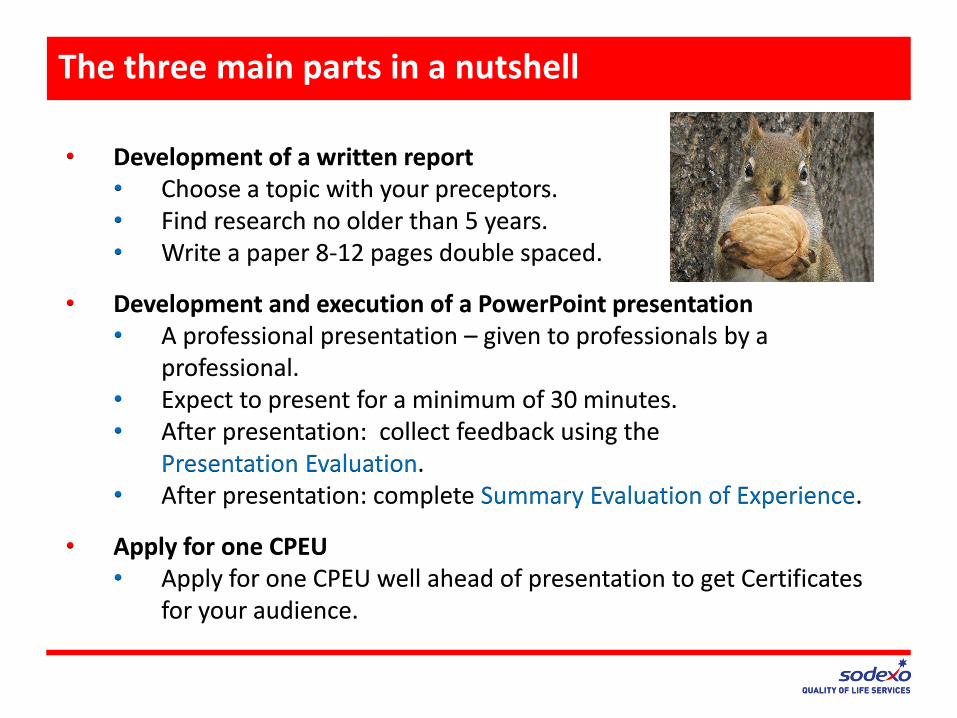
The three main parts in a nutshell
• Development of a written report • Choose a topic with your preceptors. • Find research no older than 5 years. • Write a paper 8-12 pages double spaced.
• Development and execution of a PowerPoint presentation • A professional presentation – given to professionals by a
professional. • Expect to present for a minimum of 30 minutes. • After presentation: collect feedback using the
Presentation Evaluation. • After presentation: complete Summary Evaluation of Experience.
• Apply for one CPEU • Apply for one CPEU well ahead of presentation to get Certificates
for your audience.

PRP Deadlines – Check Assignment Checklist
General Checklist and Deadlines --- Check Assignment Checklist for campus specific info ---
Prior to giving to your presentation
____ Topic sent for approval early on ____ Date / time / room secured ____ Rough draft of paper submitted (2 weeks before presentation) ____ Final draft of paper submitted ____ Presentation PPT outline and draft submitted (2 weeks before presentation) ____ Final Presentation PPT sent submitted ____ if applicable, send copy of any handouts created ____ CPEU Application filled out and sent back to your campus director (due 2 weeks before presentation)
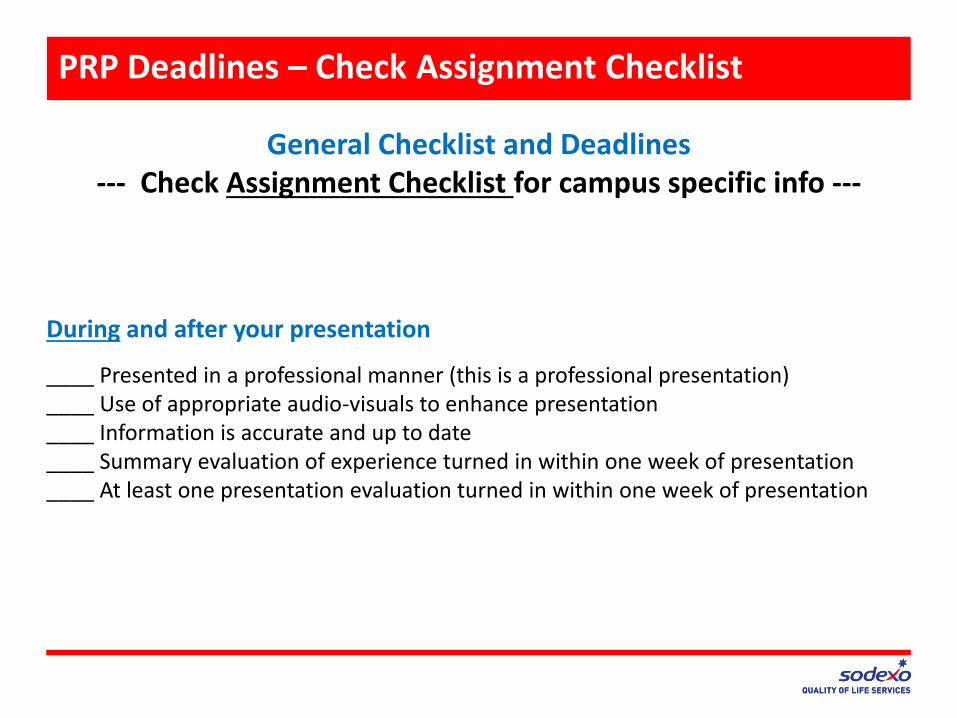
PRP Deadlines – Check Assignment Checklist
General Checklist and Deadlines --- Check Assignment Checklist for campus specific info ---
During and after your presentation
____ Presented in a professional manner (this is a professional presentation) ____ Use of appropriate audio-visuals to enhance presentation ____ Information is accurate and up to date ____ Summary evaluation of experience turned in within one week of presentation ____ At least one presentation evaluation turned in within one week of presentation