introduction to road soil characterization - u of s ... course notes-march 17-19 201… ·...
TRANSCRIPT
1
Introduction to Road Soil CharacterizationCharacterization
By:Dr. Curtis F. Berthelot P.Eng.
Department of Civil and Geological EngineeringC t f E ll f T t ti d I f t tCentre of Excellence for Transportation and Infrastructure
Road Soil Introduction
Roads are constructed of layered heterogeneous multiphase geo-materials that exhibit internal friction,
h i dil i d i l l i b h icohesion, dilation, and viscoelastoplastic behavior under load.
Behavior is often influenced by confinement because the material is non-linear stress dependent.
Several methods have evolved to quantify performance-related properties or road soils.
Road Soil Characterization2

2
Granular Pavement Structure
Asphalt wearing coarse
S bbGranular Base
Subgrade: in-situ material used to construct grade. Subbase: select material (usually low quality granular)
that is borrowed from a pit and placed over the b d
Subgrade
Subbase
Road Soil Characterization3
subgrade. Base: high quality granular layer placed directly under
asphalt concrete. Wearing coarse : asphaltic or hydraulic bound
aggregate
PCC Cross Section
Granular Base
Portland Cement Concrete
Subgrade
Granular Base
Subgrade: in-situ material used to construct grade.
Subbase: none.
Base: high quality coarse crush with high air voids for
Road Soil Characterization4
g q y gdrainage.
Wearing coarse : Portland Cement Concrete
3
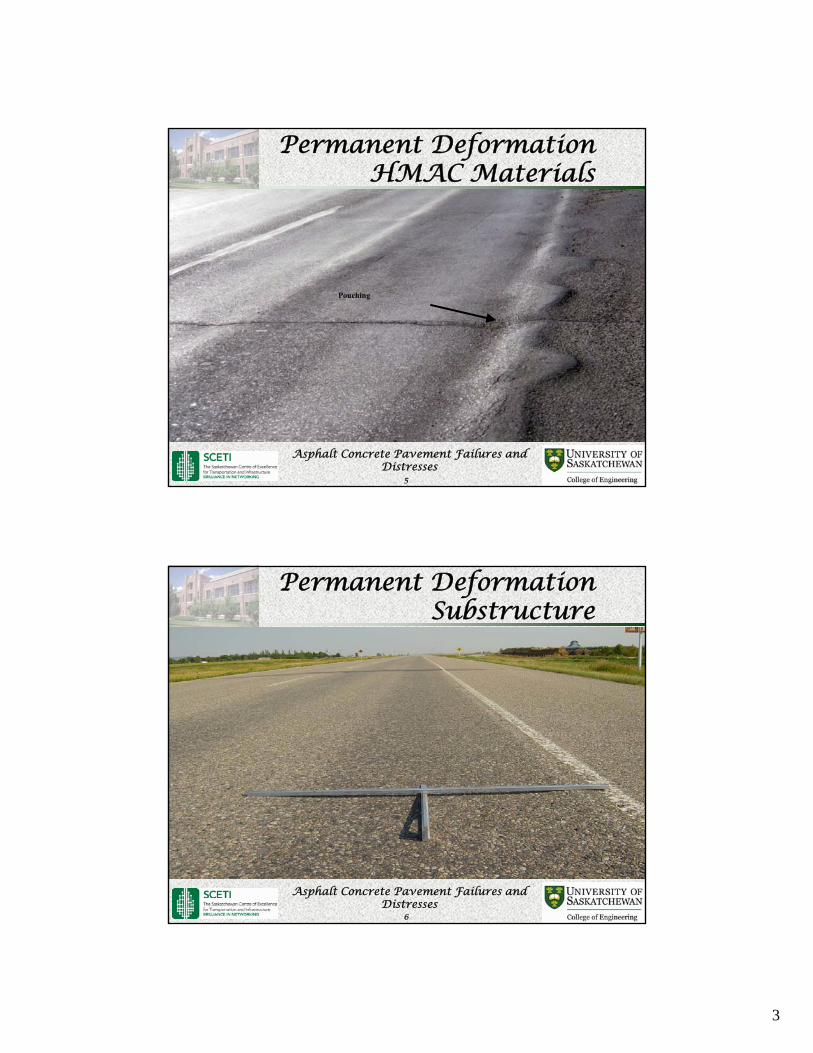
Permanent Deformation HMAC Materials
Pouching
Asphalt Concrete Pavement Failures and Distresses
5
Permanent Deformation Substructure
Asphalt Concrete Pavement Failures and Distresses
6

4
Fatigue Cracking
Asphalt Concrete Pavement Failures and Distresses
7
Fatigue Cracking and Substructure Rutting
Asphalt Concrete Pavement Failures and Distresses
8

5
Frost Action
Asphalt Concrete Pavement Failures and Distresses
9
Frost Action
Asphalt Concrete Pavement Failures and Distresses
10
6
Soil Definition
Soil: • All earthen materials including:• Organics• Sands• Clays• Gravels• Silts
Road Soil Characterization11
Soil Definition
Definition of Soil and Soil Components:
• Soil is a layer of disintegrated rock material lying on the surface of the earth
Two broad groups of soils:
• Residual Soils
• Soils developed in place from the rock or parent soil
• Transported Soils
Road Soil Characterization12
• Transported Soils
• Residual soils eroded and redeposited by wind, ice or water
7
Road Soil Characterization
Physical properties:
• Grain size analysis (AASHTO T27, ASTM C136)
• Sand equivalent (AASHTO T176)
• Classification (ASTM D3282):
• Unified Soil Classification System
• AASHTO
Road Soil Characterization13
Road Soil Characterization
Phenomenological properties:
• Atterberg limits and plasticity index (ASTM D4318, AASHTO T89 , AASHTO T90)
• Proctor water-density (AASHTO T99, ASTM D 698)
• California bearing ratio (AASHTO T193, ASTM D1883)
• Hveem Resistance
Road Soil Characterization14

8
Soil Volumetrics
Soil mass is comprised of:• Soil• Air• Water• Soil-water interface• Water-air interface
Road Soil Characterization15
Soil Volumetrics
AirW Ai I f
Soil Solids
Water
Water-Air Interface
Soil-Water InterfaceVT
VW WW
VS WS
VV
WT
Road Soil Characterization16
Soil SolidsS WS
9
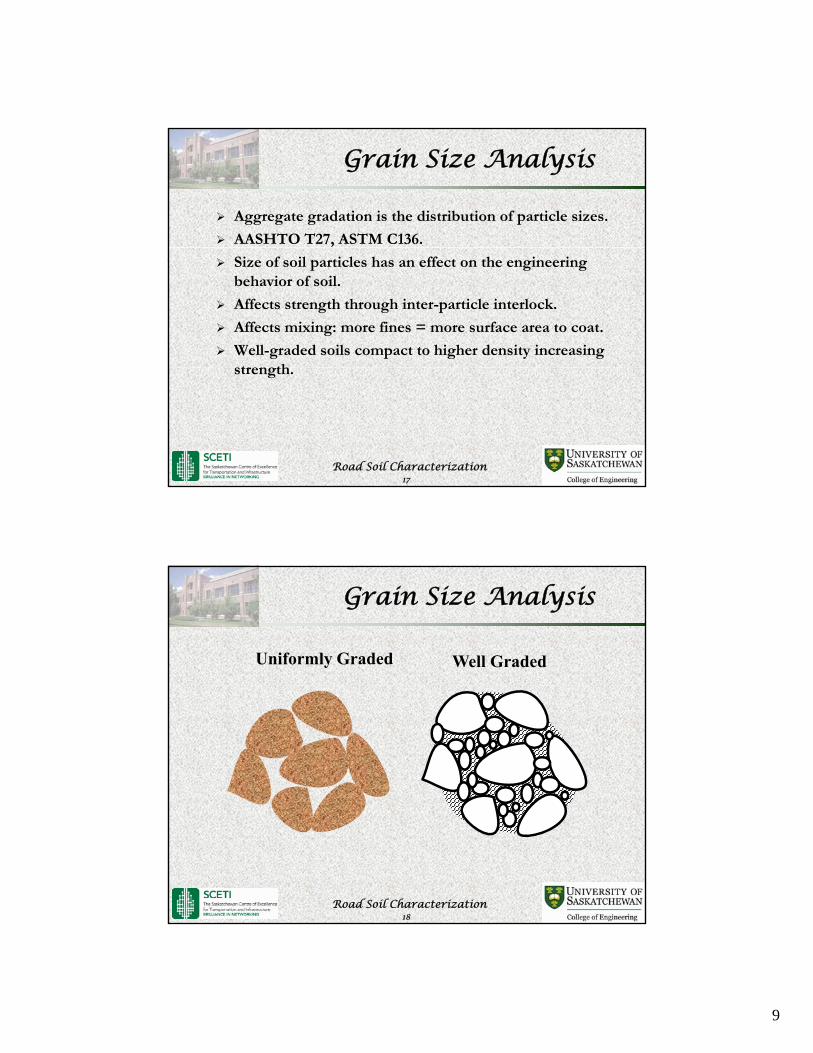
Grain Size Analysis
Aggregate gradation is the distribution of particle sizes.
AASHTO T27, ASTM C136.
Size of soil particles has an effect on the engineering behavior of soil.
Affects strength through inter-particle interlock.
Affects mixing: more fines = more surface area to coat.
Well-graded soils compact to higher density increasing tr n th
Road Soil Characterization17
strength.
Grain Size Analysis
Well GradedUniformly Graded
Road Soil Characterization18

10
Mechanical Sieve:
• Used to determine particle size distribution of
Grain Size Analysis
aggregates larger than 0.075mm
• Weighed sample of aggregate passed through series of different sized screens
• Results are used to classify soils
May have wet sieve performed first to accurately quantify fines in the material.
Road Soil Characterization19
quantify fines in the material.
Aggregate Particle Size/Gradation
Road Soil Characterization20
Individual Sieve Stack in Mechanical Shaker

11
Wet Sieve Analysis
Road Soil Characterization21
Wet Sieve Analysis
Road Soil Characterization22

12
Aggregate Particle Size/Gradation
Mineral Filler: aggregate with at least 70% passing the 75m (No. 200) sieve.
Fine Aggregate: aggregate passing 4.75mm (No. 4); or 2.36mm (No. 8); or 2.00mm (No. 10) sieve.
Coarse Aggregate: aggregate retained on 4.75mm (No. 4); or 2.36mm (No. 8); or 2.00mm (No. 10) sieve.
Nominal Maximum Size: smallest sieve size through which 90% passes.
Road Soil Characterization23
Maximum Size: smallest sieve size through which 100% passes.
Grain Size Analysis
80
100
Th
an
0
20
40
60
0.001 0.010 0.100 1.000 10.000
Per
cen
t F
iner
T
Road Soil Characterization24
0.001 0.010 0.100 1.000 10.000
Grain Size (mm)Clay Subgrade (Hydrometer Sieve) Clay Subgrade (Mechanical Sieve)Clay Till Subgrade (Hydrometer Sieve) Clay Till Subgrade (Mechanical Sieve)Subbase (Mechanical Sieve) Granular Base (Mechanical Sieve)

13
Hydrometer Sieve:
• Fine particles smaller than 0.075 mm are further
Grain Size Analysis
graded by a hydrometer analysis
• Mix fines with water/flocculants and measure density of water as the particles settle
• Large particles settle faster than fine particles
• Settlement changes density of water
Road Soil Characterization25
Hydrometer Grain Size Analysis
Silty-Sand Clay-Till
Road Soil Characterization26

14
Grain Size Analysis
COS Subbase Aggregate
100
0
20
40
60
80
Per
cen
t F
iner
Th
an
Road Soil Characterization27
0
0.010 0.100 1.000 10.000
Grain Size (mm)
Gradation Boundaries Mean
Grain Size Analysis
COS Base Aggregate
100
0
20
40
60
80
Per
cen
t F
iner
Th
an
28
0.010 0.100 1.000 10.000
Grain Size (mm)
Gradation Boundaries Mean
Road Soil Characterization
15
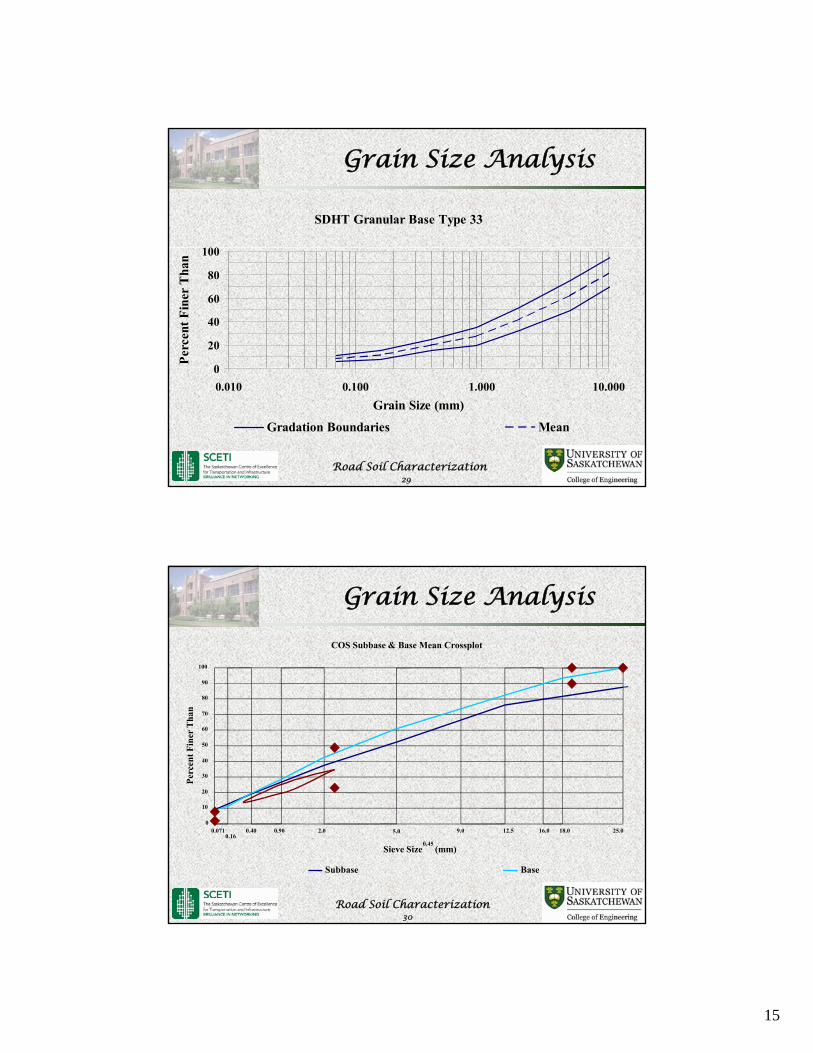
Grain Size Analysis
SDHT Granular Base Type 33
100
0
20
40
60
80
100
Per
cent
Fin
er T
han
Road Soil Characterization29
0
0.010 0.100 1.000 10.000
Grain Size (mm)
Gradation Boundaries Mean
COS Subbase & Base Mean Crossplot
90
100
Grain Size Analysis
20
30
40
50
60
70
80
Per
cen
t F
iner
Th
an
30
0
10
Sieve Size0.45
(mm)
Subbase Base
0.0710.16
0.40 0.90 2.0 5.0 18.012.59.0 16.0 25.0
Road Soil Characterization

16
Atterberg Limits
Introduction
• Water significantly affects behavior of fine grained soils
• Different fine grained soils behave differently
• How can different fine grained soils be categorized?
Road Soil Characterization31
Atterberg Limits
Define water contents at which fine grained soils behavior changes (states of consistency)• U Li it• Upper Limit• Liquid Limit: water content where clay begins to act
like a liquid• Sticky Limit• Cohesion Limit• Plastic Limit: water content where clay begins to
exhibit plasticity
Road Soil Characterization32
exhibit plasticity• Shrinkage Limit• Plastic Index: LL-PL

17
Atterberg Limits
LiquidState
Free Flow Limit
Liquid Limit
Plastic Limit
Shrinkage Limit
SemisolidState
PlasticState
State
Liquid Limit minusplastic limit equals
plasticity index; equalsrange in moisture
content through whichsoil is plastic
Road Soil Characterization33
Shrinkage Limit
Dry Limit
SolidState
Atterberg Limits
Plastic Limit Test:
• Sieve soil through #40 (0.425 mm) sieve
• Add enough moisture to be able to knead the material
• Roll soil into 3mm thread
• Plastic limit defined as the point when soil crumbles at 3mm diameter
Road Soil Characterization34

18
Atterberg Limits
Road Soil Characterization35
Atterberg Limits
Road Soil Characterization36

19
Atterberg Limits
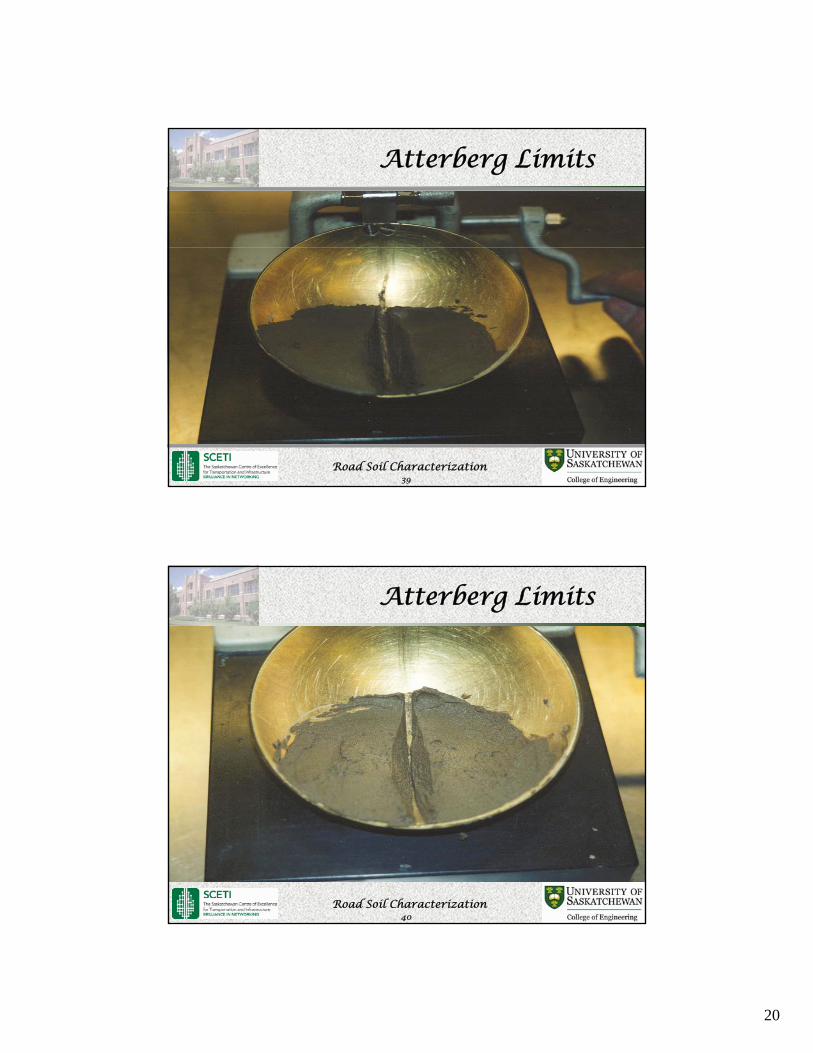
Liquid Limit Test:
• Mix fine grained soils with enough water to get soil to consistency of peanut butter
• Spread 1 cm layer into bowl on liquid limit apparatus
• Cut groove into soil
• Drop bowl 1 cm until groove closes 13mm (1/2”)
Road Soil Characterization37
Atterberg Limits
Road Soil Characterization38
20
Atterberg Limits
Road Soil Characterization39
Atterberg Limits
Road Soil Characterization40

21
Soil Classification
Most common methods:
• USCS: Unified Soil Classification SystemUSCS: Unified Soil Classification System.
• AASHTO: American Association of State Highway and Transportation Officials.
Road Soil Characterization41
Four main groups of soils:
1 Coarse-grained
USCS Soil Classification
1. Coarse-grained
2. Fine-grained
3. Organic soils
4. Peat
Used by Saskatchewan Highways
Originally developed for airfield construction
Road Soil Characterization42
g y p

22
USCS Soil Classification
Letter system for soil classification:
• G – Gravel
• S – Sand
• M – Silt
• C – Clay
• W – Well Graded
• P – poorly graded
• U – uniformly graded
• L – low liquid limit
• I – intermediate liquid limit
• H – high liquid limit
Road Soil Characterization43
• V – very high liquid limit
USCS Soil Classification ASTM D 2487
Group symbol Group name
GW well graded gravel, fine to coarse gravel
GP poorly graded gravel
GM silty gravel
GC clayey gravel
SW well graded sand, fine to coarse sand
SP poorly-graded sand
SM silty sand
SC clayey sand
ML silt
CL clay
44
CL clay
OL organic silt, organic clay
MH silt of high plasticity, elastic silt
CH clay of high plasticity, fat clay
OH organic clay, organic silt
Pt peat
Road Soil Characterization

23
USCS Soil Classification ASTM D 2487
Major divisionsGroup symbol
Group name
gravel> 50% of coarse
clean gravelGW
well graded gravel, fine to coarse gravel
GP l d d l
Coarse grained soilsmore than 50% retained
on No.200 (0.075 mm) sieve
fraction retained on No.4 (4.75 mm)
sieve
GP poorly graded gravel
gravel with >12% fines
GM silty gravel
GC clayey gravel
sand≥ 50% of coarse fraction passes No.4 (4.75 mm)
sieve
clean sandSW
well graded sand, fine to coarse sand
SP poorly-graded sand
sand with >12% fines
SM silty sand
SC clayey sand
il d l inorganicML silt
45
Fine grained soilsmore than 50% passes
No.200 (0.075 mm) sieve
silt and clayliquid limit < 50
inorganicCL clay
organic OL organic silt, organic clay
silt and clayliquid limit ≥ 50
inorganicMH silt of high plasticity, elastic silt
CH clay of high plasticity, fat clay
organic OH organic clay, organic silt
Highly organic soils Pt peat
Road Soil Characterization
USCS Soil Classification
50
60
CV
10
20
30
40
Pla
stic
ity
Ind
ex
CI
CH
CL
Road Soil Characterization46
0
0 10 20 30 40 50 60 70 80 90 100
Liquid Limit (%)
MLCL-ML
24
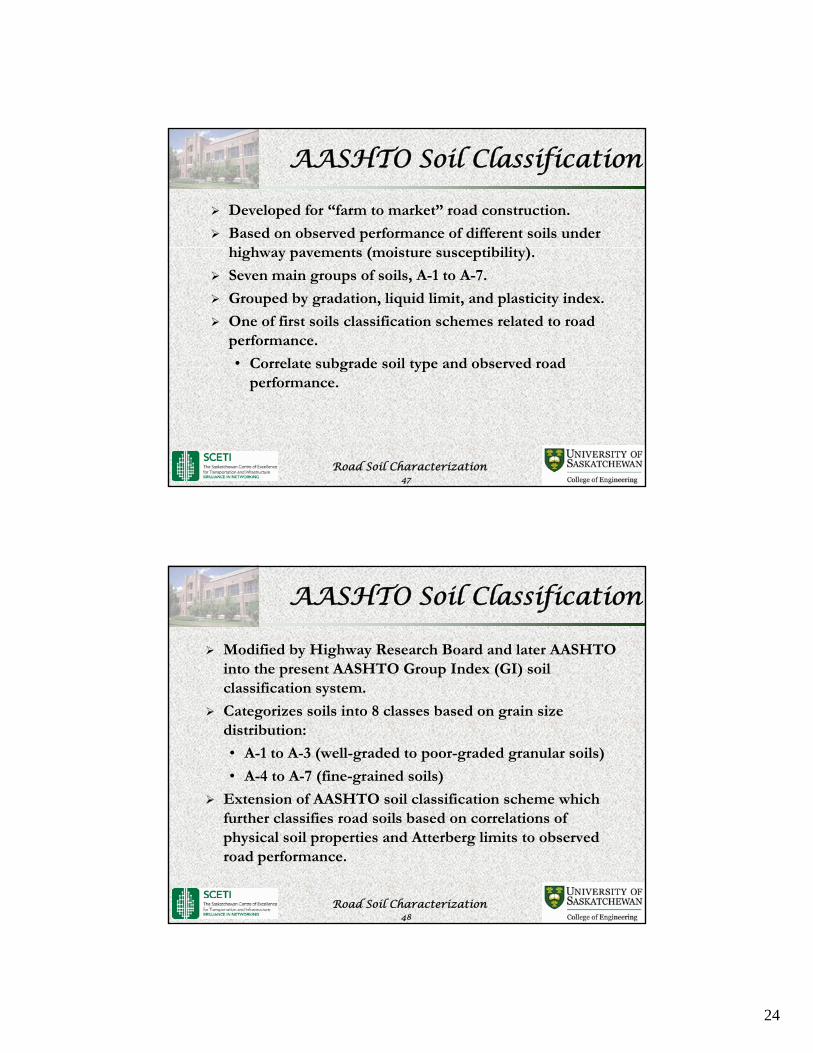
AASHTO Soil Classification
Developed for “farm to market” road construction.
Based on observed performance of different soils under hi h ( i ibili )highway pavements (moisture susceptibility).
Seven main groups of soils, A-1 to A-7.
Grouped by gradation, liquid limit, and plasticity index.
One of first soils classification schemes related to road performance.
• Correlate subgrade soil type and observed road
Road Soil Characterization47
Correlate subgrade soil type and observed road performance.
AASHTO Soil Classification
Modified by Highway Research Board and later AASHTO into the present AASHTO Group Index (GI) soil l ifi ti tclassification system.
Categorizes soils into 8 classes based on grain size distribution:
• A-1 to A-3 (well-graded to poor-graded granular soils)
• A-4 to A-7 (fine-grained soils)
Extension of AASHTO soil classification scheme which
Road Soil Characterization48
further classifies road soils based on correlations of physical soil properties and Atterberg limits to observed road performance.
25
AASHTO Soil Classification
A-1 to A-3: Excellent to good material for subgrade:
• A-1: most stability, less than 50% passing No. 40 sieve, less than 25% passing No. 200 sieve
• A-2: less than 35% passing No. 200 sieve
• A-3: fine sand
A-4 to A-7: Fair to poor material for subgrade materials:
• More than 36% passing No. 200 sieve
S t d b li id li it d l ti it i d
Road Soil Characterization49
• Separated by liquid limit and plasticity index
AASHTO Soil Classification
Group Index (GI):
• Used to further evaluate soils within a group
• Based on service performance of soils
• Range from 0 to 20• GI = (Fines-35)[0.2+0.005(LL-40)]+0.01(Fines-15) (PI-10)
• Fines = % passing 0.075mm sieve
• LL = Liquid limit
• PI = Plasticity Index
Road Soil Characterization50
• PI = Plasticity Index

26
AASHTO Road Soil Classification AASHTO M-145 and ASTM D 3282
Usual types of significant constituent materials
Group ClassificationGeneral rating as a
subgradeGeneral Classification
silty or clayey gravel and sandA-2
fine sandA-3
stone fragments, gravel and sand
A-1
excellent to goodGranular Materials (35% or
less passing 0.075 mm)
constituent materialssubgrade
51
clayey soilsA-7
A-5silty soils
A-4
fair to poorSilt-Clay Materials (>35%
passing 0.075 mm)
Road Soil Characterization
AASHTO Road Soil Classification AASHTO M-145 and ASTM D 3282
A-7-5 A-7-
A-7
A-6A-5A-4
A-2
A-3
A-1
Group Classification
Silt-Clay Materials (>35% passing 0.075 mm)
Granular Materials (35% or less passing 0.075 mm)
General Classification
41 min40
max41
min40
max41
min40
max41
min40
max……Liquid Limit
Characteristics of fraction passing 0.425 mm (No. 40)
36 min36
min36
min36
min35
max35
max35
max35
max10
max25
max15
max0.075 (No. 200)
……………………51
min50
max30
max0.425 (No. 40)
…………………………50
max2.00 mm (No. 10)
Sieve Analysis, % passing
A 7 5 A 76
A-2-7A-2-6A-2-5A-2-4A-1-bA-1-a
52
Note (1): Plasticity index of A-7-5 subgroup is equal to or less than the LL - 30. Plasticity index of A-7-6 subgroup is greater than LL - 30
fair to poorexcellent to goodGeneral rating as a subgrade
clayey soilssilty soilssilty or clayey gravel and sandfine sand
stone fragments,
gravel and sand
Usual types of significant constituent materials
11 min111 min
10 max
10 max
11 min
11 min
10 max
10 max
N.P.6 maxPlasticity Index
Road Soil Characterization

27
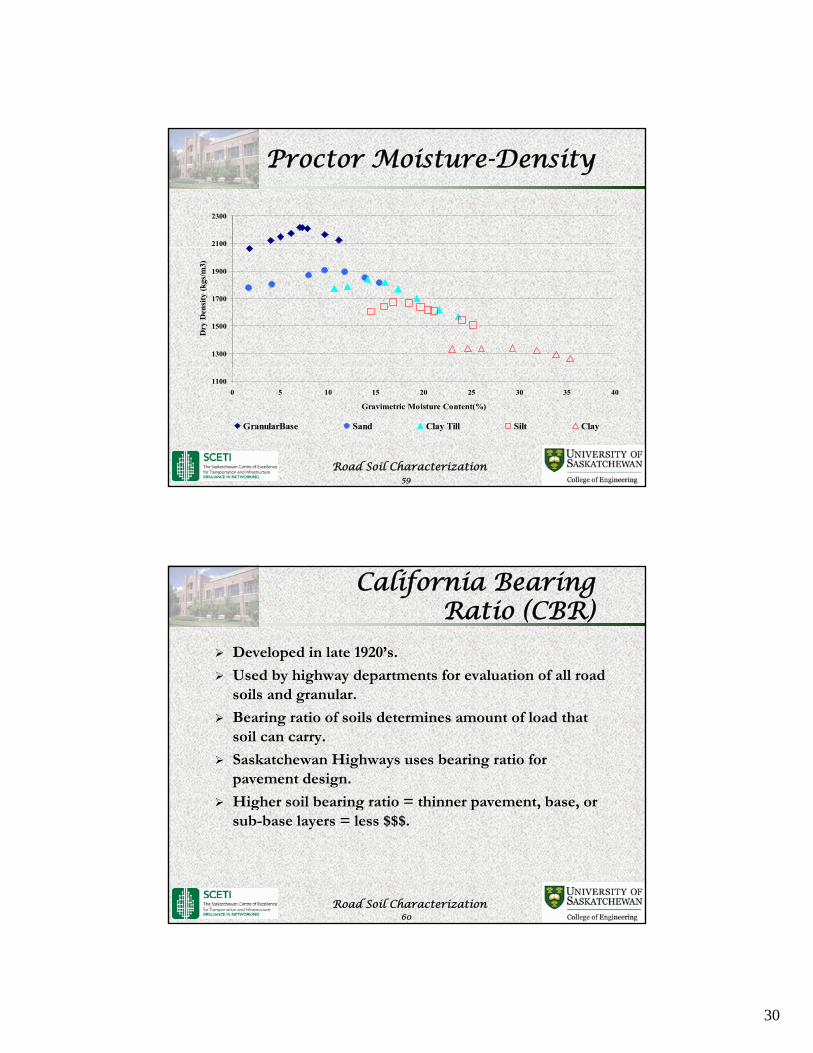
Proctor Moisture-Density
Compaction improves engineering properties of soils
• Minimizes settlements in road surface.
• Increases soil density - strength.
• Increases bearing capacity.
• Helps control volume change.
Amount of moisture in the soil affects compaction.
Road Soil Characterization53
Developed by R.R. Proctor in 1930’s:
• Engineer for Los Angeles County.
Proctor Moisture-Density
• Earth dams.
Consists of rammer that falls vertically onto soil that is placed in a cylindrical mold.
Different procedures for different soil gradations.
Two specified compaction efforts:
St d d
Road Soil Characterization54
• Standard.
• Modified.

28
Standard
• Three layers Modified
• Five layers
Proctor Moisture-Density
y
• 12 inch drop
• 4.5 lb. Rammer
• 12,400 ft-lb/ft3
• 600kN-m/m3
Five layers
• 18 inch drop
• 10 lb. Rammer
• 56,000 ft-lb/ft3
• 2700kN-m/m3
Road Soil Characterization55
Using specific amount of compaction effort, density and moisture content varies.
Proctor Moisture-Density
Test used to determine optimum moisture content to get maximum soil density for a level of compaction energy.
• Standard Proctor is minimum acceptable.
• Modified is preferred
Road Soil Characterization56

29
Proctor Moisture-Density
Road Soil Characterization57
Proctor Moisture-Density
Road Soil Characterization58
30
Proctor Moisture-Density
2100
2300
1300
1500
1700
1900
Dry
Den
sity
(k
gs/m
3)
Road Soil Characterization59
1100
0 5 10 15 20 25 30 35 40
Gravimetric Moisture Content(%)
GranularBase Sand Clay Till Silt Clay
Developed in late 1920’s.
Used by highway departments for evaluation of all road
California Bearing Ratio (CBR)
soils and granular.
Bearing ratio of soils determines amount of load that soil can carry.
Saskatchewan Highways uses bearing ratio for pavement design.
Higher soil bearing ratio = thinner pavement, base, or
Road Soil Characterization60
Higher soil bearing ratio thinner pavement, base, or sub-base layers = less $$$.
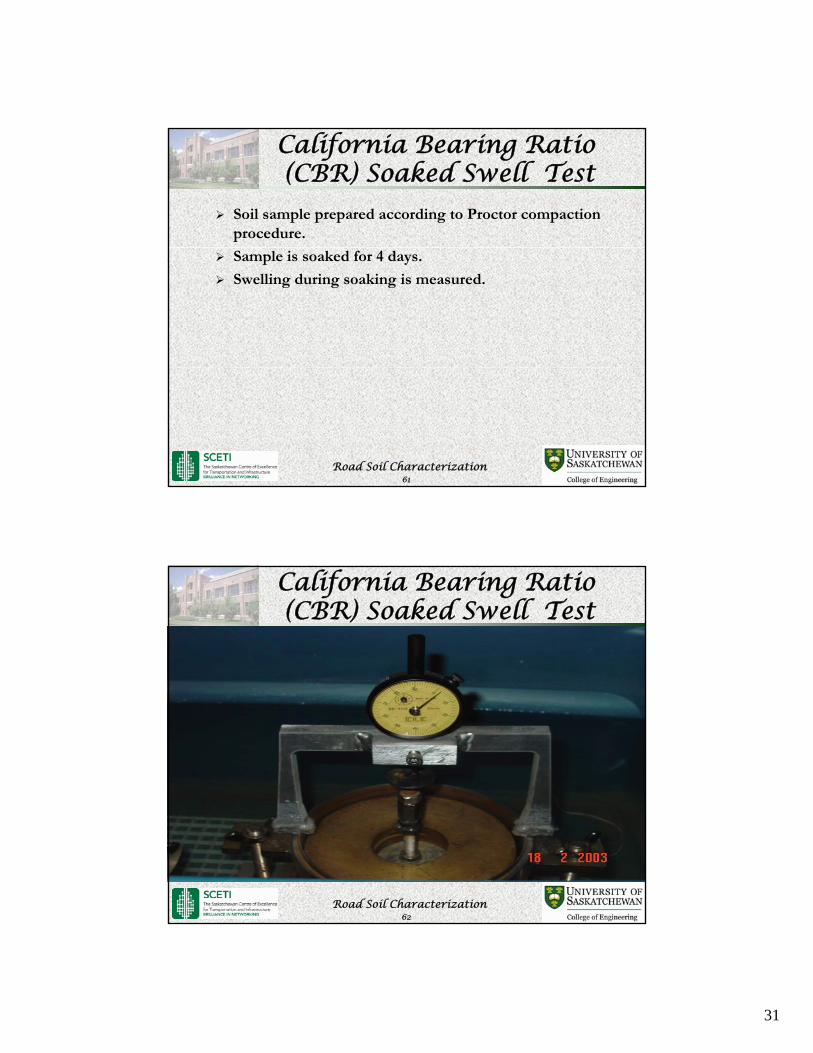
31
Soil sample prepared according to Proctor compaction procedure.
California Bearing Ratio (CBR) Soaked Swell Test
Sample is soaked for 4 days.
Swelling during soaking is measured.
Road Soil Characterization61
California Bearing Ratio (CBR) Soaked Swell Test
Road Soil Characterization62

32
California Bearing Ratio (CBR) Soaked Strength Test
Determined by pushing a cylindrical piston with an area of 1935 mm2 into a prepared soil sample at a standard
f 1 3 / i 2 0 / irate of 1.3 mm/min to 2.0 mm/min.
Applied pressure required to maintain the penetration rate is recorded at 2.5mm intervals up to a penetration depth of 12.5mm.
Measures the “relative” shearing resistance of soil.
Does not directly relate to field loading conditions, but
Road Soil Characterization63
it does provide a repeatable relative measure of soil strength.
California Bearing Ratio (CBR) Soaked Strength Test
Road Soil Characterization64

33
California Bearing Ratio (CBR) Soaked Strength Test
Road Soil Characterization65
P
California Bearing Ratio (CBR) Soaked Strength Test
Penetration(mm)
Pressure(MPa)
10.4
15.9
Crushed Rock CBR
Surcharge49.6 mm
200
mm
15 m
m
Compacted Soaked Sample
2.5
7.6 13.15.0
10.2
6.9
Road Soil Characterization66
15.9
152.4 mm dia.
1 12.7 17.90.

34
CBR is calculated as ratio of pressure at a given penetration increment during the soil test to that of a
California Bearing Ratio (CBR) Soaked Strength Test
p gstandard high-quality crushed rock.
npenetratio 12.5mm to2.5mm @rock Crushed
npenetratio 12.5mm to2.5mm @ Soil
F
FCBR
Road Soil Characterization67
SDHT GI-CBR Correlation
12
14
y = -3E-05x5
+ 0.002x4
- 0.0546x3
+ 0.7184x2
- 4.9707x + 20.172
R2
= 0.9994
4
6
8
10
CB
R
Road Soil Characterization68
0
2
0 2 4 6 8 10 12 14 16 18 20
Group Index

35
SMHI Pavement Structural Design
Conventional Flexible Pavement Structural Design
69
Substructure Moisture 20 yrs+Field Measurements
Per
mit
tivi
ty
WB10.0
10.5
11.0
11.5
12.0
28.00029.00030.00031.00032.00033.00034.00035.00036.00037.00038.00039.000
Die
lect
ric
P
Chainage (km)
EB
7.0
7.5
8.0
8.5
9.0
9.5
Per
mit
tivi
ty
SB
20 0
22.0
24.0
26.0
28.0
30.0
Road Soil Characterization70
35.000 36.000 37.000 38.000 39.000 40.000 41.000 42.000 43.000 44.000
Die
lect
ric
P
Chainage (km)
NB
10.0
12.0
14.0
16.0
18.0
20.0
36
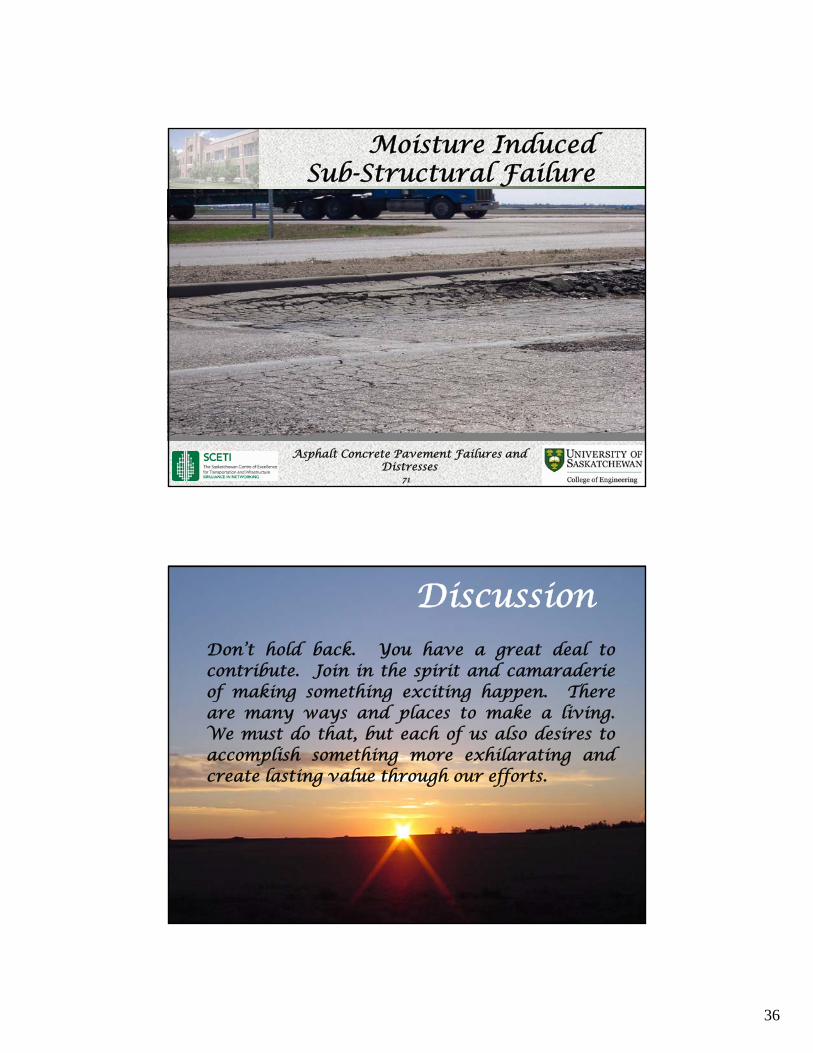
Moisture Induced Sub-Structural Failure
Asphalt Concrete Pavement Failures and Distresses
71
DiscussionDon’t hold back. You have a great deal tocontribute. Join in the spirit and camaraderief ki hi i i h Thof making something exciting happen. There
are many ways and places to make a living.We must do that, but each of us also desires toaccomplish something more exhilarating andcreate lasting value through our efforts.
Road Soil Characterization72