introduction to sfr - vivendi · sfr presentation – march 2008 – 4 sfr orange bouygues 39.6%...
TRANSCRIPT

Introduction to SFRMarch, 2008
IMPORTANT NOTICE: INVESTORS ARE STRONGLY ADVISED TO READ THE IMPORTANT LEGAL DISCLAIMER AT THE END OF THIS PRESENTATION
SFR Presentation – March 2008 – 2
SFR position and strategy in the French Telecom market1
Strategy at work2
Agenda
Key financials and guidance3

SFR Presentation – March 2008 – 3
SFR position and strategy in the French Telecom market1

SFR Presentation – March 2008 – 4
SFR Orange Bouygues
39.6% 38.6% 27.8%
2007 Mobile EBITDA margin
SFR, a strong number 2 operator in the French mobile market
18.8M customers / 34% market share / 4.1M 3G/3G+ customers
(1)
(1) : 40.9% on a comparable basis with Orange
SFR: leader in metropolitan net adds SFR: leader in value generation
SFR Orange Bouygues
EBITDA 40.1% 44.5% 15.4%
Revenues 37.3% 42.4% 20.3%
Customer 35.9% 46.4% 17.7%
€/year 185 159 144
2007 Mobile EBITDA share - 3 operators
2007 Mobile EBITDA per client
SFR: leader in margins
• SFR leader in metropolitan net adds in 2007 and 2005
Source: operator publications
SFR: leader in value per customer

SFR Presentation – March 2008 – 5
Fixed voice * Fixed voice *
Internet & data services
Internet & data services
MobileMobile
New frontier
2007 2012
(1)
(2)
+ €5.2bn
+ €4.7bn
+ €3.0bn
- €2.5bn *
€39bn*
€44bn*
French Telecom Market still growing
SFR is well positioned in the two telecom growing segments both on the mass market and the enterprise segment
(1) Fixed/Mobile substitution (2) Fixed/VoIP substitution
Potential growth in new businesses (insurance, m-payment / ticketing, health, domotic..)SFR + 9C will address new frontiers
(*) incl. subscription fees
87% of SFR+9C revenues on Mobile + Internet & data services
Source: Idate (January 2008)

SFR Presentation – March 2008 – 6
0 . 0
5 . 0
10 . 0
15 . 0
Tiscali
Telenet Ilia
dMobist
arFas
tweb
Freenet
C & W
Tele 2
Bouygu
es Tel.
Vodafone I
taly
Vodafone S
pain
Vodafone U
K
Vodafone G
erman
ySFR+ N
euf Ceg
etel
2008
E R
even
ues
(bn
€)
+
SFR
9C
Source: Exane BNP Paribas, SFR estimates (1 GBP = 1.4 €)
Creation of the leading alternative operator in Europe

SFR Presentation – March 2008 – 7
SFR + 9C: a real contender to FT - Orange in France
Fixed/mobile convergence
Importance of Enterprise segmentFixed revenue share
Mobile revenue share
+
Fixed revenue shareMobile revenue share
+
Source: operator publications

SFR Presentation – March 2008 – 8
SFR + 9C: highly complementary platforms
• SFR: Largest 3G+ network in France
• 9C: Premier alternative IP network in France;the most extensive network with >70% home passed
First alternative broadband networks
• SFR: market shaper of mobile internet
18.8 M customers
• 9C: track record of innovation in ADSL
3.2 M customers
Leadership in mass market services
• SFR: strong growth of enterprise lines and revenues (~10% annual growth)
• 9C: strong penetration in the enterprise segment(> 15% Enterprise market share)
Dynamism in enterprise segment
• SFR: large retail commercial network
• 9C: strong in Internet and direct sales channels
Complementary know-how in customer service
“Natural” development of already strong existing commercial partnership

SFR Presentation – March 2008 – 9
SFR + 9C: the right time to move
• The right time…• Mobile Internet taking off• Customer’s changing needs for convergence
(especially for enterprise)• Increasing need for capacity because of new
usage• FTTH technology breakthrough
• …and Group Louis Dreyfus (GLD) is willing to sell
An opportunity at the right time….
• Cegetel + Neuf Telecom merger in August 2005
• Increase of SFR’s stake from 28% to 40% before the IPO of Neuf Cegetel in October 2006
…in line with SFR active strategy in fixed-ADSL since deregulation (1997)…
• Signed agreement for the acquisition(1) of GLD stake in Neuf Cegetel at €34.5/share (2007 dividend attached)…
• …followed by a Public Offer for remaining shares at €36.5/share (2007 dividend attached)
• Expected closing in Q2-Q3 2008
• Transaction value of €4.5bn
…with good transaction terms
(1) Subject to the approval by French anti-trust authorities

SFR Presentation – March 2008 – 10
Strengthen the SFR ‘‘customer centric’’ strategy
Mobile voice + data centric
€1bn revenues>36% market share
Extended communication
offer (fixed + mobile)
SFR existing mobile offer
18.8m customers34% market share
EnterpriseMass Market InternetFor memo:
complementary networks
3.2m ADSL customers21% broadband market share
173k data links+
€1bn Revenues+
15% Market Share
HSDPA / HSUPA
ADSL
Femtocell Wifi
WIMAXFixed / mobile substitution at
home
Internet at home
Mobile Internet
4.1m 3G cust.>50% market share
9-C contribution
to such strategy
SFR strategic moves
FTTHFullIP
BBoneEnterprises
Wholesale
MVNO business
Co-leadership with 1.2m customers
Fixed wholesale activity
443k data links+
~€0.55bn Revenues
Wholesale

SFR Presentation – March 2008 – 11
SFR + 9C: leading alternative multi-access full-IP network
2007 Population coverageGSM/GPRS : 98 %3G/HSDPA : 70 %3G+(HSDPA)+Edge : >92%
3G/hsdpa
GSM/GPRS
White zones
• The leading mobile broadband network in France with 70% population coverage with 3G/3G+
SFR: leading mobile broadband network in France 9C: leading ADSL ULL platform in France
• Creation of the first alternative full-IP convergent network in Europe
• Evolve towards the more efficient broadband access network
• Radio WAN access: HSPA LTE
• Macro cells Femtocells
• Fiber as close as possible to the end user
• FTTH: €450m investment over 3 years with >1m home passed by end 2009
• ~50% of French ULL lines
• 2,000 COs by end 2008
Neuf Cegetel infrastructure
9C available service (option1)
“DSP” Zone (*)
Cities
(*) Public service contract

SFR Presentation – March 2008 – 12
Strengthen the SFR ‘‘customer centric’’ offer portfolio
Simplicity Personal services Interactivity
Fixed
Mobile
Mass market Internet Enterprise
Continuity of usage
Unlimited Happy Zone
SFR Presentation – March 2008 – 13
Strategy at work2
SFR Presentation – March 2008 – 14
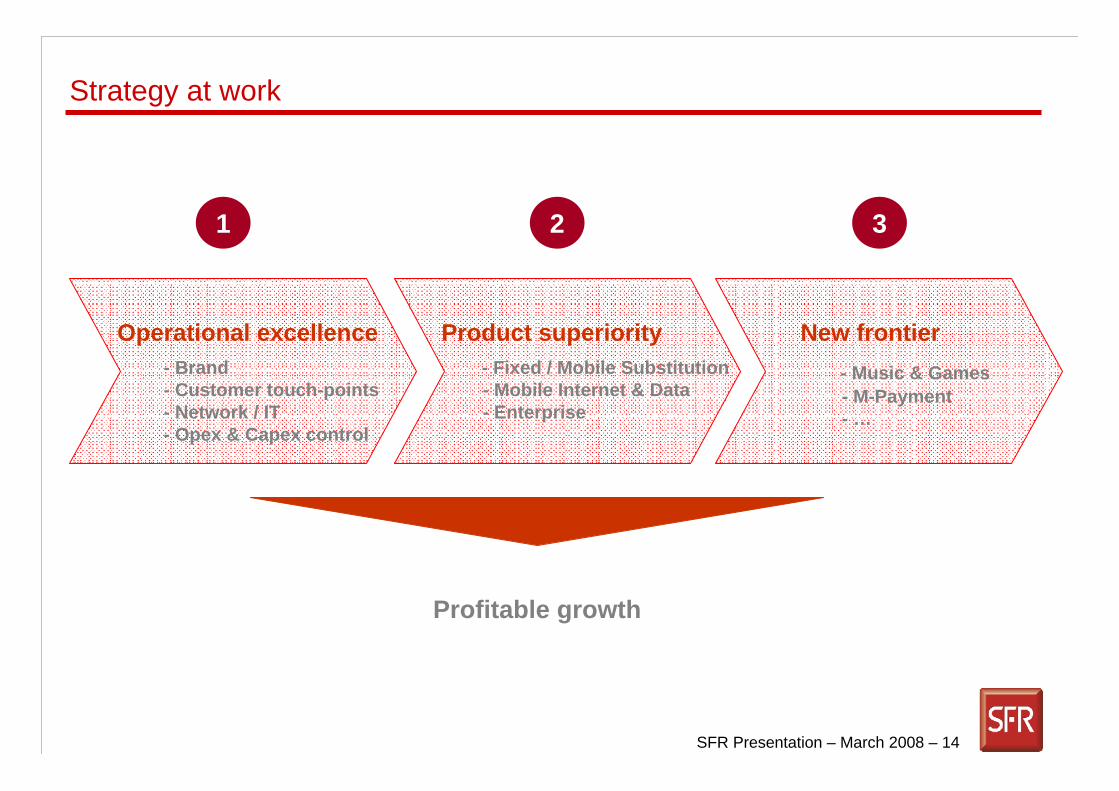
Strategy at work
Profitable growth
Operational excellence- Brand- Customer touch-points- Network / IT- Opex & Capex control
Product superiority- Fixed / Mobile Substitution- Mobile Internet & Data- Enterprise
New frontier- Music & Games- M-Payment- …
1 2 3

SFR Presentation – March 2008 – 15
SFR : a strong brand and a close relationship with 18.8m customers
DistributionCustomerService
WAP
WEB
IVR*
Client
• Success of SFR new brand signature and new advertising campaign in 2007
• Take off of new media: success of web marketing campaigns “cavaouatcher.fr” in September 2007 (~25k visits per day end of October)
SFR image re-boosted
Aligned customer touch points: distribution, call centers, Web
• Retail: a deep commercial network with close to 800 “Espace SFR”stores
• Web: new sfr.fr website with a revamped on-line shop
• Call centers:
• focus on quality retention and sales strategy
• execution transferred to specialists ( Teleperformance, Arvato, ...)
• Connect Assistance : Nationwide network of PC/web specialists to assist SFR customers at their home
(*) Interactive vocal response
1

SFR Presentation – March 2008 – 16
Network quality and innovation
#1 in network quality for the fourth consecutive year• #1 or #1 equal on 30 criteria out of 32 in 2007 ARCEP survey
Largest HSDPA network in France • With 70% HSDPA coverage end of 2007 (up to 3.6Mbit/s download)
• First French operator to announce experimentation of HSUPA at Nantes
FTTH• €450m investment over 3 years, to be shared with Neuf Cegetel,
>1m homes passed targeted end of 2009
Wimax licenses on the 2 largest French regions • Ile-de-France, PACA
Strong momentum in urban wifi• SFR already operates in Paris (~400 hotspots), Nantes (30 hotspots end of
2007,100 hotspots in 2008), Levallois, Metz, …
SFR, 1st network in Francein quality and innovation
#1 3G+ operator in France • 4.1 million 3G customers at end of December 2007, >50% 3G/3G+ market
share
1
SFR Presentation – March 2008 – 17
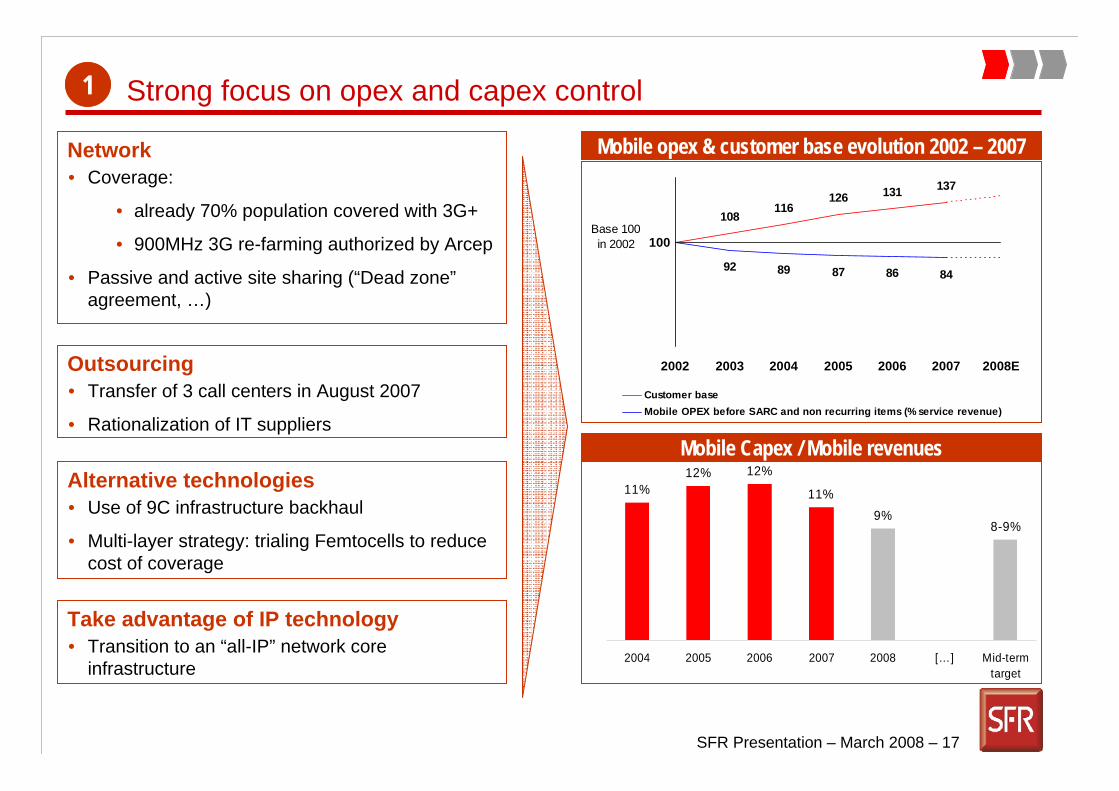
Strong focus on opex and capex control
Mobile opex & customer base evolution 2002 – 2007
Mobile Capex / Mobile revenues
Network• Coverage:
• already 70% population covered with 3G+
• 900MHz 3G re-farming authorized by Arcep
• Passive and active site sharing (“Dead zone”agreement, …)
Outsourcing• Transfer of 3 call centers in August 2007
• Rationalization of IT suppliers
Alternative technologies• Use of 9C infrastructure backhaul
• Multi-layer strategy: trialing Femtocells to reduce cost of coverage
Take advantage of IP technology • Transition to an “all-IP” network core
infrastructure
108116
126 131 137
92 89 87 86 84
Base 100 in 2002 100
2002 2003 2004 2005 2006 2007 2008E
Customer baseMobile OPEX before SARC and non recurring items (% service revenue)
11%12% 12%
11%9%
8-9%
2004 2005 2006 2007 2008 […] Mid-termtarget
1

SFR Presentation – March 2008 – 18
Mass Market: innovate to develop personal communication
• 400k Happy Zone customers at end of 2007
• Launch of Unlimited Happy Zone (24h/24) in March 2008
Fixed to mobile substitution
New personal communication initiatives
Mobile is the preferred “connected”device…• 94% of SFR customers take their mobile phone
everywhere
• 59% of SFR customers record their contacts in their mobile phone directory
• 81% of SFR customers consider their mobile phone as their main handset
…with fast development of complementary personal / nomadic connected devices
• Fast development of personal/nomadic connected devices
• Always on / Always connected and reached everywhere
• Personalized services and customer relationship
• Geo-localized services
• Launch of Asus Eee-PC in exclusivity in Jan 08
• SFR + TOM TOMagreement
2

SFR Presentation – March 2008 – 19
Mass Market : SFR, the “Market Shaper” of Mobile Internet
• 250,000 Illimythics customers in two months with unlimited access to :
• TV
• Music
• Web surfing
• SMS
• 40,000 USB modem 3G+ devices
Success of SFR new offers launched in H2 2007
Data revenue takes off
• SFR consumers are ready
• Technology (3G+) and handsets are ready
• Services are ready
Mobile Internet is taking off in France
% data % non messaginggrowth data growth
730
715
681
421
284
348
2008E
2007
2006
2005
Messaging revenues Non messaging data revenues
+23%+10%
+21%+8%
>10%
Reminder : SMS termination rates cut by -30% in Sept-06
SFR data revenue growth
2
SFR Presentation – March 2008 – 20
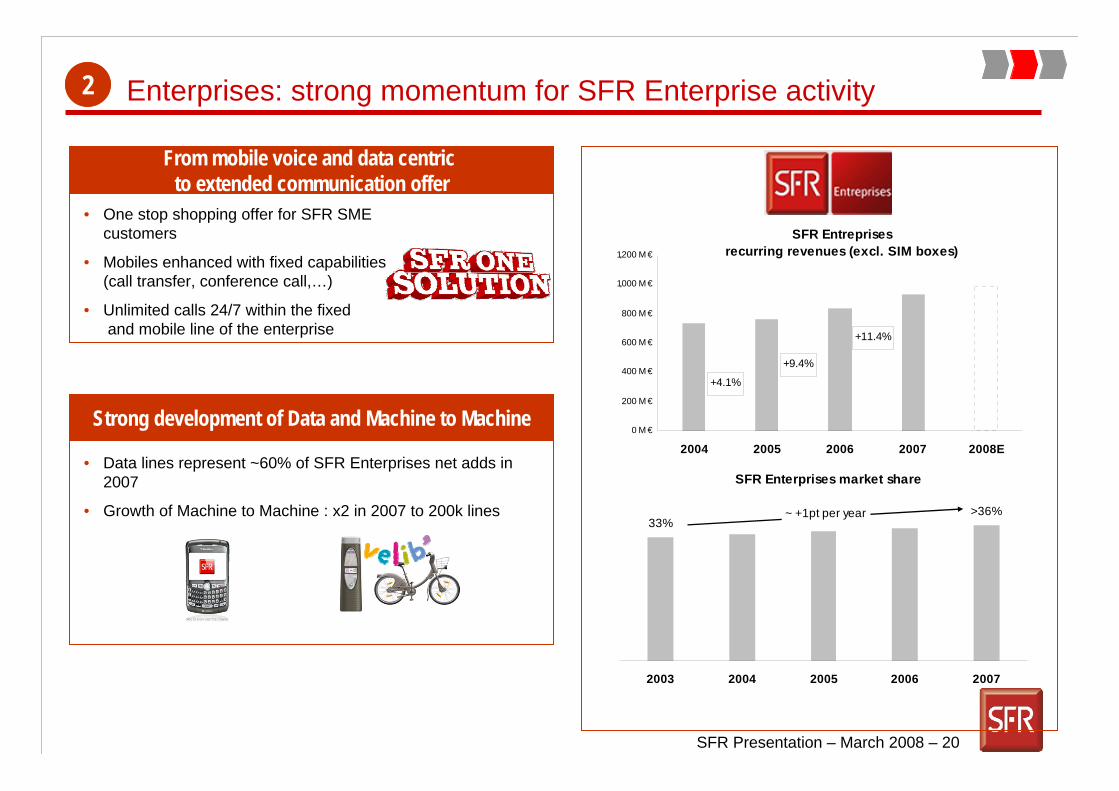
Enterprises: strong momentum for SFR Enterprise activity
Strong development of Data and Machine to Machine
• Data lines represent ~60% of SFR Enterprises net adds in 2007
• Growth of Machine to Machine : x2 in 2007 to 200k lines
• One stop shopping offer for SFR SME customers
• Mobiles enhanced with fixed capabilities(call transfer, conference call,…)
• Unlimited calls 24/7 within the fixedand mobile line of the enterprise
From mobile voice and data centric to extended communication offer
SFR Enterprises market share
33%>36%
2003 2004 2005 2006 2007
~ +1pt per year
SFR Entreprises recurring revenues (excl. SIM boxes)
+4.1%
+9.4%
+11.4%
0 M €
200 M €
400 M €
600 M €
800 M €
1,000 M €
1,200 M €
2004 2005 2006 2007 2008E
2

SFR Presentation – March 2008 – 21
New usages
• 5,1 million games downloaded in 2007 (+14 % vs. 2006)
• 600 games available, including 10 online multi-players games
• 5,6 million titles downloaded in 2007 (+37 % vs. 2006)
• Launch of « LiveConcerts by SFR » : 1st online platform for live concert and multiple views broadcast
• SFR, Leader in single legal download in Q4-2007 with 29% market share
Digital Music
Games
TV & Video
• Over 350k subscribers at the end of December 2007 (x5 vs. 2006)
• 92 channels available
3

SFR Presentation – March 2008 – 22
Innovation
SFR partnership strategy to boost customer innovation SFR Development to invest in mobile “ecosystem”
• Investment in 12 start-up
3
• M-payment / ticketing
• Partnership with CréditMutuel – CIC for experimentation of contactless payment in Strasbourg
• Partnership with Digitick for mobile tickets for concerts (Stade de France, …)
• Geolocalization: partnership with Tom-Tom
• Insurance business
• Accessories
• Health / security services / domotic

SFR Presentation – March 2008 – 23
Key financials and guidance3

SFR Presentation – March 2008 – 24
SFR 2007 Performance (1/2)
€9,018m revenues FY 2007 (+3.9% vs. LY)
• +0.9% vs. LY
• Excluding the impact of the regulated tariff cuts, the YoY growth of mobile service revenues would have been +4.4%
Mobile service revenues at €8,382m
Mobile service revenues FY 2007 vs. 2006
8,311 M€
– 285 M€
+ 356 M€ 8,382 M€
FY 2006 FY 2007
Organic Growth+4.4%
Mobile services growth incl.regulatory impacts:+0.9%
Regulatory impact

SFR Presentation – March 2008 – 25
SFR 2007 Performance (1/2)
€3,431m EBITDA in 2007 (–0.5% vs. LY) reflecting
• The launch of SFR ADSL and the integration of TELE2 operations
• SFR’s mobile EBITDA increasing by €14m to €3,476 million due to
• a +0.9% increase in mobile service revenues
• a 2.1 percentage point increase in customer acquisition and retention costs to 12.8% of mobile service revenues
• a strict control of other costs
EBITDA at €3,431m in 2007 (-0.5%)
SFR EBITDA FY 2007 vs. 2006
3,431 M€
– 32 M€
+ 14 M€3,449 M€
Mobile Fixed EBITDA 2007 Actual
EBITDA2006 Actual
Launch of SFR ADSL and integration of
TELE2 France operations
SFR Presentation – March 2008 – 26
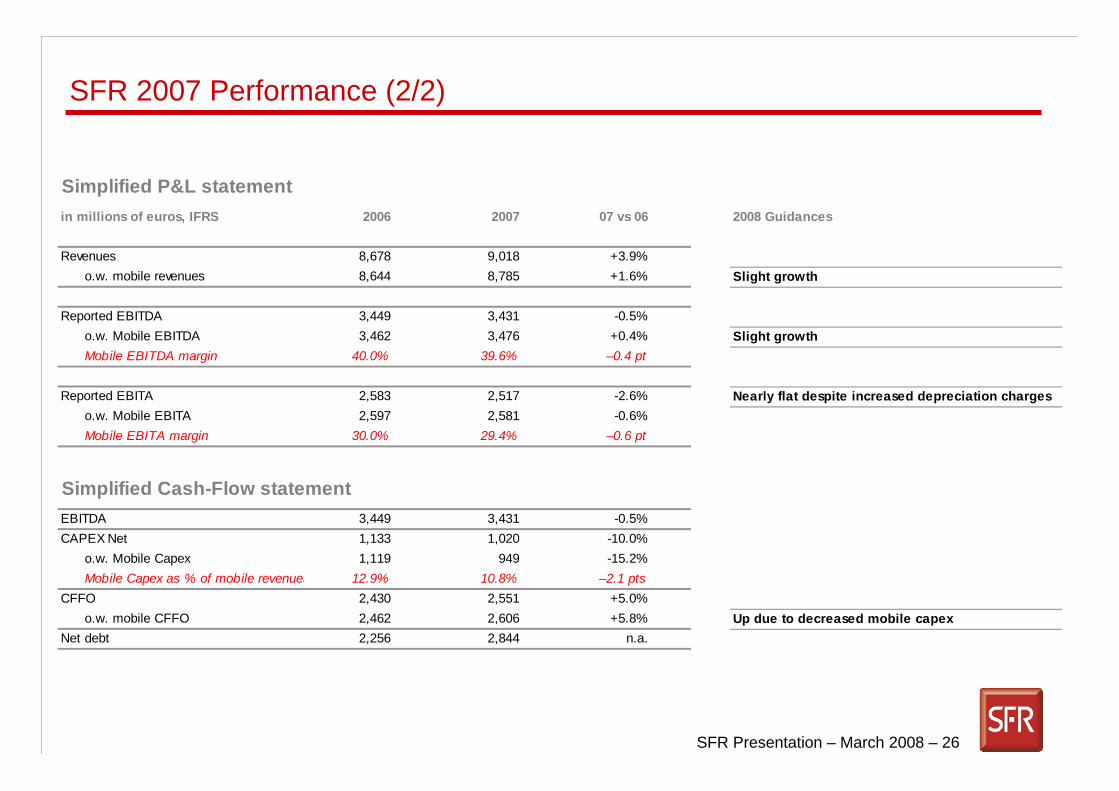
SFR 2007 Performance (2/2)
Simplified P&L statement in millions of euros, IFRS 2006 2007 07 vs 06 2008 Guidances
Revenues 8,678 9,018 +3.9%o.w. mobile revenues 8,644 8,785 +1.6% Slight growth
Reported EBITDA 3,449 3,431 -0.5%o.w. Mobile EBITDA 3,462 3,476 +0.4% Slight growthMobile EBITDA margin 40.0% 39.6% –0.4 pt
Reported EBITA 2,583 2,517 -2.6% Nearly flat despite increased depreciation chargeso.w. Mobile EBITA 2,597 2,581 -0.6%Mobile EBITA margin 30.0% 29.4% –0.6 pt
Simplified Cash-Flow statement EBITDA 3,449 3,431 -0.5%CAPEX Net 1,133 1,020 -10.0%
o.w. Mobile Capex 1,119 949 -15.2%Mobile Capex as % of mobile revenues 12.9% 10.8% –2.1 pts
CFFO 2,430 2,551 +5.0%o.w. mobile CFFO 2,462 2,606 +5.8% Up due to decreased mobile capex
Net debt 2,256 2,844 n.a.

SFR Presentation – March 2008 – 27
Neuf Cegetel 2007 key figures
Key challenges
• Change in paradigm from external to organic growth:
• Q4 ADSL market share at 14%
• Decrease in net adds
• Switched voice still represents 37% of total revenues
• Increase Mass Market QoS
Neuf Cegetel key figuresin millions of euros, IFRS 2006 2007 07 vs 06
Net adds ADSL customers, FY 1,000 1,052 +5.2%Net adds ADSL customers, Q4 170k * 101k -41%
Revenues 2,897 3,348 +16%COGC (1,737) (1,967) +13%Gross Margin 1,160 1,381 +19%Selling costs (440) (503) +14%Commercial margin 720 878 +22%G&A (176) (150) -15%Adjusted EBITDA ** 544 728 +34%Capex (331) (414) +25%Adjusted EBITDA - Capex 212 314 +48%Net debt 542 937 +73%Cash generated by operations *** 213(*) Excluding acquisition of AOL customer base in November 2006 (505k)(**) Excluding restructuring costs(***) Variation in net debt, excluding acquisition of Club Internet, dividend paid and net increase in capitalSource : Neuf Cegetel

SFR Presentation – March 2008 – 28
Conclusion
The “new SFR” (*) is the leading alternative mobile + ADSL operator in Europe…
18.8M mobile customers
3.6M ADSL customers including 9Cegetel
~€12bn revenues
… and has key assets to take advantage of the growth of broadbandmobile and Internet and the move towards digital personal communication
Strong SFR brand
Large customer bases for FTTH deployment
Full-IP multi-access convergent network
Strong retail and on-line distribution networks
Culture of client-oriented innovation
(*) Including Neuf Cegetel, subject to approval of French competition authorities

SFR Presentation – March 2008 – 29
Appendices

SFR Presentation – March 2008 – 30
SFR : a responsible behaviour
Sustainable environment
• Landscape respect
• Use of old GSM/GPRS site to install new Nod B
• Respect of OMS electromagnetic rules
• « Trophée SFR » Creation
• >120 000 phones recycled per year
Mobility for everyone
• Visio and 3G offers dedicated to the deaf
• Free software solutions dedicated to the blind
• Secured access for the youngest
• 75 projects of an association helped to support social and cultural mobility
• creation of a « mobility lab »
• creation of a fund to support citizen actions
• Numerous sponsors (10 firms)
• Partnership with both the education ministry and ministry in charge of «logement et de la ville »
• 20 engineering schools, 9 business schools
• 334 employees involved with a student
“Entreprise citoyenne”

SFR Presentation – March 2008 – 31
FY-07 Performance
Key metrics FY-2007 FY-2006 Growth
Customers (in '000) * 18,766 17,883 + 4.9%
Proportion of postpaid customers * 65.5% 65.0% + 0.5 pt
3G customers (in '000) * 4,082 2,686 + 52.0%
EoP estimated market share * 33.9% 34.6% – 0.7 pt
Network market share * 36.1% 35.8% + 0.3 pt
12-month rolling blended ARPU (€/year) 440 455 – 3.3%
12-month rolling postpaid ARPU (€/year) 570 596 – 4.4%
12-month rolling prepaid ARPU (€/year) 191 202 – 5.4%
Net data revenues 13.7% 12.8% + 0.9 ptas a % of service revenues (%)
Prepaid acquisition cost (€/gross add) 25 23 + 4.9%
Postpaid acquisition cost (€/gross add) 214 193 + 10.9%
Acquisition costs 7.5% 6.0% + 1.5 ptas a % of service revenues (%)
Retention costs 5.3% 4.7% + 0.6 ptas a % of service revenues (%)
Metrics including SRR* Excluding w holesale customers (MVNO), estimated at 1,208k customers at end of 2007, compared to 602k at end of 2006

SFR Presentation – March 2008 – 32
Eileen McLaughlinIR Director
Daniel SCOLANExecutive Vice President
Investor Relations+33.1.71.71.14.70
For any financial or business information, please refer to our Investor Relations website at: http://www.vivendi.com/ir
New York800 Third avenue
New York, NY 10022 / USAPhone: +1.212.572.1334
Fax: +1.212.572.7112
Paris42, Avenue de Friedland
75380 Paris cedex 08 / FrancePhone: +33.1.71.71.12.33
Fax: +33.1.71.71.14.16
Laurence DanielIR Director
Agnès De LeersnyderFinancial Analyst
Vivendi IR Team

SFR Presentation – March 2008 – 33
Important legal disclaimer
• This presentation contains forward-looking statements with respect to the financial condition, results of operations, business, strategy and plans of Vivendi. Although Vivendi believes that such forward-looking statements are based on reasonable assumptions, such statements are not guarantees of future performance. Actual results may differ materially from the forward-looking statements as a result of a number of risks and uncertainties, many of which are outside our control, including, but not limited to, the risk that Vivendi will not be able to obtain the necessary regulatory approvals in connection with certain transactions as well as the risks described in the documents Vivendi filed with the Autorité des Marchés Financiers (French securities regulator) and which are also available in English on our web site (www.vivendi.com).
• Investors and security holders may obtain a free copy of documents filed by Vivendi with the Autorité des Marchés Financiers at www.amf-france.org, or directly from Vivendi. The present forward-looking statements are made as of the date of the present presentation and Vivendi disclaims any intention or obligation to provide, update or revise any forward-looking statements, whether as a result of new information, future events or otherwise.