introduction to spss (for spss version 16.0) eric hamilton center for social science computation and...
Post on 21-Dec-2015
231 views
TRANSCRIPT

Introduction to SPSSIntroduction to SPSS(For SPSS Version 16.0)(For SPSS Version 16.0)
Eric HamiltonEric Hamilton
CENTER FOR SOCIAL SCIENCE COMPUTATION CENTER FOR SOCIAL SCIENCE COMPUTATION AND RESEARCH (CSSCR)AND RESEARCH (CSSCR)
UNIVERSITY OF WASHINGTONUNIVERSITY OF WASHINGTON
Winter Quarter, 2011Winter Quarter, 2011

Topics Covered in this Introductory Course*
-SPSS at a glance, basic structure-Cleaning & reformatting your data-Descriptive statistics – frequencies, explore, crosstabs
-Charts & graphs: histograms, legacy charts, editing graphs
-Saving your work-Resources for learning more about SPSS
*These slides correspond to the CSSCR SPSS Winter2011 course data set, found on the CSSCR website.

SPSS at a glanceSPSS at a glanceSPSS (Statistical Package for the Social Sciences) was designed to offer a more user-friendly data analysis platform than other statistical software (e.g., Mplus, R, SAS).
The newest version of SPSS is called “IBM SPSS Statistics 18”. IBM purchased SPSS in 2009. This tutorial refers to use of SPSS 16.0. There are some added functions in the new version, but for the most part, the usability is similar.

Opening SPSSOpening SPSS
Go to START, PROGRAMS, and find the SPSS 16.0 program
orThe computers in the CSSCR lab typically have SPSS on the desktop. Select the red box that says SPSS on the top.

Opening a data file in Opening a data file in SPSSSPSS
-Open the version of SPSS you want to work with.
-You can work with the wizard, or-Select File > Open > Data. -Select the format of your data with the “Files of type” button,
-then locate, select, and open your data file.

Basic structure of SPSSBasic structure of SPSSThere are multiple windows in SPSS
The Data Editor Window (.sav)shows data in two forms:Data viewVariable view
The Output Viewer Window (.spv)shows results of data analysis
The Syntax Editor Window (.sps)shows the syntax command script. This is also where you can type and run your own syntax commands.
Note: you must perform separate save procedures for the data editor (.sav), output viewer (.spv), and syntax editor (.sps) windows.Remember to save your work frequently, under names that will have meaning for you in the future.

The Editor Window:The Editor Window:Data view vs. Variable Data view vs. Variable
viewviewData view
Rows are casesColumns are variables (generally speaking)
Variable viewRows define the variables
Name, Type, Width, Decimals, Label, Values, Missing, Columns, Align, Measure.
The Measure of variables in the dataset is important: – Scale = “continuous” – age, weight, income– Nominal = “names” – categories that cannot be ranked (ID number)
– Ordinal = “ordered” – categories that can be ranked (level of satisfaction)

Data ManipulationData Manipulationselecting casesselecting cases
With the select cases command, you can select specific cases for analysis-click DATA-click SELECT CASES-click IF CONDITION IS SATISFIED-select the variable with which you will select cases-enter the logical/Boolean command to select the cases you want to analyze
–e.g., “Select Cases IF Grade = 12”

Data ManipulationData ManipulationTransform variableTransform variable
Example: create a new, transformed variable from an already existing variable-click Transform-click Compute Variable-Assign the new “Target Variable” TestScore_Ex-fill in numeric expression =
SQRT(TestScore)
If desired, you can create an If-Then statement by clicking on the IF button
-click INCLUDE IF CASE SATISFIES CONDITION, and enter (e.g.) CurrType= Integrated, then click OK

Data ManipulationData ManipulationRecode a variableRecode a variable
Recoding allows a researcher to create a new variable with, for example, a different set of parameters-Decide which Variable(s) you want to recode-click TRANSFORM-click RECODE INTO DIFFERENT VARIABLE
-move CurrType over to the right-create a name for the new variable: CurrNum -click Old and New Values
Recoding a variable Recoding a variable (contin.)(contin.)
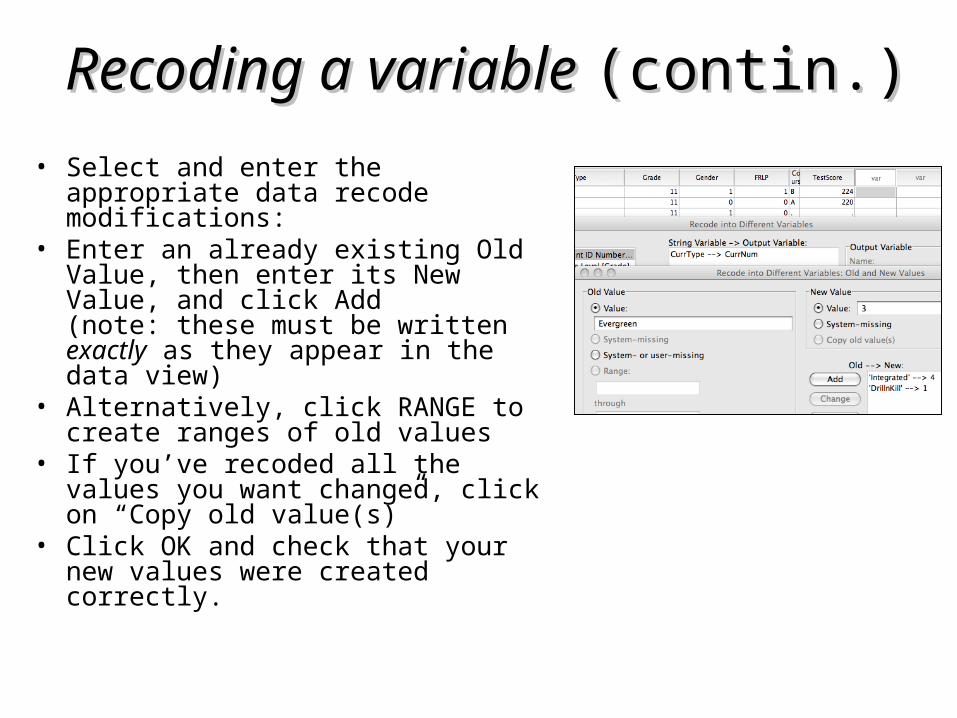
• Select and enter the appropriate data recode modifications:
• Enter an already existing Old Value, then enter its New Value, and click Add(note: these must be written exactly as they appear in the data view)
• Alternatively, click RANGE to create ranges of old values
• If you’ve recoded all the values you want changed, click on “Copy old value(s)”
• Click OK and check that your new values were created correctly.

The Variable View:The Variable View:Recording Value LabelsRecording Value Labels
After recoding your variables, you may want to record the values assigned to each variable’s category. You can note in SPSS what your numeric values stand for in the “Value Labels” area. This is helpful if you’ve recoded and need to keep track of what’s what.-Select the Value Labels drop-down, and record the values and labels for your range of new data.-If you forget how you recoded your data, your labels should be available in your output (.spo) file.

The Variable View:The Variable View:Accounting for Accounting for missing datamissing data
Many data sets have a few, or a lot of, missing data points.
SPSS lets you account for missing data in two ways: system-missing (indicated by by one period in the data cell); and user-defined (specified by you, the user).
Click on a variable’s “missing” drop-down, and enter the specific, discrete values (such as 999) that represent missing data in your data set.
A range can also be used if, for example, you only want to use half of a scale.
Also, system-missing data is assigned by SPSS when a function cannot be performed. For example, dividing a number by zero. SPSS indicates that a value is system-missing

Descriptive Descriptive Statistics: Statistics: FrequenciesFrequencies
Lets say we are interested in learning more about the characteristics of the schools (School) in the example dataset.
Click ANALYZEClick DESCRIPTIVE
STATISTICSClick FREQUENCIESChoose School from the
list.

Descriptive Statistics: Descriptive Statistics:
ExploreExploreYou can also generate descriptive statistics on multiple variables at once.-Click ANALYZE-Click DESCRIPTIVE STATISTICS-Click EXPLORE-Decide which variables are your outcome (dependent) and which are your factors (independent) and -Move the variables you’re interested in over with the arrowNext, click Statistics/Plots/Options to choose which statistics and forms of output you are interested in having SPSS produce.

Descriptive Statistics: Descriptive Statistics: CrosstabsCrosstabs
To look at frequencies of data nested across multiple variables:-Click ANALYZE-Click DESCRIPTIVE STATISTICS-Click CROSSTABS-Move the variables you’re interested in over with the arrow-Select the options you would like to apply to the Crosstabs output (Statistics, etc.)-Click OK

Graphing Your DataGraphing Your DataGraphs can be generated and formatted (fairly) easily, and in a number of ways in SPSS. For example, click GRAPH > LEGACY DIALOGS > HISTOGRAM-Select Curriculum to go on the X axis, and StTestScore as the outcome Variable. -If desired, check the box labeled DISPLAY NORMAL CURVE.-You can also change the style of your graph in this element properties window. -These graphs can be exported, or copied and pasted into other programs, such as Word and Excel.

Graphing ContinuedGraphing ContinuedYour resulting graph should look something like this:
Double click on the graph to open the chart editor.

Formatting Formatting Graphs/ChartsGraphs/ChartsUse the Chart Editor to make
your graphs clearer and more professional-looking with SPSS
-Double click on the graph or chart in the output window, this opens the chart editor. -Double click on the part of the chart you want to edit. -Select and adjust the various properties until your chart appears as you wish (e.g., scale, labels, text, etc.)This takes some practice and experimenting!-Click Apply when you’re satisfied and SPSS will save your new chart/graph.

Analysis of Variance Analysis of Variance (ANOVA)(ANOVA)
a One-way Fixed Effects a One-way Fixed Effects AnalysisAnalysisAt last, your data is clean, and you want
to run some statistical tests. Perhaps you want to test for differences on test scores by, say, curriculum types in your data.
-First, make sure your data are set up with the appropriate “type” and “measure” attributes (factors are numeric)
Select Analyze > Compare Means > One-Way ANOVASelect your Dependent/Outcome Variable and your Factor/Independent Variable-Choose the commands you’d like SPSS to perform
-Visual output options-Whether you want descriptive output-Click OK, and review your output in the Output Viewer.

Saving your workSaving your workAfter all the data cleaning and various forms of analyses you’ve run, you want to be sure to save all of your work, in an organized fashion, and frequently! -Give your data files names that sufficiently descriptive of what you are working on, and that you will recognize when you come back to the data at some time in the future.-Backup your data (save in multiple locations), in case one source should become lost or corrupted.-Remember that each file format (.sav, .spv, .sps) should be saved as a uniquely identified element of your data analyses.-It may be useful, during the process of cleaning/analyzing, to save your work with ascending file names (e.g., schooldatacleaningA, schooldatacleaningB...), so that you have a backup if something goes wrong (the program decides to hickup, there is a power outage, etc.)

What we have covered:What we have covered:
-The basic structure of SPSS-Cleaning & transforming your data – selecting
cases, transforming, recoding, value labels-Descriptive statistics – frequencies, crosstabs,
explore -Charts & graphs: legacy charts, editing graphs-Saving your work

Helpful ResourcesHelpful ResourcesThere are many resources online to help you
learn SPSS (tutorials, blogs, etc.)– http://www.stat.tamu.edu/spss.php– http://www.ats.ucla.edu/stat/SPSS/– http://www.lrz.de/~wlm/wlmspss.htm
CSSCR has a Quicktime SPSS class and SPSS handouts on the CSSCR website.
CSSCR offers classes on SPSS frequently– come back for the SPSS Beyond the Basics class, or schedule an appt. with one of the CSSCR consultants!

Introduction to SPSSIntroduction to SPSS(For SPSS Version 16.0)(For SPSS Version 16.0)
Eric HamiltonEric Hamilton
CENTER FOR SOCIAL SCIENCE COMPUTATION CENTER FOR SOCIAL SCIENCE COMPUTATION AND RESEARCH (CSSCR)AND RESEARCH (CSSCR)
UNIVERSITY OF WASHINGTONUNIVERSITY OF WASHINGTON
Winter Quarter, 2011Winter Quarter, 2011