introduction to statistical packages eugene tseytlin deparment of biomedical informatics university...
TRANSCRIPT

Introduction to Statistical Packages
Eugene TseytlinDeparment of BioMedical Informatics
University of Pittsburgh
Expectations
NOT to become an expert in any statistical software package
NOT to become an expert statistician
Present an Overview of what solutions are available with emphasis on free open source software

About Me
Who Senior Software Developer
Where Department of BioMedical Informatics, University of Pittsburgh
Areas of Expertise Intelligent Tutoring Systems (ITS) Natural Language Processing (NLP) Digital Imaging: digital microscopy and fMRI Machine Learning
Technologies Java, Matlab, R, RapidMiner, SAS, C/C++, OWL, PHP, Perl

Introduction
Overview of what is available for statistical analysis
Overview of what is popular today and what are the trends for tomorrow
Overview of some individual software packages Overview of the dataset that we will be using in
next lecture
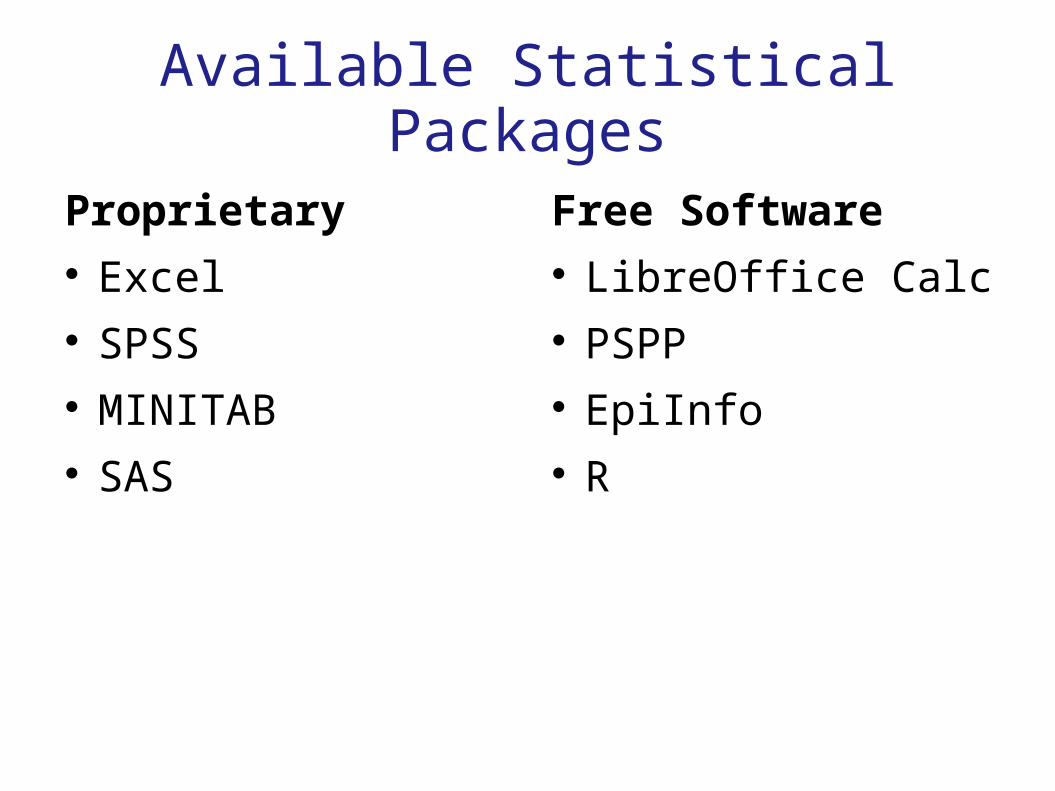
Available Statistical Packages
Proprietary Excel SPSS MINITAB SAS
Free Software LibreOffice Calc PSPP EpiInfo R

What is Used? (Academia)
Figure 7a. Use of data analysis software in academic publications as measured by hits on Google Scholar.
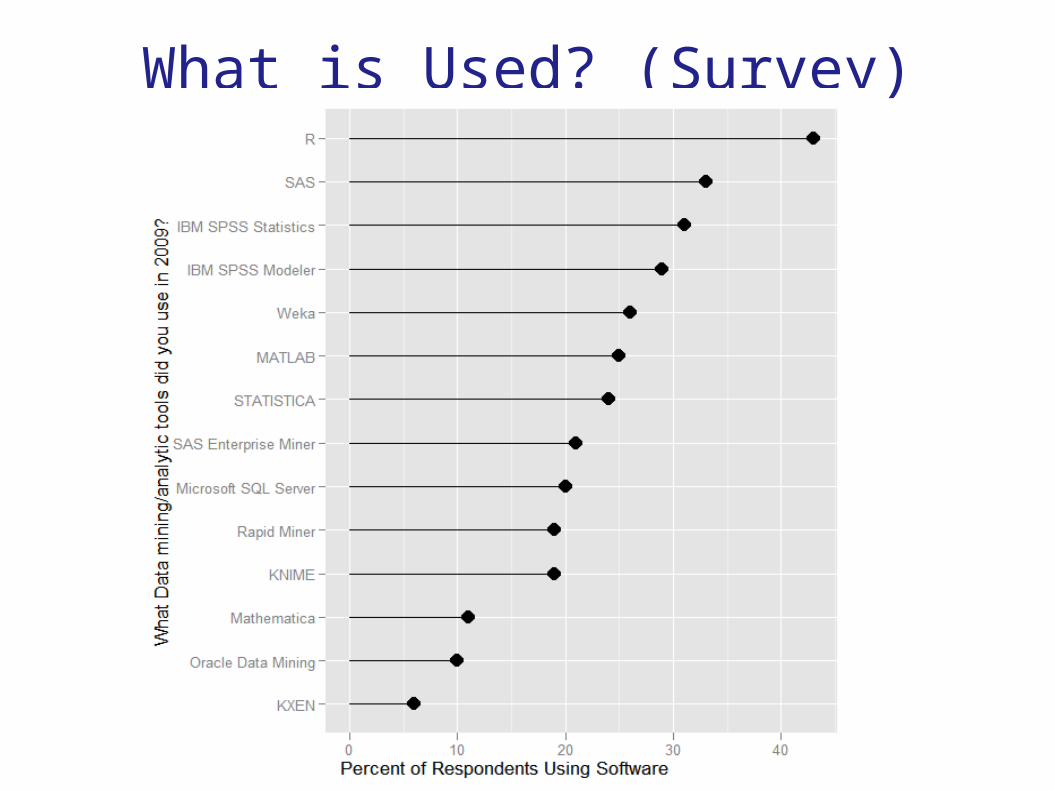
What is Used? (Survey)
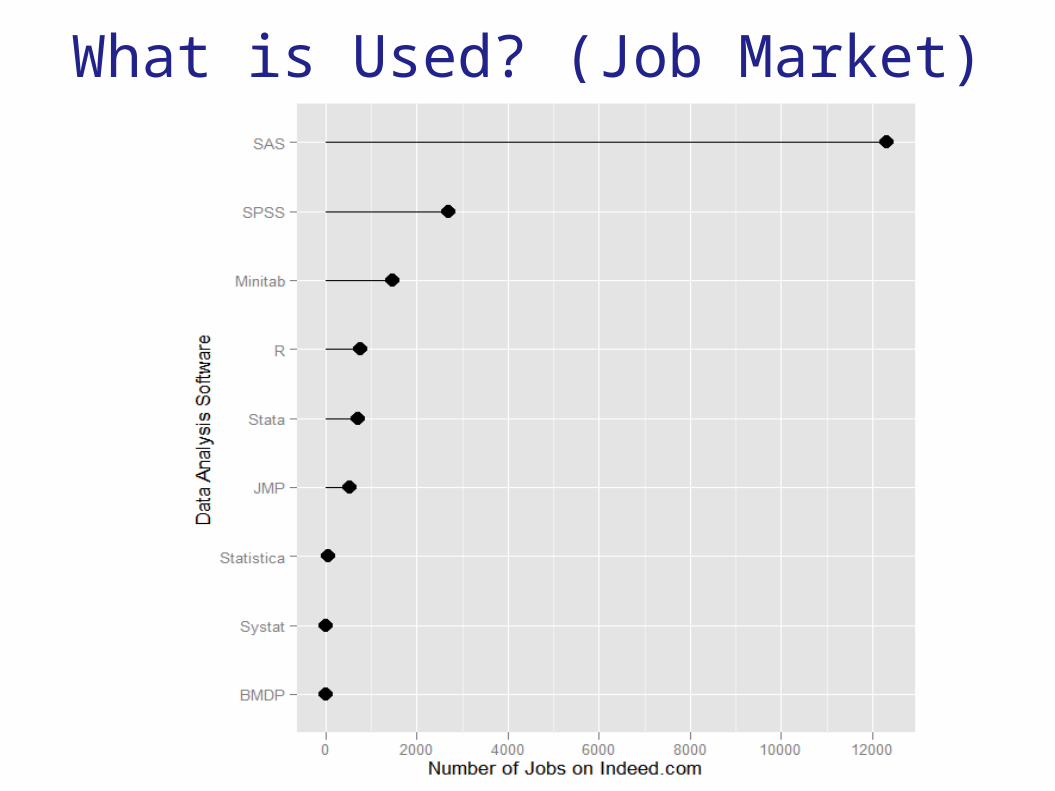
What is Used? (Job Market)
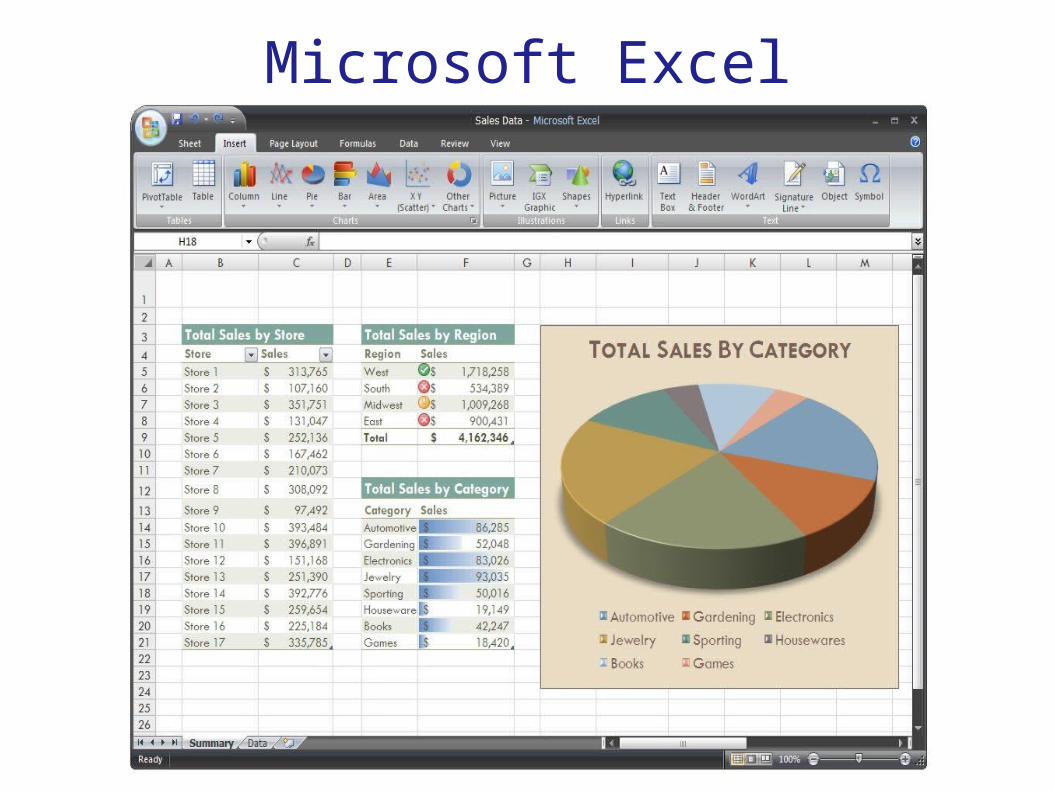
Microsoft Excel
Microsoft Excel
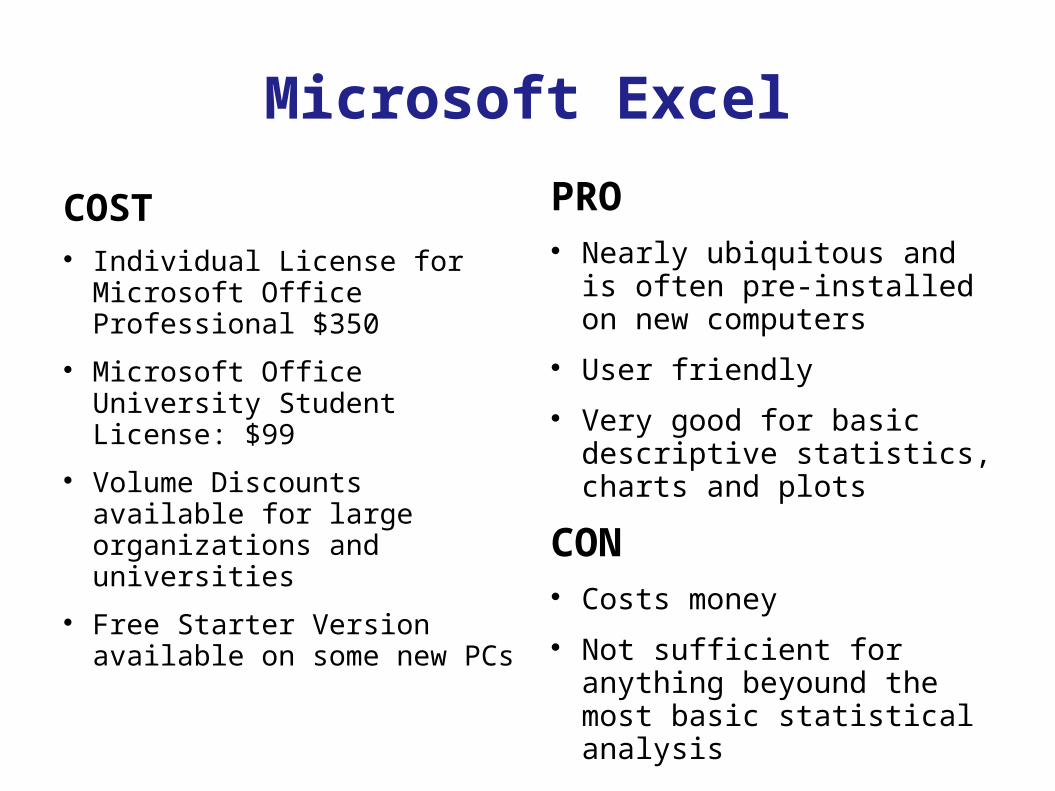
COST Individual License for
Microsoft Office Professional $350
Microsoft Office University Student License: $99
Volume Discounts available for large organizations and universities
Free Starter Version available on some new PCs
PRO Nearly ubiquitous and is
often pre-installed on new computers
User friendly
Very good for basic descriptive statistics, charts and plots
CON Costs money
Not sufficient for anything beyound the most basic statistical analysis

Minitab
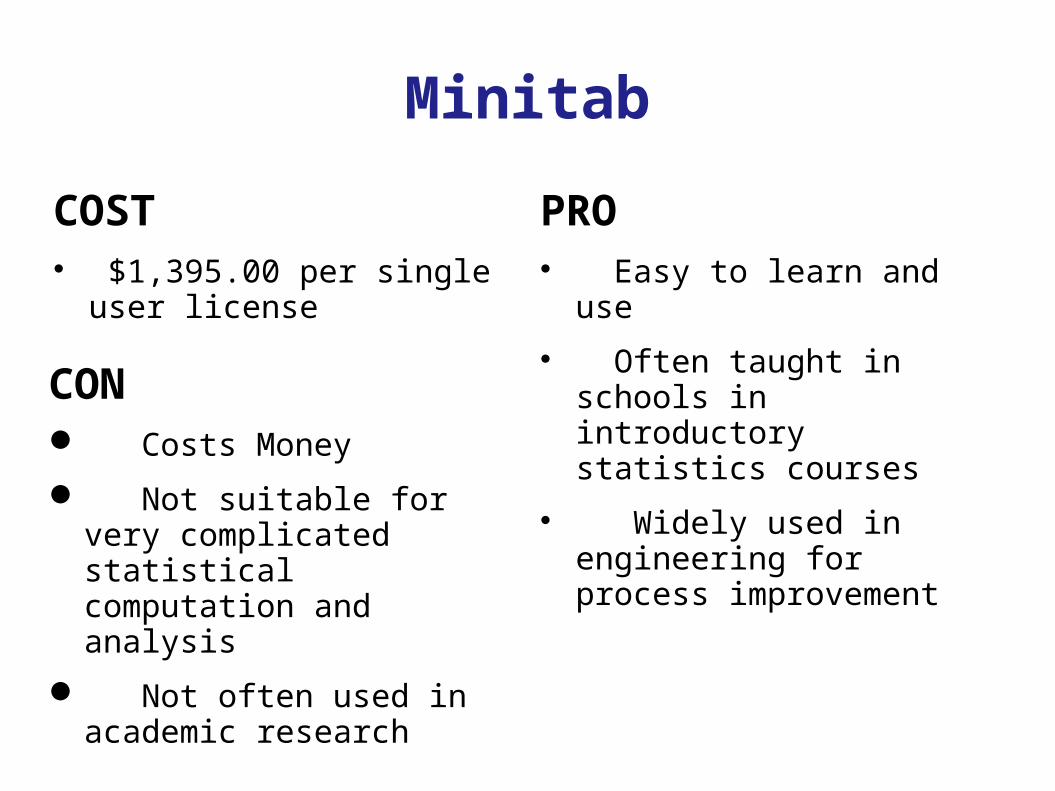
Minitab
COST $1,395.00 per single user
license
PRO Easy to learn and use
Often taught in schools in introductory statistics courses
Widely used in engineering for process improvement
CON Costs Money
Not suitable for very complicated statistical computation and analysis
Not often used in academic research
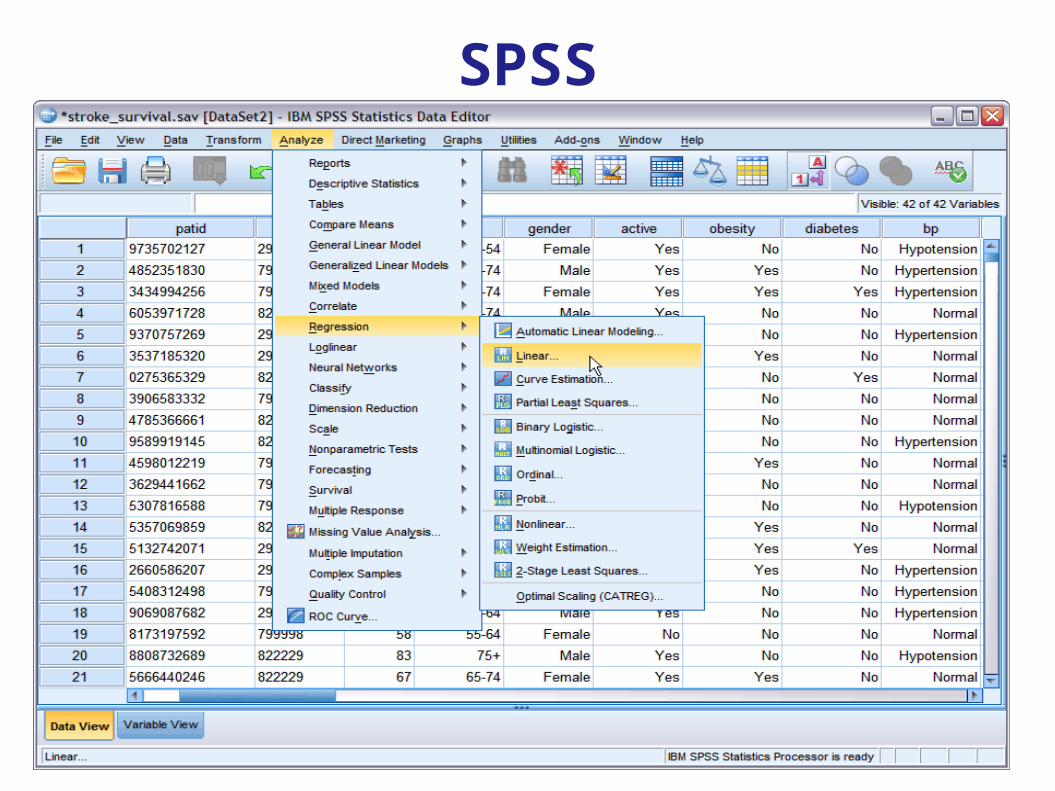
SPSS
SPSS
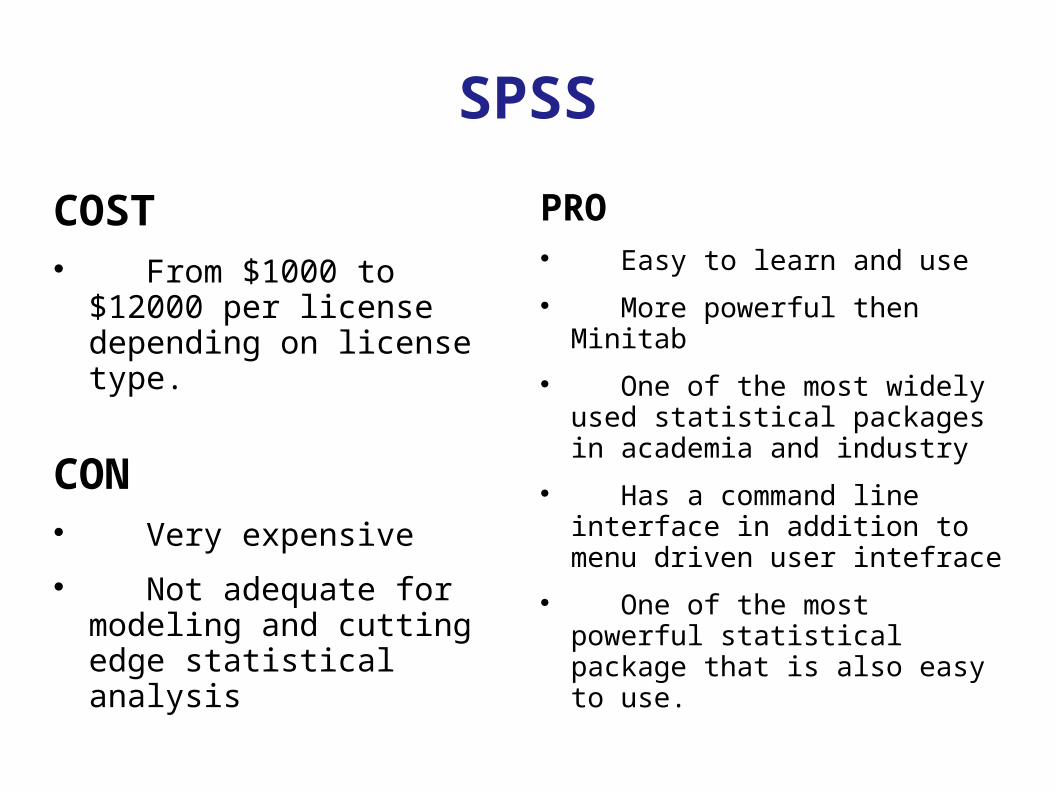
COST From $1000 to $12000 per
license depending on license type.
CON Very expensive
Not adequate for modeling and cutting edge statistical analysis
PRO Easy to learn and use
More powerful then Minitab
One of the most widely used statistical packages in academia and industry
Has a command line interface in addition to menu driven user intefrace
One of the most powerful statistical package that is also easy to use.
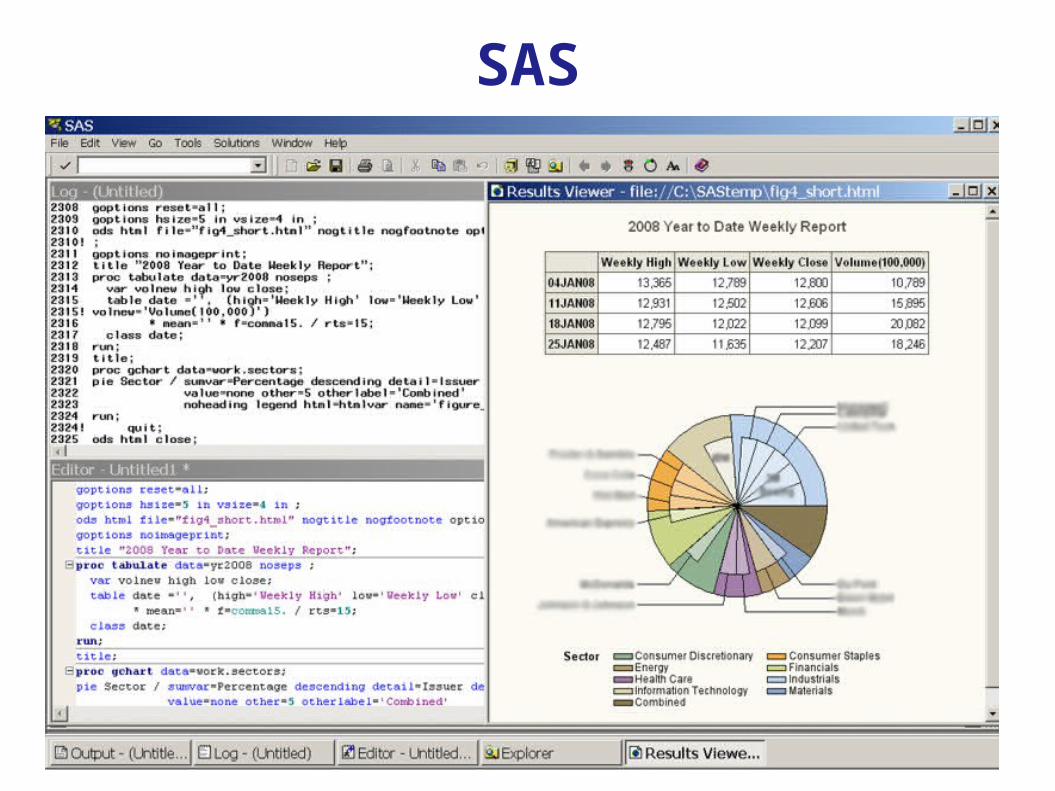
SAS

SAS
COST Complicated pricing model
$8,500 first year license fee
CON Very very expensive
Not user friendly
Steap learning curve
Relatively poor graphics capabilities
PRO Widely accepted as the leader
in statistical analysis and modeling
Widely used in the industry and academia
Very flexible and very powerful.
LibreOffice Calc
LibreOffice CalcLibreOffice is a free and open source office suite,
developed by The Document Foundation. It is descended from OpenOffice.org, from which it was forked in 2010
OpenOffice vs LibreOffice Star → Sun → Oracle → Apache, Document Foundation OpenOffice
http://www.openoffice.org/download LibreOffice
http://www.libreoffice.org/download/
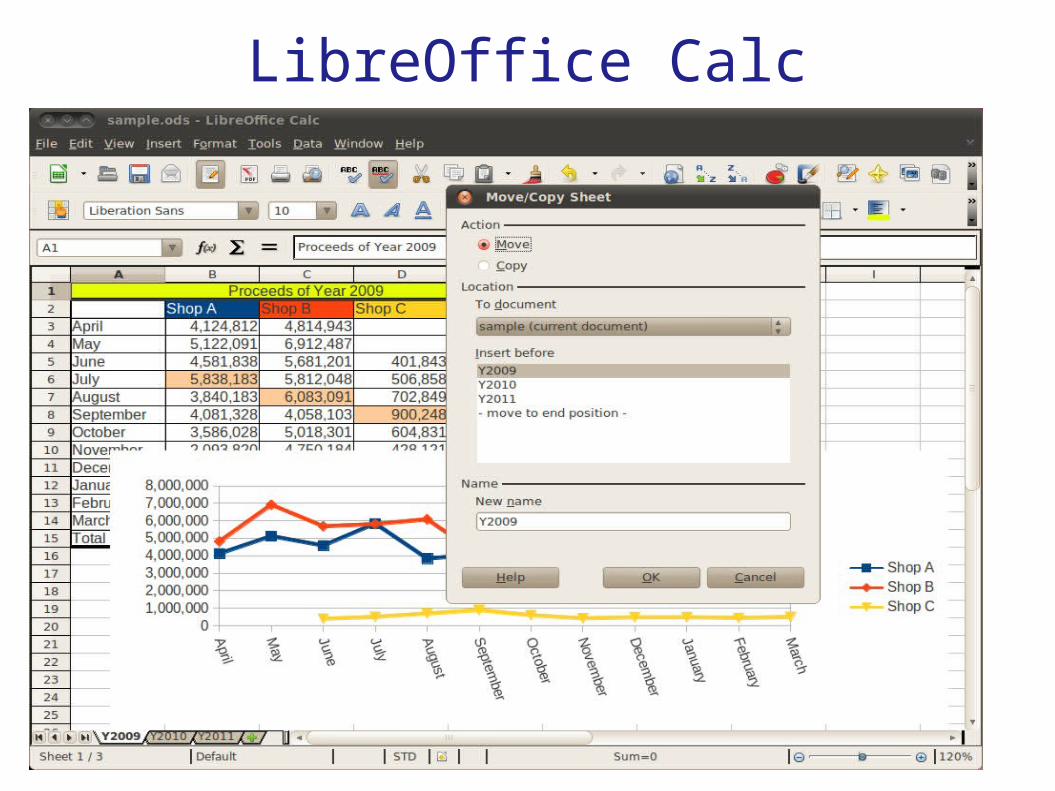
LibreOffice Calc
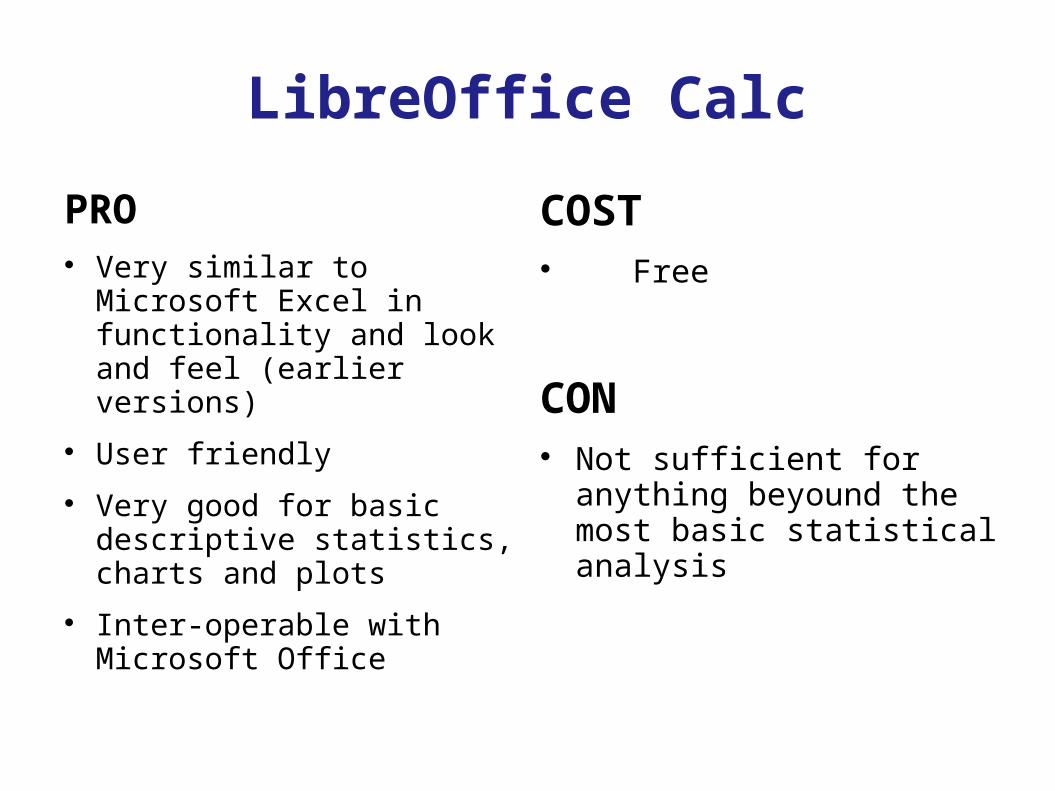
PRO Very similar to Microsoft
Excel in functionality and look and feel (earlier versions)
User friendly
Very good for basic descriptive statistics, charts and plots
Inter-operable with Microsoft Office
COST Free
CON Not sufficient for anything
beyound the most basic statistical analysis
EpiInfo

EpiInfo
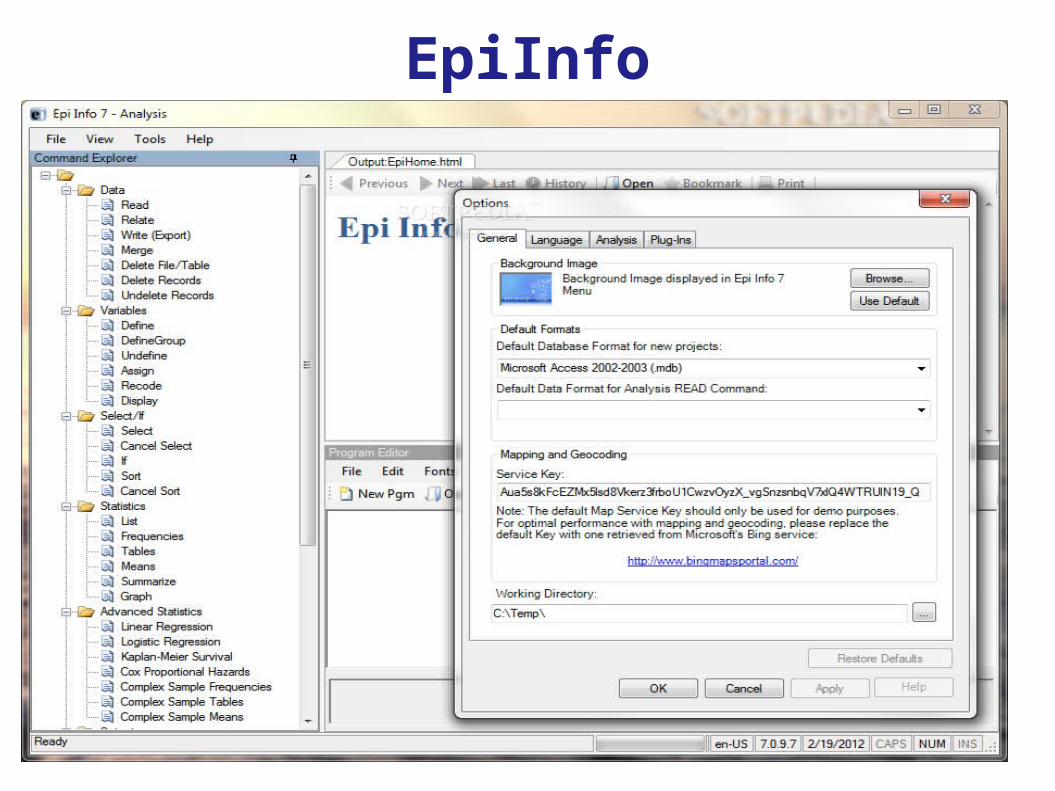
Epi Info is public domain statistical software for epidemiology developed by Centers for Disease Control and Prevention (CDC)
Epi Info has been in existence for over 20 years and is currently available for Microsoft Windows. The program allows for electronic survey creation, data entry, and analysis. Within the analysis module, analytic routines include t-tests, ANOVA, nonparametric statistics, cross tabulations and stratification with estimates of odds ratios, risk ratios, and risk differences, logistic regression (conditional and unconditional), survival analysis (Kaplan Meier and Cox proportional hazard), and analysis of complex survey data. The software is in the public domain, free, and can be downloaded from http://www.cdc.gov/epiinfo. Limited support is available
EpiInfo
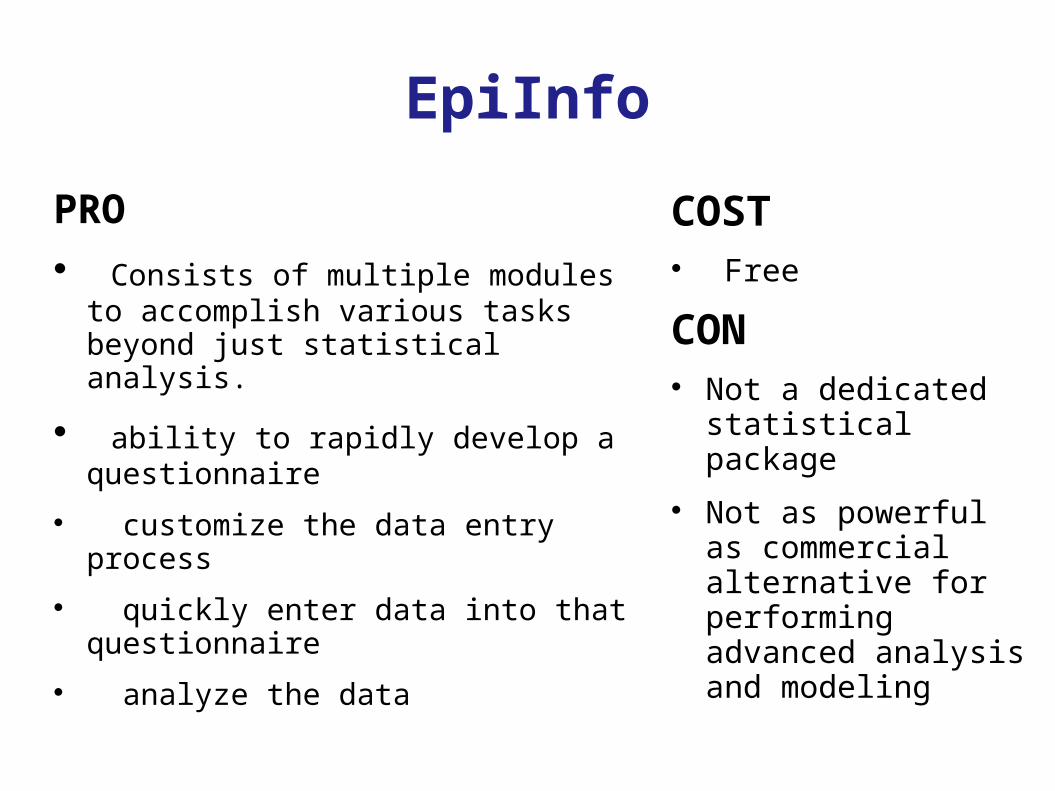
PRO Consists of multiple modules to
accomplish various tasks beyond just statistical analysis.
ability to rapidly develop a questionnaire
customize the data entry process
quickly enter data into that questionnaire
analyze the data
COST Free
CON Not a dedicated
statistical package
Not as powerful as commercial alternative for performing advanced analysis and modeling
PSPP
PSPP
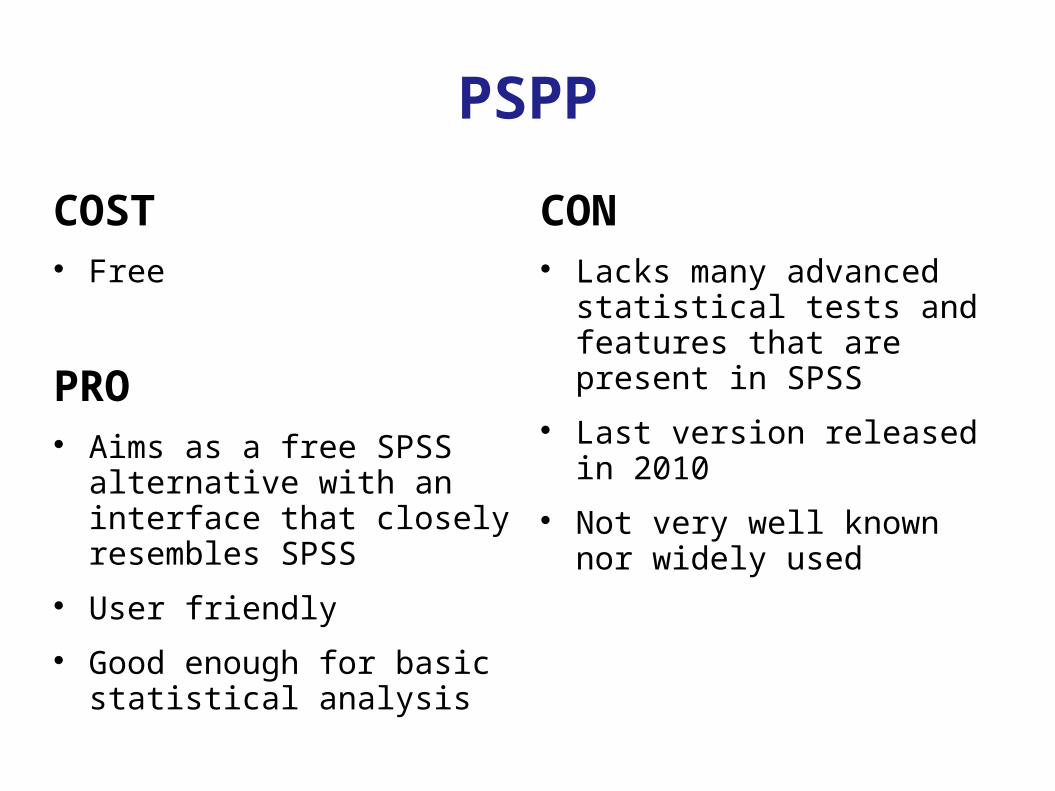
COST Free
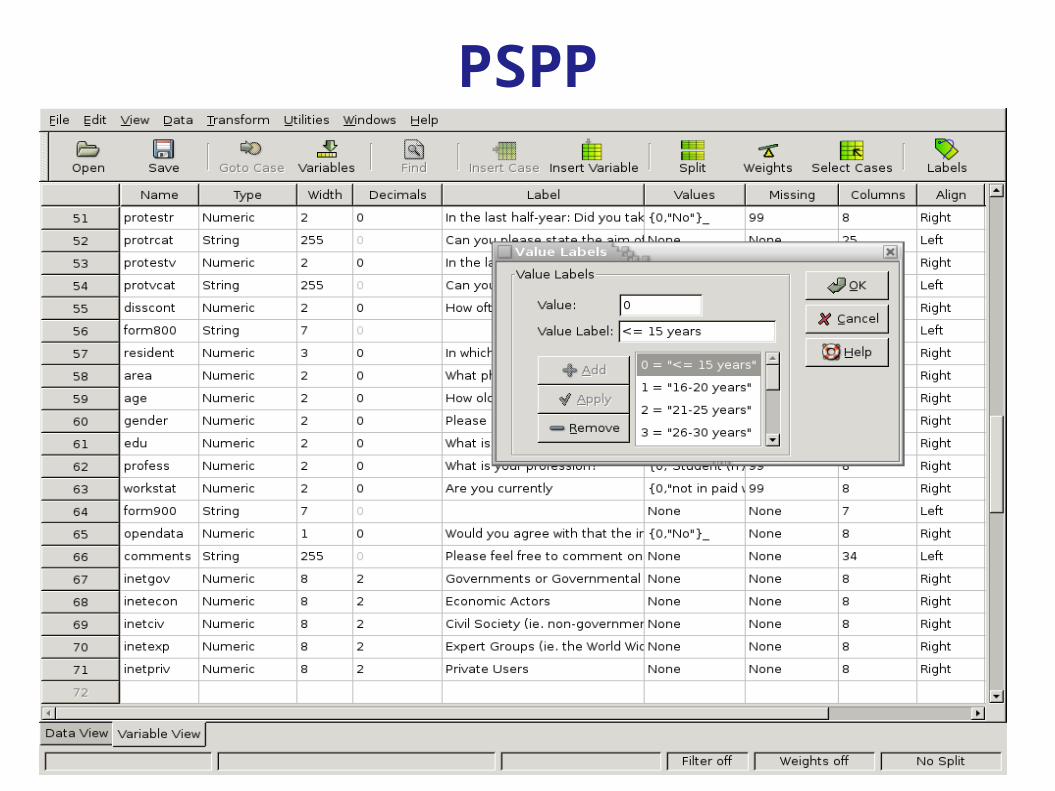
PRO Aims as a free SPSS
alternative with an interface that closely resembles SPSS
User friendly
Good enough for basic statistical analysis
CON Lacks many advanced
statistical tests and features that are present in SPSS
Last version released in 2010
Not very well known nor widely used
R

R
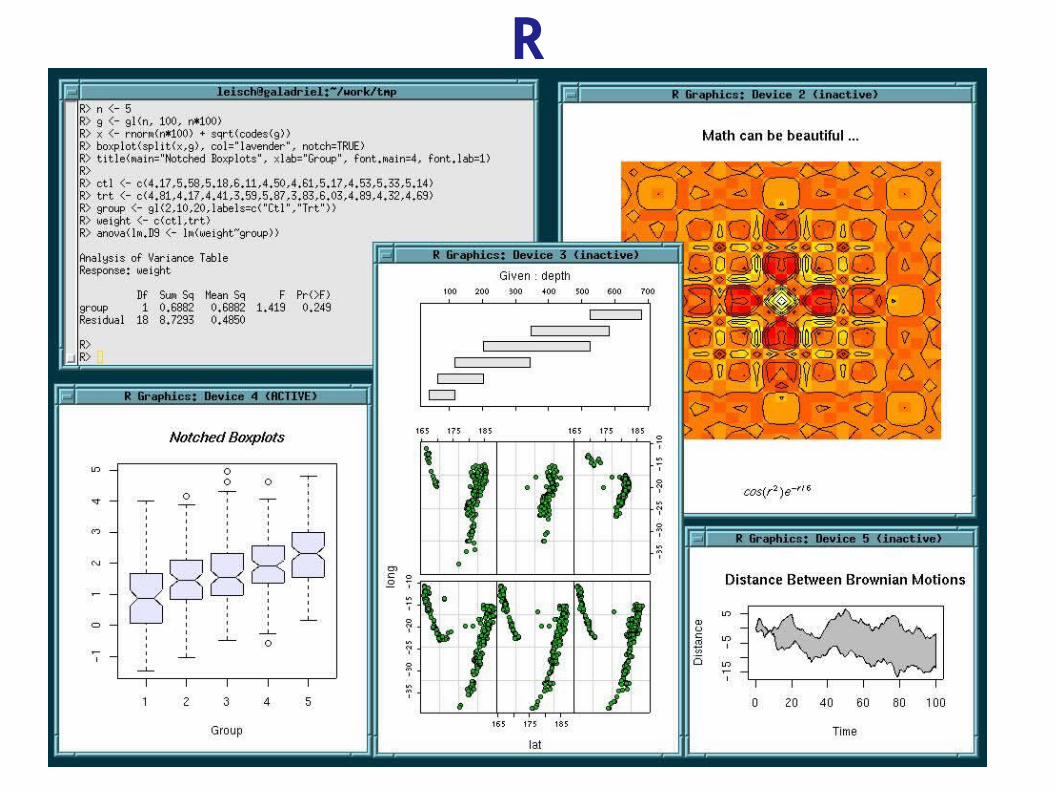
R provides a wide variety of statistical and graphical techniques, including linear and nonlinear modeling, classical statistical tests, time-series analysis, classification, clustering, and others. R is easily extensible through functions and extensions, and the R community is noted for its active contributions in terms of packages. There are some important differences, but much code written for S runs unaltered. Many of R's standard functions are written in R itself, which makes it easy for users to follow the algorithmic choices made.
R is highly extensible through the use of user-submitted packages for specific functions or specific areas of study. Due to its S heritage, R has stronger object-oriented programming facilities than most statistical computing languages. Extending R is also eased by its permissive lexical scoping rules.[10]
According to Rexer's Annual Data Miner Survey in 2010, R has become the data mining tool used by more data miners (43%) than any other.[11]
Another strength of R is static graphics, which can produce publication-quality graphs, including mathematical symbols. Dynamic and interactive graphics are available through additional packages.[12]

R
PRO Widely used and accepted in
industry and academia
Very powerful and flexible
Very large user base
Lots of books and manuals
Several User Interface Shells available
COST Free / Open Source
CON Not user friendly
Requires steep learning curve
Dataset
The Dataset and Story Libraryhttp://lib.stat.cmu.edu/DASL/
DASL (pronounced "dazzle") is an online library of datafiles and stories that illustrate the use of basic statistics methods. We hope to provide data from a wide variety of topics so that statistics teachers can find real-world examples that will be interesting to their students. Use DASL's powerful search engine to locate the story or datafile of interest.
Brain Size and Intelligence
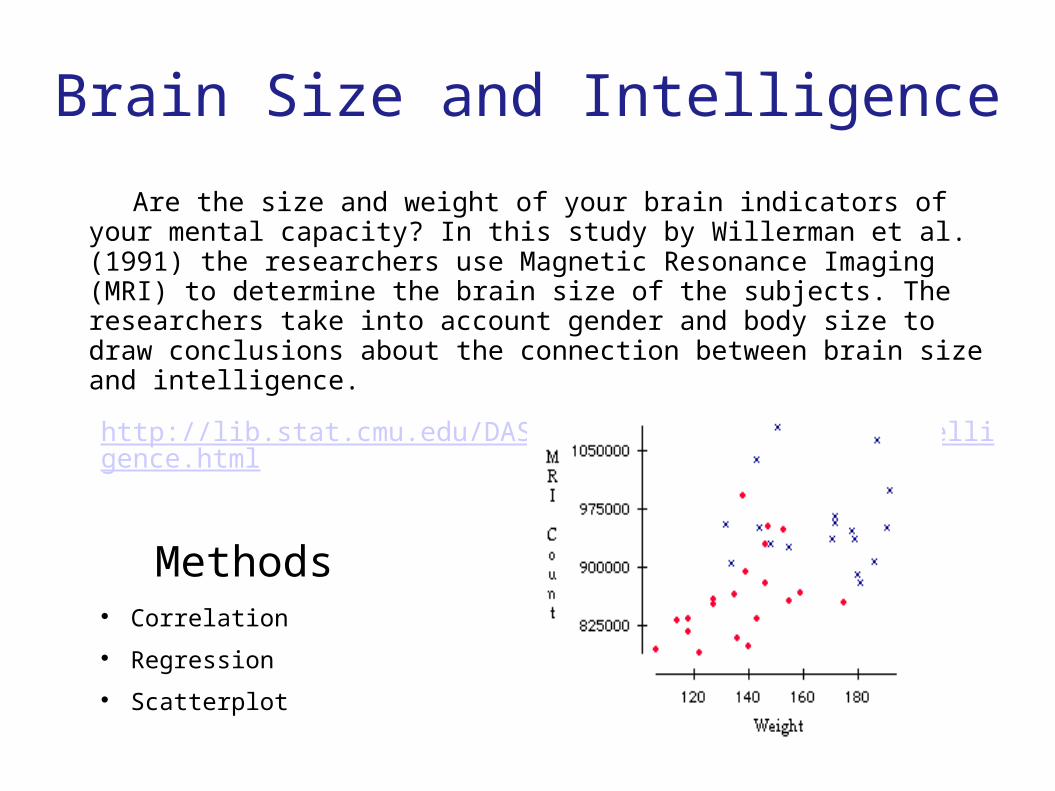
Are the size and weight of your brain indicators of your mental capacity? In this study by Willerman et al. (1991) the researchers use Magnetic Resonance Imaging (MRI) to determine the brain size of the subjects. The researchers take into account gender and body size to draw conclusions about the connection between brain size and intelligence.
http://lib.stat.cmu.edu/DASL/Stories/BrainSizeandIntelligence.html
Methods Correlation
Regression
Scatterplot

Brain Size and Intelligence Description: Willerman et al. (1991) collected a sample of 40 right-handed Anglo introductory
psychology students at a large southwestern university. Subjects took four subtests (Vocabulary, Similarities, Block Design, and Picture Completion) of the Wechsler (1981) Adult Intelligence Scale-Revised. The researchers used Magnetic Resonance Imaging (MRI) to determine the brain size of the subjects. Information about gender and body size (height and weight) are also included. The researchers withheld the weights of two subjects and the height of one subject for reasons of confidentiality.
Number of cases: 40
Variable Names:
Gender: Male or Female
FSIQ: Full Scale IQ scores based on the four Wechsler (1981) subtests
VIQ: Verbal IQ scores based on the four Wechsler (1981) subtests
PIQ: Performance IQ scores based on the four Wechsler (1981) subtests
Weight: body weight in pounds
Height: height in inches
MRI_Count: total pixel Count from the 18 MRI scans

Conclusion
Statistical analysis is an integral part of any study and publication
While commercial statistical software may cost an arm and a leg, free alternatives do exists.
While some free alternatives don't measure up, others are growing and expending rapidly and may overtake commercial software in features and popularity
References
https://sites.google.com/site/r4statistics/popularityhttp://en.freestatistics.info/http://lib.stat.cmu.edu/http://www.comfsm.fm/~dleeling/statistics/notes000.html