introduction to structural materials & methods
TRANSCRIPT
INTRODUCTION TO STRUCTURAL MATERIALS & METHODS
WITH REFERENCE TO CONCRETE, STEEL,
MASONRY TIMBER & GLASS
DENIS H. CAMILLERI dhcamill@maltanet. net
BICC CPD 5/12/02 STRUCTURAL DESIGN FOR THE SMALL PRACTICE

DUCTILE & BRITTLE MATERIALS
Steel Timber Concrete Masonry Glass Plasticity demonstrated by flat portion Brittle failure is sudden without a flat portion
DUCT I LE
B R I T T L E

Rectangular shapes I = bd3/12 Ze = bd2/6 Zp=bd2/4

Table 1 Material Ultimate
Stress (N/mm2)
Modulus of Elasticity (N/mm2)
Density (KN/m3)
Coeff of Thermal Expansion *10-6/oC
Embodied Energy MJ/kg (Embodied CO2)) (kg/t)
Material Factor of Safety γm
Mild steel 275 205000 70 10.8 35(2030) 1.0
High Yield steel 460 200000 70 10.8 35(2030) 1.0
Pre-stressing wire
1570 200000 70 35(2030) 1.15
Reinforced concrete
20-60 28000 24 10.8 8(203) 1.5
Timber: Softwood Hardwood
10-30** 35-70**
7000** 12000**
6
3.5** 3.5**
2(1644) 3(2136)
1.3***
Franka Masonry 7.5 17000 20 4.0 2(32) 2.5-3.5
Aluminium Alloy
255 70000 24 23.0 300(17000) 1.2
Glass fibre composite
250 20000 18 100(8070) 1.7
Float glass 7(28)* 70000 25 8.3 15(1130) 1.0
Toughened glass
50(56)* 70000 25 8.3 20(1130) 1.0
* Gust loading; ** Parallel to gram; ***EC5 - Timber

European Model Codes in the 60s and 70s The principles of partial safety factors was proposed in 1927,
by the Danish Moe. An early example of the result of this work is in a British
standard CP110. Any condition that a structure might attain, which contravened the basic requirement was designated a Limit State. The most important innovation in CP110 was the explicit use of probability theory in the selection of “characteristic” values of strength which – according to some notional or measured distribution – would be exceeded in at least 95% of standardised samples.
In 1978 the Nordic Committee on Building Regulations (1978) issued a report on Limit State Design containing “Recommendation for Loading and Safety Regulations of Structural Design” – NKB report No 36.
It introduces a concept of Structural Reliability dealing in safety and control class
LIMIT STATE DESIGN – CHARACTERISTIC VALUE & DESIGN STRENGTH
CHARACTERISTIC STRENGTH OF A MATERIAL is the strength below which not more than 5% (or 1 in 20) samples will fail.
CHARACTERISTIC STRENGTH = MEAN VALUE – 1.64 X Standard Deviation
DESIGN STRENGTH = CHARACTERISTIC STRENGTH fu
MATERIAL FACTOR OF SAFETY γm

EXAMPLE: Ten concrete cubes were prepared and tested by crushing in
compression at 28 days. The following crushing strengths in N/mm2 were obtained:
44.5 47.3 42.1 39.6 47.3 46.7 43.8 49.7 45.2 42.7 Mean strength xm = 448.9 = 44.9N/mm2
10 Standard deviation = [(x-xm)2/(n-1)] = (80/0) = 2.98N/mm2 Characteristic strength = 44.9 – (1.64 X 2.98) = 40.0 N/mm2 Design strength = 40.0 = 40.0 γm 1.5 = 26.7N/mm2
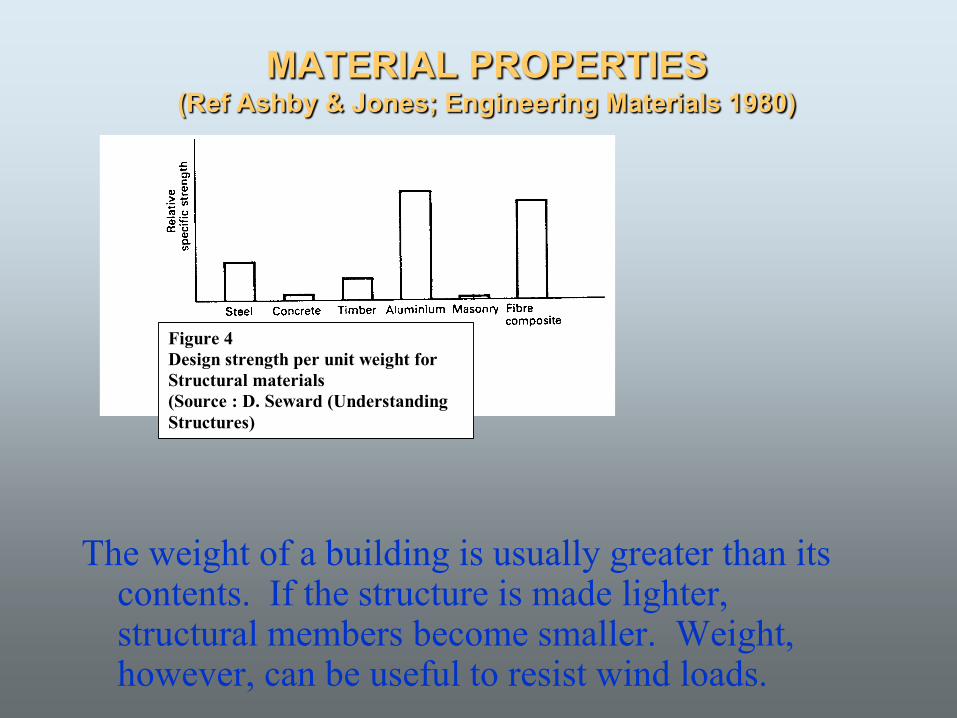
MATERIAL PROPERTIES (Ref Ashby & Jones; Engineering Materials 1980)
The weight of a building is usually greater than its
contents. If the structure is made lighter, structural members become smaller. Weight, however, can be useful to resist wind loads.
4 Figure 4 Design strength per unit weight for Structural materials (Source : D. Seward (Understanding Structures)
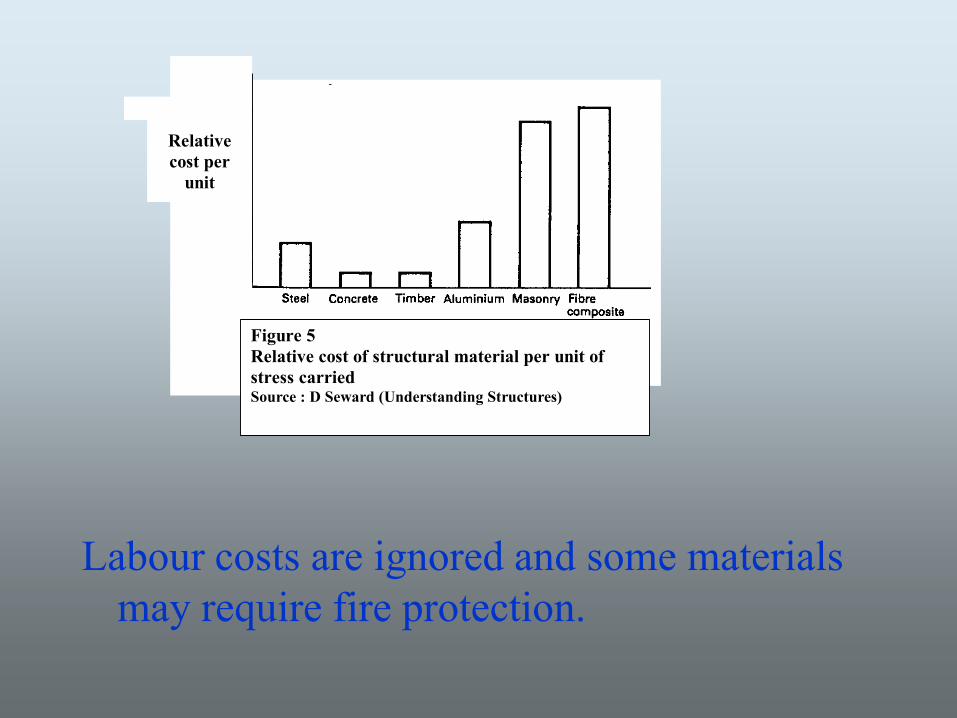
Labour costs are ignored and some materials
may require fire protection.
Figure 5 Relative cost of structural material per unit of stress carried Source : D Seward (Understanding Structures)
Relative cost per
unit strength
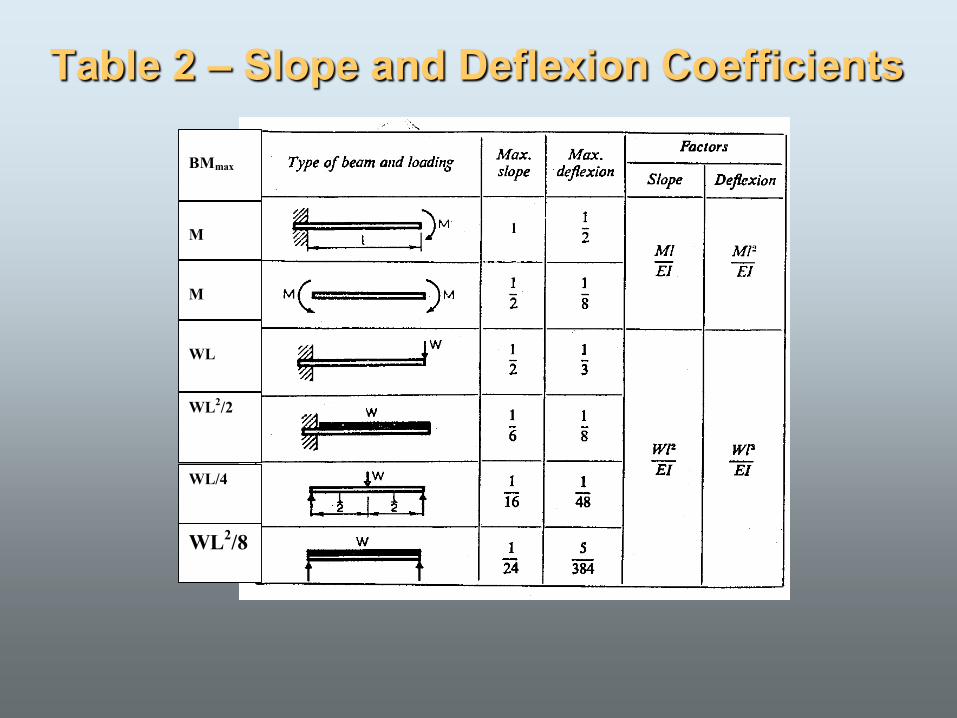
Table 2 – Slope and Deflexion Coefficients
BMmax
M
M
WL
WL2/2
WL/4
WL2/8

With many structures, the design is limited by
excessive deflections rather than strength, making specific modulus important
Fig 6 Modulus of elasticity per unit weight for structural materials (Source: D. Seward (Understanding Structures)

LOADS & LIMIT STATE DESIGN Gk = characteristic dead load
Qk = characteristic imposed load Wk = characteristic wind load
Partial safety factors for loads, γf Design load = characteristic load X γf
Table 3
Load Combination Dead Imposed Wind
Dead and imposed 1.4* or 1.0 1.6* -
Dead and wind 1.4 and 1.0 - 1.4
Dead and imposed and wind
1.2 1.2 1.2
* Eurocodes give these values as 1.35 and 1.5 respectively Loads from liquids and earth pressure use the same factors as dead loads
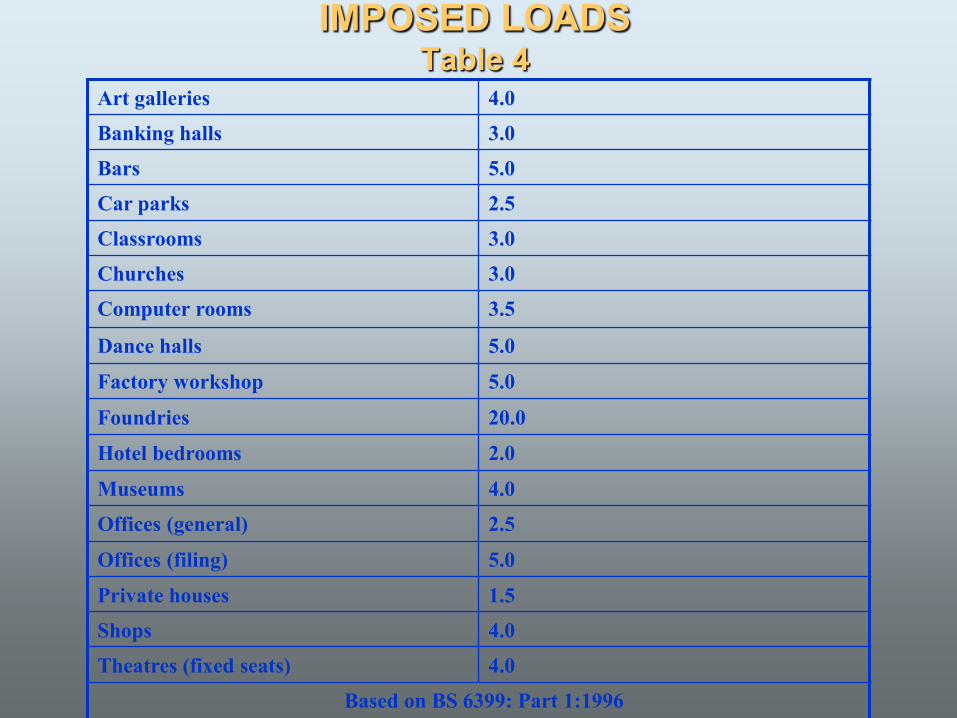
IMPOSED LOADS Table 4
Art galleries 4.0 Banking halls 3.0 Bars 5.0 Car parks 2.5
Classrooms 3.0 Churches 3.0 Computer rooms 3.5
Dance halls 5.0
Factory workshop 5.0
Foundries 20.0
Hotel bedrooms 2.0
Museums 4.0 Offices (general) 2.5
Offices (filing) 5.0
Private houses 1.5 Shops 4.0 Theatres (fixed seats) 4.0
Based on BS 6399: Part 1:1996

Table 5 - Wind Pressure for the Maltese Islands in KN/m2 for various building heights & terrains for a basic wind speed of 47m/s, where the greater horizontal or vertical dimension does not exceed 50m, as per CP3:ChV.
H – m Sea front with a long fetch
Countryside with scattered wind breaks
Outskirts of towns and villages
Town centers
cladding cladding cladding cladding 3 or less 1.05 1.12 0.90 0.97 0.81 0.86 0.70 0.76 5 1.12 1.19 1.00 1.07 0.88 0.95 0.74 0.81 10 1.28 1.35 1.19 1.26 1.00 1.05 0.84 0.90 15 1.34 1.39 1.28 1.35 1.12 1.19 0.93 1.00 20 1.36 1.43 1.32 1.39 1.22 1.28 1.01 1.07 30 1.42 1.47 1.39 1.44 1.31 1.36 1.15 1.21 40 1.46 1.51 1.43 1.48 1.36 1.42 1.26 1.31 50 1.49 1.54 1.46 1.49 1.40 1.46 1.32 1.38 For Structural Eurocodes, 90% of the above values to be used
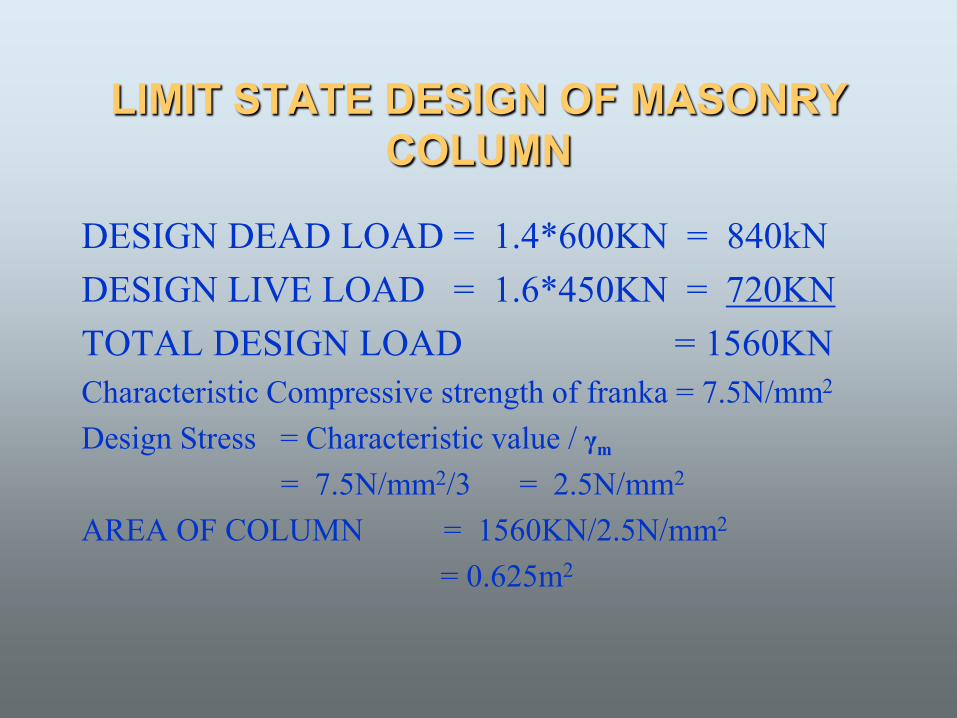
LIMIT STATE DESIGN OF MASONRY COLUMN
DESIGN DEAD LOAD = 1.4*600KN = 840kN DESIGN LIVE LOAD = 1.6*450KN = 720KN TOTAL DESIGN LOAD = 1560KN Characteristic Compressive strength of franka = 7.5N/mm2
Design Stress = Characteristic value / γm
= 7.5N/mm2/3 = 2.5N/mm2 AREA OF COLUMN = 1560KN/2.5N/mm2 = 0.625m2

SERVICEABILITY LIMIT STATE Loads factors taken as 1.0
Deflection} Vibration } design checks
Cracking – detailing Durability – specification Fire Resistance – the better the denser the
material
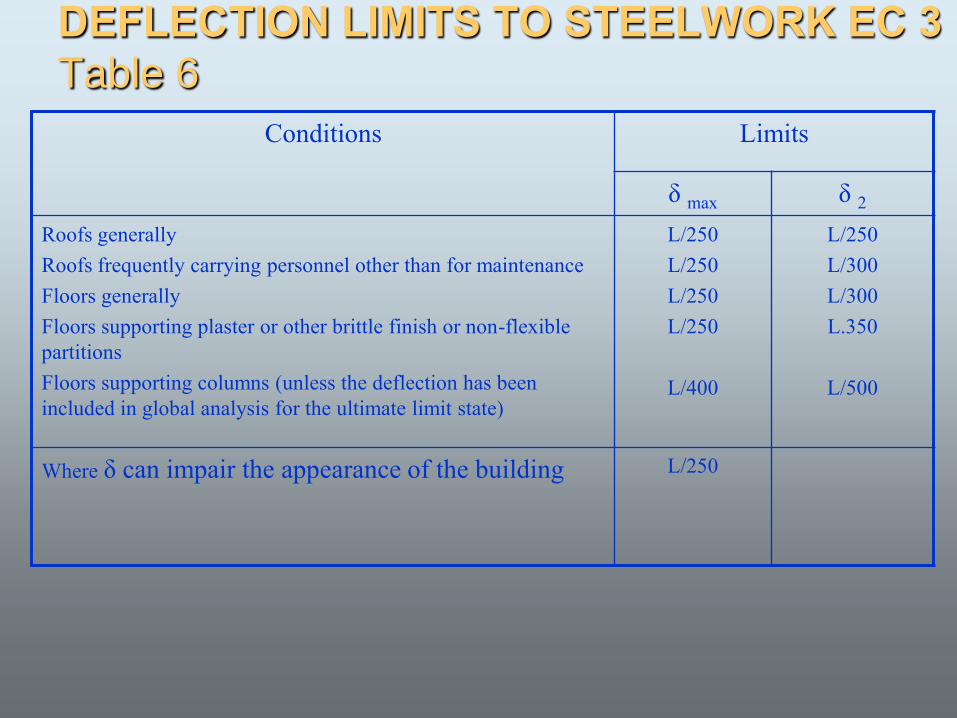
DEFLECTION LIMITS TO STEELWORK EC 3
Table 6
Conditions Limits
δ max δ 2 Roofs generally Roofs frequently carrying personnel other than for maintenance Floors generally Floors supporting plaster or other brittle finish or non-flexible partitions Floors supporting columns (unless the deflection has been included in global analysis for the ultimate limit state)
L/250 L/250 L/250 L/250
L/400
L/250 L/300 L/300 L.350
L/500
Where δ can impair the appearance of the building
L/250

δo = deflection due to pre-camber δ1 = deflection due to dead load δ2 = deflection due to live load
Timber deflection on live load is to be limited to L/300
Concrete calculated on span/depth ratios
Fig 7 – Deflection limits

Vibration to EC3 (steelwork) & EC5 (timber)
(a) The fundamental frequency of floors in dwellings and offices (EC3) should not be less than 3 cycles/second. This may be deemed to be satisfied when δ1 + δ2 (see Fig7) < 28mm.
(b) The fundamental frequency o floors used for dancing and gymnasia EC3 should not be less than 5 cycles/second. This may be deemed to be satisfied when δ1 + δ2 (see Fig 7) < 10mm.
(c) For domestic timber floors (EC5), the fundamental frequency is to lie between 8Hz<f<40Hz, may be deemed to be satisfied when δ1 + δ2 < 14mm (see Fig 7).

DESIGN THEORY Inexact design theory leads to a wider spread in the
failure loads and an even higher mean weight.
Fig 8 Statistical effect of design inaccuracy Source: Bolton :Design Codes 2002

MOMENT DISTRIBUTION – HARDY CROSS METHOD
KBA = 0.75I Kbc = I 3 4 ΣK = I 2 DF BA= (0.75I) / I = 0.5 ( 3 ) 2 DFBC = I / I = 4 2 MB = 150KN.1.67 = 250KN-m

MOMENT DISTRIBUTION - continued
-125 0.5 +250 250 0.5 125 -125 +62.5 62.5 BM – diagram further sub-frames
FIG 10
62.5 +62.5

PRINCIPLES OF GLASS DESIGN Glass in panes can deflect by more than its own thickness. This
takes designers into the realm of large deflection theory, when the pane deflects by more than ½ its thickness
Table 7 - ULTIMATE GLASS DESIGN STRESSES N/mm2
LOADING PERMANENT MEDIUM SHORT FLOAT 7 17 28
TOUGHENED 50 53 56
Fig 11 A comparison of small and large deflection Theory
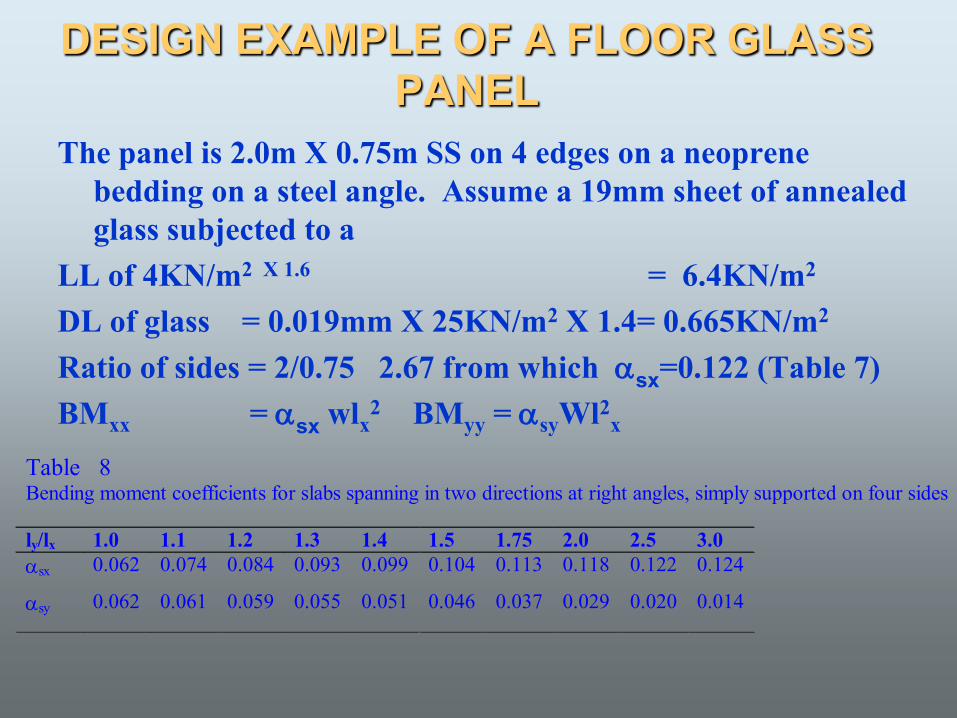
DESIGN EXAMPLE OF A FLOOR GLASS PANEL
The panel is 2.0m X 0.75m SS on 4 edges on a neoprene bedding on a steel angle. Assume a 19mm sheet of annealed glass subjected to a
LL of 4KN/m2 X 1.6 = 6.4KN/m2
DL of glass = 0.019mm X 25KN/m2 X 1.4= 0.665KN/m2
Ratio of sides = 2/0.75 2.67 from which sx=0.122 (Table 7) BMxx = sx wlx
2 BMyy = syWl2x
Table 8 Bending moment coefficients for slabs spanning in two directions at right angles, simply supported on four sides
ly/lx 1.0 1.1 1.2 1.3 1.4 1.5 1.75 2.0 2.5 3.0 sx 0.062 0.074 0.084 0.093 0.099 0.104 0.113 0.118 0.122 0.124
sy 0.062 0.061 0.059 0.055 0.051 0.046 0.037 0.029 0.020 0.014
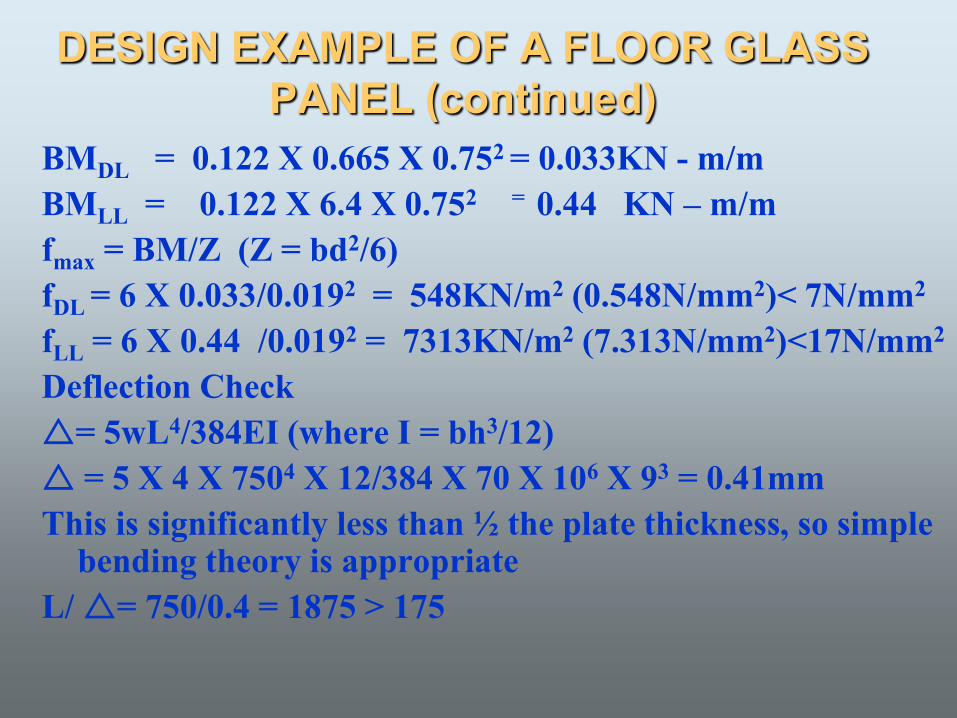
DESIGN EXAMPLE OF A FLOOR GLASS PANEL (continued)
BMDL = 0.122 X 0.665 X 0.752 = 0.033KN - m/m BMLL = 0.122 X 6.4 X 0.752 = 0.44 KN – m/m fmax = BM/Z (Z = bd2/6) fDL = 6 X 0.033/0.0192 = 548KN/m2 (0.548N/mm2)< 7N/mm2
fLL = 6 X 0.44 /0.0192 = 7313KN/m2 (7.313N/mm2)<17N/mm2 Deflection Check = 5wL4/384EI (where I = bh3/12) = 5 X 4 X 7504 X 12/384 X 70 X 106 X 93 = 0.41mm This is significantly less than ½ the plate thickness, so simple
bending theory is appropriate L/ = 750/0.4 = 1875 > 175