introduction to supply chains - hercher...
TRANSCRIPT

1
1.1 Supply Chain arChiteCture To present the different perspectives of this book, imagine the choices made by the architect of a building. If you step far enough away from the building, you observe the architect’s choices of shape of the building and how it fits in with its neighbors: its curb appeal, its con-tribution to the skyline, the type of architectural style, and so on. As you step closer to the building, you observe more details: layouts of various functional components such as access, elevators, information desks, and lobby; the number of different companies that share the building and their distribution; and so on. Finally, if you are one of the people using the build-ing, you observe how traffic flows through the building: congestion and delays for eleva-tors, flows of freight and postal deliveries, how special visitors are handled, how security is managed, the heating and cooling, building noise, and so on. Now transfer the same set of choices and vantage points to a supply chain. This book is about understanding and improv-ing choices made in the operation of a supply chain, at all of these viewing distances.
The first goal of this book is to focus on supply chain architecture by focusing on four specific concepts, i.e., the 4Cs of supply chain management. These four Cs are chain
Chapter 1Introduction to Supply ChainsThe supply chain of a firm consists of the business entities from raw material supplier to cus-
tomer. The supply chain is the firm’s lifeblood—delivering product to customers to generate
revenue, procuring components or services at globally competitive prices, and shepherding
new ideas from design to delivery to enable sustained competitiveness. This book provides
concepts, tools, and applications to understand how to manage supply chains effectively. Under-
standing supply chains is important because of their large economic footprint. The Twenty-
Second Annual State of Logistics report ([12]), published in June 2011, estimated that supply
chain costs were 8.3% of the overall US gross domestic product: an estimated $1.25 trillion.
This supply chain cost estimate was based on $2.1 trillion of US inventory carried across
the economy.
But how is supply chain management (SCM) defined by professional organizations? The
Council of Supply Chain Management Professionals (CSCMP), a professional society, states on
its website ([22]) that
Supply chain management encompasses the planning and management of all activities
involved in sourcing and procurement, conversion, and all logistics management activities.
Importantly, it also includes coordination and collaboration with channel partners, which
can be suppliers, intermediaries, third-party service providers, and customers. In essence,
supply chain management integrates supply and demand management within and across
companies.
In this book, we will use a 4C framework focused on chain structure, capacity, coordination,
and competitiveness to understand effective management of these steps.

2 Chapter 1
structure and ownership, capacity—its type and location across the supply chain, coor-dination mechanisms, and competitiveness—the metrics of competition and the com-petitive pressures faced by the supply chain. Choices made regarding each of these 4Cs generate possible supply chain architectures.
The next goal of this book is to focus on applications of these concepts to manage transactions within the supply chain architecture. Consider the functional transactions within a supply chain. Functional transactions refer to flows due to transportation, pur-chasing, warehousing, spare-parts management, recycling flows, and so on. Sector-specific applications will focus on details of transactions for industry-specific supply chains such as the grocery, apparel industry, humanitarian logistics, and developing country supply chains. For each of these flows, use of the 4C concept will enable us to understand how these transactions can be managed and performance improved or optimized.
The third and final goal of the book is to provide tools that can be used to manage and improve performance of a supply chain. These tools include simulation models, linear pro-gramming models, and calculus-based models. By permitting a quantitative estimate of the impact of improvements to the supply chain, these tools will enable management to get a forecast of the relative quantitative impact of alternate choices in managing the supply chain.
Thus there are three goals for this book: (1) an emphasis on concepts embodied by the 4Cs, (2) a focus on applications through consideration of transactions, and (3) a use of tools to estimate the impact of changes. Our pedagogical device will thus be a focus on concepts, applications, and tools to develop your capability in the field of supply chain management.
1.1.1 Chain Structure The chain structure of a supply chain for a product or service is the collection of enti-ties and paths through which material and information flow. Its description includes the ownership of the associated entities. Both information and material flows affect costs in a supply chain, so altering either of these can impact performance. Intuitively, longer chains might suffer from longer lead times and thus higher variability as one moves upstream. Similarly, chain structures that combine several parts into an assembled kit will suffer if their performance is constrained by a weak supplier. The inventory policies and capacities of a warehouse affect the retail outlets that share the space. In more general contexts, the network that governs the chain of flows may have system-atic effects on performance through its ability to redeploy flows as conditions change. Country boundaries that a chain crosses are also of concern because they affect duties, taxation, and so on. In short, supply chain structure, the first C, affects supply chain performance.
1.1.2 Capacity Capacity at any given stage in a supply chain is defined as the designed quantity of resources available to handle transactions that flow through that stage. Capacity decisions may require both long- and short-term considerations. Long-term contracts relate to plant sizing, infrastructure investments, and so on. Tactical decisions regarding capacity include short-term adjustments in workforce, scheduling considerations, and other factors. Capac-ity decisions often require a forecast of possible transaction flows. For example, given the long lead times for start-up of a supply chain, capacity decisions require demand forecasts with the possible consequence of large errors. This necessitates capacity buffers or contin-gency arrangements to deal with demand surges. Aligning capacity to impending demand is thus a key factor in determining supply chain performance, hence the importance of the second C, capacity.

3intrODuCtiOn
tO Supply ChainS
1.1.3 Coordination Coordination deals with the rules of engagement or contracts between separate entities in the supply chain. Many supply chains involve different owners, both locally and glob-ally. As ownership of a supply chain gets fragmented, coordination becomes essential to guarantee performance. In addition, legally acceptable rules of engagement may change with country boundaries and must be observed. These rules of operation may impact the amount that can be ordered during a period, the prices that will be charged, the commit-ted quantities over a period of time, the guaranteed delivery time, the agreed-upon efforts and rewards, and so on. In this book we will provide a number of possible coordination mechanisms, discuss their impact on supply chain performance, and provide applications to practice. Thus, coordination represents the third C in our list of concepts.
1.1.4 Competitiveness Competitiveness is the fourth C in our list of concepts. Managing the competitiveness of a supply chain requires two sets of choices—the choice of the metrics of competition as well as responses to competitors’ choices. Typical metrics used include lead time, cost, profit, product variety, consistency, service level, fill rate, and others. For a monopolist, it is important to identify appropriate metrics to coordinate optimal choices across the supply chain. However, competition has an impact on the feasible choices for a supply chain man-ager. In general, competition forces the supply chain manager to think about how best to compete, given other competitors’ actions, also known as an equilibrium view (Nash equi-librium) of required performance. In some cases, intense competition may force choices that significantly decrease profits but that are a necessary component to participate. Thus both the choice of metrics of competition as well as the level of competitive intensity affect supply chain choices and performance.
The next section will provide examples from sector-specific supply chains to illustrate the 4C concepts.
1.2 the BOOk Supply Chain The printing industry has annual revenues of over $210 billion. In the book supply chain, book printing is a $5 billion industry. The typical book supply chain operates as follows ([76]): Authors work with publishers to create content, who in turn place orders with print-ers. Printers print the physical books and ship them to wholesalers in full truckload quanti-ties. These larger loads received at wholesalers undergo break bulk (i.e., they are broken down into smaller shipments) at their fulfillment centers. Bookstores order books from the wholesalers and then manage retail sales. As an example, Ingram Book Company, a whole-saler, processed over 115 million books through eleven fulfillment centers to serve 32,000 outlets and accounts for one-third of all units shipped through wholesalers ([76]).
The top five printers constitute over 40% of the printing market volume. Printing eco-nomics dictate the use of large presses that can print 10,000 copies of a 250-page book in two hours with about one hour to set up the press. An average of 1 billion trade books is purchased in the United States. Of these, 50% are backlist books (i.e., published in previ-ous years). The other 50% of the demand consists of orders for the 51,000 current titles, i.e., released that year. The average new title sells fewer than 10,000 copies over its life-time. With 25,000 publishers and 51,000 new titles per year, the average publisher releases two titles a year. The largest, Random House, released 11,000 titles in 2011. The top ten publishers account for 20% of new titles. The largest publishers have a backlist of 30,000 titles. (For details see [76].)

4 Chapter 1
In the retail environment, bestsellers account for only 3% of sales. The number of book-stores, or retail outlets, went up from 6,500 in 1991 to 10,600 in 2007. In 2008, retail returns of books to the publisher were estimated to be 25% ([91]). An efficient supply network could save over $2 billion—the profit from sale of 1 billion trade books is about $4 billion.
1.2.1 the Book Supply Chain architecture The book supply chain involves the printer, the wholesaler, the retail store, and the cus-tomer. Ownership of this supply chain is fragmented, with each entity’s success based on different metrics. For printers to be competitive, they must have large-volume press runs that economize printing costs. Capacity decisions are made by retailer and wholesaler and determine the level of inventory and lead time to satisfy demand. Coordination between wholesaler and retailer depends on the flexibility offered for books to be returned from the retailer to the wholesaler. At the store level, competitiveness requires a large variety of books to be in stock, the flexibility for the customer to browse books before purchase, accessible locations, and other factors. The wholesaler has to be flexible to accommodate bookstore returns. The flexibility to return books provides the incentive for the bookstore to order efficient quantities from the supply chain.
1.3 the Diaper Supply Chain Diapers are a steady-selling item at the retail store. Yet, in the past, Procter and Gam-ble (P&G) faced large demand swings that percolated through the supply chain. These demand swings, termed the bullwhip effect, caused increased order volatility to suppli-ers and plants. One reason for such volatility was the different price brackets that were offered to retailers every day. Every retailer adjusted orders to attain the lowest cost pro-curement price for products. In addition, they offered products with volume discounts, discounts for joint purchases, customer backhaul discounts, and so on. The net effect was that the orders, i.e., demand seen by P&G, was unpredictable, even if retail demands were reasonably stable. The impact of these demand fluctuations was substantial. Addi-tional plant capacity, premium transportation payments, large finished goods invento-ries, warehouse space, raw material inventories—all added to the total cost to produce and distribute products ([38],[49]). Choices across supply chain participants were thus impacting performance.
The stimulus for change came from the increasing brand premium that customers were being forced to pay. P&G customers paid a brand premium of over $105 compared to a basket of generic products (a consumer’s typical mix of product purchased over a year). But the quality of generics was improving, and more and more customers seemed unwill-ing to pay the brand premium. Demand was declining, and P&G had to make significant changes to lower supply costs.
P&G evolved a new supply chain strategy. A new pricing plan was offered with a clearly stated, stable price that would remain in place except for known price adjust-ments due to backhaul, annual volume discounts, and so on. The new pricing scheme resulted in a dramatically lower order variability and correspondingly lower asset requirements. P&G closed over thirty plants and reduced supply chain assets such as warehouses and associated material handling equipment. Inventory turns increased sig-nificantly from sixteen to twenty-seven per year and in some cases up to seventy turns. But significant management attention was required: sales had new roles, customers had to get used to fewer price changes and hence lower order volatility, merchandising and product variety had to be tended to garner sales growth. Would such a system last? Would it be appropriate for new products? How would it affect P&G’s competitiveness in the industry?

5intrODuCtiOn
tO Supply ChainS
1.3.1 p&G’s Supply Chain architecture The diaper supply chain consists of flow from manufacturer to distributor to retail store to customer. The supply chain for diapers generated large volume fluctuations at the manu-facturer. Coordination with wholesalers was based on pricing. But the price variation used to attract retail purchases generated volume fluctuations for the manufacturing plants. Retailer competitiveness demanded that their buyers minimize the cost of goods sold, thus generating large order fluctuations. Manufacturer plant capacity, warehouse capacity at manufacturers and retailers, and transport capacity are all affected by the demand fluctua-tions. Coordination agreements in this industry include vendor-managed inventory (P&G manages the inventory at the Walmart warehouses), scanner-based promotions (where the manufacturer pays the retailer based on units sold during a particular period). Changes in the coordination agreements impact the entire supply chain.
1.4 Cemex: a new apprOaCh tO DiStriButinG Cement
Cemex is a Mexican cement manufacturer with worldwide operations ([10],[98]). One of the company’s main operations focuses on delivering mixed cement (i.e., concrete) to builders. Once mixed, concrete has to be used within a few hours. However, it is com-mon for contractors to order the cement and try to cancel at the last minute to accommo-date schedule delays in other steps. The industry service level was poor and flexibility to reschedule shipments in transit was minimal.
Cemex decided to leverage technology for concrete delivery the way Federal Express uses global positioning system (GPS) technology to track packages. Cemex invested over $200 million in a state-of-the-art information system that permitted GPS tracking of all of its delivery trucks ([10]). This close link between customer information, truck locations, and mixing centers enabled deliveries to be committed within a fifteen-minute window while permitting reschedules up to thirty minutes before delivery at no extra charge. Such flexibility has resulted in rapid growth in a mature industry.
But the next step was for Cemex to target the poorest segment of the population in Mex-ico. This segment was large and required special distribution and credit management capa-bilities. A key feature was the management of savings in poor households that could lead to tangible improvements in the housing, such as the addition of a room. Cemex created a savings plan whereby groups of families jointly worked to save to finance home improve-ments. The initiative, termed Patrimonio Hoy ([108]), rewarded families who saved con-sistently with construction material provided in advance by Cemex. Customers also had the flexibility to store material at Cemex or store it themselves. A new feature allowed US-based family members to deposit funds with Cemex’s financial representative in the United States, in return for either funds provision or material provision to their family in Mexico. The impact of these customer commitments increased the participation of Cemex further downstream and the complexity of the associated logistics system but potentially gener-ated a more stable source of demand.
1.4.1 the Cemex Supply Chain architecture The supply chain involves flows from the cement manufacturer to the concrete mixer to the construction site. Cemex modified these flows through the intensive use of tech-nology. Dynamic routing enabled last-minute cancellations to be accommodated. This coordination between Cemex and the user provided significant value for the user but depended on Cemex’s ability to accommodate such requests efficiently. The result was a

6 Chapter 1
more competitive supply chain that was responsive to customer demand and thus enabled significant market share growth. Having the right level of ability to accommodate change requests played a key role in this system. Coordinating incentives also included having visibility regarding future demands through the use of credit terms to enable manage-ment of the financing of construction materials, further increasing the success of the sup-ply chain.
1.5 Zara anD the apparel Supply Chain
Zara is a multibillion dollar Spanish company with stores all over the world. Zara owns large sections of the apparel supply chain and manages the entire chain to speed up innova-tion and product availability. One secret to Zara’s success is the constant flow of customer requests and information from stores to the design studios. In turn, Zara generates a con-stant flow of product from plants to stores, even at the expense of retiring products for which there is demand.
Zara represents a new generation of supply chains in the apparel industry. The follow-ing anecdote regarding Zara says it all:
When Madonna went on tour in Spain in early 2001, she started in Madrid and ended in Barcelona ten days later. The fashion that teenagers picked up from Madonna’s outfits was developed, manufactured, and available in stores in Barcelona by the time the tour ended. A remarkable ten days from design, development, manufacturing to store availability ([10],[74]).
Zara sources the fabric from all over the world (Italy, China, Japan, India). Zara owns its own cutting machines that cut the fabric in batches, using laser-cutting devices, and optimize layouts within each roll to minimize scrap. Independent sewing shops in Europe do all of the stitching. The apparel comes back to Zara, where it is ironed, packaged, and grouped by store. Zara contracts with independent trucking companies to distribute the products to stores that are solely owned by Zara.
Customers expect fresh assortments every time they visit the store and do not expect products to be in stock for a long time. By controlling most steps in the supply chain, Zara is able to respond faster to market trends. This also decreases the cost of errors in the fore-cast. But Zara may also have identified that having a fast supply chain enables it to charge a price premium for the market segment it targets. Is such a high degree of supply chain ownership necessary for Zara? How can competitors respond in the apparel market?
1.5.1 Zara’s Supply Chain architecture Zara has a vertically integrated supply chain with intense coordination between levels. Store managers pass along customer requests to designers, who then incorporate cus-tomer suggestions into new designs that are manufactured and delivered frequently to stores. This coordination enables faster cycle times, under two weeks from start to fin-ish. Capacity for cutting, packing, delivery, and so on are owned and deployed by Zara to maximize flexibility. The sewing capacity is subcontracted but managed by Zara. Is the Zara supply chain competitive? The company has a market value that is signifi-cantly larger than most firms in the apparel industry. Success has come from significant control of assets as well as an intense coordination of information flows throughout the supply chain.

7intrODuCtiOn
tO Supply ChainS1.6 GlOBal apparel Supply
Chain manaGement Li & Fung is a Hong Kong–based company that specializes in supply chain management ([82]). The origins of the firm can be traced to Victor Fung’s grandfather, who worked as a translator of business documents from Chinese to English. The firm had a fee of 15% of sales, which rapidly reduced to under 1% of sales and became nonexistent. The company then moved to serve as a broker or agent for manufacturers in Taiwan and China, thus providing regional sourcing capability. The next step was a move to assortment packing: an order for a product might involve making components in different places, creating a kit sent for assembly, and then packaging the finished product.
The company then moved to the management of outsourced production. Companies provided design details and Li & Fung managed the manufacturing and delivery. For example, companies like The Limited would approach Li & Fung and discuss design plans for the upcoming season. Li & Fung would provide a sourcing plan and develop a regional sourcing capability that covered manufacturing in China, Taiwan, and Hong Kong.
The next step involved managing dispersed manufacturing. For example, an order placed for apparel manufacturing may involve sourcing fabric in Taiwan, cutting in Hong Kong, stitching in Thailand, and sourcing zippers and buttons from Japan and fab-ric shell from Germany. This garment might have to match with other garments sourced in other parts of the world and be delivered on time to a specified location. All of these shipments would have to fall within the specified import quotas into the United States or Europe.
Li & Fung takes no business risk but has access to over 1 million employees. The employees work for their independent owners but reserve about 30% of the capacity for access by Li & Fung. Li & Fung knows their capabilities and allocates work after demand unfolds. The ability to adjust capacity use to demand realizations permits faster turnaround of orders within the quotas. Also, since Li & Fung approaches the particular supplier with the expertise independent of location, they effectively manage dispersed production.
Victor Fung refers to the firm’s capability as the “soft $3” of the supply chain. He explains that if a product that leaves a plant costing $1 ends up at retail for $4, the $3 repre-sents the cost of inventory, forecast error, exchange rates, retail markup, and other factors. There is a much better chance at reducing the $3 than the $1. Li & Fung focuses on “creat-ing a customized value chain for each order” ([82]). This represents a classic example of a pure supply chain company.
1.6.1 li & Fung’s Supply Chain architecture The Li & Fung supply chain consists of dispersed manufacturing capacity owned by inde-pendent apparel suppliers that provide flexible access to their capacity in return for lower selling costs. The customized supply chains created by Li & Fung for a manufacturer requires understanding the price vs. lead time trade-offs. Capacity is reserved by the sup-plier to accommodate demand as it unfolds. Trust between the supplier and Li & Fung and several years of continued growth enable this capacity to be reserved at no explicit cost. The ability to mediate between the information-technology-savvy Western retailers and the Eastern suppliers, operating at lower technology but at competitive price and quality lev-els, provides Li & Fung with its competitive advantage. Li & Fung enables supply chain efficiency, enabling improved forecasts, lower lead times, higher in-stock levels, and the ability to curtail orders for lower-demand volume products.

8 Chapter 1 1.7 unDerStanDinG Supply Chain
arChiteCture anD itS impaCt—a CaSe*
Industrial Chemicals faced a dilemma. The vice president of sales had a consultant’s report that showed a significant sales opportunity as the North American Free Trade Agreement (NAFTA) became a reality. While the forecasts were known in the past to be a poor pre-dictor of actual sales, sales had always managed to deliver long-term growth. Industrial needed to prepare for this expansion, and the lead time for plant and warehouse expansion was two years.
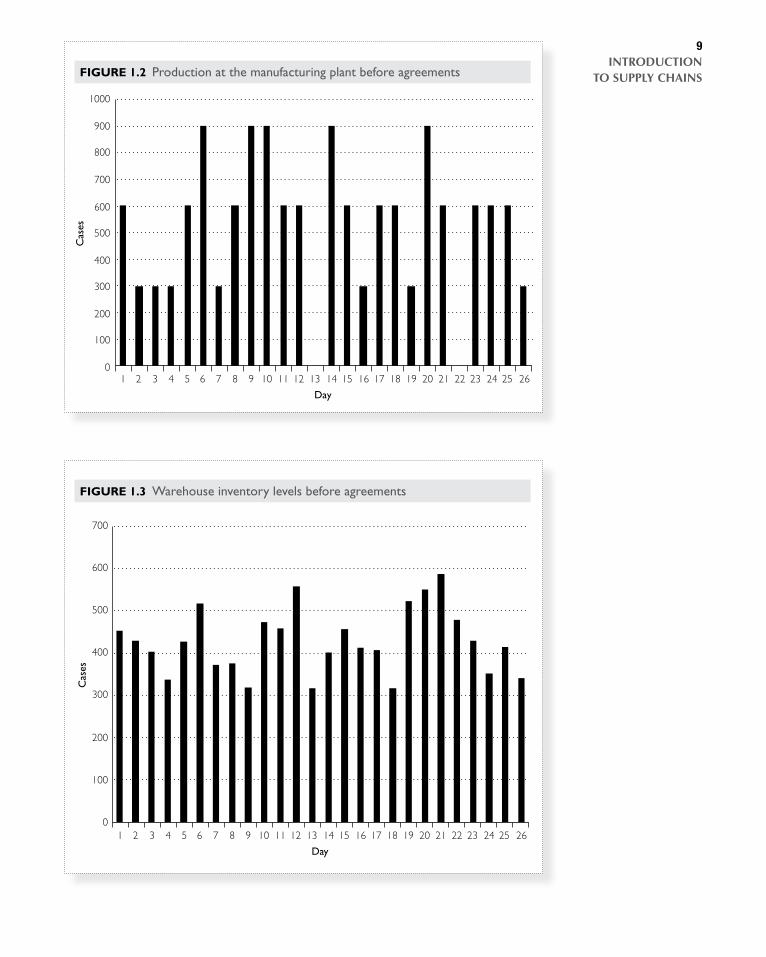
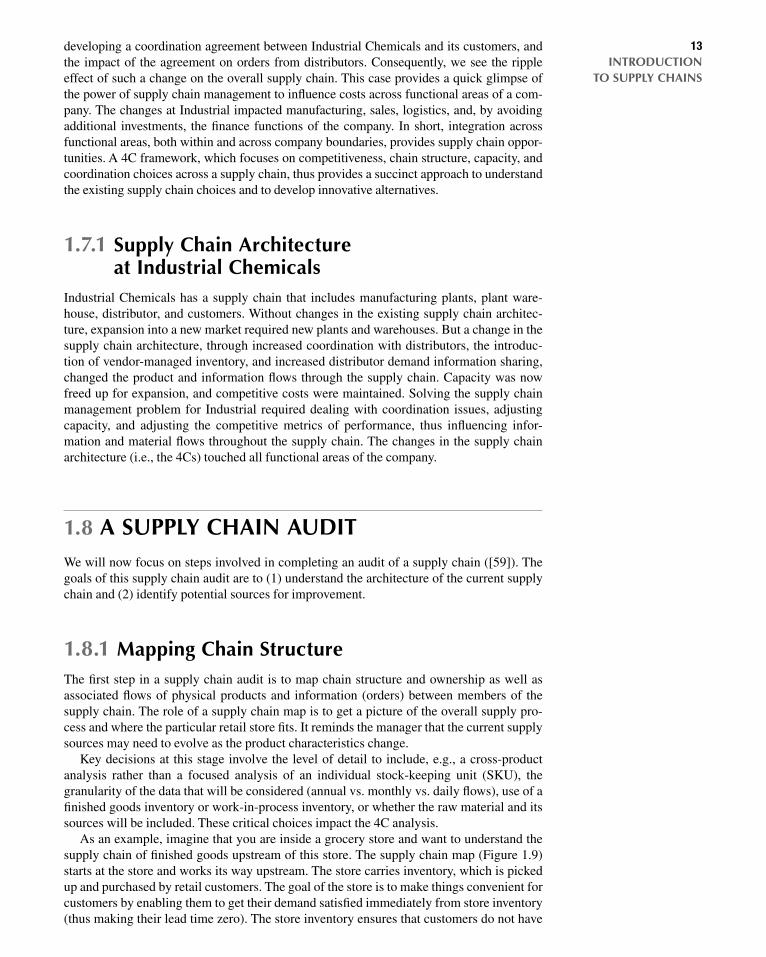
Industrial sold mainly through distributors, large and small. Orders from distributors gen-erated a volatile demand at Industrial’s warehouse (Figure 1.1). To optimize manufacturing, Industrial’s plants produced in large lots periodically (Figure 1.2). To ensure a high in-stock availability, Industrial’s warehouses carried a high level of inventory (Figure 1.3). All of this resulted in large levels of finished goods inventory at Industrial and thus demanded high levels of working capital. The demands for additional capacity would strain an already precarious business situation.
But before approving the expansion, Industrial’s management wanted a supply chain audit of the entire system. This meant an analysis of all physical and informational flows throughout the system. Industrial wanted a complete analysis of every step in the supply chain, inside and outside the company, to identify performance improvement opportuni-ties. This included new contracts, accounting allocations, and new responsibilities. Sug-gestions for improvement could cut across the supply chain and across functional areas.
A first step was to understand the link between orders received by Industrial and demand faced by Industrial’s customers. Ten key distributors comprised over 80% of Industrial’s sales. Separating the order streams indicated that these ten distributors gener-ated the bulk of the order volatility faced by Industrial. The remaining 20% of the demand volume observed by Industrial was a quite steady (Figure 1.4).
0
200
400
600
800
1000
1200
1 2 3 4 5 6 7 8 9 10 11 12 13 14
Day
15 16 17 18 19 20 21 22 23 24 25 26
Cas
es
Figure 1.1 Orders received by the warehouse before agreements
*This case is based on a description in Byrnes and Shapiro [13]. It is adapted here to fit the models and description of this text. Please refer to the article for a broader view to the organization.
9intrODuCtiOn
tO Supply ChainSC
ases
0
100
200
300
400
500
600
700
800
900
1000
1 2 3 4 5 6 7 8 9 10 11 12 13 14
Day
15 16 17 18 19 20 21 22 23 24 25 26
Figure 1.2 Production at the manufacturing plant before agreements
0
100
200
300
400
500
600
700
1 2 3 4 5 6 7 8 9 10 11 12 13 14
Day
15 16 17 18 19 20 21 22 23 24 25 26
Cas
es
Figure 1.3 Warehouse inventory levels before agreements

10 Chapter 1
If orders to Industrial were volatile, could the demand faced by these distributors in turn be the cause of volatility? Meetings with these distributors indicated that their sales to small retail stores generated a reasonably steady demand to these large distributors. But Industrial had to identify why the distributors were ordering in such large quantities when their demand was steady. The secret turned out to be the transport cost that distribu-tors were concerned with. Since Industrial offered large discounts for customer pickup, all distributors tried to create backhaul loads with their retail accounts and other product demands. In addition, sales offered discounts for large-volume purchases, which incented distributors to order large volumes to reduce their cost of goods sold and improve mar-gins. Finally, Industrial offered generous return terms so that leftover product could be returned. This decreased distributors’ need for careful planning. It was clear that choices made regarding the accounting and charging for customer services, sales incentives, and marketing programs all affected the demand volatility faced by Industrial.
How could Industrial get the same steady order that reflected the demand faced by distributors? Perhaps vendor-managed inventory (VMI) offered such a solution. The supply chain community had been reporting the benefits of such agreements for some time. Industrial decided to set up such agreements with the ten key accounts to stabilize demand through its supply chain. The process would essentially work by replenishing the volume that distributors shipped. But this also implied that there would be additional significant changes at Industrial’s end to stabilize the supply chain. Long-term price agreements, taking over transport responsibility and establishing a coordinated transport system and eliminating specific programs for large buys were all part of this scheme. Industrial’s management was committed to smoothing demand and implemented these programs. The results are shown in Figure 1.5 and Figure 1.6.
The result was a smooth order pattern Industrial that reflected the steady demand faced by the distributors (Figure 1.8). The stabilization of demand by the large distributors in turn
Cas
es
1 2 3 4 5 6 7 8 9 10 11 12 13 14
Day
15 16 17 18 19 20 21 22 23 24 25 260
100
200
300
400
500
600
700
800
900
1000
LargeSmall
Figure 1.4 Orders split into large and small distributors before agreements

11intrODuCtiOn
tO Supply ChainS
meant that Industrial’s total demand became smoother (Figure 1.5). As a result, the plant could reliably commit a portion of its capacity for steady production (Figure 1.6). As safety stock decreased, the warehouse inventory decreased by 70% (Figure 1.7). The result was that operating costs fell by 30%, and Industrial could reliably commit to supporting new sales zones with no need for new capital campaigns while maintaining its legendary service.
200
0
400
600
800
1000
1200
1 2 3 4 5 6 7 8 9 10 11 12 13 14Day
15 16 17 18 19 20 21 22 23 24 25 26
Cas
es
Figure 1.5 Warehouse orders after agreements
100
0
200
300
400
500
600
800
900
700
1000
1 2 3 4 5 6 7 8 9 10 11 12 13 14Day
15 16 17 18 19 20 21 22 23 24 25 26
Cas
es
Figure 1.6 Production batches after agreements

12 Chapter 1
This example illustrates the benefit of thinking outside the box as defined by Industrial Chemicals and examining the root causes for order variation, i.e., the supply chain structure. But it also means moving to a bigger box, i.e., including more entities in the supply chain. The new perspective considers the link between demand variation and truck capacity driven by existing coordination agreements (backhaul discounts). The case shows the benefit of
100
0
200
300
400
500
600
700
1 2 3 4 5 6 7 8 9 10 11 12 13 14Day
15 16 17 18 19 20 21 22 23 24 25 26
Cas
es
Figure 1.7 Warehouse inventory after agreements
Cas
es
1 2 3 4 5 6 7 8 9 10 11 12 13 14
Day
15 16 17 18 19 20 21 22 23 24 25 260
100
200
300
400
500
600
700
800
900
1000
LargeSmall
Figure 1.8 Split of orders after agreements
13intrODuCtiOn
tO Supply ChainS
developing a coordination agreement between Industrial Chemicals and its customers, and the impact of the agreement on orders from distributors. Consequently, we see the ripple effect of such a change on the overall supply chain. This case provides a quick glimpse of the power of supply chain management to influence costs across functional areas of a com-pany. The changes at Industrial impacted manufacturing, sales, logistics, and, by avoiding additional investments, the finance functions of the company. In short, integration across functional areas, both within and across company boundaries, provides supply chain oppor-tunities. A 4C framework, which focuses on competitiveness, chain structure, capacity, and coordination choices across a supply chain, thus provides a succinct approach to understand the existing supply chain choices and to develop innovative alternatives.
1.7.1 Supply Chain architecture at industrial Chemicals
Industrial Chemicals has a supply chain that includes manufacturing plants, plant ware-house, distributor, and customers. Without changes in the existing supply chain architec-ture, expansion into a new market required new plants and warehouses. But a change in the supply chain architecture, through increased coordination with distributors, the introduc-tion of vendor-managed inventory, and increased distributor demand information sharing, changed the product and information flows through the supply chain. Capacity was now freed up for expansion, and competitive costs were maintained. Solving the supply chain management problem for Industrial required dealing with coordination issues, adjusting capacity, and adjusting the competitive metrics of performance, thus influencing infor-mation and material flows throughout the supply chain. The changes in the supply chain architecture (i.e., the 4Cs) touched all functional areas of the company.
1.8 a Supply Chain auDit We will now focus on steps involved in completing an audit of a supply chain ([59]). The goals of this supply chain audit are to (1) understand the architecture of the current supply chain and (2) identify potential sources for improvement.
1.8.1 mapping Chain Structure The first step in a supply chain audit is to map chain structure and ownership as well as associated flows of physical products and information (orders) between members of the supply chain. The role of a supply chain map is to get a picture of the overall supply pro-cess and where the particular retail store fits. It reminds the manager that the current supply sources may need to evolve as the product characteristics change.
Key decisions at this stage involve the level of detail to include, e.g., a cross-product analysis rather than a focused analysis of an individual stock-keeping unit (SKU), the granularity of the data that will be considered (annual vs. monthly vs. daily flows), use of a finished goods inventory or work-in-process inventory, or whether the raw material and its sources will be included. These critical choices impact the 4C analysis.
As an example, imagine that you are inside a grocery store and want to understand the supply chain of finished goods upstream of this store. The supply chain map (Figure 1.9) starts at the store and works its way upstream. The store carries inventory, which is picked up and purchased by retail customers. The goal of the store is to make things convenient for customers by enabling them to get their demand satisfied immediately from store inventory (thus making their lead time zero). The store inventory ensures that customers do not have

14 Chapter 1
to worry about how the product got there, the associated 4Cs involved in making the prod-uct, moving it, and managing availability.
Upstream of the store, i.e., moving towards the manufacturer, there are numerous pos-sible supply sources. The store can get its product from the chain store warehouse, which may have regular deliveries to the store. But the store can also get deliveries from whole-salers who support a particular manufacturer and deliver in bulk. The store can also receive deliveries from specialized distributors who may focus on a niche market, e.g., organics or special ethnic foods. Each of these sources in turn gets product from the plant warehouses or other sources. The plant in turn gets supplies from suppliers.
How does a store manager benefit by knowing where he fits into the grocery supply chain? Clearly it makes sense that for large-volume products, the store might try to get direct delivery from the plant warehouse. This reduces the lead time and handling and transport costs and generates a more efficient supply. But for small-volume products, with varying demand, it may be best to consider using specialized distributors who can deliver the required small volumes. Some manufacturers may be willing to manage the store shelves directly, as in the case of Coke, Pepsi, and Frito Lay. At the same time, some customers may be willing to take larger case sizes, thus reducing costs related to break-ing bulk. Clearly, it might be to the store’s advantage to match the product supply to its demand characteristics.
1.8.2 Capacity audit The next step in a supply chain audit is to examine how capacity is deployed by understand-ing its product-based allocation, which is related to design choices across locations and product types and across locations. Thus, we will first consider how products can be sepa-rated based on their demand volumes and consequent impact on capacity requirements. The next step will be to consider if product design specifications can be standardized to improve supply chain performance. Finally, the impact of a consolidation warehouse on required capacity will be considered.
ManufacturerPlant 1
ManufacturerPlant 2
SpecializedDistributor
Direct-StoreDelivery
FieldWarehouse
Chain StoreWarehouse
GroceryStore
Customer
Figure 1.9 Flows in a grocery supply chain

15intrODuCtiOn
tO Supply ChainS
Capacity and Product Characteristics
Next, focus on products handled by the supply chain and verify if the supply process matches product characteristics. If all SKUs are sorted in order of decreasing sales (i.e., from the highest to lowest sales levels) and the cumulative sales are plotted vs. the corre-sponding ranking of products, the data usually generates a Pareto distribution. Products can thus be divided into three categories: A products that represent 20% of the products but 80% of the sales volume, B products that represent 30% of the products and 15% of the sales volume, C products that represent 50% of the products and 5% of the sales volume.
How can the capacity associated with supply of products be adjusted to demand charac-teristics? Suppose the A products have high mean demand and low demand standard devia-tion (thus a low demand forecast error) while C products have low mean demand and high standard deviation of demand (thus a high demand forecast error). Suppose there is a choice between supplier 1, who operates with a high capacity utilization and thus has a four-week lead time but a price per unit of $10, and supplier 2, who has a high buffer capacity, low capacity utilization, and a one-week lead time but a price of $11 per unit. Given the low demand standard deviation, it might be optimal to avail of the efficiency of capacity utiliza-tion and its consequent lower costs by using supplier 1 for A products. Given the high fore-cast error for C products, it might correspondingly be optimal to use supplier 2 if the higher price and faster delivery is a better cost option to carrying safety stock.
This example suggests that supply chain costs can be decreased by adjusting the supply process to match product characteristics. Thus, in this step of a supply chain audit, the question is Are the supply chain capacity and its deployment tailored to product characteristics? If not, how can supply chain costs be reduced by such adjustments?
Capacity and the Role of Standardization
In many supply chains, products with similar form and function may end up having differ-ent specifications (e.g., consider the number of different power cords for cell phones). Such SKU proliferation can generate significant supply chain costs because each of these prod-uct variants has to be ordered, inventoried, accounted for, transported, and replenished. One reason for such proliferation across product selling segments may be the different design and procurement teams for each division that manages that segment. Standardiza-tion of components or product is an approach to manage capacity requirements to satisfy demand.
This is particularly true for a category of goods termed maintenance, repair, and operat-ing (MRO) supplies. MRO refers to items that never end up in the product sold to the cus-tomer but that enable the manufacturing and distribution of the product. Examples include machine coolants, electrical fixtures, plumbing fixtures, paper, office supplies, supplies for environmental compliance of the plant and packaging material. In many cases, there is no engineering control of these product specifications, thus resulting in maverick buying or local decision making regarding specifications. The net result is a multitude of different specifications that can vary by location or even within a plant.
Standardization refers to identifying basic product specifications to gain the benefit of economies of scale as well as to increase supplier incentives for service. In many instances, standardizing parts permits vendors to reduce costs because it enables the vendor to use peddling routes (milk runs) to deliver products efficiently across locations. As a result, standardizing product specifications can reduce inventory by decreasing associated order-ing costs, safety stocks associated with product forecast errors, as well as supplier lead time associated with eliminating supplier setups, which all lead to decreased supply chain costs. So the question is Has the supply chain taken advantage of product design stan-dardization to decrease costs?

16 Chapter 1
Capacity and the Role of Consolidation
Consolidation in a supply chain refers to the accumulation of product in a central location in order to take advantage of economies of scale in manufacturing, warehousing, and trans-portation. The basic economic reason for consolidation is to increase utilization of fixed capacity and thus gain the associated cost reduction. When many products share capacity, there is the opportunity to decrease delivery sizes across products, thus also decreasing inventory costs. Consolidation of orders also permits shipments to be potentially cross-docked (moved directly from inbound to outbound trucks) through careful coordination, also decreasing costs.
To evaluate if consolidation warehouses reduce overall supply chain costs, one has to balance the coordination costs associated with managing the timing of availability of products with the gains from sharing transport and providing deliveries to individual demand points that reflect their demand mix over time. So the question is Has the supply chain taken advantage of product consolidation across locations to decrease supply chain costs?
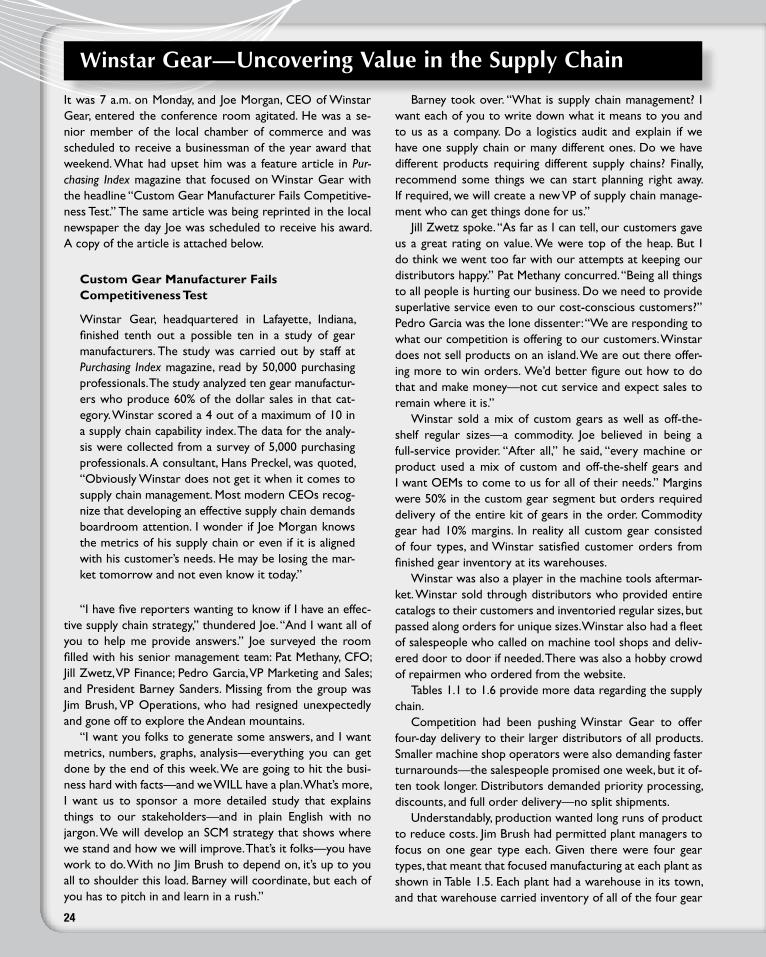
1.8.3 Coordination audit The next step is to consider a few standard opportunities to coordinate product flows and thus enable supply chain improvement. Assembly postponement is an approach to coor-dinate demand across products by creating a standardized design that is customized after demand for a specific product is realized. It permits better coordination of demand and supply by decreasing supply chain costs while enabling requisite variety. Geographic post-ponement is a similar strategy that stores product in a central location and moves it after demand is realized. Each of these strategies enables a closer link between demands real-ized and product creation or movement, thus leading to performance improvement.
Coordination Using Assembly Postponement
Assembly postponement refers to maintaining a product in a given state for as long as possible and customizing it after demand is realized. Thus, a set of products is replaced by a common platform product that is manufactured and customized only after demand is realized. Such an approach is also called design for logistics. This approach involves designing the product to reduce supply chain costs.
Consider the impact of redesign of the Hewlett-Packard (HP) Deskjet printer sold in Europe ([39],[79]). Before the project started, HP produced a separate model for each mar-ket in Europe and sent the manufactured product to its warehouse in Amsterdam for dis-tribution to the retail segment. The warehouse satisfied retail demand from finished goods inventory. But given that product was shipped from the US plant to Europe by sea, the long lead time, coupled with demand variability, implied that high levels of safety stock had to be held in the Amsterdam warehouse.
HP’s engineers developed a new printer design that permitted a generic printer to be made at the manufacturing plant. The generic printer was sent shrink wrapped in a pallet to the warehouse in Amsterdam where the customization and packaging would be done by loading the appropriate software and accessories. This design change resulted in lower transport costs, fresher and more recent packaging, lower inventories in Amsterdam, lower manufacturing costs at the plant, and higher in-stock levels. In addition, the lower inven-tory levels enabled faster introductions of new product and lower obsolescence costs. See Figure 1.10 for a representation of the concept.
But this change required that the designs maintain the product performance and reliabil-ity as well as result in reliable operation of the warehouse, whose new role included both light manufacturing as well as distribution.
There are many other examples of assembly postponement. The salad bar at a restau-rant is a classic example of making the customer assemble their desired salad on demand.

17intrODuCtiOn
tO Supply ChainS
Hardware stores claim to carry over 30,000 colors of paint. But in most cases they carry only a small number of primary colors and additives and create the color on demand with the aid of software. Such assembly postponement permits lowering of supply chain costs while maintaining customer choice.
Thus, an important question for an existing supply chain is Can assembly postpone-ment, through product design changes, enable supply chain improvement?
Coordination Using Geographic Postponement
Geographic postponement refers to delaying the movement of product to the demand loca-tion until after demand has occurred. If the customer lead time for delivery is short, this might require premium transportation. If not, the product may be moved to the customer demand point by normal transport modes.
A classic example is the supply chain for appliances sold by Sears in its retail stores ([116]). Customers went to a Sears retail store, selected an appliance, and then scheduled delivery using Sears delivery service. This meant that after purchase, lead time for deliv-ery to the customer was about one week. Sears supply chain managers realized that retail stores did not need to carry as much store inventory, given the customer delivery lead time. Orders could be placed to a central location after retail orders for appliances were received. The products could, in some cases, be manufactured after demands were realized. Appli-ances would then be transported to the region and coordinated with retail deliveries. Retail customers received deliveries without ever knowing where the inventory was located. Geo-graphic postponement thus enabled lower inventories, higher service level, and smoother new product introductions (and therefore easier handling of product recalls).
Such approaches to improving supply chain performance are common in the computer industry, where expensive parts required to fix computer systems are stored in a central location and shipped either overnight or on the next flight out to deal with mainframe fail-ures for critical applications. For example, Federal Express (FedEx) has a division called Critical Parts Supply that permits manufacturers to warehouse product in Memphis with immediate automatic shipment by FedEx on customer demand.
The supply chain audit question is Can geographic postponement be used in this supply chain to improve performance?
Coordination using Speculative Capacity
Speculation refers to decisions (regarding inventory or capacity) made in advance of demand realization. Price variation may suggest use of speculation as a strategy, with
Mac/colorWindows/B&WWindows/color
Mac/B&W
Mac/color
Windows/B&W
Windows/color
Mac/B&W
Mac/color
Windows/B&W
Windows/color
Mac/B&W
Plant Warehouse
Plant Warehouse
Figure 1.10 Assembly postponement of Deskjet printers

18 Chapter 1
purchases during low price points in anticipation of price increases. Long lead times for supply may suggest buffer safety stock and thus speculative inventory. Uncertain demands may require capacity buffers or speculative capacity. Product supply disruptions may imply stocks to be purchased whenever product is available. Seasonal demand or supply may demand that products are purchased and inventoried when “in season.” Inventories may also have to be held to smooth production.
Consumer examples of speculative inventory include decisions to stock up on grocery products during a sale. Similarly, Chapter 9 on grocery supply chains highlights optimal retail warehouse purchases during trade promotions, with large increases in inventory and thus addi-tional required warehouse capacity. Firms that build up inventory in anticipation of a strike or production disruptions during changeover use speculative capacity to buffer the impact.
Thus, the supply chain audit question is Can speculative capacity or inventory be used to improve supply chain performance?
1.8.4 Competitiveness metric of the Supply Chain What is the basis of competition for the supply chain? For purposes of illustration, we will use cost as a metric of performance, but many other possible choices (e.g., time, days of inventory) could also be the relevant metric. Consider the cost impact on the product as it moves through the supply chain. Examine how costs are added as each of the entities in the supply chain impact the product.
We provide an example for a medical supply manufacturer in Japan. This manufacturer first mapped the supply chain (Figure 1.11). The supply chain (on the left side of the fig-ure) showed that the manufacturer produced the product and sold it to distributors. The distributors carried products made by this supplier as well as products made by many other suppliers. By providing one-stop shopping for all products, the distributors made procure-ment easy for the health care providers. The health care providers sold products to health care professionals, who in turn used them to treat patients.
The medical supply manufacturer asked a consulting firm to identify the total costs as the product moved through the supply chain. The right side of Figure 1.11 shows the costs added due to warehousing, transportation, inventory, and administration as the product moves through the supply chain. The data showed that about 45% of the costs were added after the product left the manufacturer.
Health CareProfessional
Providers
Medical SupplyManufacturer
IndependentDistributors
Warehousing
Transportation
Inventory
Administration
$10.3
21.2
9.2
6.3
$47.0
$7.1
8.3
12.2
4.0
$31.6
+
–
9.3
+
$9.3
+
++
$17.4
29.5
30.7
10.3
$87.9
Manufacturer Distributors
Channel Costs (Millions)
Providers Total
Figure 1.11 Medical supply system before changes

19intrODuCtiOn
tO Supply ChainS
Health CareProfessional
Provider
Medical SupplyManufacturer
WholesalerDistributorWarehousing
Transportation
Inventory
Administration
$17.4
29.5
30.7
10.3
$87.9
$15.0
26.9
22.6
9.2
$73.7
$2.4
2.6
8.1
1.1
$14.2
Old System Integration
Channel Costs (Millions)
Revised Structure
Reduction
Figure 1.12 Medical supply system after changes
The question now is Which of the supply chain entities is affected by these added costs? For the manufacturer, these added costs meant lower margins as well as greater potential for competitors to enter the market. The end customers (patients) cared because the supply chain inefficiencies meant higher costs.
But what could be done to improve the supply chain? The manufacturer studied the source of the costs and decided that the problem was the one-size-fits-all approach implied by the original supply chain. Because all products followed the same path in going from the manufacturer to the customer, the associated supply was not matched to demand patterns.
An alternative approach (Figure 1.12) was to permit multiple approaches to get the product to downstream customers, relative to the nature of the demands. Thus, a wholesaler who ships large volumes of product to a large health care provider could get product directly without going through a distributor. In some cases the product could be shipped directly to the health care professional, thus eliminating some steps in the process.
The net effect of the changes in the supply chain was to provide a more finely tuned link between supply and demand by product type. The impact on the supply chain was pro-jected to be $14 million (out of $87.9 million spent). The impacts on individual steps in the supply chain are as shown in Figure 1.12. This example shows how supply chain structure and its adjustment can impact cost competitiveness.
1.8.5 impact of Competitors on the Supply Chain Consider how competitors impact a supply chain ([59]). Use the following questions to check performance relative to competitors.
1. How do our product attributes match customer requirements? How do our competitors’ product attributes match customer requirements?
The goal of this question is to understand whether there are differences in the extent to which our offerings and the offerings of the competition match the attributes demanded by our customers. The relevant attributes could include the extent of product customization to buyer requirements, the buyer-delivery flexibility vs. the delivery offered, and buyer preferences for the level of
20 Chapter 1
involvement in the supply chain vs. the level currently offered across the industry.
2. How do our competitors offer the service they do or how do the customers perceive they offer it?
The goal of this question is to compare customer perceptions of service offered by our competitors to the service we offer. Can differences in perceived service be traced to strategic choices in product attributes we make vs. those made by our competitors? As an example, if we offer customized products while our competitors offer off-the-shelf solutions, then we should expect customers to face higher lead times for our products vs. our competitors’ products. After analyzing the response to this question, one should decide whether to maintain or adjust product characteristics to match the competition.
3. Where in the product life cycle do our products sit, and how have we adjusted our supply chain strategy to match? Where are the competitors’ products located in their life cycle?
It is clear that the operation of a supply chain during product introduction and ramp-up is quite different from the operation during product phase-out. As the product reaches the end of its life cycle, it may be appropriate to reduce inventories throughout the chain at the expense of slightly higher lead times (through, for example, geographic postponement). At the same time, pricing of new and old products may have to be managed to permit new product demand to grow without being cannibalized by old products. All of this requires a planned supply chain strategy for product phase-in and phase-out. This step checks if these strategies are in place in the supply chain. By considering the life cycle position of our products and comparing it to our competitors’ products, we ensure that our supply chain is competitive through time.
4. How coordinated are the supply chain choices with the company strategy? How does this differ from our competitors? If our competitors have a coordinated supply chain and we do not, then the relative efficiency of competitors may require coordination of our supply chain. Note that the coordination of all competing supply chains does not guarantee improved profits, but only suggests a competitive necessity. The decision then is whether to continue to engage as needed or to change market focus.
21
1.9 Chapter Summary This chapter focused on examples of supply chains and their underlying supply chain architecture, using a 4C conceptual framework. The 4Cs refer to chain structure and own-ership, capacity, coordination, and competitiveness. The supply chain audit permits an understanding of current choices and an approach to evaluate alternate choices for supply chain architecture. The goal of this chapter was to explain the 4C choices made in different successful supply chain contexts.
1.10 prOBlemS 1. Precise is an automobile subassembly company located in Lafayette, IN. The company has requested a supply chain audit to enable it to identify ways to improve its performance, given the economic downturn. Data regarding the supply chain are provided below.
Precise imports ten components—five from suppliers in China and five from suppliers in Europe. An examination of these suppliers shows that all of them use a component supplied by a supplier located in Kokomo, IN. In turn, the supplier in Kokomo imports components from suppliers in India. The products made by Precise are shipped to automobile assembly plants located across the United States. Currently all products are made to assembly plant forecast, and Precise carries inventory to hedge against demand and delivery fluctuations. All deliveries are direct from supplier to Precise, i.e., point to point and full loads. Ship-ments are made using the cheapest mode of transport (i.e., by ship) and thus have a lead time of six weeks.
Precise competes to provide just-in-time (JIT) delivery to the assembly plant and is respon-sible to provide a 100% service level. Any delivery delays cause the assembly plant to shut down. To prevent this, Precise purchases delivery guarantee contracts from trucking com-panies that make deliveries within specific time windows.
Precise has been facing price and delivery competition from Prompt, a new vendor. Prompt delivers a less customized product to the assembly plant, a simpler design that can be sup-plied to a greater variety of assemblers. However, Prompt permits a smaller delivery time window and has located a warehouse near many of the assembly plants to provide faster turnaround at lower cost.
All deliveries to assembly plants are with wholesale price contracts. This has often resulted in Precise being forced to make decisions that are not optimal for the company in order to keep up with the competition.
Provide a supply chain audit of the system along with suggestions to improve performance.
2. Read the following and then answer the questions.
Under the just-in-time II (JIT II) system developed by Bose Corporation, the supplier pro-vides an in-plant person who resides in Bose’s facility. The in-plant representative coordi-nates the placement of orders from Bose with his company and does concurrent planning and adjusts order deliveries to serve Bose’s demands. In turn, Bose provides an evergreen contract that lasts for a period of time (e.g., four years), requires some price reductions, and permits the in-plant personnel to participate in product design, material selection, and access to all Bose personnel and meetings.
Bose has used JIT II for a number of products. Note that under JIT, suppliers still get fore-casts and have to use those forecasts to make decisions. However, forecasts are imprecise,

22
often off by 10% to 15%, which requires suppliers to scramble. JIT II takes the next step from JIT by permitting in-plant personnel and hence suppliers to have an idea of demand trends before the orders are placed.
An in-plant from a supplier of plastic components suggests that under JIT II he be allowed to see demand data and have the flexibility to adjust shipment timings and quantity so that the supplier production runs are efficient. He can also build up inventory in anticipation of other orders to his manufacturing system. This concurrent planning is a major source of benefits for this supplier.
An in-plant from a transportation provider claims that her terminals at Bose permit infor-mation to replace Bose inventory. Knowing when the deliveries are expected allows Bose to reliably use in-transit inventory to satisfy production demand so that the company can operate with low physical inventories. Also the transport company can possibly gain work from Bose’s suppliers and customers.
About 65% of Bose’s customers are located outside the United States. An in-plant import and export specialist at Bose has data regarding order shipments and deliveries. Quick and timely access to information enables him to manage the international shipping operations and plan and react to contingencies.
An in-plant from a printing company works with orders from Bose’s departments and coordinates the order placement, scheduling, and receipt between Bose departments to minimize overhead costs. Fixed prices reduce any need for Bose personnel.
Bose’s senior management believes that JIT II enables Bose to have control without invest-ing in vertically integrated assets.
2a. Provide a 4C Supply Chain Audit of this case.
2b. How does JIT II help the supplier? What tradeoffs does the supplier have to consider in choosing whether or not to be involved in JIT II with Bose?
2c. How does JIT II help Bose?
2d. Can the JIT II scheme be structured to benefit both Bose and the supplier? Explain.
2e. How is JIT II different from JIT?
2f. For what products would you expect JIT II to be suitable? For what products would it not be suitable? Explain.

23
Supply Chain management impact at Best Cookies
SCenariO 1Best Cookies is a manufacturer and distributor of cookies sold for fundraising purposes. Students go around to homes, selling these cookies. As these cookies are purchased, the students earn money from the sales for their organizations. Best Cookies gets orders from schools, churches, Little League clubs (similar to Girl Scout Cookies). These organiza-tions are Best’s customers. Best manufactures these cook-ies and creates a customized package with the name of the school or club and the specific fundraising activity. Orders are grouped together by customer, and Best ships one pack-age containing the customer order, to each customer. These products are sold on consignment. Thus leftover product can be returned to Best Cookies.
In reality Best stores some “bright” packs at regional distribution centers (DCs). Large shipments go from Best’s plants to the regional DCs and are shipped from there in small loads to individual customers. Last-minute orders are shipped from the DC, and small-volume labels are printed manually at the DC.
SCenariO 2Best has realized that demand for food purchased to support fundraising activity is declining. Best has thus created a new product, a catalog containing gift wrap, bows, and cookies
that will be carried to homes by students. Individuals place their orders, which are transmitted to Best. Best orders the wrapping paper and bows from an Asian supplier who has an eight-month lead time. Packages are not customized for each school. However, Best now creates a pack of orders for each student who generates the orders. The student opens the box, chooses what was ordered by a particular home, delivers the product, and picks up the money. Goods are no longer sold on consignment by Best; all orders are received by Best and consist of firm individual orders. Picked orders are shipped to schools. The individuals placing orders now wait two weeks to receive their order.
Case Questions
1. Provide an audit of the supply chain for scenario 1.
2. What should a supply chain manager “manage” in scenario 1 to generate a profitable system? What are the key bottlenecks in scenario 1?
3. Provide an audit of the supply chain for scenario 2.
4. What should a supply chain manager “manage” in scenario 2 to generate a profitable system? What are the key bottlenecks in scenario 2?
5. Should Best Cookies change the supply chain and move to the system in scenario 2? Explain your recommendation.
24
winstar Gear—uncovering Value in the Supply Chain
It was 7 a.m. on Monday, and Joe Morgan, CEO of Winstar Gear, entered the conference room agitated. He was a se-nior member of the local chamber of commerce and was scheduled to receive a businessman of the year award that weekend. What had upset him was a feature article in Pur-chasing Index magazine that focused on Winstar Gear with the headline “Custom Gear Manufacturer Fails Competitive-ness Test.” The same article was being reprinted in the local newspaper the day Joe was scheduled to receive his award. A copy of the article is attached below.
Custom gear Manufacturer Fails Competitiveness test
Winstar Gear, headquartered in Lafayette, Indiana, finished tenth out a possible ten in a study of gear manufacturers. The study was carried out by staff at Purchasing Index magazine, read by 50,000 purchasing professionals. The study analyzed ten gear manufactur-ers who produce 60% of the dollar sales in that cat-egory. Winstar scored a 4 out of a maximum of 10 in a supply chain capability index. The data for the analy-sis were collected from a survey of 5,000 purchasing professionals. A consultant, Hans Preckel, was quoted, “Obviously Winstar does not get it when it comes to supply chain management. Most modern CEOs recog-nize that developing an effective supply chain demands boardroom attention. I wonder if Joe Morgan knows the metrics of his supply chain or even if it is aligned with his customer’s needs. He may be losing the mar-ket tomorrow and not even know it today.”
“I have five reporters wanting to know if I have an effec-tive supply chain strategy,” thundered Joe. “And I want all of you to help me provide answers.” Joe surveyed the room filled with his senior management team: Pat Methany, CFO; Jill Zwetz, VP Finance; Pedro Garcia, VP Marketing and Sales; and President Barney Sanders. Missing from the group was Jim Brush, VP Operations, who had resigned unexpectedly and gone off to explore the Andean mountains.
“I want you folks to generate some answers, and I want metrics, numbers, graphs, analysis—everything you can get done by the end of this week. We are going to hit the busi-ness hard with facts—and we WILL have a plan. What’s more, I want us to sponsor a more detailed study that explains things to our stakeholders—and in plain English with no jargon. We will develop an SCM strategy that shows where we stand and how we will improve. That’s it folks—you have work to do. With no Jim Brush to depend on, it’s up to you all to shoulder this load. Barney will coordinate, but each of you has to pitch in and learn in a rush.”
Barney took over. “What is supply chain management? I want each of you to write down what it means to you and to us as a company. Do a logistics audit and explain if we have one supply chain or many different ones. Do we have different products requiring different supply chains? Finally, recommend some things we can start planning right away. If required, we will create a new VP of supply chain manage-ment who can get things done for us.”
Jill Zwetz spoke. “As far as I can tell, our customers gave us a great rating on value. We were top of the heap. But I do think we went too far with our attempts at keeping our distributors happy.” Pat Methany concurred. “Being all things to all people is hurting our business. Do we need to provide superlative service even to our cost-conscious customers?” Pedro Garcia was the lone dissenter: “We are responding to what our competition is offering to our customers. Winstar does not sell products on an island. We are out there offer-ing more to win orders. We’d better figure out how to do that and make money— not cut service and expect sales to remain where it is.”
Winstar sold a mix of custom gears as well as off-the-shelf regular sizes—a commodity. Joe believed in being a full-service provider. “After all,” he said, “every machine or product used a mix of custom and off-the-shelf gears and I want OEMs to come to us for all of their needs.” Margins were 50% in the custom gear segment but orders required delivery of the entire kit of gears in the order. Commodity gear had 10% margins. In reality all custom gear consisted of four types, and Winstar satisfied customer orders from finished gear inventory at its warehouses.
Winstar was also a player in the machine tools aftermar-ket. Winstar sold through distributors who provided entire catalogs to their customers and inventoried regular sizes, but passed along orders for unique sizes. Winstar also had a fleet of salespeople who called on machine tool shops and deliv-ered door to door if needed. There was also a hobby crowd of repairmen who ordered from the website.
Tables 1.1 to 1.6 provide more data regarding the supply chain.
Competition had been pushing Winstar Gear to offer four-day delivery to their larger distributors of all products. Smaller machine shop operators were also demanding faster turnarounds—the salespeople promised one week, but it of-ten took longer. Distributors demanded priority processing, discounts, and full order delivery—no split shipments.
Understandably, production wanted long runs of product to reduce costs. Jim Brush had permitted plant managers to focus on one gear type each. Given there were four gear types, that meant that focused manufacturing at each plant as shown in Table 1.5. Each plant had a warehouse in its town, and that warehouse carried inventory of all of the four gear

25
gear numberannual units
sold
A 296,400 These four are custom gear numbers.
B 312,000
C 468,000
D 338,000
141 185,714 These are commodity gear numbers.
151 185,714
161 185,714
171 185,714
181 185,714
191 185,714
OTHERS—Commodity 185,714
table 1.1 Annual product sales, in units
table 1.2 Weekly demand information
gear/regionWest east MidWest south
Mean std dev Mean std dev Mean std dev Mean std dev
A 2,000 1,000 700 400 1,000 500 2,000 100
B 3,000 1,000 1,000 250 1,000 500 1,000 250
C 1,000 300 4,000 1,000 2,000 500 2,000 1,000
D 500 200 3,000 200 2,000 500 1,000 100
Commodity 5,000 1,000 8,000 1,000 10,000 1,000 2,000 500
Component $ Cost
Steel 20
Labor 20
Machine additives 3
Packaging 2
table 1.3 Cost of components for custom gears
Holding cost 25% per year
Transport cost 5 Dollars per unit from warehouse to customer
2 Dollars per unit from plant to consolidation warehouse if full truckload
5,000 Truck capacity
table 1.4 Holding cost (includes storage and cost of capital) and transport cost

26
types. The warehouse manager placed orders in batches of 10,000 gears at the plant. The plant operated in a make-to-order manner and took five days from order placement to delivery at the warehouse. The average delivered cost of cus-tom gears was $50 per unit. Winstar used a carrying cost of 50% of the value of inventory.
But Jim Brush had negotiated delivery terms for com-modity gears: Winstar got delivery at the warehouse four days after order placement. The average delivered cost for commodity gears was $20 per unit. The supplier had offered a price of $10 per unit if orders were in batches of 10,000 units, but Jim Brush had brushed aside that option.
The warehouse took on average one day to pick and pack orders; because most orders were for a mix of com-modity and custom gears, that meant that orders were shipped four days after receipt. Shipments to the customer were on a less-than-truckload basis, and the trucking com-pany delivered the product to the customer within two days from pickup.
Customer (distributor) orders were all different: each distributor offered four different designs meant to appeal to different customer needs. While these differences were cosmetic, they resulted in significant set-up time differences.
These different gears were thus made at each of the differ-ent plants.
New designs in the market had appeared recently, termed vanilla gears which could be made upfront and finetuned us-ing inserts. Winstar had investigated these designs, and the available report claimed that with such a design change, each plant could produce all four gear types for its local region. The warehouse would then require an extra day of light manufacturing to assemble the required gear type.
Logistics had also studied combining all of the inventory into one location in Indianapolis, which had been gaining a reputation as a logistics center. The available report suggest-ed closing all four warehouses and opening one warehouse in Indianapolis to serve the entire country. Such a scheme would lower inventory costs but increase transportation lead time to ship to the customer from two days to three days. Commodity gear suppliers were willing to ship to the Indianapolis warehouse (in fact they preferred it due to the potential larger orders) within four days. However, de-livery to the customer would now take three days instead of two.
A transportation consultant had provided a report sug-gesting that Winstar shut its current warehouses and set
table 1.5 Locations and lead times
PlantsWarehouse locations
West Oakland
East Philadelphia
MidWest Chicago
South Atlanta
Lead Time
From Plant to Warehouse 5 days
From Supplier to Warehouse for commodity gear 4 days
Picking at Warehouse 1 day
Transport From Warehouse to Customer 2 days
table 1.6 Inventory at regional warehouses
West east MidWest south
A 9,592 6,837 7,296 5,459
B 9,592 6,148 7,296 6,148
C 6,378 9,592 7,296 9,592
D 5,918 5,918 7,296 5,459

27
winStar Gear’S Current StrateGy
Breakdown of Inventory by Warehouse
CustoM gear inventory
Warehouses
oakland Philadelphia lafayette atlanta
“a” gear 9,592 6,837 7,296 5,459
“b” gear 9,592 6,148 7,296 6,148
“C” gear 6,378 9,592 7,296 9,592
“d” gear 5,918 5,918 7,296 5,459
Total Custom Gear Inventory: 115817
Breakdown of Costs per Gear Type in USD ($)
gear typePlant
(Manufacturing)transport to Warehouse
Warehouse (inventory)
transport to Customer
total Cost
Custom gear 45 5 2.05 5 57.05
Commodity gear 20 0 0 5 25
up four new consolidation warehouses near customer locations. This would increase inventory a bit but lower transport costs because shipments to this warehouse would be in full truckloads. The lead time for delivery to the customer could be cut to one day, and the commodity suppliers would ship directly to these consolidation ware-houses. However, lead time for delivery from the plants to these warehouses would be six days instead of the previous five days.
A design consultant had suggested getting distributors to standardize their designs. His new design included the fea-tures of all four gears currently sold. This “supergear” could be made at each plant and shipped to the customer along with the commodity gears. The production cost for these supergears would be 20% higher.
A procurement department study suggested carrying in-ventory of commodity gears and buying in full truckloads. This would lower the average price for Winstar to $10 in-stead of $20 per unit as well as permit a lowering of cus-tomer lead time.
One report had even studied the unthinkable—violating Joe Morgan’s dictum that all gears in an order should be de-livered to the customer as one package. Suppose the com-modity suppliers could ship commodity gears direct to the customer and Winstar could ship the more detailed gears
it manufactured. That would permit a four-day lead time for customer orders.
Barney had commissioned a study of Winstar’s competi-tors, and a thorough report was presented to the group. The report provided data regarding products offered by com-petitors that overlapped Winstar’s offerings. Atlas Gear, for example, focused only on the custom gear market and of-fered incredible delivery terms and flexibility but at a 20% higher price point. Atlas could turn orders around within 48 hours. Nexus Gear focused on commodity purchases and could beat Winstar’s prices by 25% but offered two-week delivery. Wintel Gear offered kits of gears based on standard configurations. These kits offered quick delivery of standard sets of requirements that covered about 50% of the orders with multiple lines. Customers would now require about two days to assemble the required gear at their facility, but Wintel could deliver within five days.
Barney concluded the meeting by saying, “The bottom line—I want each of you to generate a one page executive summary that provides a logistics audit of our supply chain. We need ideas for improvement that can be implemented right away. We need analysis, numbers, anything we can gen-erate by the end of this week. I have included a bunch of readings, data, etc., in the folder in front of you. See you Thursday afternoon at 3 p.m.”
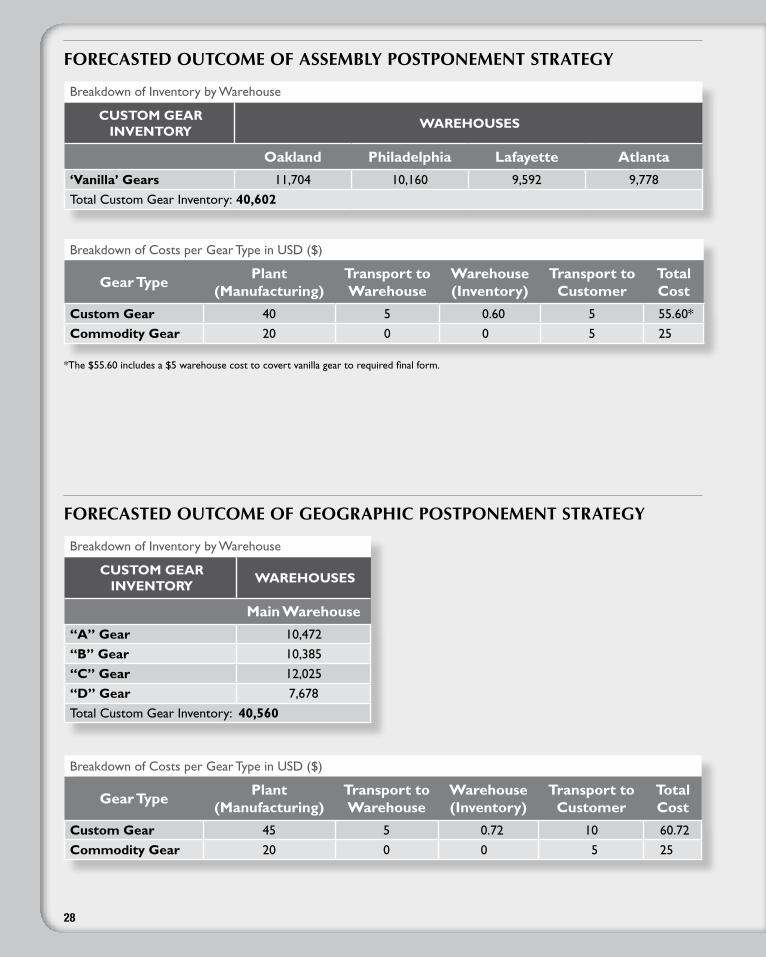
28
FOreCaSteD OutCOme OF aSSemBly pOStpOnement StrateGy
Breakdown of Inventory by Warehouse
CustoM gear inventory
Warehouses
oakland Philadelphia lafayette atlanta
‘vanilla’ gears 11,704 10,160 9,592 9,778
Total Custom Gear Inventory: 40,602
Breakdown of Costs per Gear Type in USD ($)
gear typePlant
(Manufacturing)transport to Warehouse
Warehouse (inventory)
transport to Customer
total Cost
Custom gear 40 5 0.60 5 55.60*
Commodity gear 20 0 0 5 25
*The $55.60 includes a $5 warehouse cost to covert vanilla gear to required final form.
FOreCaSteD OutCOme OF GeOGraphiC pOStpOnement StrateGy
Breakdown of Inventory by Warehouse
CustoM gear inventory
Warehouses
Main Warehouse
“a” gear 10,472
“b” gear 10,385
“C” gear 12,025
“d” gear 7,678
Total Custom Gear Inventory: 40,560
Breakdown of Costs per Gear Type in USD ($)
gear typePlant
(Manufacturing)transport to Warehouse
Warehouse (inventory)
transport to Customer
total Cost
Custom gear 45 5 0.72 10 60.72
Commodity gear 20 0 0 5 25

29
FOreCaSteD OutCOme OF Split ShipmentS StrateGy
Breakdown of Inventory by Warehouse
CustoM gear inventory
Warehouses
oakland Philadelphia lafayette atlanta
“a” gear 9,592 6,837 7,296 5,459
“b” gear 9,592 6,148 7,296 6,148
“C” gear 6,378 9,592 7,296 9,592
“d” gear 5,918 5,918 7,296 5,459
Total Custom Gear Inventory: 115,817
Breakdown of Costs per Gear Type in USD ($)
gear typePlant
(Manufacturing)transport to Warehouse
Warehouse (inventory)
transport to Customer
total Cost
Custom gear 45 5 2.05 5 57.05
Commodity gear 20 0 0 0 20
FOreCaSteD OutCOme OF COnSOliDatiOn StrateGy
Breakdown of Inventory by Warehouse
CustoM gear inventory
Warehouses
oakland Philadelphia lafayette atlanta
“a” gear 10,030 7,012 7,515 5,503
“b” gear 10,030 6,528 7,515 6,285
“C” gear 6,509 10,030 7,515 10,030
“d” gear 6,006 6,006 7,515 5,503
Total Custom Gear Inventory: 115,817
Breakdown of Costs per Gear Type in USD ($)
gear typePlant
(Manufacturing)transport to Warehouse
Warehouse (inventory)
transport to Customer
total Cost
Custom gear 45 7 2.10 5 59.10
Commodity gear 20 0 0 5 25

30
FOreCaSteD OutCOme FOr StanDarDiZatiOn StrateGy
Breakdown of Inventory by Warehouse
CustoM gear inventory
Warehouses
oakland Philadelphia lafayette atlanta
‘standard’ gears 12,342 10,653 10,031 10,234
Total Custom Gear Inventory: 43,260
Breakdown of Costs per Gear Type in USD ($)
gear typePlant
(Manufacturing)transport to Warehouse
Warehouse (inventory)
transport to Customer
total Cost
Custom gear 54 5 0.92 5 64.92
Commodity gear 20 0 0 5 25
FOreCaSteD OutCOme OF SpeCulatiOn StrateGy
Breakdown of Inventory by Warehouse
CustoM gear inventory
Warehouses
oakland Philadelphia lafayette atlanta
“a” gear 9,592 6,837 7,296 5,459
“b” gear 9,592 6,148 7,296 6,148
“C” gear 6,378 9,592 7,296 9,592
“d” gear 5,918 5,918 7,296 5,459
Commodity gear 9,108 9,108 9,108 7,054
Total Custom Gear Inventory: 150,195
Breakdown of Costs per Gear Type in USD ($)
gear typePlant
(Manufacturing)transport to Warehouse
Warehouse (inventory)
transport to Customer
total Cost
Custom gear 45 5 2.05 5 57.05
Commodity gear 10 0 0.26 5 15.26

31
Case Questions
1. Map the current supply chain at Winstar Gear.
2. What “problem” does Winstar Gear face? How is the supply chain impacted by the current situation at Winstar?
3. Do a Pareto analysis by product to explore the relative impact of SKUs.
4. Summarize the cost and lead time associated with each of the possible strategies (i.e., postponement (assembly and geographic), split shipments, standardization, speculation, and consolidation).
5. How do competitor choices differ from Winstar’s choice of Supply Chain Structure? What aspects of these choices influence Winstar’s supply chain decisions?
6. What recommendation would you offer to Winstar?
