introduction to the digital storage oscilloscope (dso) · 2016-05-27 · dick krieger – june 2016...
TRANSCRIPT

DICK KRIEGER – JUNE [email protected]
A ConsuLab presentation
INTRODUCTIONTO THE
DIGITAL STORAGE OSCILLOSCOPE(DSO)
4210 rue Jean-Marchand, Quebec, QC G2C 1Y6, Canada Phone: 418 688 9067 / 800 567 0791 / 810 222 4525 (USA)
Fax: 418 843 3444 / Email: [email protected]

consulab.com
I N T R O D U C T I O N T O T H E D S O
2consulab.com 2
1
INTRODUCTIONTOTHEDIGITALOSCILLOSCOPE(DSO)CONSULABPRESENTATION–JUNE2016
CLASSHANDOUT
CATEGORIESOFINFORMATION:
Theautomotiverepairindustryseemslikeisalwaysinastateofevolutionarychange.Changesinvehicletechnology,changesindiagnosticroutines,changesintechniciantrainingrequirementsandalsochangesindiagnosticequipmentrequirements.Automotiveinstructorsandtechniciansareoftenoverwhelmedwiththeamountofinformationthatcomesacrosstheirawareness.Sortingitalloutcanbesomewhatoverwhelming.Tohelpwiththisissue,itoftenhasbeensaidthatalloftheinformationavailableintheautomotiveserviceindustrycouldbedividedintocategoriesof:1-Needtoknowthis,2-Nicetoknowthisand3-Notreallynecessarytoknowthis.Ithasalsobeenstatedthattheamountofmaterialinthe“needtoknow”categoryrepresentsabout25%ofthetotalavailablecontent.Whetheryouagreewiththepercentagebreakdownornot,theknowledgeofhowtosetup,useandinterpretscopewaveformsisnowinthecategoryof“needtoknow”.
Advancesinelectricalandelectronicvehicletechnologyoccurringoverrecentyearshaveincertaincasesmadetheuseofoscilloscopesintroubleshootinganddiagnosisalmostmandatory.AttemptingtodiagnosesomevehiclesystemswithoutaDSOcanoftenresultinguessworkandtheresultinginstallationofunnecessaryrepairparts.
BRIEFHISTORYOFELECTRICALDIAGNOSIS:
Formanyyears,(beginninginthe40’s),theuseofa12Vtestlightwasthestandarddiagnostictoolcommonlyusedthroughouttheautomotiveserviceindustry.Diagnosisconsistedofprimarilyaskingthequestion:“Istherevoltagehereornot?”Then,werealizedthattestlightscouldalsotestforgroundsandeven“voltagedrops”ifwecouldvisualizehowdimthelightwas.Mostearlytestlightsweresimple12Vincandescentlightbulbsthatconsumedrelativelargeamountsofcurrentwhenconsideredwithsensitiveelectroniccircuits.Welearnedtheterm“impedance”andrealizedthatweneededhighimpedancetestlightstopreventcircuitdamagetosensitiveelectroniccomponentsastechnologystartingusingcomputersandothersolidstatedevices.Eventoday,itispossibletostillfind“lowimpedance”testlightsalthoughtheyshouldbeavoidedforuseonanyrelativelymodernvehicle.
1
INTRODUCTION TO THE DIGITAL OSCILLOSCOPE (DSO) CONSULAB PRESENTATION – JUNE 2016
CLASS HANDOUT
CATEGORIES OF INFORMATION:
The automotive repair industry seems like is always in a state of evolutionary change. Changes in vehicle technology, changes in diagnostic routines, changes in technician training requirements and also changes in diagnostic equipment requirements. Automotive instructors and technicians are often overwhelmed with the amount of information that comes across their awareness. Sorting it all out can be somewhat overwhelming. To help with this issue, it often has been said that all of the information available in the automotive service industry could be divided into categories of: 1- Need to know this, 2- Nice to know this and 3- Not really necessary to know this. It has also been stated that the amount of material in the “need to know” category represents about 25% of the total available content. Whether you agree with the percentage break down or not, the knowledge of how to setup, use and interpret scope waveforms is now in the category of “need to know”.
Advances in electrical and electronic vehicle technology occurring over recent years have in certain cases made the use of oscilloscopes in troubleshooting and diagnosis almost mandatory. Attempting to diagnose some vehicle systems without a DSO can often result in guesswork and the resulting installation of unnecessary repair parts.
BRIEF HISTORY OF ELECTRICAL DIAGNOSIS:
For many years, (beginning in the 40’s), the use of a 12V test light was the standard diagnostic tool commonly used throughout the automotive service industry. Diagnosis consisted of primarily asking the question: “Is there voltage here or not?” Then, we realized that test lights could also test for grounds and even “voltage drops” if we could visualize how dim the light was. Most early test lights were simple 12V incandescent light bulbs that consumed relative large amounts of current when considered with sensitive electronic circuits. We learned the term “impedance” and realized that we needed high impedance test lights to prevent circuit damage to sensitive electronic components as technology starting using computers and other solid state devices. Even today, it is possible to still find “low impedance” test lights although they should be avoided for use on any relatively modern vehicle.
TOTAL AUTOMOTIVE INFORMATION SUMMARY
25% IS STUFF YOU NEED TO KNOW
1
INTRODUCTIONTOTHEDIGITALOSCILLOSCOPE(DSO)CONSULABPRESENTATION–JUNE2016
CLASSHANDOUT
CATEGORIESOFINFORMATION:
Theautomotiverepairindustryseemslikeisalwaysinastateofevolutionarychange.Changesinvehicletechnology,changesindiagnosticroutines,changesintechniciantrainingrequirementsandalsochangesindiagnosticequipmentrequirements.Automotiveinstructorsandtechniciansareoftenoverwhelmedwiththeamountofinformationthatcomesacrosstheirawareness.Sortingitalloutcanbesomewhatoverwhelming.Tohelpwiththisissue,itoftenhasbeensaidthatalloftheinformationavailableintheautomotiveserviceindustrycouldbedividedintocategoriesof:1-Needtoknowthis,2-Nicetoknowthisand3-Notreallynecessarytoknowthis.Ithasalsobeenstatedthattheamountofmaterialinthe“needtoknow”categoryrepresentsabout25%ofthetotalavailablecontent.Whetheryouagreewiththepercentagebreakdownornot,theknowledgeofhowtosetup,useandinterpretscopewaveformsisnowinthecategoryof“needtoknow”.
Advancesinelectricalandelectronicvehicletechnologyoccurringoverrecentyearshaveincertaincasesmadetheuseofoscilloscopesintroubleshootinganddiagnosisalmostmandatory.AttemptingtodiagnosesomevehiclesystemswithoutaDSOcanoftenresultinguessworkandtheresultinginstallationofunnecessaryrepairparts.
BRIEFHISTORYOFELECTRICALDIAGNOSIS:
Formanyyears,(beginninginthe40’s),theuseofa12Vtestlightwasthestandarddiagnostictoolcommonlyusedthroughouttheautomotiveserviceindustry.Diagnosisconsistedofprimarilyaskingthequestion:“Istherevoltagehereornot?”Then,werealizedthattestlightscouldalsotestforgroundsandeven“voltagedrops”ifwecouldvisualizehowdimthelightwas.Mostearlytestlightsweresimple12Vincandescentlightbulbsthatconsumedrelativelargeamountsofcurrentwhenconsideredwithsensitiveelectroniccircuits.Welearnedtheterm“impedance”andrealizedthatweneededhighimpedancetestlightstopreventcircuitdamagetosensitiveelectroniccomponentsastechnologystartingusingcomputersandothersolidstatedevices.Eventoday,itispossibletostillfind“lowimpedance”testlightsalthoughtheyshouldbeavoidedforuseonanyrelativelymodernvehicle.
1
INTRODUCTIONTOTHEDIGITALOSCILLOSCOPE(DSO)CONSULABPRESENTATION–JUNE2016
CLASSHANDOUT
CATEGORIESOFINFORMATION:
Theautomotiverepairindustryseemslikeisalwaysinastateofevolutionarychange.Changesinvehicletechnology,changesindiagnosticroutines,changesintechniciantrainingrequirementsandalsochangesindiagnosticequipmentrequirements.Automotiveinstructorsandtechniciansareoftenoverwhelmedwiththeamountofinformationthatcomesacrosstheirawareness.Sortingitalloutcanbesomewhatoverwhelming.Tohelpwiththisissue,itoftenhasbeensaidthatalloftheinformationavailableintheautomotiveserviceindustrycouldbedividedintocategoriesof:1-Needtoknowthis,2-Nicetoknowthisand3-Notreallynecessarytoknowthis.Ithasalsobeenstatedthattheamountofmaterialinthe“needtoknow”categoryrepresentsabout25%ofthetotalavailablecontent.Whetheryouagreewiththepercentagebreakdownornot,theknowledgeofhowtosetup,useandinterpretscopewaveformsisnowinthecategoryof“needtoknow”.
Advancesinelectricalandelectronicvehicletechnologyoccurringoverrecentyearshaveincertaincasesmadetheuseofoscilloscopesintroubleshootinganddiagnosisalmostmandatory.AttemptingtodiagnosesomevehiclesystemswithoutaDSOcanoftenresultinguessworkandtheresultinginstallationofunnecessaryrepairparts.
BRIEFHISTORYOFELECTRICALDIAGNOSIS:
Formanyyears,(beginninginthe40’s),theuseofa12Vtestlightwasthestandarddiagnostictoolcommonlyusedthroughouttheautomotiveserviceindustry.Diagnosisconsistedofprimarilyaskingthequestion:“Istherevoltagehereornot?”Then,werealizedthattestlightscouldalsotestforgroundsandeven“voltagedrops”ifwecouldvisualizehowdimthelightwas.Mostearlytestlightsweresimple12Vincandescentlightbulbsthatconsumedrelativelargeamountsofcurrentwhenconsideredwithsensitiveelectroniccircuits.Welearnedtheterm“impedance”andrealizedthatweneededhighimpedancetestlightstopreventcircuitdamagetosensitiveelectroniccomponentsastechnologystartingusingcomputersandothersolidstatedevices.Eventoday,itispossibletostillfind“lowimpedance”testlightsalthoughtheyshouldbeavoidedforuseonanyrelativelymodernvehicle.
CATEGORIES OF INFORMATION:
The automotive repair industry seems like is always in a state of evolutionary change. Changes in vehicle tech-nology, changes in diagnostic routines, changes in technician training requirements and also changes in diagnostic equipment requirements. Automotive instructors and technicians are often overwhelmed with the amount of information that comes across their awareness. Sorting it all out can be somewhat overwhelming. To help with this issue, it often has been said that all of the information available in the automotive service industry could be divided into categories of: 1- Need to know this, 2- Nice to know this and 3- Not really necessary to know this. It has also been stated that the amount of material in the “need to know” category represents about 25% of the total available content. Whether you agree with the percentage break down or not, the knowledge of how to setup, use and interpret scope waveforms is now in the category of “need to know”.
Advances in electrical and electronic vehicle technology occurring over recent years have in certain cases made the use of oscilloscopes in troubleshooting and diagnosis almost mandatory. Attempting to diagnose some vehicle systems without a DSO can often result in guesswork and the resulting installation of unnecessary repair parts.
BRIEF HISTORY OF ELECTRICAL DIAGNOSIS:
For many years, (beginning in the 40’s), the use of a 12V test light was the standard diagnostic tool com-monly used throughout the automotive service industry. Diagnosis consisted of primarily asking the question: “Is there voltage here or not?” Then, we realized that test lights could also test for grounds and even “volt-age drops” if we could visualize how dim the light was. Most early test lights were simple 12V incandescent light bulbs that consumed relative large amounts of current when considered with sensitive electronic circuits. We learned the term “impedance” and realized that we needed high impedance test lights to prevent cir-cuit damage to sensitive electronic components as technology starting using computers and other solid state devices. Even today, it is possible to still find “low impedance” test lights although they should be avoided for use on any relatively modern vehicle.
consulab.com
I N T R O D U C T I O N T O T H E D S O
3
2
Then,astheybecamemorecommonlyavailable,theanalogandthenthedigitalmulti-metersbecamemorecommon.Theyhavebeenthediagnostictoolstandardformany,manyyears.
ANALOGMETER DIGITALMETER
IMPEDANCE(CIRCUIT&TESTEQUIPMENT)Theterm“impedance”isimportanttoknowwhenusinganaloganddigitalmulti-meters.Foruseontoday’scars,mostdigitalmetershaveaminimumof20MegOhmImpedance.
ELECTRICALIMPEDANCE oftestequipment • Impedanceisfundamentallyresistance• Highimpedancereferstoahighresistancewhich“Loads”acircuitlesswhentesting.IfIhookupahigh
impedancetestlightormeteritwillloadthecircuitless(ifatall)andwillnotaffectthemeasurementmuch.• Lowimpedanceindicatesalowresistancewhich“Loads”acircuitmorewhentestingandwillaffect(change)
themeasurement.(Insomecases,usinglowimpedancetestequipmentcanresultincircuitdamage)• OxygenSensor–Testwithhighimpedancemeter• Injectorpowersource–Highorlowimpedancemeter
CIRCUITIMPEDANCE:
Circuitimpedanceisbasicallydescribingthe“resistance”oftheentirecircuit.Circuitswithhighresistancesinthemarecalled“highimpedance”circuitsandcircuitswithoutmuchresistance,arecalled“lowimpedance”circuits.Ifalowimpedancetesterisconnectedtoahighimpedancecircuit,thetestercanprovideatemporarypathtogroundandcauseexcessivecurrentflowinthecircuitwhichmaycausedamageorskewmeasurementreadings.Connectingahighimpedancetestertoeithercircuittypesusuallydoesn’tpresentanyperformanceorcircuitdamageproblems.
2
Then, as they became more commonly available, the analog and then the digital multi-meters became more common. They have been the diagnostic tool standard for many, many years.
ANALOG METER DIGITAL METER
IMPEDANCE (CIRCUIT & TEST EQUIPMENT) The term “impedance” is important to know when using analog and digital multi-meters. For use on today’s cars, most digital meters have a minimum of 20 MegOhm Impedance.
ELECTRICAL IMPEDANCE of test equipment• Impedance is fundamentally resistance High impedance refers to a high resistance which “Loads” a circuit less when testing. If I hook up a high
impedance test light or meter it will load the circuit less (if at all) and will not affect the measurement much. Low impedance indicates a low resistance which “Loads” a circuit more when testing and will affect (change)
the measurement. (In some cases, using low impedance test equipment can result in circuit damage) Oxygen Sensor – Test with high impedance meter Injector power source – High or low impedance meter
CIRCUIT IMPEDANCE:
Circuit impedance is basically describing the “resistance” of the entire circuit. Circuits with high resistances in them are called “high impedance” circuits and circuits without much resistance, are called “low impedance” circuits. If a low impedance tester is connected to a high impedance circuit, the tester can provide a temporary path to ground and cause excessive current flow in the circuit which may cause damage or skew measurement readings. Connecting a high impedance tester to either circuit types usually doesn’t present any performance or circuit damage problems.
CURRENT LIMITING
12v
5.00 v
DMM: High impedance meter = no loading
TESTER IMPEDANCE: 3-wire Throttle Position Sensor
12v
1.90 v
TESTER IMPEDANCE: 3-wire Throttle Position Sensor
Test Light: Low impedance = loading
TESTER IMPEDANCE: 3-wire Throttle Position Sensor
12v
3.20 v
DMM: High impedance meter = no loading
12v
0.02 v
TESTER IMPEDANCE: 3-wire Throttle Position Sensor
Test Light: Low impedance = loading
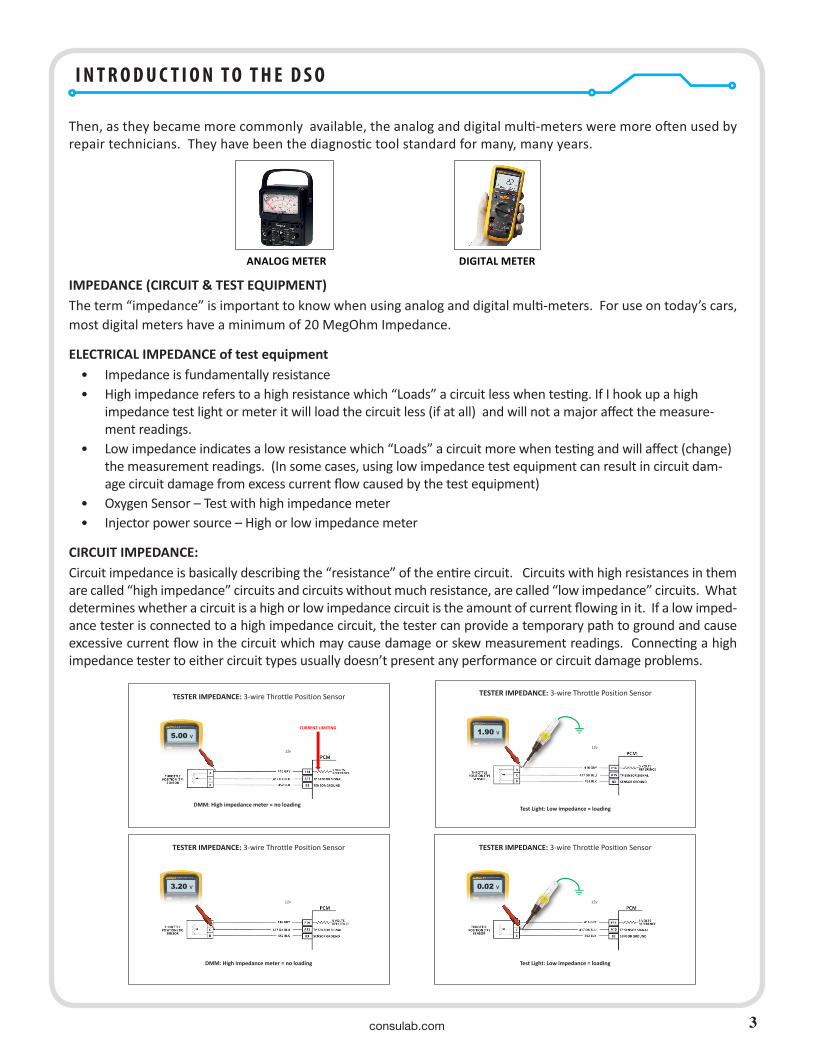
Then, as they became more commonly available, the analog and digital multi-meters were more often used by repair technicians. They have been the diagnostic tool standard for many, many years.
IMPEDANCE (CIRCUIT & TEST EQUIPMENT) The term “impedance” is important to know when using analog and digital multi-meters. For use on today’s cars, most digital meters have a minimum of 20 MegOhm Impedance.
ELECTRICAL IMPEDANCE of test equipment• Impedance is fundamentally resistance• High impedance refers to a high resistance which “Loads” a circuit less when testing. If I hook up a high
impedance test light or meter it will load the circuit less (if at all) and will not a major affect the measure-ment readings.
• Low impedance indicates a low resistance which “Loads” a circuit more when testing and will affect (change) the measurement readings. (In some cases, using low impedance test equipment can result in circuit dam-age circuit damage from excess current flow caused by the test equipment)
• Oxygen Sensor – Test with high impedance meter• Injector power source – High or low impedance meter
CIRCUIT IMPEDANCE: Circuit impedance is basically describing the “resistance” of the entire circuit. Circuits with high resistances in them are called “high impedance” circuits and circuits without much resistance, are called “low impedance” circuits. What determines whether a circuit is a high or low impedance circuit is the amount of current flowing in it. If a low imped-ance tester is connected to a high impedance circuit, the tester can provide a temporary path to ground and cause excessive current flow in the circuit which may cause damage or skew measurement readings. Connecting a high impedance tester to either circuit types usually doesn’t present any performance or circuit damage problems.
2
Then, as they became more commonly available, the analog and then the digital multi-meters became more common. They have been the diagnostic tool standard for many, many years.
ANALOG METER DIGITAL METER
IMPEDANCE (CIRCUIT & TEST EQUIPMENT) The term “impedance” is important to know when using analog and digital multi-meters. For use on today’s cars, most digital meters have a minimum of 20 MegOhm Impedance.
ELECTRICAL IMPEDANCE of test equipment• Impedance is fundamentally resistance High impedance refers to a high resistance which “Loads” a circuit less when testing. If I hook up a high
impedance test light or meter it will load the circuit less (if at all) and will not affect the measurement much. Low impedance indicates a low resistance which “Loads” a circuit more when testing and will affect (change)
the measurement. (In some cases, using low impedance test equipment can result in circuit damage) Oxygen Sensor – Test with high impedance meter Injector power source – High or low impedance meter
CIRCUIT IMPEDANCE:
Circuit impedance is basically describing the “resistance” of the entire circuit. Circuits with high resistances in them are called “high impedance” circuits and circuits without much resistance, are called “low impedance” circuits. If a low impedance tester is connected to a high impedance circuit, the tester can provide a temporary path to ground and cause excessive current flow in the circuit which may cause damage or skew measurement readings. Connecting a high impedance tester to either circuit types usually doesn’t present any performance or circuit damage problems.
CURRENT LIMITING
12v
5.00 v
DMM: High impedance meter = no loading
TESTER IMPEDANCE: 3-wire Throttle Position Sensor
12v
1.90 v
TESTER IMPEDANCE: 3-wire Throttle Position Sensor
Test Light: Low impedance = loading
TESTER IMPEDANCE: 3-wire Throttle Position Sensor
12v
3.20 v
DMM: High impedance meter = no loading
12v
0.02 v
TESTER IMPEDANCE: 3-wire Throttle Position Sensor
Test Light: Low impedance = loading
consulab.com
I N T R O D U C T I O N T O T H E D S O
4
3
Asadvancesweremadeindiagnostictools,theGRAPHINGandPOWERGRAPHINGmeterswereavailable.Thesetoolswereableto“display”awaveform(sortof)thathelpedincertaindiagnostictests.
Now,theneedforadiagnostictoolthatcancaptureanddisplayveryfastsignalsisgreaterthanever.Asthefrequency(speed)ofelectricalsignalsontoday’svehiclescontinuetoincrease,oscilloscopesaretheonlytoolthatcan“record”anddisplaythemfordiagnosispurposes.Alldigitalmeters“average”orsamplesthesignalstheyaremeasuring.Mostdonotshow“livedata”,butbasedontheirupdaterate,theyaverageallofthesignalstheymeasure.Foranexample,supposethatyouconnectedadigitalvoltmetertoaheaterblowermotorthatwaspulsewidthmodulatedcontrolledbytheBCM.TheHVACcontrolsaresettoruntheblowermotorat“half-speed”ora50%PWMdutycycle.Ifadigitalvoltmeterisconnectedtotheblowermotor,itwilldisplaybetween6.5to7.5voltsdependingonthechargingvoltageoftherunningvehicle.Inreality,theblowermotorisrunningonfullchargingvoltage(vehiclerunning)ofabout13.5-14.5voltsbutavailableonly50%ofthetime.PWMcircuitsarebestdiagnosedwithoscilloscopesasthevoltmetercannotseeormeasureminorglitchesorcircuitabnormalitiesandespeciallyintermittentproblems.
Thedigitalstorageoscilloscope(DSO)istheonlydiagnostictoolthatcanread,storeandreplaysignalwaveformsthatareinvaluableindeterminingcausesofcircuitproblems.TherearemanybrandsandtypesofDSO’sonthemarketandtechnicianshavemanychoices.Usingmultiplechannels,scopescanbeusedtocomparetwoormoresignalsonvehiclesystemstochecksuchthingsasthepropermechanicalrelationshipbetweencamandcrank(timingchainwearorout-of-time).
ADVANTAGES: • Capableofmeasuringsignalsveryquickly(inmicroormilli-seconds)• Displaysthesignalsoveranadjustableperiodoftime• Multiplesignalscanbedisplayedtogetherandcomparedforproperoperation• Can“record”signalsforplaybackandevaluation• Canalsobeusedtodisplayandmeasure:Pressure,Vacuum,Temperatureandothers.Veryprecise
informationcanbeviewed• TheadvantageofaDSOoveraDMMisthatitcandisplayvoltage,current(andothersignals)overaperiodof
time.• DSO’scaptureveryfastandsubtlesignalchangesthatDMM’scannot“see”ormeasure.• Scopesalsoshowsignal“trends”.Rise,fall,abnormalsignal(hash&static)andothers.• Manyoftoday’selectroniccomponents(especiallyCANBus)aremorequicklyandaccuratelydiagnosedusing
signalsviewedonlyonDSO’s.
USEFULAPPLICATIONSOFANOSCILLOSCOPE:
• TheadvantageofaDSOoveraDMMisthatitcandisplayvoltage,current(andothersignals)overaperiodoftime.
• DSO’scaptureveryfastandsubtlesignalchangesthatDMM’scannot“see”ormeasure.• Theuseof“transducers”canturntheDSOintoaverypowerfuldiagnostictool.• Capableofmeasuringsignalsveryquickly(inmicroormilli-seconds)• Can“record”signalsforplaybackandevaluation• Canalsobeusedtodisplayandmeasure:Pressure,Vacuum,Temperatureandothers.Veryprecise
informationcanbeviewed
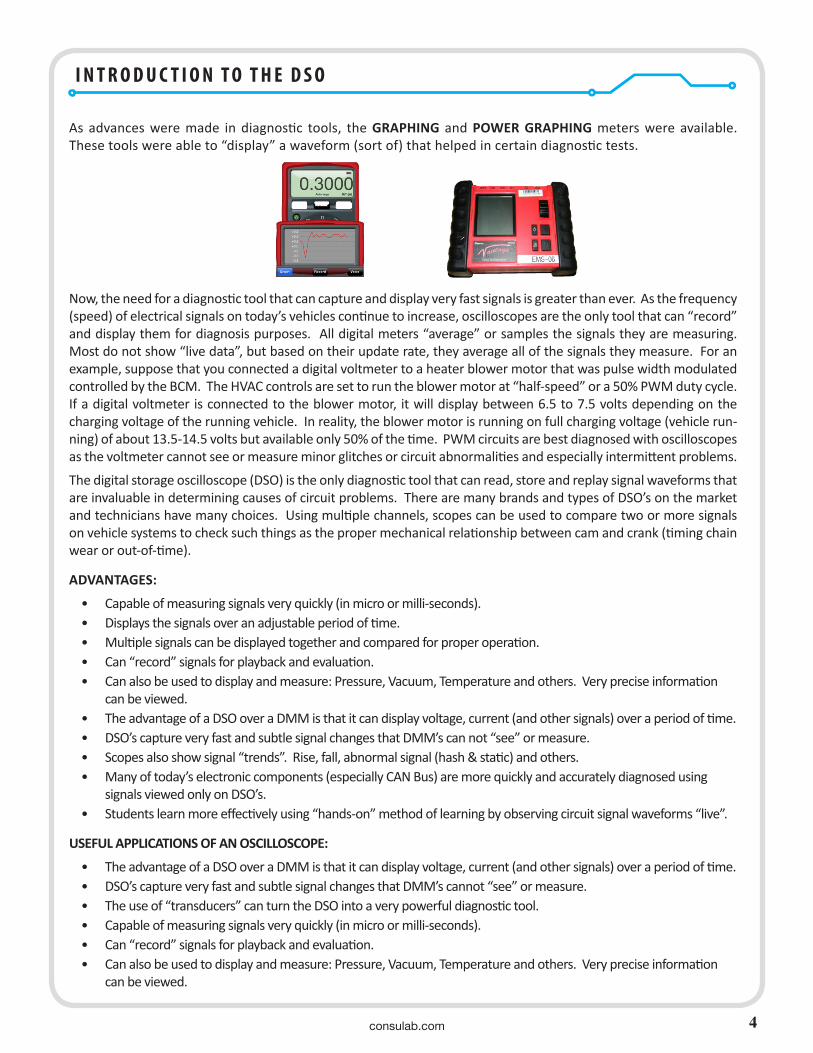
As advances were made in diagnostic tools, the GRAPHING and POWER GRAPHING meters were available. These tools were able to “display” a waveform (sort of) that helped in certain diagnostic tests.
Now, the need for a diagnostic tool that can capture and display very fast signals is greater than ever. As the frequency (speed) of electrical signals on today’s vehicles continue to increase, oscilloscopes are the only tool that can “record” and display them for diagnosis purposes. All digital meters “average” or samples the signals they are measuring. Most do not show “live data”, but based on their update rate, they average all of the signals they measure. For an example, suppose that you connected a digital voltmeter to a heater blower motor that was pulse width modulated controlled by the BCM. The HVAC controls are set to run the blower motor at “half-speed” or a 50% PWM duty cycle. If a digital voltmeter is connected to the blower motor, it will display between 6.5 to 7.5 volts depending on the charging voltage of the running vehicle. In reality, the blower motor is running on full charging voltage (vehicle run-ning) of about 13.5-14.5 volts but available only 50% of the time. PWM circuits are best diagnosed with oscilloscopes as the voltmeter cannot see or measure minor glitches or circuit abnormalities and especially intermittent problems.
The digital storage oscilloscope (DSO) is the only diagnostic tool that can read, store and replay signal waveforms that are invaluable in determining causes of circuit problems. There are many brands and types of DSO’s on the market and technicians have many choices. Using multiple channels, scopes can be used to compare two or more signals on vehicle systems to check such things as the proper mechanical relationship between cam and crank (timing chain wear or out-of-time).
ADVANTAGES:
• Capable of measuring signals very quickly (in micro or milli-seconds).• Displays the signals over an adjustable period of time.• Multiple signals can be displayed together and compared for proper operation.• Can “record” signals for playback and evaluation.• Can also be used to display and measure: Pressure, Vacuum, Temperature and others. Very precise information
can be viewed.• The advantage of a DSO over a DMM is that it can display voltage, current (and other signals) over a period of time.• DSO’s capture very fast and subtle signal changes that DMM’s can not “see” or measure.• Scopes also show signal “trends”. Rise, fall, abnormal signal (hash & static) and others.• Many of today’s electronic components (especially CAN Bus) are more quickly and accurately diagnosed using
signals viewed only on DSO’s.• Students learn more effectively using “hands-on” method of learning by observing circuit signal waveforms “live”.
USEFUL APPLICATIONS OF AN OSCILLOSCOPE:
• The advantage of a DSO over a DMM is that it can display voltage, current (and other signals) over a period of time.• DSO’s capture very fast and subtle signal changes that DMM’s cannot “see” or measure.• The use of “transducers” can turn the DSO into a very powerful diagnostic tool.• Capable of measuring signals very quickly (in micro or milli-seconds).• Can “record” signals for playback and evaluation.• Can also be used to display and measure: Pressure, Vacuum, Temperature and others. Very precise information
can be viewed.

consulab.com
I N T R O D U C T I O N T O T H E D S O
5
4
WHAT SCOPES CAN MEASURE:
Voltage characteristics:
• Amplitude – Amplitude is a measure of the magnitude of a signal. There are a variety of amplitudemeasurements including peak-to-peak amplitude, which measures the absolute difference between a highand low voltage point of a signal. Peak amplitude, on the other hand, only measures how high or low a signalis past 0V.
• Max & Min voltages – The scope can tell you exactly how high and low the voltage of your signal gets.• Mean & average voltages – Oscilloscopes can calculate the average or mean of your signal, and it can also tell
you the average of your signal’s minimum and maximum voltage.
Time characteristics:
• Frequency and period – Frequency is defined as the number of times per second a waveform repeats. And theperiod is the reciprocal of that (number of seconds each repeating waveform takes). The maximum frequencya scope can measure varies, but it’s often in the 100’s of MHz range.
• Duty cycle – The percentage of a period that a wave is either positive or negative (there are both positive andnegative duty cycles). The duty cycle is a ratio that tells you how long a signal is “on” versus how long it’s “off”each period.
• Rise and fall time – Signals can’t instantaneously go from 0V to 5V, they have to smoothly rise. The durationof a wave going from a low point to a high point is called the rise time, and fall time measures the opposite.These characteristics are important when considering how fast a circuit can respond to signals.
ONLY OSCILLOSCOPES ARE ABLE TO “CAPTURE” AND VIEW VERY FAST SIGNALS
Today’s cars are basically run or operated by computers. All systems consist of either input and output signals sent to or from computers. The scope is the only method of detailed checking of both the electrical and mechanical systems for proper performance. It also measures the electrical integrity of the circuit in which abnormal conditions such as high or low resistance, opens, shorts and grounds can be “seen” by scopes.
WHAT SCOPES CAN MEASURE:
Voltage characteristics:
• Amplitude – Amplitude is a measure of the magnitude of a signal. There are a variety of amplitude measure-ments including peak-to-peak amplitude, which measures the absolute difference between a high and low voltage point of a signal. Peak amplitude, on the other hand, only measures how high or low a signal is past 0V.
• Max & Min voltages – The scope can tell you exactly how high and low the voltage of your signal gets.• Mean & average voltages – Oscilloscopes can calculate the average or mean of your signal, and it can also tell
you the average of your signal’s minimum and maximum voltage.
Time characteristics:
• Frequency and period – Frequency is defined as the number of times per second a waveform repeats. And the period is the reciprocal of that (number of seconds each repeating waveform takes). The maximum frequency a scope can measure varies, but it’s often in the 100’s of MHz range.
• Duty cycle – The percentage of a period that a wave is either positive or negative (there are both positive and negative duty cycles). The duty cycle is a ratio that tells you how long a signal is “on” versus how long it’s “off” each period.
• Rise and fall time – Signals can’t instantaneously go from 0V to 5V, they have to smoothly rise. The dura-tion of a wave going from a low point to a high point is called the rise time, and fall time measures the opposite. These characteristics are important when considering how fast a circuit can respond to signals.
Today’s cars are basically run or operated by computers. All systems consist of either input and output signals sent to or from computers. The scope is the only method of detailed checking of both the electrical and mechanical systems for proper performance. It also measures the electrical integrity of the circuit in which abnormal conditions such as high or low resistance, opens, shorts and grounds can be “seen” by scopes.
ONLY OSCILLOSCOPES ARE ABLE TO “CAPTURE” AND VIEW VERY FAST SIGNALS
ACKNOWLEDGED DISADVANTAGES OF OSCILLOSCOPES:
• Requires some practice to obtain a usable pattern using voltage, time and trigger controls.
• Requires time and study to learn what the displayed “squiggly” lines actually mean.• Requires a solid knowledge base of “interpreting” waveforms to determine abnormal conditions and make
diagnosis.• DSO’s can vary between brands regarding features, controls and displays. There is a lack of “consistency”
between brands.• Some scopes are more difficult to use than others.
consulab.com
I N T R O D U C T I O N T O T H E D S O
6
TELL ME WHY I SHOULD LEARN HOW TO USE A DSO:
• SCOPES ALLOW SIGNALS TO BE “SEEN” IN DETAIL• IT MEASURES SIGNALS VERY FAST (NOTHING IS FASTER)• RECORDS PATTERNS FOR LATER EVALUATION• ABILITY TO COMPARE MULTIPLE SIGNALS (MULTIPLE CHANNELS)• ONLY TOOL THAT CAN “CATCH” INTERMITTENT GLITCHES & PROBLEMS• ALLOWS “LIVE” CURRENT MEASUREMENT WHICH IS VERY VALUABLE• TRANSDUCERS FOR PRESSURE/VACUUM and OTHER TESTS• STUDENTS LEARN MORE EFFECTIVELY BY “SEEING” THE CIRCUIT OPERATE USING A SCOPE
SCOPE HISTORY
In 1897, Karl Ferdinand Braun invented the oscilloscope, which was an adaptation that he made to the cathode ray tube. He worked with and made improvements to Marconi’s wireless telegraphy. In fact, he and Marconi shared the Nobel Prize for Physics in 1909. One of the interesting things to note is that these tubes were the precursors to the tubes used for television and radar systems years later. The reason that the oscilloscope that we know today exists is the invention of the cathode ray tube. These tubes are instrumental in the scopes. Braun invented the scope, almost as a curiosity as much as a tool. Two years after the invention, Jonathan Zenneck added beam-forming plates to the tube and utilized a magnetic field along with it for “sweeping the trace”. An interesting piece of the history of the os-cilloscope is that it was once quite common to see them as props in television and in the movies. They were stand-ins that represented scientific equipment in the lab. It was actually quite common to see them in the 1950s and 1960s. The old television show The Outer Limits actually made use of the device in their opening credits.
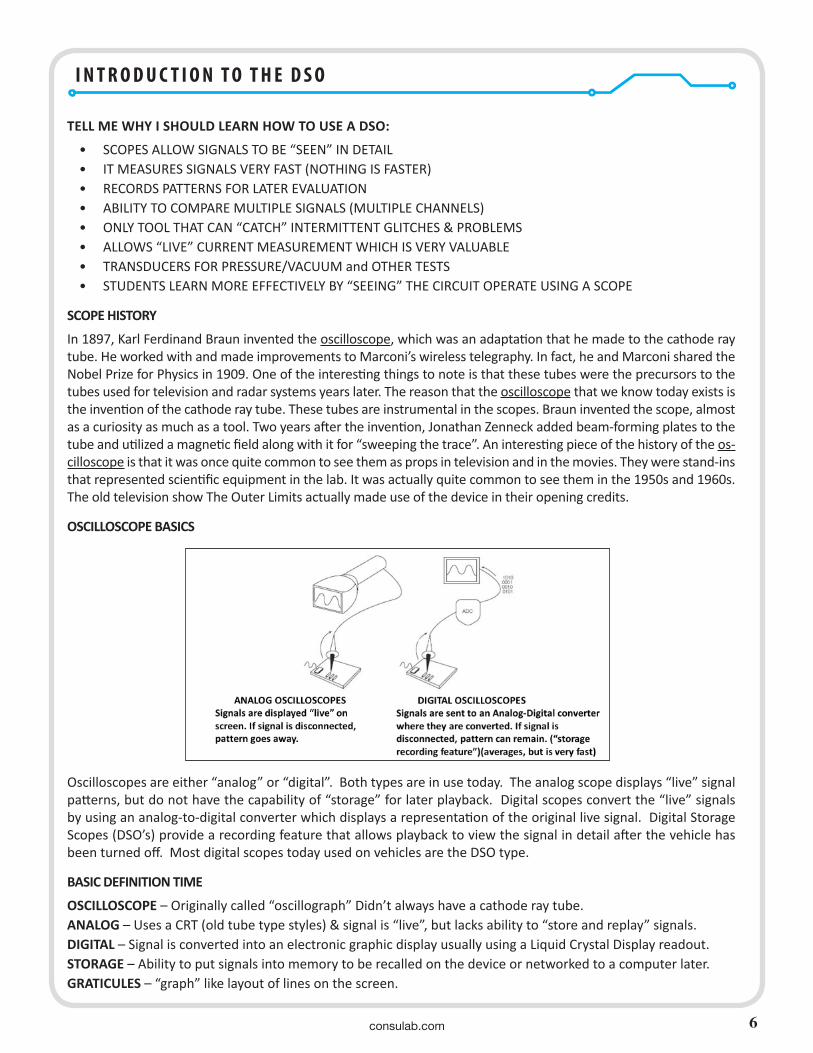
OSCILLOSCOPE BASICS
Oscilloscopes are either “analog” or “digital”. Both types are in use today. The analog scope displays “live” signal patterns, but do not have the capability of “storage” for later playback. Digital scopes convert the “live” signals by using an analog-to-digital converter which displays a representation of the original live signal. Digital Storage Scopes (DSO’s) provide a recording feature that allows playback to view the signal in detail after the vehicle has been turned off. Most digital scopes today used on vehicles are the DSO type.
BASIC DEFINITION TIME
OSCILLOSCOPE – Originally called “oscillograph” Didn’t always have a cathode ray tube. ANALOG – Uses a CRT (old tube type styles) & signal is “live”, but lacks ability to “store and replay” signals. DIGITAL – Signal is converted into an electronic graphic display usually using a Liquid Crystal Display readout.STORAGE – Ability to put signals into memory to be recalled on the device or networked to a computer later.GRATICULES – “graph” like layout of lines on the screen.
consulab.com
I N T R O D U C T I O N T O T H E D S O
7
ITEMSTOBEADDEDTOTHEDSOCLASSHANDOUT
DRAWING#1INSERTONPAGE7DRAWING#2INSERTONPAGE7DRAWING#2INSERTONPAGE7
ITEMSTOBEADDEDTOTHEDSOCLASSHANDOUT
DRAWING#1INSERTONPAGE7DRAWING#2INSERTONPAGE7DRAWING#2INSERTONPAGE7
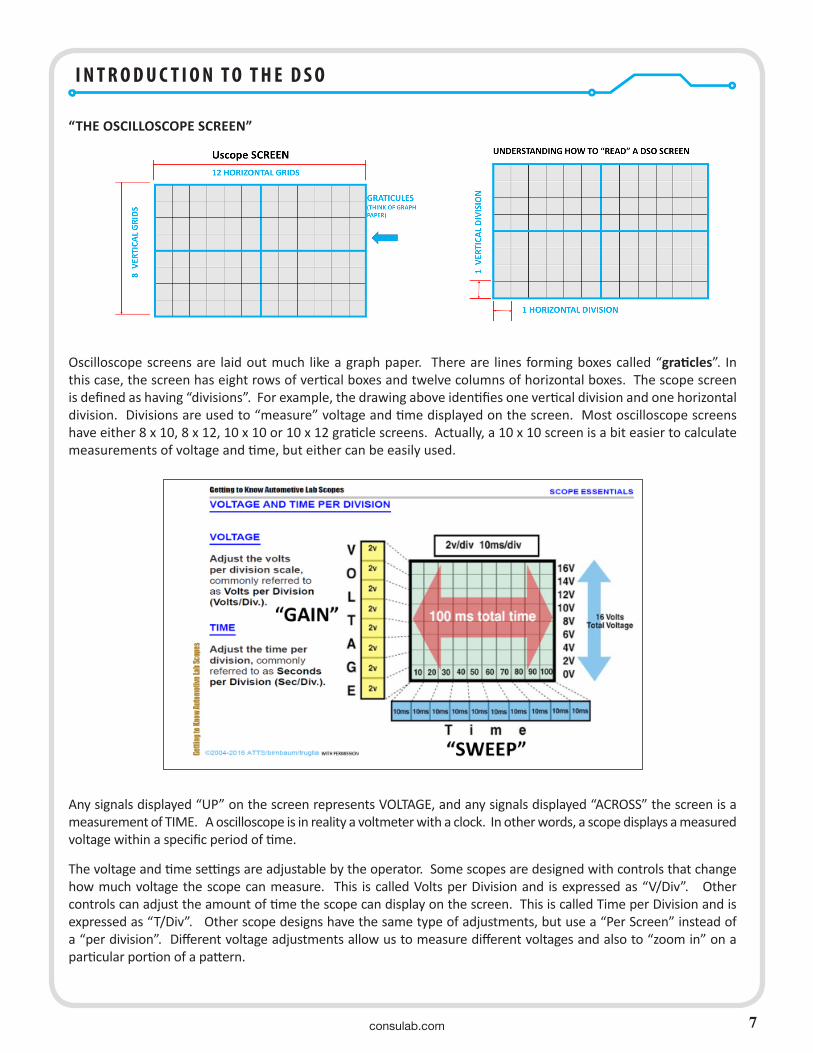
“THE OSCILLOSCOPE SCREEN”
Oscilloscope screens are laid out much like a graph paper. There are lines forming boxes called “graticles”. In this case, the screen has eight rows of vertical boxes and twelve columns of horizontal boxes. The scope screen is defined as having “divisions”. For example, the drawing above identifies one vertical division and one horizontal division. Divisions are used to “measure” voltage and time displayed on the screen. Most oscilloscope screens have either 8 x 10, 8 x 12, 10 x 10 or 10 x 12 graticle screens. Actually, a 10 x 10 screen is a bit easier to calculate measurements of voltage and time, but either can be easily used.
Any signals displayed “UP” on the screen represents VOLTAGE, and any signals displayed “ACROSS” the screen is a measurement of TIME. A oscilloscope is in reality a voltmeter with a clock. In other words, a scope displays a measured voltage within a specific period of time.
The voltage and time settings are adjustable by the operator. Some scopes are designed with controls that change how much voltage the scope can measure. This is called Volts per Division and is expressed as “V/Div”. Other controls can adjust the amount of time the scope can display on the screen. This is called Time per Division and is expressed as “T/Div”. Other scope designs have the same type of adjustments, but use a “Per Screen” instead of a “per division”. Different voltage adjustments allow us to measure different voltages and also to “zoom in” on a particular portion of a pattern.

consulab.com
I N T R O D U C T I O N T O T H E D S O
8
7
Any signals displayed “UP” on the screen represents VOLTAGE, and any signals displayed “ACROSS” the screen is a measurement of TIME. A oscilloscope is in reality a voltmeter with a clock. In other words, a scope displays a measured voltage within a specific period of time. The voltage and time settings are adjustable by the operator. Some scopes are designed with controls that change how much voltage the scope can measure. This is called Volts per Division and is expressed as “V/Div”. Other controls can adjust the amount of time the scope can display on the screen. This is called Time per Division and is expressed as “T/Div”. Other scope designs have the same type of adjustments, but use a “Per Screen” instead of a “per division”. Different voltage adjustments allow us to measure different voltages and also to “zoom in” on a particular portion of a pattern. Let’s use a scope with a 10 x 10 screen as an example. If the controls were set on .5 V/Div and 2ms/Div. The full screen capacity of the measurements would be 5 volts and the total time displayed would be 0.020 milliseconds. If the controls were changed to 2 V/Div and 1 S/Div, the range would change to 20 volts and 10 seconds of display across the full screen. The other type of scope adjustment states the full screen capacity. Therefore, if the voltage control of a 10 x 10 screen were displayed as 5V, the screen could measure a maximum of 5 volts and each horizontal line would be 0.2 volts. If the time adjustment was set to 2 sec, full screen sweep would be 2 seconds and each vertical line would be 200 milli-seconds. This type of measurement adjustment is called “GAIN” for full screen voltage capacity and “SWEEP” for full screen time display capacity. Either scope adjustment style is more or less the same. The difference is in how the setting is interpreted. An oscilloscope displays signals on a screen. Signals are obtained from one or more “channels” each having a signal test lead attached to the circuit being measured. Any signal that goes UP on the screen represents a change in voltage. UP means more voltage, DOWN means less voltage. The signal moves across the screen from left to right. This movement represents a period of time. The time period is adjustable by the user so that very short time or very long time spans can be displayed. The square grids are called “divisions” and are the way that accurate measurements are made. If in the above example, the scope was set for 2ms per division, the total amount of time displayed would be 2 seconds with each division being .200 seconds or 200ms.
UP
= VO
LTAG
E –
Y ax
is
ACROSS = TIME - X axis SO, MEASUREMENTS OF TIME ARE “TIME PER DIVISION”
SO, M
EASU
REM
ENT
ARE
VOLT
S PE
R DI
VISI
ON
Let’s use a scope with a 10 x 10 screen as an example. If the controls were set on .5 V/Div and 2ms/Div. The full screen capacity of the measurements would be 5 volts and the total time displayed would be 0.020 milliseconds. If the controls were changed to 2 V/Div and 1 S/Div, the range would change to 20 volts and 10 seconds of display across the full screen.
The other type of scope adjustment states the full screen capacity. Therefore, if the voltage control of a 10 x 10 screen were displayed as 5V, the screen could measure a maximum of 5 volts and each horizontal line would be 0.2 volts. If the time adjustment was set to 2 sec, full screen sweep would be 2 seconds and each vertical line would be 200 milli-seconds. This type of measurement adjustment is called “GAIN” for full screen voltage capacity and “SWEEP” for full screen time display capacity. Either scope adjustment style is more or less the same. The difference is in how the setting is interpreted.
An oscilloscope displays signals on a screen. Signals are obtained from one or more “channels” each having a signal test lead attached to the circuit being measured. Any signal that goes UP on the screen represents a change in volt-age. UP means more voltage, DOWN means less voltage. The signal moves across the screen from left to right. This movement represents a period of time. The time period is adjustable by the user so that very short time or very long time spans can be displayed. The square grids are called “divisions” and are the way that accurate measurements are made. If in the above example, the scope was set for 2ms per division, the total amount of time displayed would be 2 seconds with each division being .200 seconds or 200ms.

consulab.com
I N T R O D U C T I O N T O T H E D S O
9
ITEM#1
UNDERSTANDINGTIME/DIVNUMBERSETTINGS(10horizontalgriddesign)TIMEPERDIVISION MAXIMUMTOTALTIMEDISPLAYED
50ns(nanosecond)(fastest) 500ns.1us(microsecond) 1us.2us(microsecond) 2us.5us(microsecond) 5us1us(microsecond) 10us2us(microsecond) 20us5us(microsecond) 50us10us(microsecond) 100us20us(microsecond) 200us50us(microsecond) 500us.1ms(millisecond) 1ms.2ms(millisecond) 2ms.5ms(millisecond) 5ms1ms(millisecond) 10ms2ms(millisecond) 20ms5ms(millisecond) 50ms10ms(millisecond) 100ms20ms(millisecond) 200ms50ms(millisecond) 500ms.1Sec(Second) 1sec..2Sec(Second) 2sec..5Sec(Second) 5sec.1Sec 10sec.2Sec 20sec.5Sec 50sec.10Sec 100sec.20Sec 200sec.50Sec(slowest) 500sec.
8
One must understand the many abbreviations used with oscilloscopes. Terms like: “milli”, “micro” and “nano” are often used when adjusting the scope screen to obtain a desired pattern.
INSERT THE TIME CHART (ITEM # 1) HERE
This chart shows the total amount of displayed time on a scope with 10 horizontal grids. In this case, there are a total of 28 different time/div selections that can be made. Some scopes do not have all of the above time choices.
One must understand the many abbreviations used with oscilloscopes. Terms like: “milli”, “micro” and “nano” are often used when adjusting the scope screen to obtain a desired pattern.
This chart shows the total amount of displayed time on a scope with 10 horizontal grids. In this case, there are a total of 28 different time/div selections that can be made. Some scopes do not have all of the above time choices.
consulab.com
I N T R O D U C T I O N T O T H E D S O
10
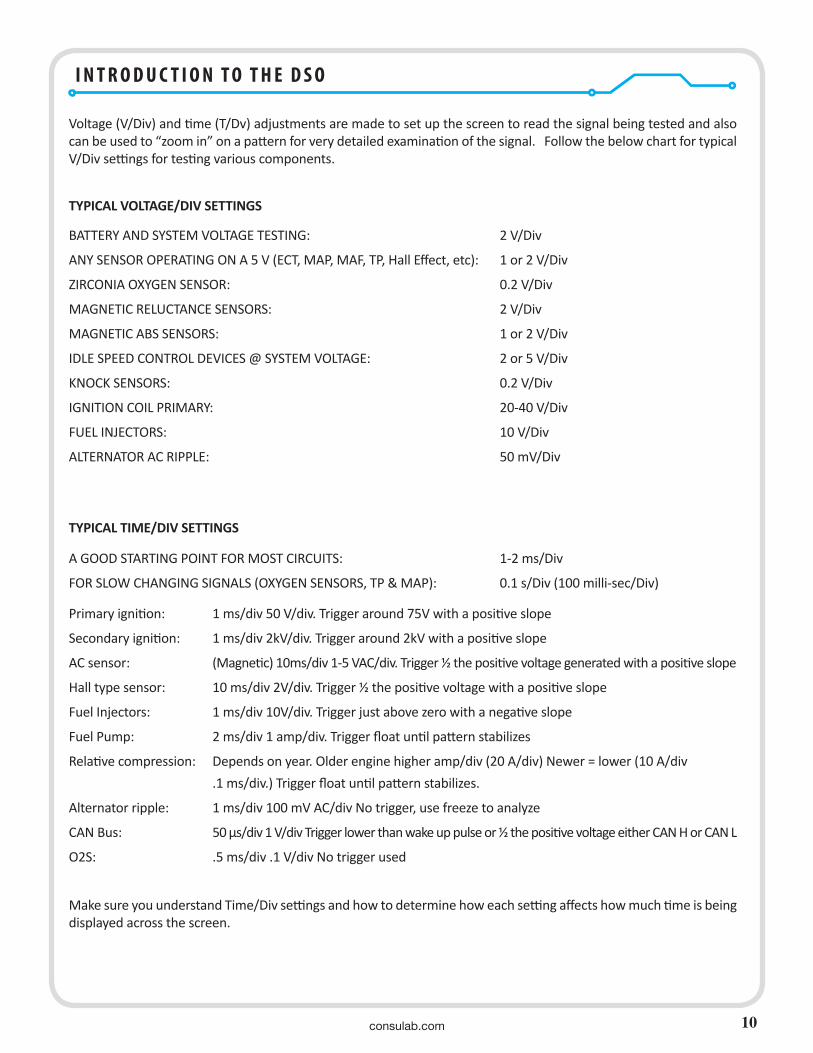
Voltage (V/Div) and time (T/Dv) adjustments are made to set up the screen to read the signal being tested and also can be used to “zoom in” on a pattern for very detailed examination of the signal. Follow the below chart for typical V/Div settings for testing various components.
TYPICAL VOLTAGE/DIV SETTINGS
BATTERY AND SYSTEM VOLTAGE TESTING: 2 V/Div
ANY SENSOR OPERATING ON A 5 V (ECT, MAP, MAF, TP, Hall Effect, etc): 1 or 2 V/Div
ZIRCONIA OXYGEN SENSOR: 0.2 V/Div
MAGNETIC RELUCTANCE SENSORS: 2 V/Div
MAGNETIC ABS SENSORS: 1 or 2 V/Div
IDLE SPEED CONTROL DEVICES @ SYSTEM VOLTAGE: 2 or 5 V/Div
KNOCK SENSORS: 0.2 V/Div
IGNITION COIL PRIMARY: 20-40 V/Div
FUEL INJECTORS: 10 V/Div
ALTERNATOR AC RIPPLE: 50 mV/Div
TYPICAL TIME/DIV SETTINGS
A GOOD STARTING POINT FOR MOST CIRCUITS: 1-2 ms/Div
FOR SLOW CHANGING SIGNALS (OXYGEN SENSORS, TP & MAP): 0.1 s/Div (100 milli-sec/Div)
Primary ignition: 1 ms/div 50 V/div. Trigger around 75V with a positive slope
Secondary ignition: 1 ms/div 2kV/div. Trigger around 2kV with a positive slope
AC sensor: (Magnetic) 10ms/div 1-5 VAC/div. Trigger ½ the positive voltage generated with a positive slope
Hall type sensor: 10 ms/div 2V/div. Trigger ½ the positive voltage with a positive slope
Fuel Injectors: 1 ms/div 10V/div. Trigger just above zero with a negative slope
Fuel Pump: 2 ms/div 1 amp/div. Trigger float until pattern stabilizes
Relative compression: Depends on year. Older engine higher amp/div (20 A/div) Newer = lower (10 A/div .1 ms/div.) Trigger float until pattern stabilizes.
Alternator ripple: 1 ms/div 100 mV AC/div No trigger, use freeze to analyze
CAN Bus: 50 μs/div 1 V/div Trigger lower than wake up pulse or ½ the positive voltage either CAN H or CAN L
O2S: .5 ms/div .1 V/div No trigger used
Make sure you understand Time/Div settings and how to determine how each setting affects how much time is being displayed across the screen.

consulab.com
I N T R O D U C T I O N T O T H E D S O
11
Time/Div are often adjusted to “zoom” on displayed patterns.
11
Time/Div are often adjusted to “zoom” on displayed patterns.
It is important that you understand how to adjust V/Div and T/Div on the scope you are using. Refer to the above chart that lists suggested starting points for some common components typically tested on vehicles.
UNDERSTANDING SCOPE CONTROLS
VOLTS PER DIVISION10mV, 20mV, 50mV, .1V, .2V, .5V, 1V, 2V, 5V, 10V
TIME PER DIVISION1us, 2us, 5us, 10us, 20us, 50us, 100us, 200us, 500us, 1ms, 2ms, 5ms, 10ms, 20ms, 50ms,…….etc
What do you see in common with these numbers??
V/Div dD ADJUSTMENT
T/Div D
d ADJUSTMENT
UNDERSTANDING SCOPE CONTROLS
It is important that you understand how to adjust V/Div and T/Div on the scope you are using. Refer to the above chart that lists suggested starting points for some common components typically tested on vehicles.
All oscilloscopes all have some type of V/Div and T/Div adjustments. They can be buttons, tool bars, computer menu (if PC based), rocker switches or knobs. It really isn’t important what type of adjustment control there is, just that you know how to select proper voltage and time settings.
WITH PERMISSION

consulab.com
I N T R O D U C T I O N T O T H E D S O
12
Generally speaking, the higher the sampling rate, the better the DSO is.
EXAMPLE: OTC/Bosch Tech-Scope sampling rate is 40 MS/s.
Interpreted as: 40 million samples per second.
12
All oscilloscopes all have some type of V/Div and T/Div adjustments. They can be buttons, tool bars, computer menu(if PC based), rocker switches or knobs. It really isn’t important what type of adjustment control there is, just that you know how to select proper voltage and time settings.
Scopes form patterns on the screen by “drawing” the sampling “dots” that are recorded on the screen. The more dots that are available (higher sampling rate), the more accurate the pattern will be. Purchase the highest sampling rate scope that your money can buy.
DSO SAMPLING RATE – REAL –TIME & EQUIVALENT
Generally speaking, the higher the sampling rate, the better the DSO is.
EXAMPLE: OTC/Bosch Tech-Scope sampling rate is 40 MS/s
Interpreted as: “40 million samples per second”
SCOPE TRIGGERS – WHAT ARE THEY AND HOW DO WE USE THEM??
A scope trigger or level is an adjustable voltage “set point” at which the scope will start to display a pattern. You can choose the voltage the pattern must reach before it is displayed.
It is usually represented by a diamond or plus mark on the screen.
If the trigger level voltage is adjusted higher than the voltage of the pattern being displayed, the screen will not show a pattern. This is because the “trigger level voltage” has not been “met”.(Unless the AUTO trigger mode is selected.)

consulab.com
I N T R O D U C T I O N T O T H E D S O
13
SCOPE TRIGGERS — WHAT ARE THEY AND HOW DO WE USE THEM?
A scope trigger or level is an adjustable voltage “set point” at which the scope will start to display a pattern. You can choose the voltage the pattern must reach before it is displayed.
It is usually represented by a diamond ◊ or plus mark + on the screen.
If the trigger level voltage is adjusted higher than the voltage of the pattern being displayed, the screen will not show a pattern. This is because the “trigger level voltage” has not been “met”.
(Unless the AUTO trigger mode is selected.)
A trigger adjusts a set point at which the scope will start displaying a pattern. The trigger level detects when a certain voltage level has been reached and at this point sets the time-base in operation to sweep across the screen. In effect, the trigger level is like a comparator which switches the time-base to start when a voltage level has been reached. The trigger slope, as the name indicates, determines whether the time-base sweep is triggered on a positive or negative going edge or slope.
13
TRIGGERS
Most scopes use a = sign or a diamond icon to indicate where the trigger level is on the screen. If a trigger point is set higher than the displayed pattern, a pattern will not appear UNLESS the scope trigger mode is set to AUTO. AUTO trigger will display a pattern regardless of where the trigger level voltage point is set. If the trigger mode is set to “NORM” or “SING”, the trigger level voltage must be met by the pattern in order for a pattern to be displayed.
The AUTO TRIGGER setting will allow a pattern to be displayed.
DRAWING#3=INSERTONPAGE15
consulab.com
I N T R O D U C T I O N T O T H E D S O
14
TRIGGER LEVEL ADJUSTMENT
Trigger level is a manually selected adjustment that sets the voltage point that the pattern MUST cross before a pat-tern is displayed. (This is not true for AUTO trigger mode). The trigger level is selecting a voltage and time point where the pattern must pass through before a pattern is displayed.
AUTO TRIGGER
The scope will always display a pattern no matter what the trigger level is adjusted to. It may drift across the screen until you adjust the level somewhere in the pattern.
NORM TRIGGER
Normal trigger will not display a pattern until it passes through the adjusted trigger level setting. No pattern will ap-pear if the trigger level is adjusted above the highest voltage of the pattern. If the trigger level is adjusted below the lowest voltage of the pattern, no pattern will be displayed.
SING TRIGGER
Single trigger will display one single pattern when the pattern passes through the adjusted trigger level and will then “freeze” the pattern for detailed examination.
HOLD TRIGGER
Some scopes have a “HOLD” feature. Selecting this mode will “freeze” the pattern on the screen even though the signal is still active. This allows for closer viewing and examination of the signal. Releasing the HOLD feature will al-low the pattern to return to “live data”.
For beginning scope users, it is often recommended that the AUTO trigger feature be selected so that a pattern will appear on the screen. If it “drifts” back and forth, adjust the trigger level until it “locks” the pattern still.
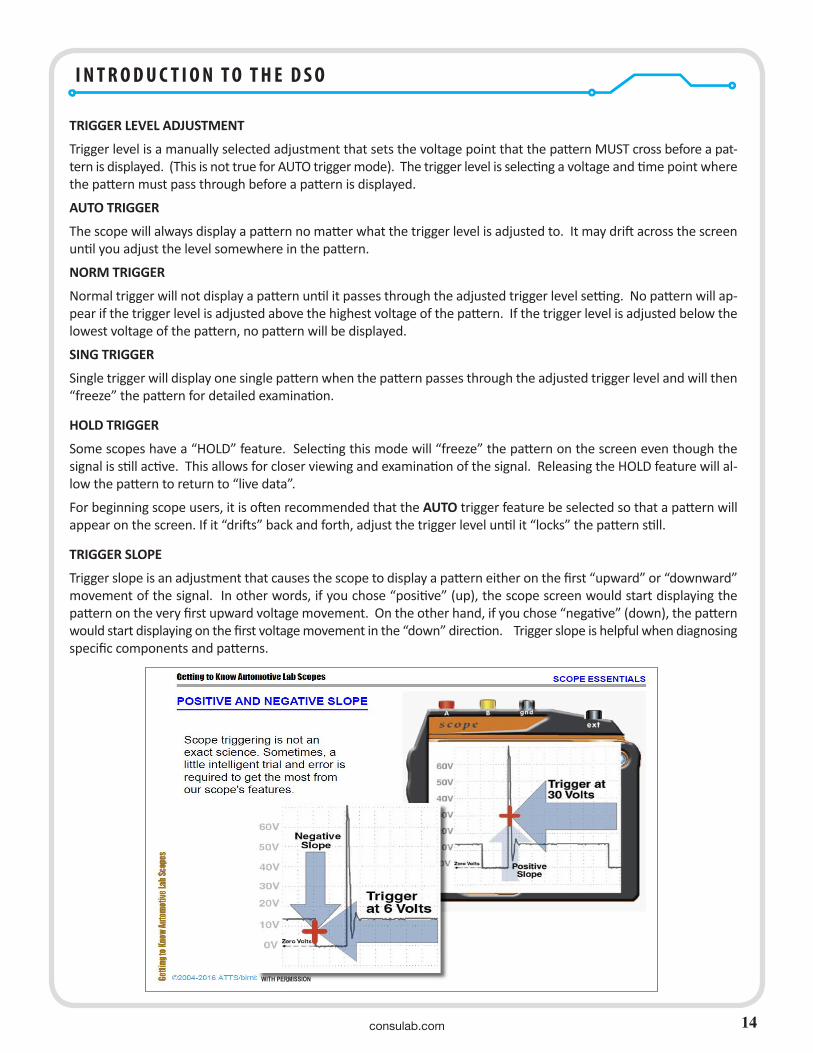
TRIGGER SLOPE
Trigger slope is an adjustment that causes the scope to display a pattern either on the first “upward” or “downward” movement of the signal. In other words, if you chose “positive” (up), the scope screen would start displaying the pattern on the very first upward voltage movement. On the other hand, if you chose “negative” (down), the pattern would start displaying on the first voltage movement in the “down” direction. Trigger slope is helpful when diagnosing specific components and patterns.
15
SCOPE SIGNAL COUPLING:
Scope signal coupling is basically how the signal pattern displays on the screen. There are two basic types that most scope have and some may have an additional signal coupling mode called “GROUND COUPLED” The most common methods of signal coupling are: DC and AC.
DC COUPLED- When the scope is set for DC signal coupling, both DC and any AC signals appear on the screen. With the scope set to DC coupling, most scopes have the “ZERO” horizontal line at or near the bottom of the screen. The position of the zero or “ground” line is adjustable. DC coupling is the most common coupling used with automobiles and many technicians commonly use this feature.
AC COUPLED- When the scope is set for AC signal coupling, internal scope electronics block all DC signals from being displayed and only AC signals are shown. The “ZERO” line appears exactly half-way up on the vertical graticles. This is to allow an AC signal to be displayed. Remember than an AC signal goes both positive (up) and negative (down), thus, we need the zero line to be in the middle of the screen to show typical sine waves from AC signals. There are certain tests where AC coupling is advisable. For example, when checking an alternator for leaking diodes, a test called “AC RIPPLE VOLTAGE” is performed. The DC voltage output of the alternator is blocked from being seen and only the actual AC ripple voltage (which is really what the alternator is putting out) is shown. This pattern will be deformed if one or more diodes are leaking or defective. Other examples of AC coupling use is testing of AC output sensors as is used in some newer WSS sensors.
WITH PERMISSION

consulab.com
I N T R O D U C T I O N T O T H E D S O
15
SCOPE SIGNAL COUPLING
Scope signal coupling is basically how the signal pattern displays on the screen. There are two basic types that most scope have and some may have an additional signal coupling mode called “GROUND COUPLED” The most common methods of signal coupling are: DC and AC.
DC COUPLED
When the scope is set for DC signal coupling, both DC and any AC signals appear on the screen. With the scope set to DC coupling, most scopes have the “ZERO” horizontal line at or near the bottom of the screen. The position of the zero or “ground” line is adjustable. DC coupling is the most common coupling used with automobiles and many technicians commonly use this feature.
AC COUPLED
When the scope is set for AC signal coupling, internal scope electronics block all DC signals from being displayed and only AC signals are shown. The “ZERO” line appears exactly half-way up on the vertical graticles. This is to allow an AC signal to be displayed. Remember than an AC signal goes both positive (up) and negative (down), thus, we need the zero line to be in the middle of the screen to show typical sine waves from AC signals. There are certain tests where AC coupling is advisable. For example, when checking an alternator for leaking diodes, a test called “AC RIPPLE VOLTAGE” is performed. The DC voltage output of the alternator is blocked from being seen and only the actual AC ripple voltage (which is really what the alternator is putting out) is shown. This pattern will be deformed if one or more diodes are leaking or defective. Other examples of AC coupling use is testing of AC output sensors as is used in some newer WSS sensors.
NOTE- Some components, especially newer wheel speed sensors may output an AC signal, but are designed to “ride” on a DC voltage. This allows the PCM to determine if the connector or wiring is open or shorted and can set an ap-propriate DTC (Diagnostic Trouble Code). Be sure you fully understand the circuit you are testing in order to choose the most correct scope coupling setting.
This slide shows the same signal in DC (top) and AC (bottom red) coupling modes. The alternators AC ripple pattern is much more visible using AC coupling.
16
CHANNEL 1
CHANNEL 2
CHANNEL 3
CHANNEL 4
This slide shows the same signal in DC (top) and AC (bottom red) coupling modes. The alternators AC ripple pattern is much more visible using AC coupling. MULTIPLE CHANNEL SCOPES: Oscilloscopes can be designed with only one channel, but can also have additional channels. Single channel scopes are the least expensive with the cost going up proportionally as more channels are added. Multi-channels scopes have the advantage of being able to display more than one signal at the same time. For example, the battery voltage and starter amperage could both be displayed during engine cranking for detailed analysis of the starting system. Individual ignition coils or fuel injectors can be evaluated using multiple channels. There are scopes available today with eight (8) channels that provide awesome diagnostic power, but can be somewhat cost prohibitive.
TYPICAL 4-CHANNEL SCOPE DISPLAY
consulab.com
I N T R O D U C T I O N T O T H E D S O
16
16
CHANNEL 1
CHANNEL 2
CHANNEL 3
CHANNEL 4
This slide shows the same signal in DC (top) and AC (bottom red) coupling modes. The alternators AC ripple pattern is much more visible using AC coupling. MULTIPLE CHANNEL SCOPES: Oscilloscopes can be designed with only one channel, but can also have additional channels. Single channel scopes are the least expensive with the cost going up proportionally as more channels are added. Multi-channels scopes have the advantage of being able to display more than one signal at the same time. For example, the battery voltage and starter amperage could both be displayed during engine cranking for detailed analysis of the starting system. Individual ignition coils or fuel injectors can be evaluated using multiple channels. There are scopes available today with eight (8) channels that provide awesome diagnostic power, but can be somewhat cost prohibitive.
TYPICAL 4-CHANNEL SCOPE DISPLAY
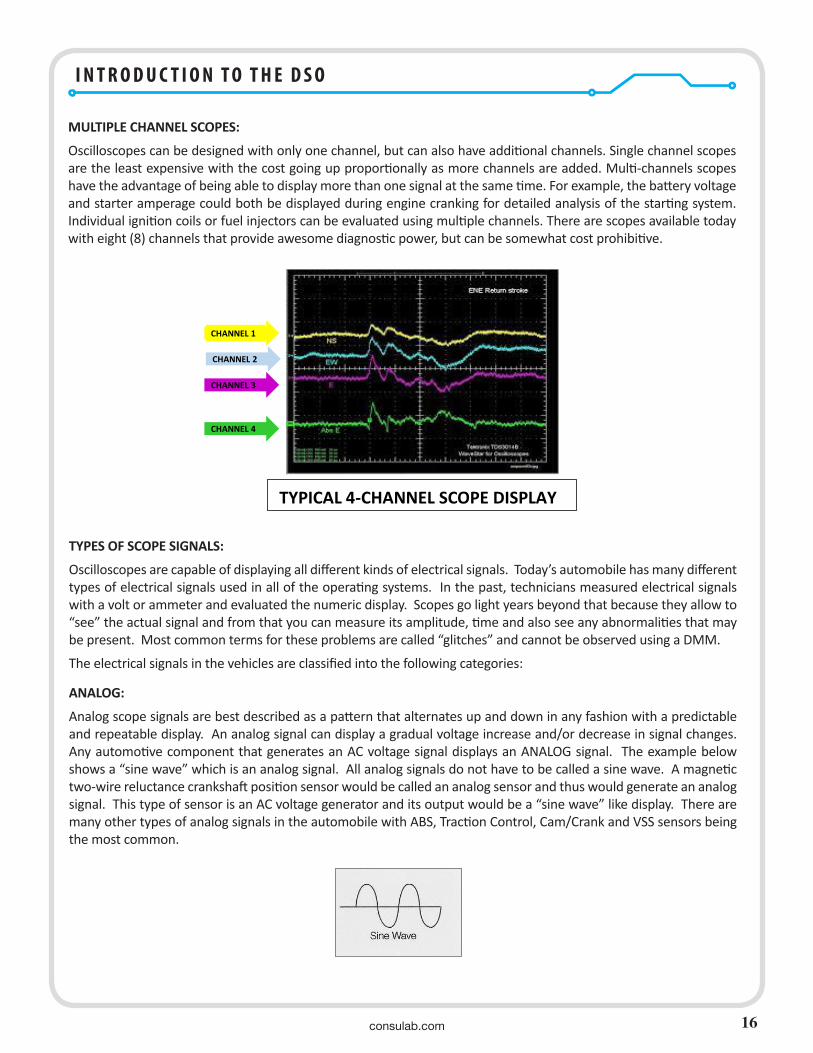
MULTIPLE CHANNEL SCOPES:
Oscilloscopes can be designed with only one channel, but can also have additional channels. Single channel scopes are the least expensive with the cost going up proportionally as more channels are added. Multi-channels scopes have the advantage of being able to display more than one signal at the same time. For example, the battery voltage and starter amperage could both be displayed during engine cranking for detailed analysis of the starting system. Individual ignition coils or fuel injectors can be evaluated using multiple channels. There are scopes available today with eight (8) channels that provide awesome diagnostic power, but can be somewhat cost prohibitive.
TYPES OF SCOPE SIGNALS:
Oscilloscopes are capable of displaying all different kinds of electrical signals. Today’s automobile has many different types of electrical signals used in all of the operating systems. In the past, technicians measured electrical signals with a volt or ammeter and evaluated the numeric display. Scopes go light years beyond that because they allow to “see” the actual signal and from that you can measure its amplitude, time and also see any abnormalities that may be present. Most common terms for these problems are called “glitches” and cannot be observed using a DMM.
The electrical signals in the vehicles are classified into the following categories:
ANALOG:
Analog scope signals are best described as a pattern that alternates up and down in any fashion with a predictable and repeatable display. An analog signal can display a gradual voltage increase and/or decrease in signal changes. Any automotive component that generates an AC voltage signal displays an ANALOG signal. The example below shows a “sine wave” which is an analog signal. All analog signals do not have to be called a sine wave. A magnetic two-wire reluctance crankshaft position sensor would be called an analog sensor and thus would generate an analog signal. This type of sensor is an AC voltage generator and its output would be a “sine wave” like display. There are many other types of analog signals in the automobile with ABS, Traction Control, Cam/Crank and VSS sensors being the most common.
17
TYPES OF SCOPE SIGNALS:
Oscilloscopes are capable of displaying all different kinds of electrical signals. Today’s automobile has many different types of electrical signals used in all of the operating systems. In the past, technicians measured electrical signals with a volt or ammeter and evaluated the numeric display. Scopes go light years beyond that because they allow to “see” the actual signal and from that you can measure its amplitude, time and also see any abnormalities that may be present. Most common terms for these problems are called “glitches” and cannot be observed using a DMM.
The electrical signals in the vehicles are classified into the following categories:
ANALOG:
Analog scope signals are best described as a pattern that alternates up and down in any fashion with a predictable and repeatable display. An analog signal can display a gradual voltage increase and/or decrease in signal changes. Any automotive component that generates an AC voltage signal displays an ANALOG signal. The example below shows a “sine wave” which is an analog signal. All analog signals do not have to be called a sine wave. A magnetic two-wire reluctance crankshaft position sensor would be called an analog sensor and thus would generate an analog signal. This type of sensor is an AC voltage generator and its output would be a “sine wave” like display. There are many other types of analog signals in the automobile with ABS, Traction Control, Cam/Crank and VSS sensors being the most common.
DIGITAL:
Digital scope signals are best described as an “on/off” display of the circuit turning on and off. There is no other display other than ON and then OFF. In comparison, an analog signal can gradually rise to its highest point, then gradually decrease its intensity to the point of turn off. Digital signals are often called “square wave” because they are either on or off. Many components on vehicles generate a digital signal. Common examples are Hall Effect sensors, CAN Bus signals, some newer WSS (wheel speed sensors), and any PWM (pulse width modulation) signals.
consulab.com
I N T R O D U C T I O N T O T H E D S O
17
17
TYPES OF SCOPE SIGNALS:
Oscilloscopes are capable of displaying all different kinds of electrical signals. Today’s automobile has many different types of electrical signals used in all of the operating systems. In the past, technicians measured electrical signals with a volt or ammeter and evaluated the numeric display. Scopes go light years beyond that because they allow to “see” the actual signal and from that you can measure its amplitude, time and also see any abnormalities that may be present. Most common terms for these problems are called “glitches” and cannot be observed using a DMM.
The electrical signals in the vehicles are classified into the following categories:
ANALOG:
Analog scope signals are best described as a pattern that alternates up and down in any fashion with a predictable and repeatable display. An analog signal can display a gradual voltage increase and/or decrease in signal changes. Any automotive component that generates an AC voltage signal displays an ANALOG signal. The example below shows a “sine wave” which is an analog signal. All analog signals do not have to be called a sine wave. A magnetic two-wire reluctance crankshaft position sensor would be called an analog sensor and thus would generate an analog signal. This type of sensor is an AC voltage generator and its output would be a “sine wave” like display. There are many other types of analog signals in the automobile with ABS, Traction Control, Cam/Crank and VSS sensors being the most common.
DIGITAL:
Digital scope signals are best described as an “on/off” display of the circuit turning on and off. There is no other display other than ON and then OFF. In comparison, an analog signal can gradually rise to its highest point, then gradually decrease its intensity to the point of turn off. Digital signals are often called “square wave” because they are either on or off. Many components on vehicles generate a digital signal. Common examples are Hall Effect sensors, CAN Bus signals, some newer WSS (wheel speed sensors), and any PWM (pulse width modulation) signals.
DIGITAL:
Digital scope signals are best described as an “on/off” display of the circuit turning on and off. There is no other dis-play other than ON and then OFF. In comparison, an analog signal can gradually rise to its highest point, then gradu-ally decrease its intensity to the point of turn off. Digital signals are often called “square wave” because they are either on or off. Many components on vehicles generate a digital signal. Common examples are Hall Effect sensors, CAN Bus signals, some newer WSS (wheel speed sensors), and any PWM (pulse width modulation) signals.
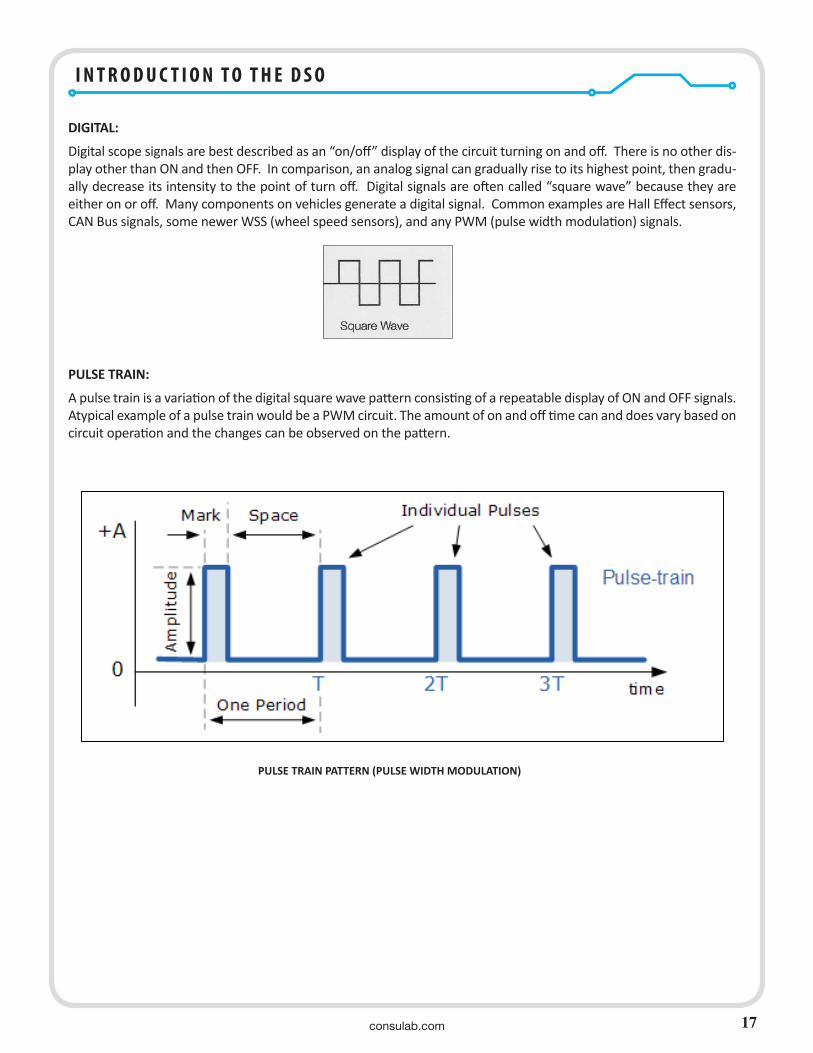
PULSE TRAIN:
A pulse train is a variation of the digital square wave pattern consisting of a repeatable display of ON and OFF signals. Atypical example of a pulse train would be a PWM circuit. The amount of on and off time can and does vary based on circuit operation and the changes can be observed on the pattern.
18
PULSE TRAIN:
A pulse train is a variation of the digital square wave pattern consisting of a repeatable display of ON and OFF signals. A typical example of a pulse train would be a PWM circuit. The amount of on and off time can and does vary based on circuit operation and the changes can be observed on the pattern.
SCOPE HOOKUP:
It is necessary to “hook up” the scope to a circuit in order to have it displayed on the screen. Think of doing this exactly like you hook up a voltmeter to a circuit. There is a positive and negative lead. The same is true with a scope. The “signal wire” is usually the positive test lead. The color of the test lead can be of many colors especially if the scope has multiple channels. In addition to the positive lead, there will be a ground test lead. This lead is connected to the ground circuit that you wish to reference from. A common location is the battery negative cable, but can also be the ground circuit for the device being tested. Most multi-channel scopes has only one ground lead on channel 1, and each other channel test leads will have only the positive. (Some scopes have dedicated grounds for each channels).
PULSE WIDTH MODULATION
INSERT SLIDES 76 THROUGH 87 HERE. PROBABLY 4 OR 6 PER PAGE AS LONG AS YOU CAN READ AND SEE THE SLIDE DETAIL.
PULSE TRAIN PATTERN (PULSE WIDTH MODULATION)

consulab.com
I N T R O D U C T I O N T O T H E D S O
18
AC SIGNALS (ANALOG)WITH PERMISSION
AC SIGNALS (ANALOG)WITH PERMISSION

consulab.com
I N T R O D U C T I O N T O T H E D S O
19
DC SIGNALS (DIGITAL)WITH PERMISSION
DC SIGNALS
WITH PERMISSION

consulab.com
I N T R O D U C T I O N T O T H E D S O
20
DC SIGNALS(DIGITAL)
WITH PERMISSION
WITH PERMISSION
DC SIGNALS (DIGITAL)
consulab.com
I N T R O D U C T I O N T O T H E D S O
21
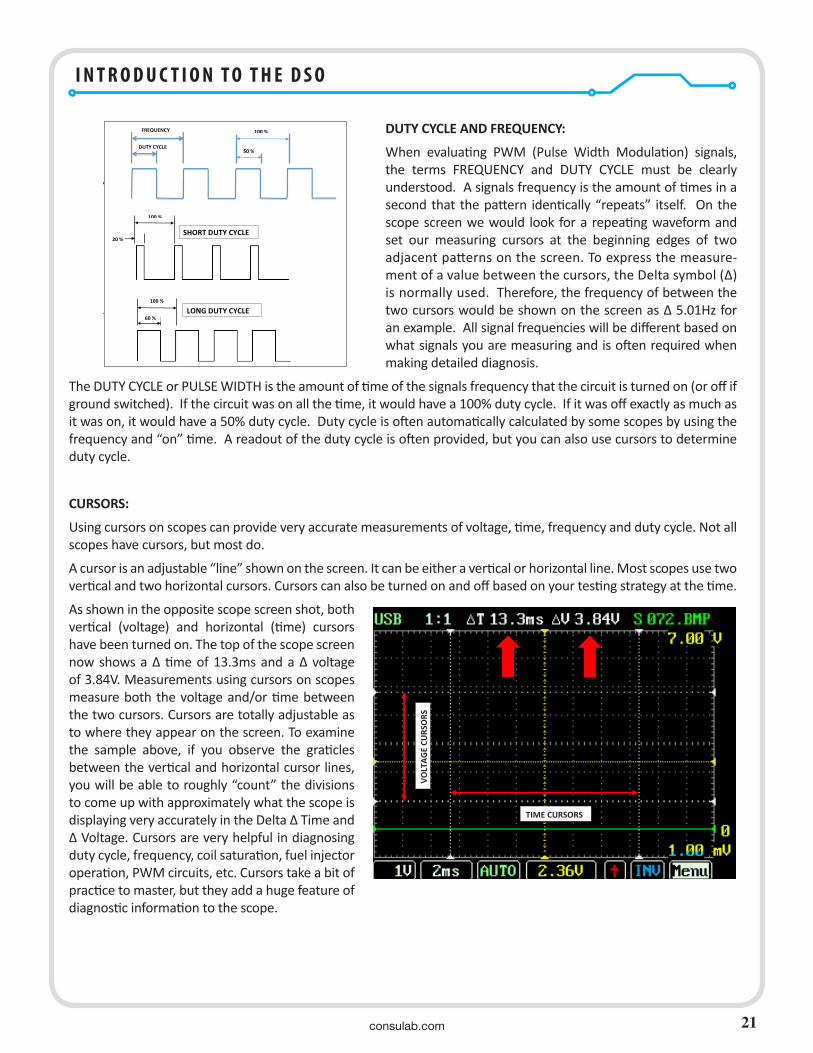
DUTY CYCLE AND FREQUENCY:
When evaluating PWM (Pulse Width Modulation) signals, the terms FREQUENCY and DUTY CYCLE must be clearly understood. A signals frequency is the amount of times in a second that the pattern identically “repeats” itself. On the scope screen we would look for a repeating waveform and set our measuring cursors at the beginning edges of two adjacent patterns on the screen. To express the measure-ment of a value between the cursors, the Delta symbol (∆) is normally used. Therefore, the frequency of between the two cursors would be shown on the screen as ∆ 5.01Hz for an example. All signal frequencies will be different based on what signals you are measuring and is often required when making detailed diagnosis.
The DUTY CYCLE or PULSE WIDTH is the amount of time of the signals frequency that the circuit is turned on (or off if ground switched). If the circuit was on all the time, it would have a 100% duty cycle. If it was off exactly as much as it was on, it would have a 50% duty cycle. Duty cycle is often automatically calculated by some scopes by using the frequency and “on” time. A readout of the duty cycle is often provided, but you can also use cursors to determine duty cycle.
CURSORS:
Using cursors on scopes can provide very accurate measurements of voltage, time, frequency and duty cycle. Not all scopes have cursors, but most do.
A cursor is an adjustable “line” shown on the screen. It can be either a vertical or horizontal line. Most scopes use two vertical and two horizontal cursors. Cursors can also be turned on and off based on your testing strategy at the time.
As shown in the opposite scope screen shot, both vertical (voltage) and horizontal (time) cursors have been turned on. The top of the scope screen now shows a Δ time of 13.3ms and a Δ voltage of 3.84V. Measurements using cursors on scopes measure both the voltage and/or time between the two cursors. Cursors are totally adjustable as to where they appear on the screen. To examine the sample above, if you observe the graticles between the vertical and horizontal cursor lines, you will be able to roughly “count” the divisions to come up with approximately what the scope is displaying very accurately in the Delta Δ Time and Δ Voltage. Cursors are very helpful in diagnosing duty cycle, frequency, coil saturation, fuel injector operation, PWM circuits, etc. Cursors take a bit of practice to master, but they add a huge feature of diagnostic information to the scope.
DRAWING#4INSERTONPAGE21ADDTHISTEXTJUSTBELOWTHEABOVEDRAWING:DUTYCYCLEANDFREQUENCY:WhenevaluatingPWM(PulseWidthModulation)signals,thetermsFREQUENCYandDUTYCYCLEmustbeclearlyunderstood.Asignalsfrequencyistheamountoftimesinasecondthatthepatternidentically“repeats”itself.Onthescopescreenwewouldlookforarepeatingwaveformandsetourmeasuringcursorsatthebeginningedgesoftwo
FREQUENCY
DUTYCYCLE
100%
50%
100%
20%
100%
60%
SHORTDUTYCYCLE
LONGDUTYCYCLE
CURSORS: Using cursors on scopes can provide very accurate measurements of voltage, time, frequency and duty cycle. Not all scopes have cursors, but most do. A cursor is an adjustable “line” shown on the screen. It can be either a vertical or horizontal line. Most scopes use two vertical and two horizontal cursors. Cursors can also be turned on and off based on your testing strategy at the time. As shown in the above scope screen shot, both vertical (voltage) and horizontal (time) cursors have been turned on. The top of the scope screen now shows a ∆ time of 13.3ms and a ∆ voltage of 3.84V. Measurements using cursors on scopes measure both the voltage and/or time between the two cursors. Cursors are totally adjustable as to where they appear on the screen. To examine the sample above, if you observe the graticles between the vertical and horizontal cursor lines, you will be able to roughly “count” the divisions to come up with approximately what the scope is displaying very accurately in the Delta ∆ Time and ∆ Voltage. Cursors are very helpful in diagnosing duty cycle, frequency, coil saturation, fuel injector operation, PWM circuits, etc. Cursors take a bit of practice to master, but they add a huge feature of diagnostic information to the scope.
TIME CURSORS
VOLT
AGE
CURS
ORS

consulab.com
I N T R O D U C T I O N T O T H E D S O
22
SCOPE HOOKUP:
It is necessary to “hook up” the scope to a circuit in order to have it displayed on the screen. Think of doing this ex-actly like you hook up a voltmeter to a circuit. There is a positive and negative lead. The same is true with a scope. The “signal wire” is usually the positive test lead. The color of the test lead can be of many colors especially if the scope has multiple channels. In addition to the positive lead, there will be a ground test lead. This lead is connected to the ground circuit that you wish to reference from. A common location is the battery negative cable, but can also be the ground circuit for the device being tested. Most multi-channel scopes has only one ground lead on channel 1, and each other channel test leads will have only the positive. (Some scopes have dedicated grounds for each channels).
CIRCUIT ACCESS:
Whenever using a scope, it is essential that you have an OEM level wiring diagram available to you. The schematic can identify the specific wire color and connecter view you need in order to properly access the desired signal. Some scopes have internal software that identifies this information and may also show you a picture of the connecter and wire access point.
There are various methods of accessing the circuit you wish to test. One of the most common methods is to use test “probes” which are small diameter pins that are designed to back probe the connector of the circuit. Other methods use common alligator clips to access signals. There is a wide assortment of scope leads available depending on the type of signal being tested.
ITEM#1
UNDERSTANDINGTIME/DIVNUMBERSETTINGS(10horizontalgriddesign)TIMEPERDIVISION MAXIMUMTOTALTIMEDISPLAYED
50ns(nanosecond)(fastest) 500ns.1us(microsecond) 1us.2us(microsecond) 2us.5us(microsecond) 5us1us(microsecond) 10us2us(microsecond) 20us5us(microsecond) 50us10us(microsecond) 100us20us(microsecond) 200us50us(microsecond) 500us.1ms(millisecond) 1ms.2ms(millisecond) 2ms.5ms(millisecond) 5ms1ms(millisecond) 10ms2ms(millisecond) 20ms5ms(millisecond) 50ms10ms(millisecond) 100ms20ms(millisecond) 200ms50ms(millisecond) 500ms.1Sec(Second) 1sec..2Sec(Second) 2sec..5Sec(Second) 5sec.1Sec 10sec.2Sec 20sec.5Sec 50sec.10Sec 100sec.20Sec 200sec.50Sec(slowest) 500sec.
ITEM#2(5PICTURES)ITEM#3(3PICTURES)ITEM#4(3PICTURES)
ITEM#2(5PICTURES)ITEM#3(3PICTURES)ITEM#4(3PICTURES)

consulab.com
I N T R O D U C T I O N T O T H E D S O
23
ITEM#2(5PICTURES)ITEM#3(3PICTURES)ITEM#4(3PICTURES)
ITEM#2(5PICTURES)ITEM#3(3PICTURES)ITEM#4(3PICTURES)
ITEM#2(5PICTURES)ITEM#3(3PICTURES)ITEM#4(3PICTURES)
AMP PROBES:
Oscilloscopes can also measure amperage by using the same devices that make a DMM into an inductive ammeter. Amp probes are available in micro, low and high amp versions. They basically are inductive devices that convert the strength of the magnetic field surrounding a current carrying wire into a small voltage. This voltage is then displayed on the screen and the screen graticles are scaled in amps instead of volts. The correct amp probe can be used for all things from checking parasitic draw to starter cranking amps. The scope must be capable of having amp probes connected to it for proper operation. Amperage testing is a very important element in the diagnosis of today’s au-tomobiles.
INDUCTIVE PROBES:
Although inductive probes are similar to amp probes, they perform different functions. Inductive probes for scopes can be used for triggers on spark plug wires, or a pickup to obtain primary ignition patterns on COP (coil-on-plug) ignition systems. Inductive probes are connected to the scope the same way the test leads are.
TRANSDUCERS:
Transducers are devices made to allow the scope to accurately measure other things besides voltage. Although, somewhat expensive, transducers are now available that gives your scope the ability to measure with high accuracy such things as Vacuum, Pressure (low and high), Temperature, Noise Vibrations and many other things.
ITEM#2(5PICTURES)ITEM#3(3PICTURES)ITEM#4(3PICTURES)
ITEM#2(5PICTURES)ITEM#3(3PICTURES)ITEM#4(3PICTURES)
ITEM#2(5PICTURES)ITEM#3(3PICTURES)ITEM#4(3PICTURES)
ITEM#5(1PICTURE)
TRANSDUCERKIT
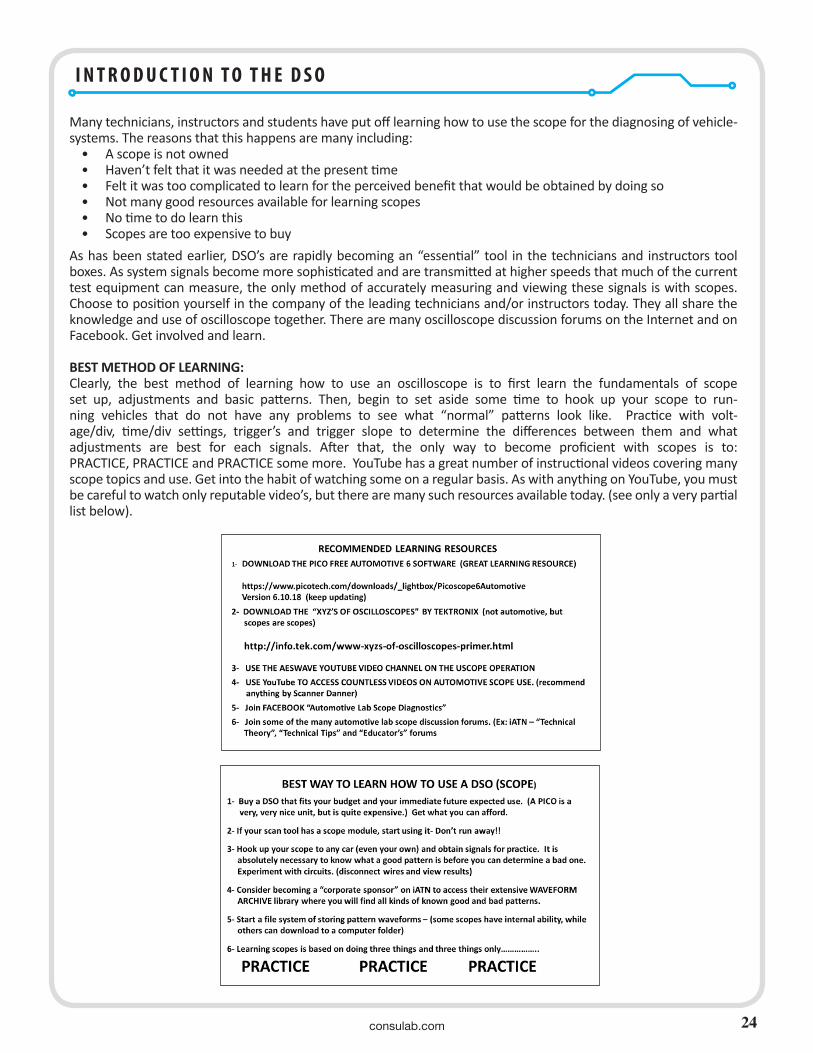
consulab.com
I N T R O D U C T I O N T O T H E D S O
24
Many technicians, instructors and students have put off learning how to use the scope for the diagnosing of vehicle-systems. The reasons that this happens are many including:
• A scope is not owned• Haven’t felt that it was needed at the present time• Felt it was too complicated to learn for the perceived benefit that would be obtained by doing so• Not many good resources available for learning scopes• No time to do learn this• Scopes are too expensive to buy
As has been stated earlier, DSO’s are rapidly becoming an “essential” tool in the technicians and instructors tool boxes. As system signals become more sophisticated and are transmitted at higher speeds that much of the current test equipment can measure, the only method of accurately measuring and viewing these signals is with scopes. Choose to position yourself in the company of the leading technicians and/or instructors today. They all share the knowledge and use of oscilloscope together. There are many oscilloscope discussion forums on the Internet and on Facebook. Get involved and learn.
BEST METHOD OF LEARNING:Clearly, the best method of learning how to use an oscilloscope is to first learn the fundamentals of scope set up, adjustments and basic patterns. Then, begin to set aside some time to hook up your scope to run-ning vehicles that do not have any problems to see what “normal” patterns look like. Practice with volt-age/div, time/div settings, trigger’s and trigger slope to determine the differences between them and what adjustments are best for each signals. After that, the only way to become proficient with scopes is to: PRACTICE, PRACTICE and PRACTICE some more. YouTube has a great number of instructional videos covering many scope topics and use. Get into the habit of watching some on a regular basis. As with anything on YouTube, you must be careful to watch only reputable video’s, but there are many such resources available today. (see only a very partial list below).

consulab.com
I N T R O D U C T I O N T O T H E D S O
25

consulab.com
I N T R O D U C T I O N T O T H E D S O
26
G" Jerry TrugliaA.T.T.S.10 Lupi PlazaMahopac, New York 10541845-628-1062FAX 845-628-9109EMAIL – [email protected]
www.attstraining.com
THIS BOOK IS FOR SALE FROM ATTS TRAINING FOR $59.95 EACH

consulab.com
I N T R O D U C T I O N T O T H E D S O
27
SCOPE VIDEO LINKShttps://www.youtube.com/watch?v=R9iY8D_Lxus Measuring voltage on an oscilloscope using cursors. — 5.16 minhttps://www.youtube.com/watch?v=1igSgwtFzxA Measure time on an oscilloscope using cursors. — 4.49 minhttps://www.youtube.com/watch?v=AcJp-ktx0ec Understanding basic oscilloscope triggers Level 1 — 2.34 minhttps://www.youtube.com/watch?v=sWdrQzgzRwg Measuring voltage using cursors on a scope. # 1 — 3.51 minhttps://www.youtube.com/watch?v=y7cljLyc-94 Measuring voltage using cursors on a scope. # 2 — 3.03 minhttps://www.youtube.com/watch?v=2LKD0qlwWjk Setting time and voltage on an oscilloscope. — 3.23 minhttps://www.youtube.com/watch?v=DB-XdBNwcc8 Using cursors to measure frequency on a scope. — 6.53 minhttps://www.youtube.com/watch?v=iVclMxUWJ20 Introduction to the AES Wave UScope — 16.00 minhttps://www.youtube.com/watch?v=bitDC4YgtX0 Using cursors to measure AC voltage on a scope. — 3.36 minhttps://www.youtube.com/watch?v=bmIEbnglVj0 Using a pressure transducer to measure compression (Motor Age – Pete Meier) — 24.34 minhttps://www.youtube.com/watch?v=Kwy72aaAFvo Understanding compression waveforms. — 6.51 minhttps://www.youtube.com/watch?v=kO91s0CoM_4 Testing for exhaust restriction and plugged converters using a scope (Scanner Danner). — 29.26 minhttps://www.youtube.com/watch?v=81AGbZcgCZs PICO Scope Basics (Scanner Danner). — 39.58 minhttps://www.youtube.com/watch?v=Nq-54h7z9uU How to test a COP ignition system (4-wire) (Scanner Danner). — 42.08 minhttps://www.youtube.com/watch?v=y4r5OcHN5Lg Ford COP ignition testing (Scanner Danner). — 34.19 minhttps://www.youtube.com/watch?v=yCchGNQEMdE Ignition Waveform Diagnosis (Jim Morton). — 92.14 minhttps://www.youtube.com/watch?v=SUShO72Grq8 Secondary Ignition Waveform Diagnosis (Scanner Danner). — 11.29 minhttps://www.youtube.com/watch?v=MGaHaIXZioA Alternator Diode Testing with a scope (Scanner Danner). — 8.23 minhttps://www.youtube.com/watch?v=WKdZsWU2ZmI Doing a compression test with an oscilloscope (Scanner Danner). — 12.57 min

consulab.com
I N T R O D U C T I O N T O T H E D S O
28consulab.com 28
SCOPE VIDEO LINKShttps://www.youtube.com/watch?v=Iq27aO-zfgs Compression Testing w/oscilloscope Variables (2005 Buick LaCrosse) (Scanner Danner). — 28.47 minhttps://www.youtube.com/watch?v=5XlrOr7tNqw ADP Reading and Analyzing Waveform Patterns — 48.02 minhttps://www.youtube.com/user/ScannerDanner Introduction to Scanner Danners YouTube channel contents — 1.42 minhttps://www.youtube.com/channel/UCs2NZ_wQFDFvV0QOhoZgASA Introduction to Scanner Danners YouTube Premium channel contents — 1.56 minhttps://www.youtube.com/watch?v=txk6livWp28 Jim Morton’s YouTube video on “G’s and P’s” — about 4 hours long
Search YouTube for lots of related oscilloscope instructional video’s by:
Scanner Danner – Jim Morton – PICO Scope – Tons of other resources
Go to www.youtube.com, then, search for “AES Wave uscope”. You will find over 25 videos on this product.
Go to www.youtube.com, then, search for “Basic oscilloscope operation”. You will find hun-dreds of video’s with some valuable titles and many, either to complex or advanced to not having much to do with automotive applications. Remember, the basics of an oscilloscope are the same regardless of whether you are talking about a lab scope or an automotive scope.
4210 rue Jean-MarchandQuebec City, QC G2C 1Y6 Canada
Phone: 1-800-567-0791 (Canada & USA)810-222-4525 (USA)
418-688-9067 (Canada)Fax: 418-843-3444
Email: info@consulabInternet: www.consulab.com