introduction to the modeling of marine ecosystemsmagan/amce6082010/lecture13short.pdf ·...
TRANSCRIPT
Introduction to the modeling of marine ecosystems

Why Interdisciplinary Study?
The physical processes in the ocean regulate, for example, nutrients availability and many organisms distributions which cannot be described by biology alone.
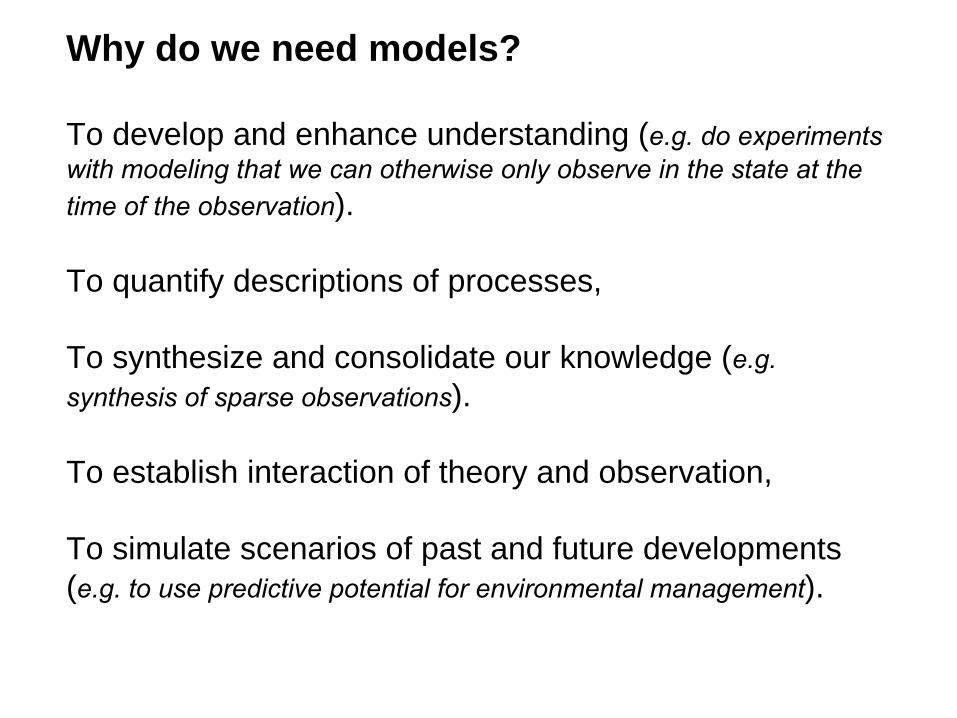
Why do we need models?
To develop and enhance understanding (e.g. do experiments with modeling that we can otherwise only observe in the state at
the time of the observation).
To quantify descriptions of processes,
To synthesize and consolidate our knowledge (e.g. synthesis of sparse observations).
To establish interaction of theory and observation,
To simulate scenarios of past and future developments (e.g. to use predictive potential for environmental management).

Concepts of Coupled Modeling of Biological and Physical Oceanography
Physical Model Biological Model
Sets of differential equations which describe the motion of ocean+ numerical implementation to solve these equations in computer
Synonymously for theoretical descriptions in term of sets of equations which describe the food web dynamics of marine systems + numerical implementation to solve these equations in computer
+
+
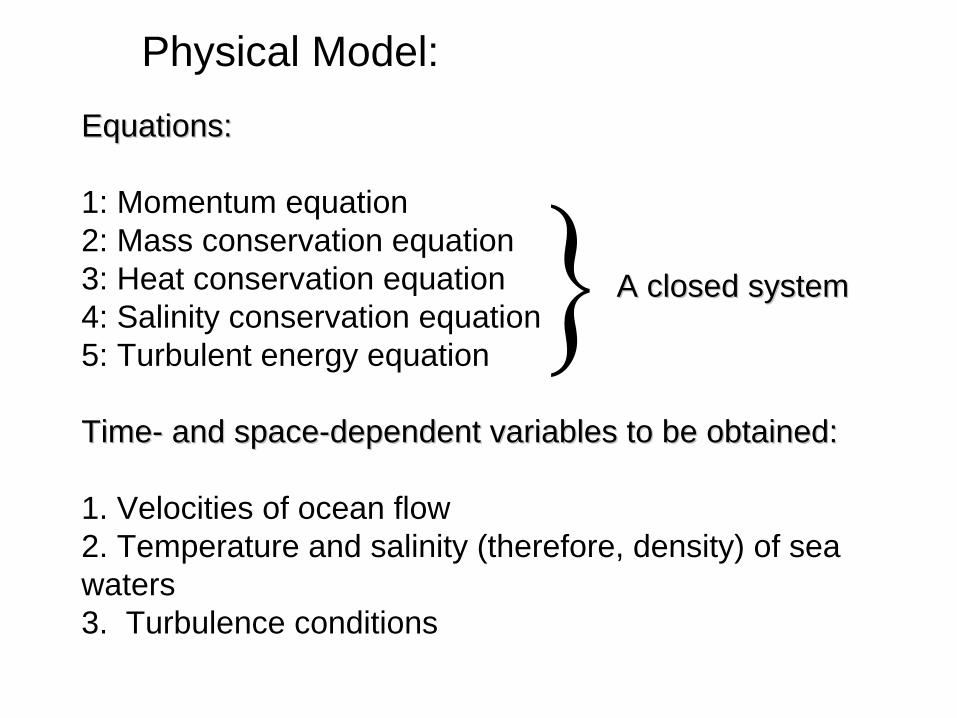
Physical Model:
Equations:Equations:
1: Momentum equation2: Mass conservation equation3: Heat conservation equation4: Salinity conservation equation5: Turbulent energy equation
TimeTime-- and spaceand space--dependent variables to be obtained:dependent variables to be obtained:
1. Velocities of ocean flow2. Temperature and salinity (therefore, density) of sea waters3. Turbulence conditions
A closed systemA closed system
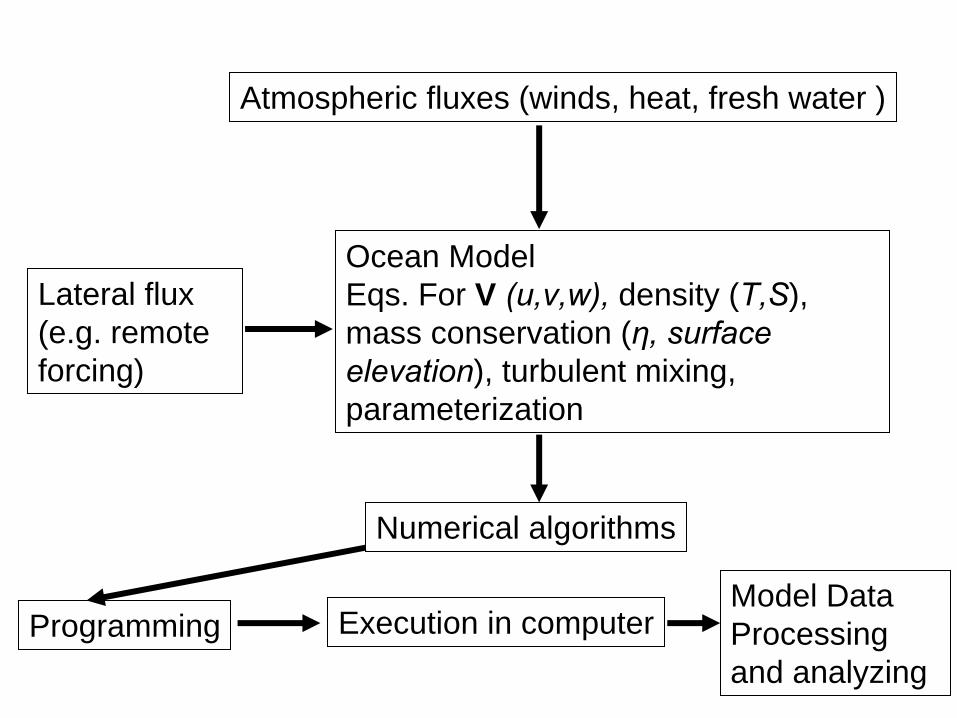
Ocean ModelEqs. For V (u,v,w),
density (T,S),
mass conservation (η, surface elevation), turbulent mixing,parameterization
Atmospheric fluxes (winds, heat, fresh water )
Numerical algorithms
Lateral flux (e.g. remote forcing)
Programming Execution in computerModel Data Processing and analyzing

Biological Model:
Equations (Simple Model, Equations (Simple Model, e.g. NPZD):e.g. NPZD):
1: Equation of nutrients2: Equation of phytoplankton3: Equation of zooplankton4: Equation of detritus
TimeTime-- and spaceand space--dependent variables to be obtained:dependent variables to be obtained:
1. Nutrients concentration2. Phytoplankton concentration3. Zooplankton concentration4. Detritus concentration
A closed system which contains pathways of chemical biological processes from different trophic
levels to
nutrients through respiration, excretion and dead organic material.
Model should be as simple as possible and as complex as necessary to answer specific questions.

Chemical Biological-Models
• To describe, understand and quantify fluxes of biochemical process through food web and interactions with the atmosphere and sediments.
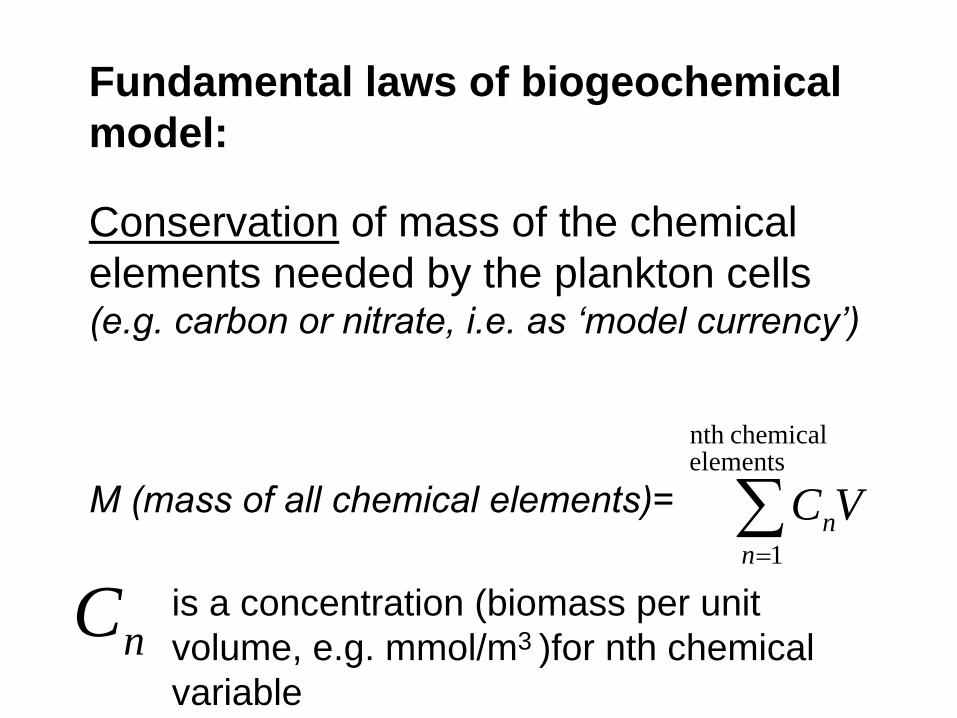
Fundamental laws of biogeochemical model:
Conservation of mass of the chemical elements needed by the plankton cells (e.g. carbon or nitrate, i.e. as ‘model currency’)
M (mass of all chemical elements)= ∑=
elements chemicalnth
1nnVC
nC is a concentration (biomass per unit volume, e.g. mmol/m3 )for nth chemical variable
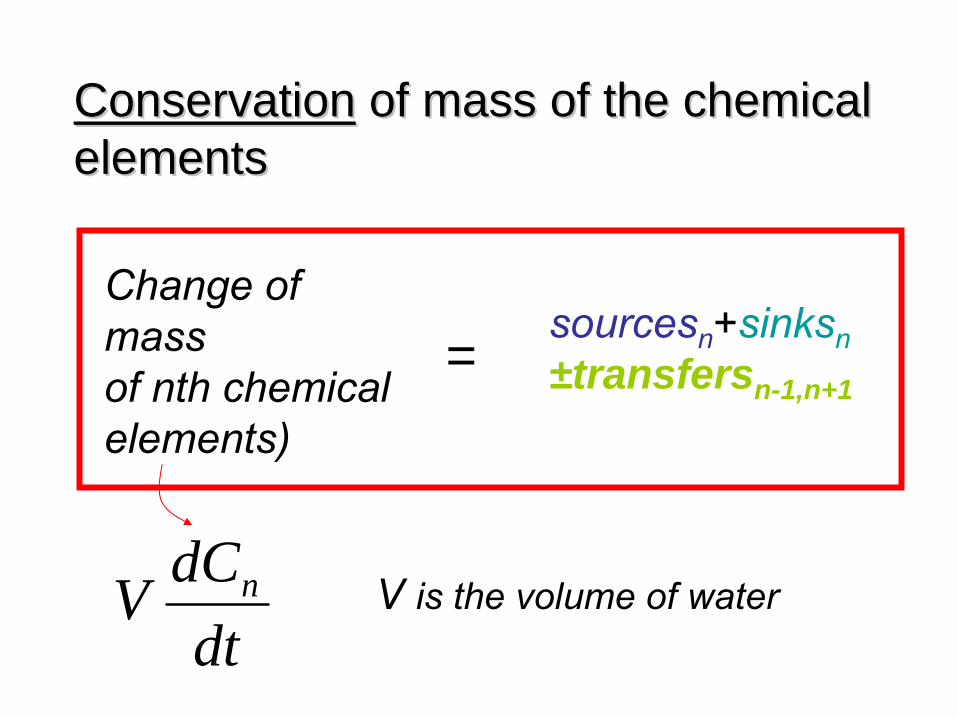
Change of mass of nth chemical elements)
ConservationConservation of mass of the chemical of mass of the chemical elementselements
=
dtdCV n
sourcesn
+sinksn±transfersn-1,n+1
V is the volume of water
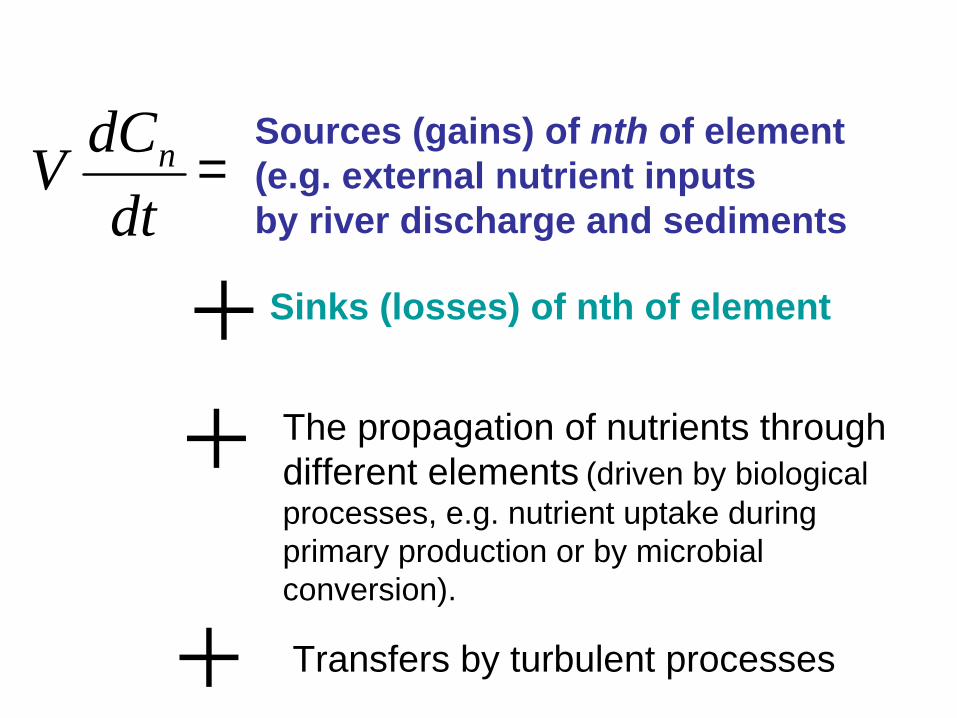
dtdCV n =Sources (gains) of nth of element
(e.g. external nutrient inputsby river discharge and sediments
Sinks (losses) of nth of element++ The propagation of nutrients through
different elements (driven by biological processes, e.g. nutrient uptake during primary production or by microbial conversion).
+ Transfers by turbulent processes

dtdCV n =Local change of VCn + advection
of VCn by oceanic current
i.e. Cn can be predicted
Example: Let C1=S, C2=P and
S P
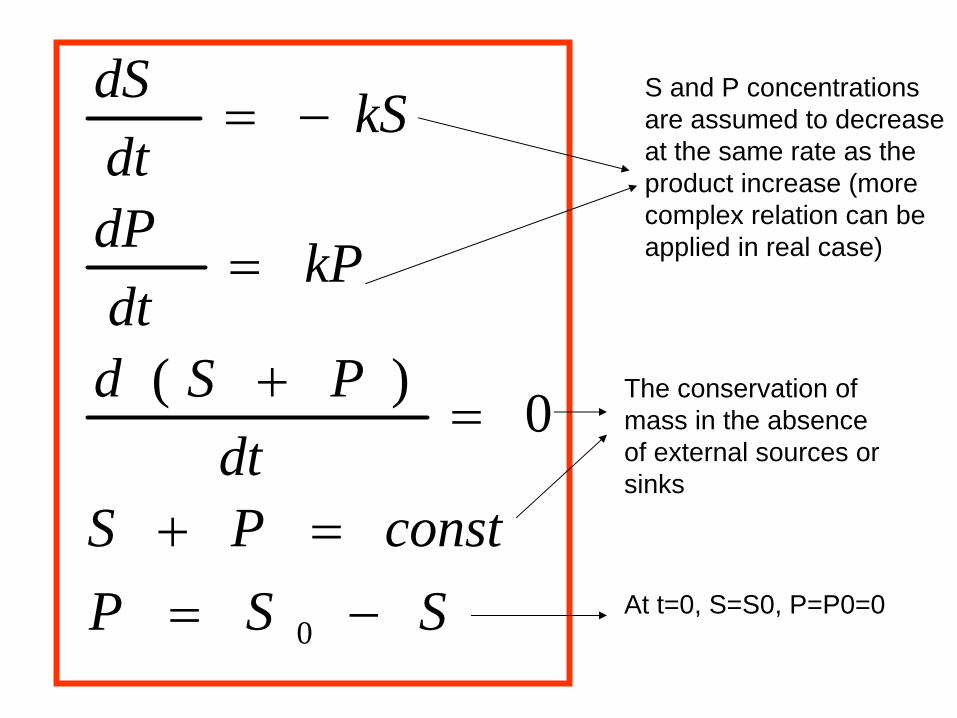
SSPconstPS
dtPSd
kPdtdP
kSdtdS
−==+
=+
=
−=
0
0)( The conservation of mass in the absence of external sources or sinks
S and P concentrations are assumed to decrease at the same rate as the product increase (more complex relation can be applied in real case)
At t=0, S=S0, P=P0=0
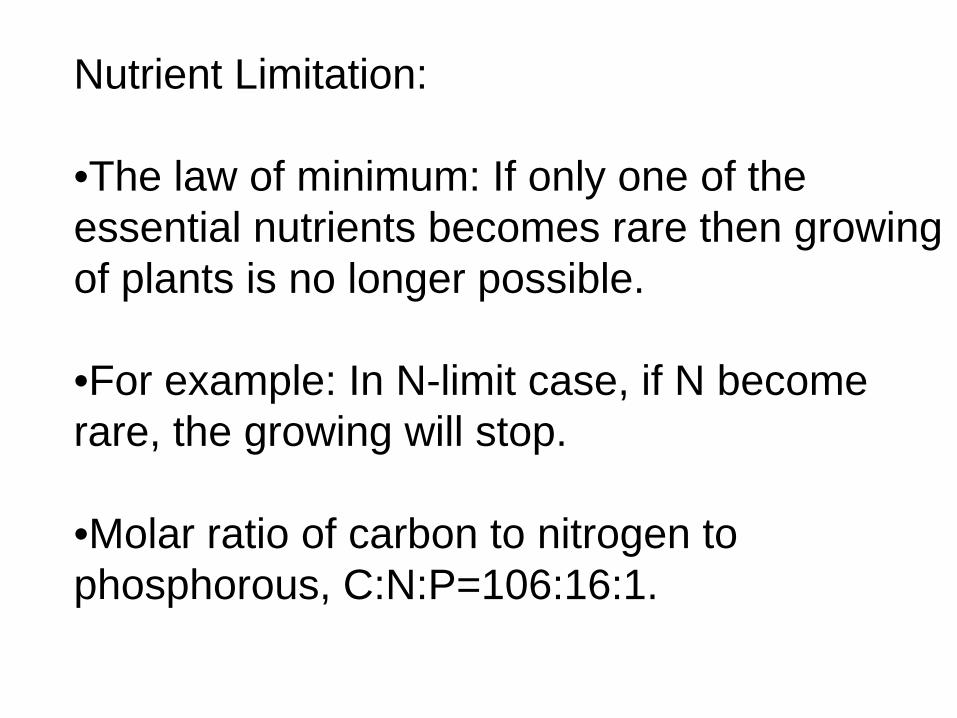
Nutrient Limitation:
•The law of minimum: If only one of the essential nutrients becomes rare then growing of plants is no longer possible.
•For example: In N-limit case, if N become rare, the growing will stop.
•Molar ratio of carbon to nitrogen to phosphorous, C:N:P=106:16:1.

•In the modeling, we can focus on only those one or two nutrients which are exhausted first and hence are limiting the further biomass development.

Nutrients control the rate of phytoplankton:Nutrients control the rate of phytoplankton:
N: a nutrient concentration (dissolved inorganicnitrogen)P: phytoplankton biomass concentration
PNfrdtdP )(max=
k
maxr : the maximum rate, which constitutes intrinsic cell properties at given light and temperature;
uptake functionf(N):
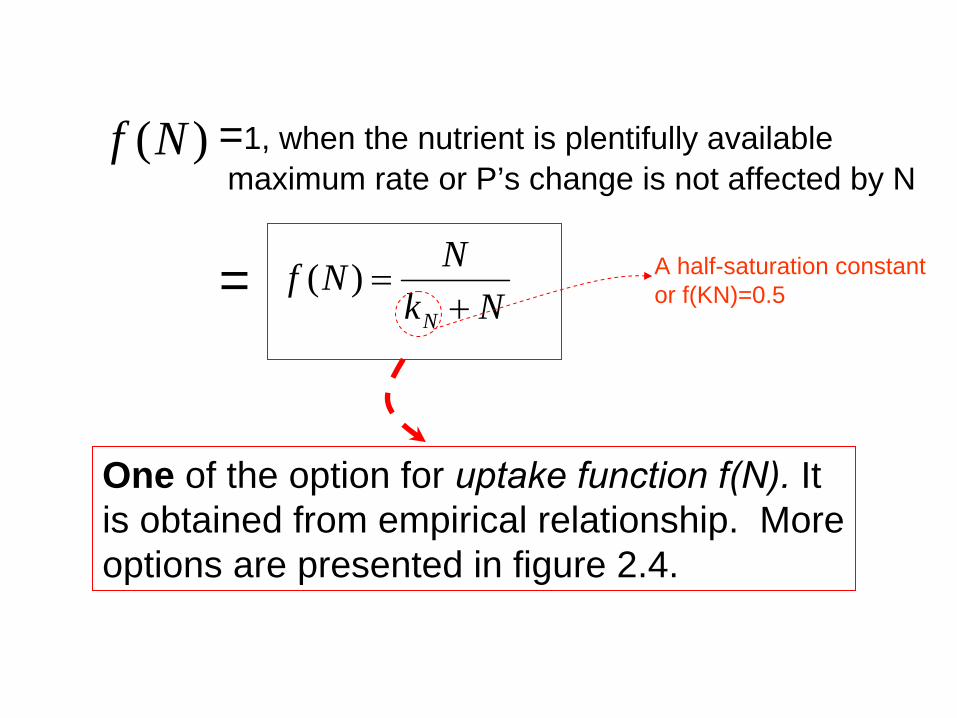
)(Nf =1, when the nutrient is plentifully availablemaximum rate or P’s change is not affected by N
NkNNf
N +=)(
=One of the option for uptake function
f(N).
It
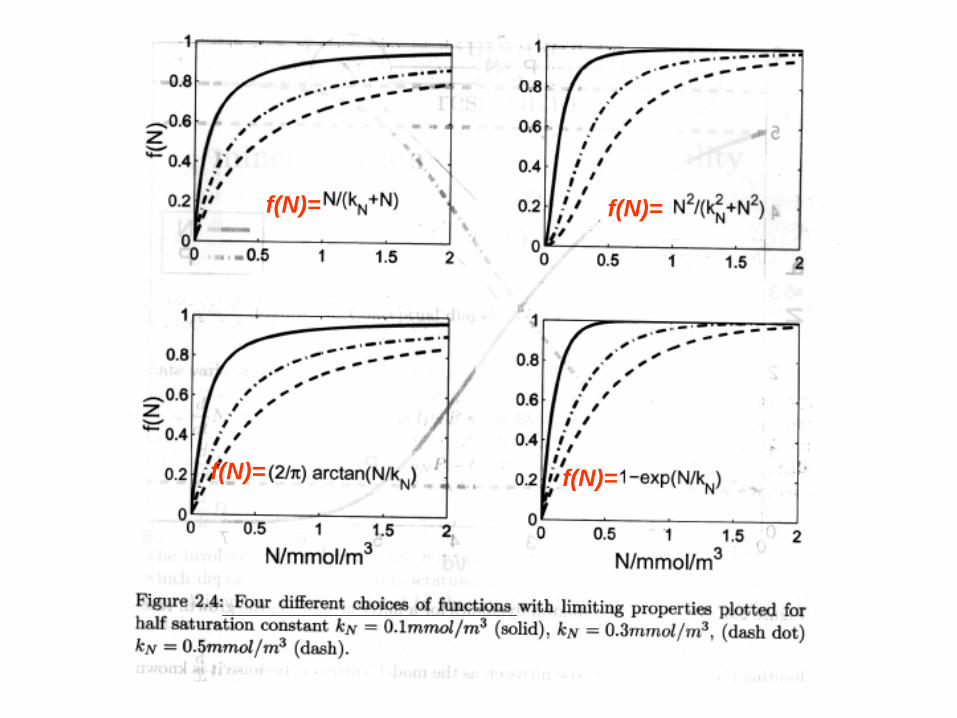
is obtained from empirical relationship. More options are presented in figure 2.4.
A half-saturation constantor f(KN)=0.5
f(N)= f(N)=
f(N)= f(N)=
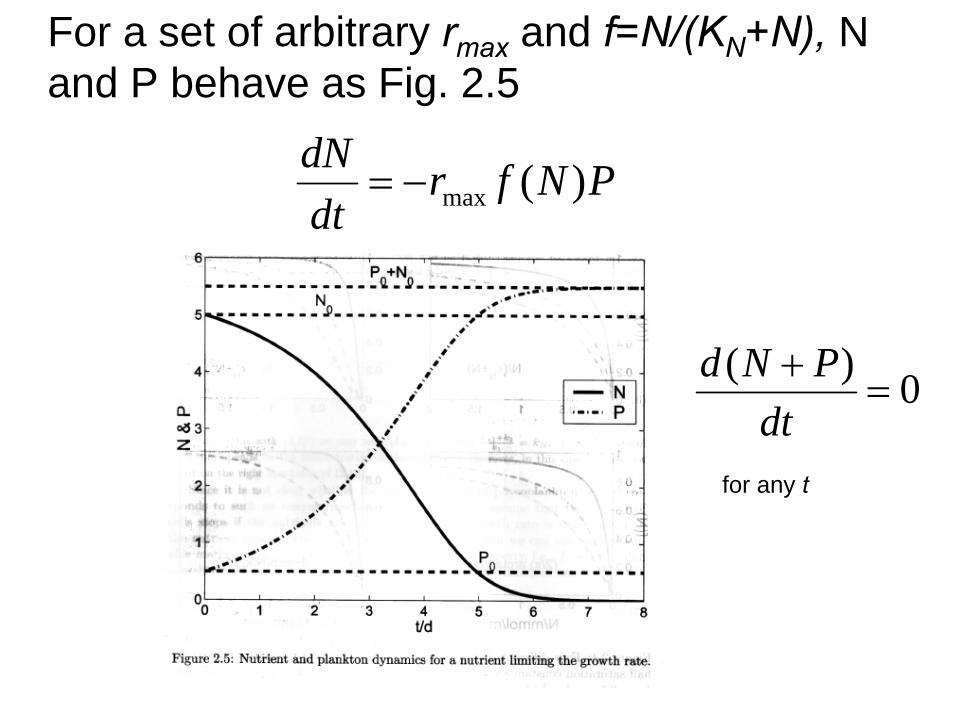
PNfrdtdN )(max−=
For a set of arbitrary rmax
and f=N/(KN
+N), N and P behave as Fig. 2.5
0)(=
+dt
PNd
for any t

Recycling: Recycling: Phytoplankton back to nutrients.
Two pathways:Two pathways:1: fast direct release of nutrients through respiration and extra-cellular release.2: slow mineralization (microbial conversion) of dead cells.
The 2 will require taking into account a new variable, the detritus, and form a NPD- model.
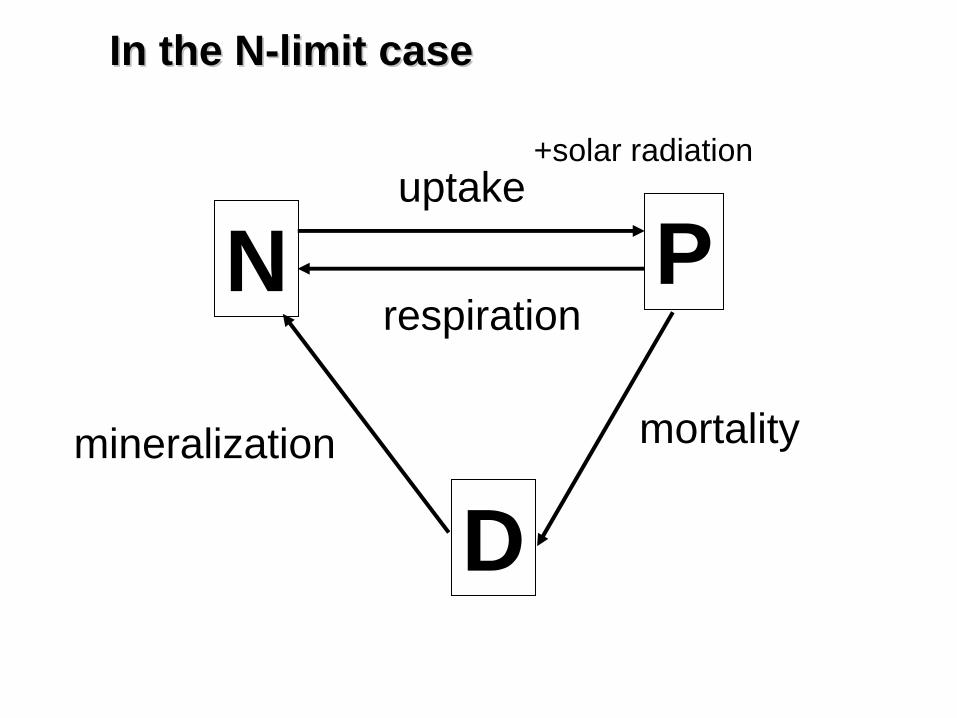
In the NIn the N--limit caselimit case
N P
D
uptake
respiration
mortalitymineralization
+solar radiation

DlPldtdD
PlPlNfrdtdP
DlPlNfrdtdN
DNPD
PDNP
DNPN
−=
−−=
++−=
)(
)(
max
max
rmax is depends on light and temperature lPN
: loss by respirationlPD
: mortalitylDN : Mineralization

0)(=
++dt
DPNd
DlPlPlPlPNfr
DlPlPNfr
DNPD
PDNP
DNPN
−=−−=++−=
0)(0
)(0
max
max
Conservation of mass is fulfilled
For a steady state, i.e. N, P and D do not vary with time, then

From steady state equations, it can be found an equilibrium among N, P and D can be reached for certain nutrient level
NkNNf
llrllkN
N
PDPN
PDPNN
+=
−−+
=
)(
whenmax
*

nutrients phytoplankton
detrius
Sensitivity of N, P and D to different choices of the rate-parameters, l
•The time to steady state ratios of P/D=lDN
/lPD
.•The time scale at which the steady state is reached depends on the mineralization rate, lDN, which corresponds to the longest pathway in the mode cycle.
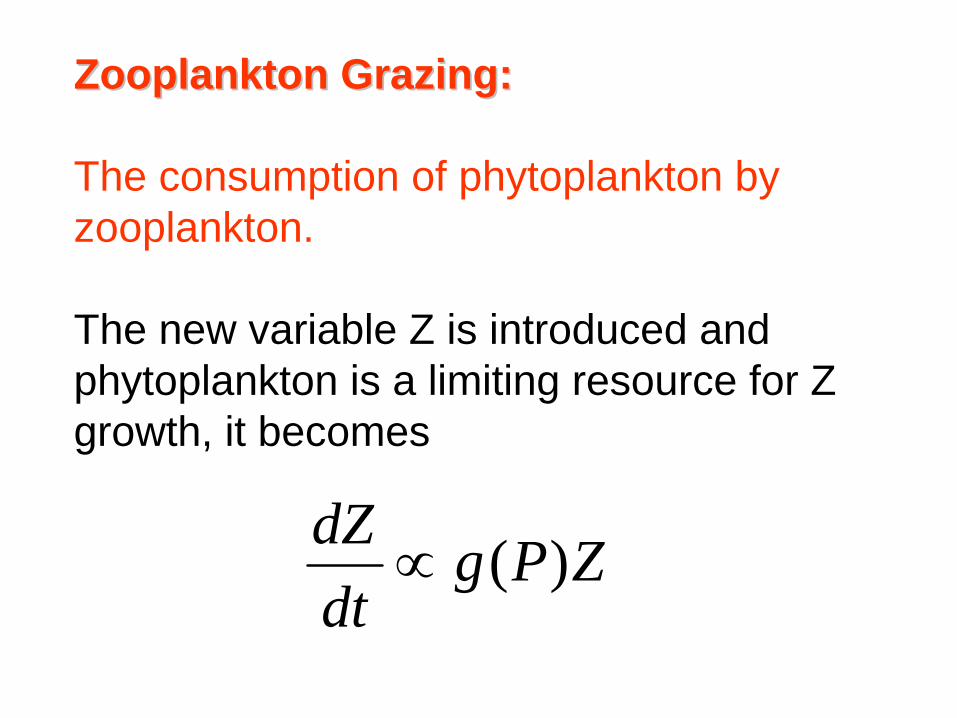
Zooplankton Grazing: Zooplankton Grazing:
The consumption of phytoplankton by zooplankton.
The new variable Z is introduced and phytoplankton is a limiting resource for Z growth, it becomes
ZPgdtdZ )(∝
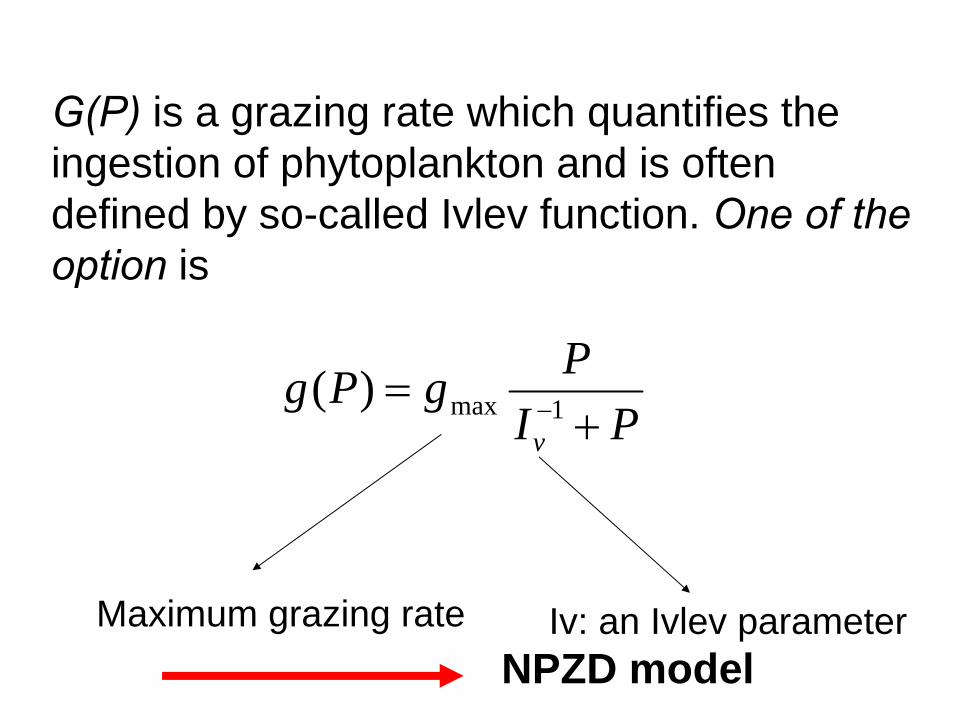
G(P)
is a grazing rate which quantifies the ingestion of phytoplankton and is often defined by so-called Ivlev function. One of the option
is
PIPgPg
v += −1max)(
Maximum grazing rate Iv: an Ivlev parameterNPZD model

In the NIn the N--limit four component modellimit four component model
N P
D
uptake
respiration
mortality
mineralization
+solar radiation
Z
grazing
A simple NPZD-Model:

ZllZPgdtdZ
ZlDlPldtdD
ZPgPlPlPNfrdtdP
ZlDlPlPNfrdtdN
ZNZD
ZDDNPD
PDNP
ZNDNPN
)()(
)()(
)(
max
max
+−=
+−=
−−−=
+++−=

In the N (Nitrate)In the N (Nitrate)--limit five component modellimit five component model
N P
D
uptake
respiration
mortality
nitrification
Z
grazing
A simple NNPZD-Model:
NH4remineralization
regeneration prod.
metabolism

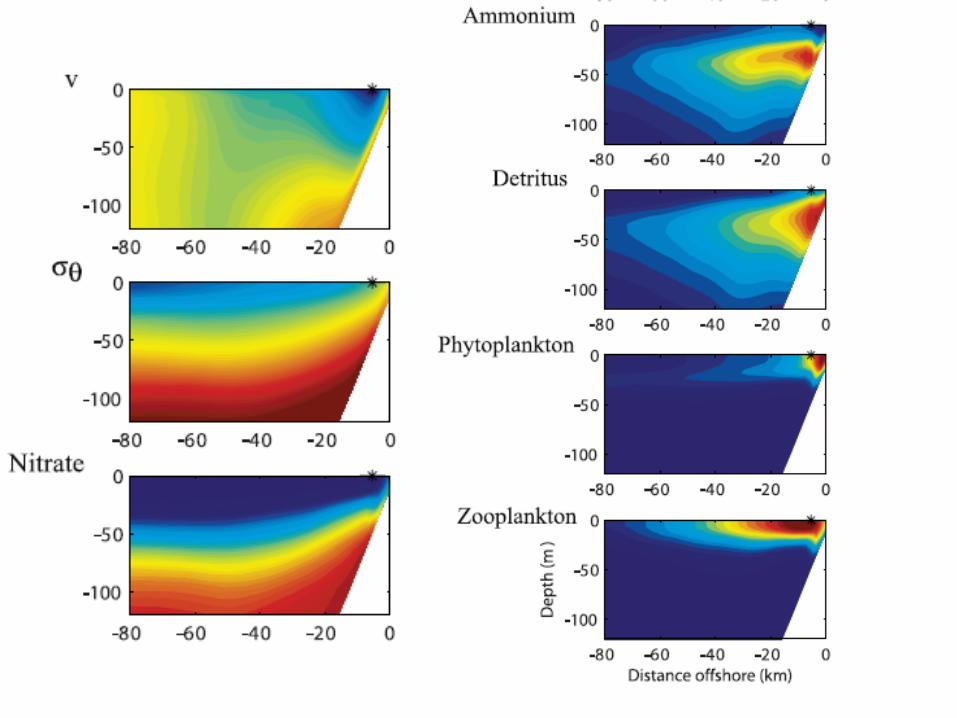
Oregon example (NNPZD): Response to upwelling flow
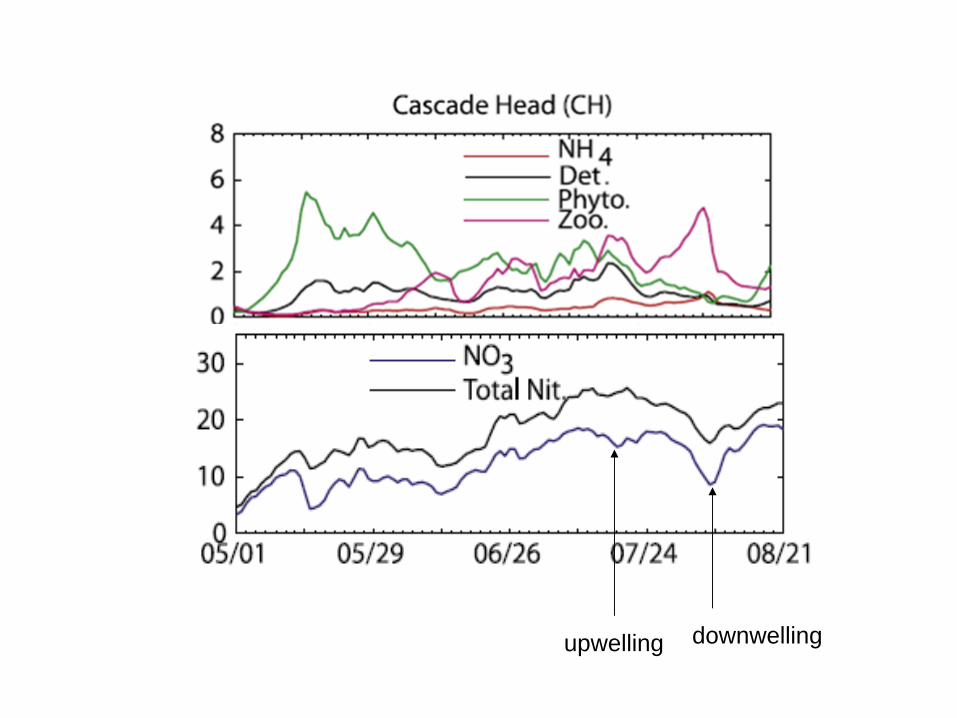
upwelling downwelling
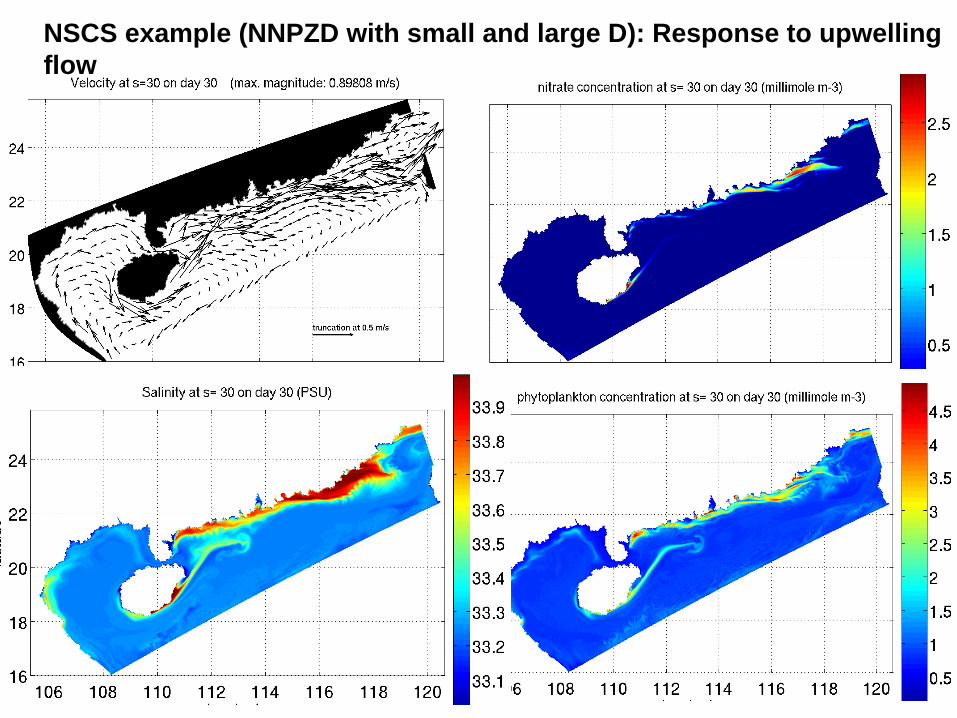
NSCS example (NNPZD with small and large D): Response to upwelling flow


Zooplankton>1 mmol m-3
Phytoplankton>2 mmol m-3
NO3 >4 mmol Nm-3