introduction to the real sector - imf · introduction to the real sector overview jan gottschalk...
TRANSCRIPT

1
Introduction to the Introduction to the Real SectorReal Sector
OverviewJan Gottschalk
TAOLAM
This training material is the property of the IMF – Singapore Regional Training Institute (STI) and is intended for the use in STI courses. Any reuse requires the permission of the STI. This training activity is funded with grants from Japan.
I. GDP
OverviewOverview
II. InflationIII. Nominal vs. RealIV. Forecasting GDP
1. Forecasting Real GDP2. Forecasting Inflation3 GDP D fl t3. GDP Deflator4. Putting It Together: Nominal GDP Forecasts

2
I. GDP I. GDP
Measure of output
Why Is GDP so Important?
• Measure of output• Approximation of welfare• Many other variables are moving broadly
proportional to GDP (e.g., revenues) GDP ratios GDP forecast is basis for revenue forecasts etc.M i k i GDP hl• Macroeconomic management: keeping GDP roughly in line with its potential

3
Gross output: value of all goods produced in the economy (double counting; example of wheat used in
What is GDP and How Do We Measure It?
economy (double counting; example of wheat used in production of bread)
Value added (VA): gross output minus intermediate consumption (eliminates double counting)
Gross Domestic Product (GDP): sum of value added across all sectors of the economy. Measures the value of final goods and services
Consumption: can be intermediate (inputs into production) and final (goods and services used byproduction) and final (goods and services used by households and government sector)
Gross investment (also called gross capital formation): additions to the physical stock of capital in the economy, such as building of machinery, facilities
Goods and services (real flo
Estimate of GDP
Production ApproachMoney (financial flow) ( sectoral "value added") Money (financial flow) ( sectoral value added )
"Goods Market" Expenditure Approach ( Y = C + I + X - M )
HOUSEHOLDS PRODUCERS
"Factors Market"
NON-RESIDENTS
Income Approach (Y = wages + OS+TSP)
Wages (financial flow)
OS=gross operating surpluses of enterprises (including profits, rents, interests)
Labor (real flow) TSP=taxes less subsidies

4
Production Approach: GDP SharesProduction Approach: GDP SharesComposition of GDP in Lao PDR (% of GDP, Constant 2002 Prices)
10%15%20%25%30%35%40%45%
AgricultureIndustryServicesNet taxes
0%5%
10%
2002
2003
2004
2005
2006
2007
2008
2009
2010
2011
2012
Net taxes
Evolution of Value-Added in Industry SectorComposition of Industry Value-Added (% of GDP, 2002 Prices)
15%20%25%30%35%40%45%50%
ConstructionGas, electricity, waterMining and quarrying
0%5%
10%15%
2002
2003
2004
2005
2006
2007
2008
2009
2010
2011
2012
Manufacturing

5
GDP Growth Rates – Production Approach60.0%
20.0%
30.0%
40.0%
50.0% Agriculture
Industry (excl. mining & gas, elec, water)
Mining & gas, electricity, water
Services
0.0%
10.0%
2003
2004
2005
2006
2007
2008
2009
2010
2011
2012
Net taxes
GDP
GDP Growth Contributions – Production Approach
9 0%
10.0%
3 0%
4.0%
5.0%
6.0%
7.0%
8.0%
9.0%
Mining & gas, electricity, waterNet taxes
Agriculture
Industry (excl mining &
0.0%
1.0%
2.0%
3.0%
2003
2004
2005
2006
2007
2008
2009
2010
2011
2012
Industry (excl. mining & gas, elec, water)Services

6
Absorption (A) Final Consumption (C) +
GDP from the Expenditure Side
Absorption (A) = Final Consumption (C) + Investment (I): A = C + I
Net Exports (X-M)X = Exports of goods and servicesM = Imports of goods and servicespo ts o goods a d se ces
GDP = A + X – MDomestic Demand Foreign Demand
Final consumption (C)Households: food, electricity, cars, mobile phones,
GDP from the Expenditure Side—Examples:
, y, , p ,etc.Government: ‘goods & services’ in recurrent budget both imported & locally produced goods Investment (I)
Machines, equipment both imported & locally produced goods
Exports (X)electricity mineral commodities (gold copper)electricity, mineral commodities (gold, copper), garments, wood products etc. Imports (M)
Cars, mobile phones, machines, equipment (see above)

7
Expenditure Approach: GDP SharesExpenditure Approach: GDP SharesComposition of GDP in Lao PDR (% of GDP, Constant 2002 Prices)
30%40%50%60%70%80%90%
-5%0%5%
10%15%20%25%30%
Public consumption
Private investment
Public investment
Resource balance (X-M)
0%10%20%
-20%-15%-10%
20022003200420052006200720082009201020112012
Resource balance (X-M)
Private consumption (right axis)
GDP Growth Rates – Expenditure Approach200%
60%
70%
P i i
0%
50%
100%
150%
0%
10%
20%
30%
40%
50%Private consumption
Public consumption
Private investment
Public investment
-100%
-50%
-30%
-20%
-10%
2003
2004
2005
2006
2007
2008
2009
2010
2011
2012
Resource balance (X-M) [right axis]
GDP

8
GDP Growth Contributions – Expenditure Approach20.0%
R b l (X M)
5 0%
0.0%
5.0%
10.0%
15.0% Resource balance (X-M) [right axis]Public investment
Private investment
Public consumption
-15.0%
-10.0%
-5.0%
2003
2004
2005
2006
2007
2008
2009
2010
2011
2012
Private consumption
GDP
Inflation is a sustained increase in the overalli l l
III. InflationIII. Inflation
price level◦ Increase in average prices of all goods and services vs.
change in relative prices of individual goods and services◦ One-time increase in the price level vs. underlying inflation
Commonly used measures include changes in:y g− The consumer price index (CPI)− Wholesale (WPI) oror Producer Price Index (PPI)− The GDP deflator (PGDP)

9
Reasonably low inflation is equivalent to price stability
Why Do We Care About Inflation?
y key element of macroeconomic stability low inflation important for markets to function effectively, thereby supporting economic development high inflation has adverse social impact, especially on poor
Many macroeconomic variables have a price component e gcomponent, e.g.Nominal GDP = Real GDP * GDP Deflator Inflation helps understanding the price component
Inflation DeterminantsInflation Determinants
Π (Price Inflation)

10
Inflation in Lao PDR: The Long RunInflation in Lao PDR: The Long Run
Annual inflation (year on year eop)
0 0%
50.0%
100.0%
150.0%
200.0%Annual inflation (year-on-year, eop)
-50.0%
0.0%
Jan-91M
ar-92M
ay-93Jul-94Sep-95Nov-96Jan-98M
ar-99M
ay-00Jul-01Sep-02Nov-03Jan-05M
ar-06M
ay-07Jul-08Sep-09Nov-10Jan-12M
ar-13
Inflation in Lao PDR: Recent YearsInflation in Lao PDR: Recent Years
Annual inflation (year on year eop)
2.0%4.0%6.0%8.0%
10.0%12.0%
Annual inflation (year-on-year, eop)
-4.0%-2.0%0.0%
Jan-05
Jul-05
Jan-06
Jul-06
Jan-07
Jul-07
Jan-08
Jul-08
Jan-09
Jul-09
Jan-10
Jul-10
Jan-11
Jul-11
Jan-12
Jul-12
Jan-13
Jul-13

11
Nominal GDP: measures the value of output of the economy at current prices
IV. Nominal IV. Nominal vs. Realvs. Real
of the economy at current prices Real GDP: measures the value of output of
the economy -- changes in an economy’s physical output -- using prices of a fixed base year Changes in nominal GDP over time reflect
changes in both prices and physical output
Distinction Between Nominal & Real Is Useful For (1) Purchasing Power
If inflation was 10%,Real buying power grew
BUT
If inflation was 30%,Real buying power shrank

12
Distinction Between Nominal & Real Is Useful For (2) Accounting for Different Determinants
Fundamental relation to be used over & over !
Approximation: ∆%V ≈ ∆%P + ∆%Q
Nominal GDP (V) = GDP Deflator (P) * Real GDP (Q)
Exact relationship:(1+ ∆%V/100) =(1+∆%P/100)*(1+∆%Q/100)
V. Forecasting GDPV. Forecasting GDPWhy does forecasting GDPWhy does forecasting GDPmatter?• GDP forecast is the starting point for many other forecasts, e.g., revenues or imports• Similarly, GDP forecasts are
f j i GDPnecessary for projecting GDP ratios• GDP forecasts are central for macroeconomic management

13
It’s difficult …It’s difficult …• It’s very rare that the f hi l hforecast hits exactly the mark (if so, it’s just luck!)• The forecast ‘number’ is important (e.g., for the budget), but …• … the ‘story’ behind the forecast is often as important
General Procedure• Start with analyzing the
h kpast what were key developments and how are they going to affect the present and future?• What do we know about the present (nowcast)?• Forecast is an extrapolation of past and present, taking policy (changes) into account

14
Forecasting Real GDP (volume)
Specific Procedure
◦ Potential output and output gap◦ Supply: Production function Sectoral forecasts◦ Demand: expenditures (C + I + X - M)◦ Reconciliation of Supply & Demand Forecasting Inflation (prices) Obtaining Nominal GDP Forecast
V.1 Forecasting Real GDPPotential Output & Output Gap
• Potential GDP is the level of output that can be sustainably produced without adding or subtracting inflation pressures. That is, demand and supply are broadly in balance.
• Output gap: The difference between actual and potential GDP.
• Output gap may be positive or negative. − A positive output gap would signify an expansion that could
place excessive pressure on resources.− A negative output gap signifies idle resources—low capacity
utilization of capital stock and higher unemployment—that is likely to lead to declining rates of inflation or deflation.

15
Output Gaps
Positive output gap:demand > supply
Negative output gap:d d ldemand < supply
NonNon--Resource Real GDP and Trend in Lao PDRResource Real GDP and Trend in Lao PDR
10.4
10.6
9 4
9.6
9.8
10
10.2
10.4
Real GDP excl. Resource Sector in natural logarithmTrend output
9
9.2
9.4
199019921994199619982000200220042006200820102012

16
Corresponding Output Gap in Lao PDRCorresponding Output Gap in Lao PDR6.0%
4 0%
-2.0%
0.0%
2.0%
4.0%
-8.0%
-6.0%
-4.0%
1990
1992
1994
1996
1998
2000
2002
2004
2006
2008
2010
2012
Actual and Trend NonActual and Trend Non--Resource Real GDP GrowthResource Real GDP Growth12.0%
4.0%
6.0%
8.0%
10.0%
Change in %Average
0.0%
2.0%
1991
1993
1995
1997
1999
2001
2003
2005
2007
2009
2011

17
Q = f (K L A)
Supply Side: Production Function Approach for Forecasting Potential Growth
Q = f (K, L, A)where K = Capital
L = LaborA = Technology, Institutions
In the long run, increasing supply requires increasing A (through structural policies)
Production Approach to GDP:
Forecast production in each sector separately as they
Supply Side: Sectoral Forecasts
Forecast production in each sector separately as they may have different determinants, then add up the individual forecasts to obtain the total:
...,
1,
,
1,
,
1,1
tser
tserser
tman
tmanman
tagr
tagragr
t
t
GDP
GDPw
GDP
GDPw
GDP
GDPw
GDP
GDP

18
GDP = (CP + CG) + (IP + IG) + (X – M)Demand Side: Forecasting Expenditure
Fiscal sector BOP
We should be able to forecast public consumption and investment (CG & IG) using information from the budget. We might be able to construct forecast equations for exports and imports (X – M) [External sector]
Fiscal sector BOP
Private consumption (CP) is often fairly steady and not that difficult to forecastLeaves private investment (IP) as a very difficult element to forecast because this tends to be fairly volatile
V.2 Forecasting Inflation
Why does forecasting inflationWhy does forecasting inflationmatter?• Inflation forecast is the starting point for the price component of many other forecasts, e.g., GDP deflator
K i i fl i d l• Keeping inflation under control is central macroeconomic objective, which requires inflation forecast

19
Simple Inflation Forecasts—Based on CPI Data OnlySimplest inflation forecast assumes return of
inflation to its historical average:Ad t
0 0%2.0%4.0%6.0%8.0%
10.0%12.0%
Annual Inflation in Lao PDR (Year-on-Year, End-of-Period)Advantage: Simple Surprisingly hard
to beat with respect to forecast error
Disadvantage: Doesn’t help
with monetary
-4.0%-2.0%0.0%
Jan-05Jul-05Jan-06Jul-06Jan-07Jul-07Jan-08Jul-08Jan-09Jul-09Jan-10Jul-10Jan-11Jul-11Jan-12Jul-12Jan-13Jul-13Jan-14Jul-14
Average 2005-13 Annual inflation (year-on-year, eop)
with monetary policy formulation
Structural breaks are major problem—i.e., what average to choose?
Identifying Role of Individual Inflation ComponentsIdentifying Role of Individual Inflation ComponentsContribution to Headline Inflation 1/(In percentage points)
4
6
8
10
12Core (2010 weight 0.63) Raw food (2010 weight 0.28)Energy (2010 weight 0.08) Others (2010 weight 0.01)Headline
p g p
-2
0
2
Jan-11 Jul-11 Jan-12 Jul-12 Jan-13
1/ Core inflation exclues raw food, fuel, gold, electricity tariffs.
20
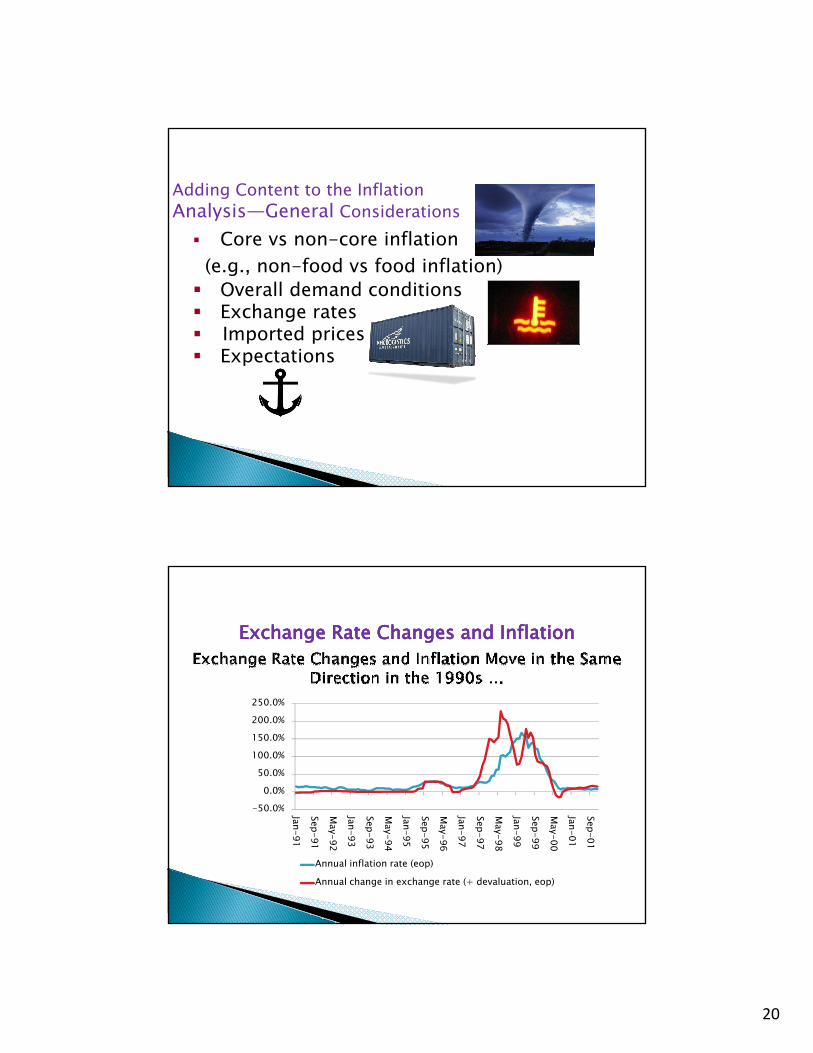
Core vs non-core inflation
Adding Content to the Inflation Analysis—General Considerations
(e.g., non-food vs food inflation) Overall demand conditions Exchange rates Imported prices Expectations
Exchange Rate Changes and InflationExchange Rate Changes and Inflation
50 0%0.0%
50.0%100.0%150.0%200.0%250.0%
-50.0% Jan-91Sep-91M
ay-92Jan-93Sep-93M
ay-94Jan-95Sep-95M
ay-96Jan-97Sep-97M
ay-98Jan-99Sep-99M
ay-00Jan-01Sep-01
Annual inflation rate (eop)Annual change in exchange rate (+ devaluation, eop)

21
… But Often in Opposite Directions Since the Late 2000s. 20.0%
-15.0%-10.0%
-5.0%0.0%5.0%
10.0%15.0%
Jan
Oc Jul
Ap Jan
Oc Jul
A p Jan
Oc Jul
A p Jan
Oc Jul
Apn-02
ct-02
-03
pr-04
n-05
ct-05
-06
pr-07
n-08
ct-08
-09
pr-10
n-11
ct-11
-12
pr-13
Annual inflation rate (eop)Annual change in exchange rate (+ devaluation, eop)
Any Ideas Why the Relationship Between Exchange Rates and Inflation Might Have Changed?

22
Could the Commodity Price Boom Have Something to Do With This?
International Commodity Price Indices (in US$)
100 00
150.00
200.00
250.00International Commodity Price Indices (in US$)
Fuell
0.00
50.00
100.00
1993
1995
1997
1999
2001
2003
2005
2007
2009
2011
2013
Metals
Output Gap and InflationOutput Gap and Inflation
101 2
Output Gap and Inflation(In percent of potential GDP)
0
2
4
6
8
10
0
0.2
0.4
0.6
0.8
1
1.2Output gap - Band-pass filter Output gap - HP
Inflation (y/y percent change, RHS) Core inflation (y/y percent change, RHS)
Proj.
-4
-2
-0.4
-0.2
2006 2007 2008 2009 2010 2011 2012 2013
Sources: Country authorities; and IMF staff estimates.

23
Inflation Forecast: Practical ApproachWhen data is not extensively available --Inertial Approach (with judgmental adjustment): 1t t tX
• How and why would inflation rate be different from the previous year?
X: judgmental adjustment
Expected cost pressures:W ld d i h h i diWorld trade prices, exchange rate changes, wages, indirect taxes
Expected policy and other demand changes:Changes in fiscal or monetary policy stance, slowdown in consumption due to rising unemployment, negative expectations
V.3 GDP Deflator
Real
Consumption =
Nominal Consumption Deflator
=Consumption
Real Investment
Investment Deflator
= Nominal
Investment
Real Exports
Export Deflator
= Nominal
Exports
Real Imports
Import Deflator
= Nominal
Imports
Real GDP Nominal GDP
Nominal GDPGDP Deflator 100
Real GDP

24
Decomposing GDP deflator into its components
Forecasting GDP Deflator
%∆PGDP = WC %∆PC + WI %∆PI
+ WX %∆PX - WM %∆PM
WC = consumption share in GDP
WI = investment share in GDP
WX = export share in GDP
WM = import share in GDP
Consumption: %∆ PC = %∆ CPI Investment: %∆ PI = (1-a) %∆ CPI + a %∆ PM
Forecasting Component Deflators
Investment: %∆ PI (1 a) %∆ CPI + a %∆ PM
(a = share of imported investment goods)
Export:%∆ PX = ((1+%∆ Export price in US$/100) *(1+%∆ Exchange rate/100) –1) *100
Import:Import:%∆ PM = ((1+%∆ Import price in US$/100) *(1+%∆ Exchange rate/100) –1) *100

25
Forecast real GDP growth Forecast prices
V.4 Putting It Together: Nominal GDP Forecast
p◦ CPI◦ Sub-components of GDP deflators (CG, IP , IG)◦ GDP deflator
Compute nominal GDP growth, using
Value = Value (1+%P) (1+%Q)Valuet+1 = Valuet (1+%P) (1+%Q)
CONGRATULATIONS!
You are now well on your way to forecasting GDP and Inflation on
your OWN!
Thank you!