introduction to the wsr-88d (nexrad) for … · wsr-88d for ornithological research – diehl and...
TRANSCRIPT
__________
1A version of this paper was presented at the Third Interna-tional Partners in Flight Conference, March 20-24, 2002, Asilomar Conference Grounds, California. 2Department of Animal Biology, University of Illinois, Urbana, Illinois 61801, USA. 3Current address: Department of Biological Sciences, University of Southern Mississippi, Hattiesburg, Mississippi 39406, USA. E-mail: [email protected] 4Illinois Natural History Survey, 607 E. Peaabody Dr., Champaign, IL 61820, USA.
Introduction to the WSR-88D (NEXRAD) for Ornithological Research1
Robert H. Diehl2,3 and Ronald P. Larkin4
________________________________________
Abstract
The system of Doppler weather surveillance radars known as WSR-88D or more popularly as NEXRAD helped transform radar ornithology in the United States into a field that today attracts considerable attention from scientists and laypersons alike. As interest in or-nithological applications of WSR-88D grows, so does the need to provide perspective on its use. In this paper, we introduce WSR-88D and consider issues associated with interpretation of WSR-88D imagery and quantifi-cation of data. Because particular interest surrounds radar’s potential to associate bird numbers with speci-fic habitats or land use features, we address some of the challenges in making such associations focusing speci-fically on migrating landbirds. Readers interested in applying WSR-88D should gain appreciation of the technical challenges as well as the biological potential of this radar system for ornithological research.
Introduction
New technology spurs scientific progress. Bird migra-tion research benefited greatly from the introduction of radar as a biological tool (Lack and Varley 1945). Radar revealed the structure and intensity of nocturnal bird migration (e.g. Nisbet 1963, Eastwood 1967, Gau-threaux 1971) beyond the pioneering moon watching studies which first showed nocturnal migration on a continental scale (Lowery 1951, Lowery and Newman 1966). Nisbet (1963) and Gauthreaux (1970) developed novel approaches to quantifying bird densities from the analog displays of WSR-57 (Weather Surveillance Radar, design year 1957), the United States’ first gen-eration of weather surveillance radar. Years later, com-missioning of the WSR-88D (Weather Surveillance Radar, 1988 Doppler) or NEXRAD (NEXt generation weather RADar) in the mid-1990’s represented a sub-stantial leap in radar technology available to ornitholo-
gists, entomologists, and others. This system of radars differs from its predecessor in several important ways: it is Doppler capable and considerably more sensitive; it is digital and established and increasingly sophisti-cated data distribution channels allow ready access to data for a large user community; radars within the sys-tem are uniform by design and widely distributed.
With these improvements, the system boasted enor-mous potential to advance our understanding of beha-viors and patterns of animal distribution and movement across many spatial and temporal scales. As striking radar imagery of bird migrations began to appear in scientific presentations and the popular media, many biologists, governmental and non-governmental organi-zations, and members of the general public realized the potential of WSR-88D for avian conservation, manage-ment, and education. However, imagery from WSR-88D failed to convey the complexities of treating these data quantitatively while avoiding sources of bias.
In this paper, we present a brief introduction to meth-odological issues concerning use of the WSR-88D for ornithological research. Although many concepts pres-ented here apply to other radars, this paper is not in-tended as an exhaustive review of applied radar meth-ods in ornithology (see also Eastwood 1967; Vaughn 1985; Bruderer 1997a, b). Rather, our goal is to pro-vide perspective and raise awareness regarding some applications of WSR-88D in studying migrating birds.
Patterns of radar echo have numerous biological and non-biological causes that must in part be understood to interpret and apply this technology properly. We introduce basic WSR-88D operation and its base products (reflectivity, velocity, and spectrum width) and consider range bias, resolution, identity of echo sources, aspect effects, clutter, and refraction in prop-erly interpreting and quantifying radar echoes from WSR-88D. These are interacting factors. For example we present clutter and refraction as separate sections, but when atmospheric conditions permit, refraction may dramatically increase the influence of clutter. Finally, we consider the association between radar echoes from migrating birds just after takeoff with their source stopover habitats. Understanding and recognizing radar artifacts such as velocity aliasing and second-trip echo, however, are beyond the scope of this paper. Doviak and Zrnic (1993) and Rinehart (1997) consider these in some detail. For simplicity, we emphasize landbird migration, but the principles often apply more broadly.
USDA Forest Service Gen. Tech. Rep. PSW-GTR-191. 2005
876
WSR-88D for Ornithological Research – Diehl and Larkin
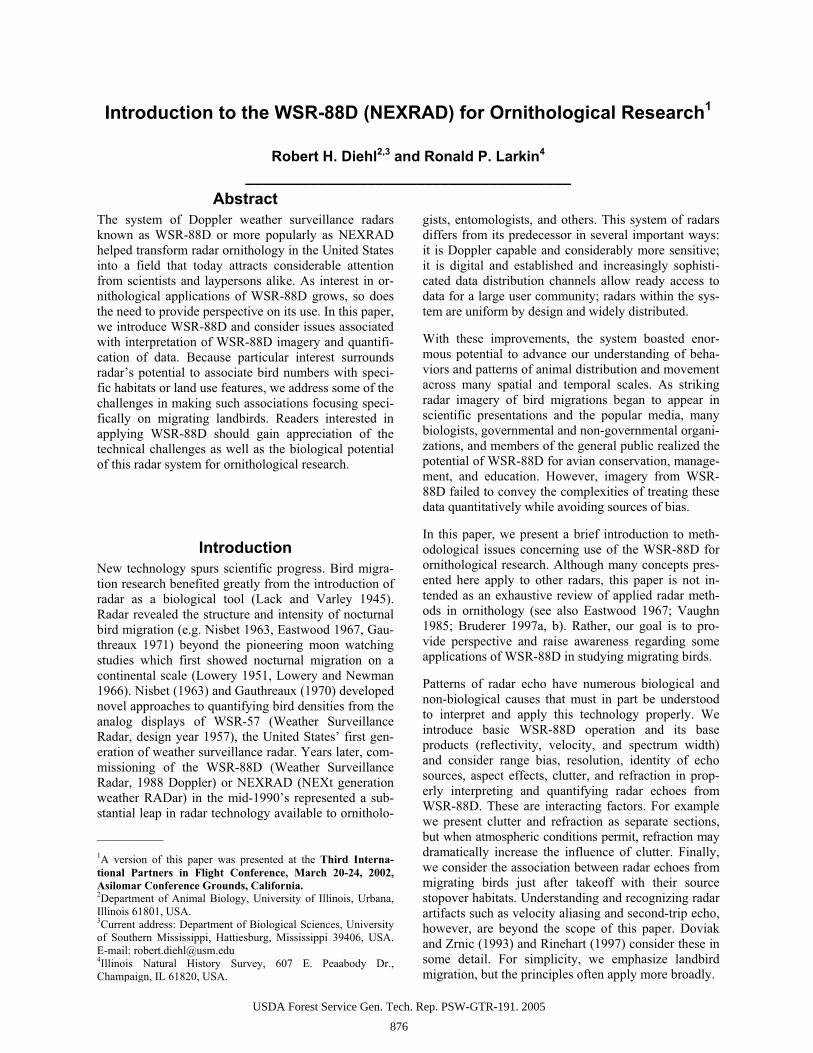
Figure 1 Locations of 154 radars comprising the current WSR-88D system. Radars in Guam and Puerto Rico are not shown.
WSR-88D Products and Operation
WSR-88D is a system of 154 S-band (10-cm wave-length) radars distributed across the continental United States, Alaska, Hawaii, Guam, and Puerto Rico (fig. 1). Because WSR-88D by design monitors weather systems over large geographic areas, the system is inherently well suited to studying the larger spatial scales of bird distributions and movements aloft (Gauthreaux and Belser 2003, Gauthreaux et al. 2003). The distribution of radars in the WSR-88D system does not define the spatial extent that bird movements can be studied by surveillance radar in North America. Both Canada (http://weatheroffice.ec.gc.ca/radar/index _e.html) and Mexico (http://smn.cna.gob.mx/radares/ radares.html) maintain weather surveillance radar sys-tems that together increase the spatial scale of monitor-ing that might be possible if data from these different systems were merged.
Radars within the WSR-88D system are identical in design, simplifying system-wide understanding and application. However, operational parameters (see also ‘Resolution and Data Sources’) and other factors such as ground clutter rejection and radar siting (see below) vary by radar (Crum and Alberty 1993). Analyses
involving multiple radars, therefore, might require that data from each radar be treated individually.
Each radar in the WSR-88D system switches between two modes of operation and characterizes echoes through three base radar products–reflectivity, radial velocity, and spectrum width. These modes differ pri-marily in the number of sweeps in a volume scan, tem-poral resolution, and for Level III data, scaling and resolution of reflectivity. In clear-air mode, the radar’s beam sweeps through five different elevations between ~0.5° and ~4.5° in ~1° increments to complete a vol-ume scan. Precipitation mode volume scans contain either 9 or 14 sweeps in varying increments ranging from ~0.5° to ~19.5°. All figures depicting radar im-agery in this paper show data from the 0.5° elevation sweep. Stacking the sweeps from these volume scans, we can view vertical structure in bird density and movements (Diehl et al. 2003). However, earth’s cur-vature frequently limits the usefulness of such cross-sections to short ranges.
Reflectivity
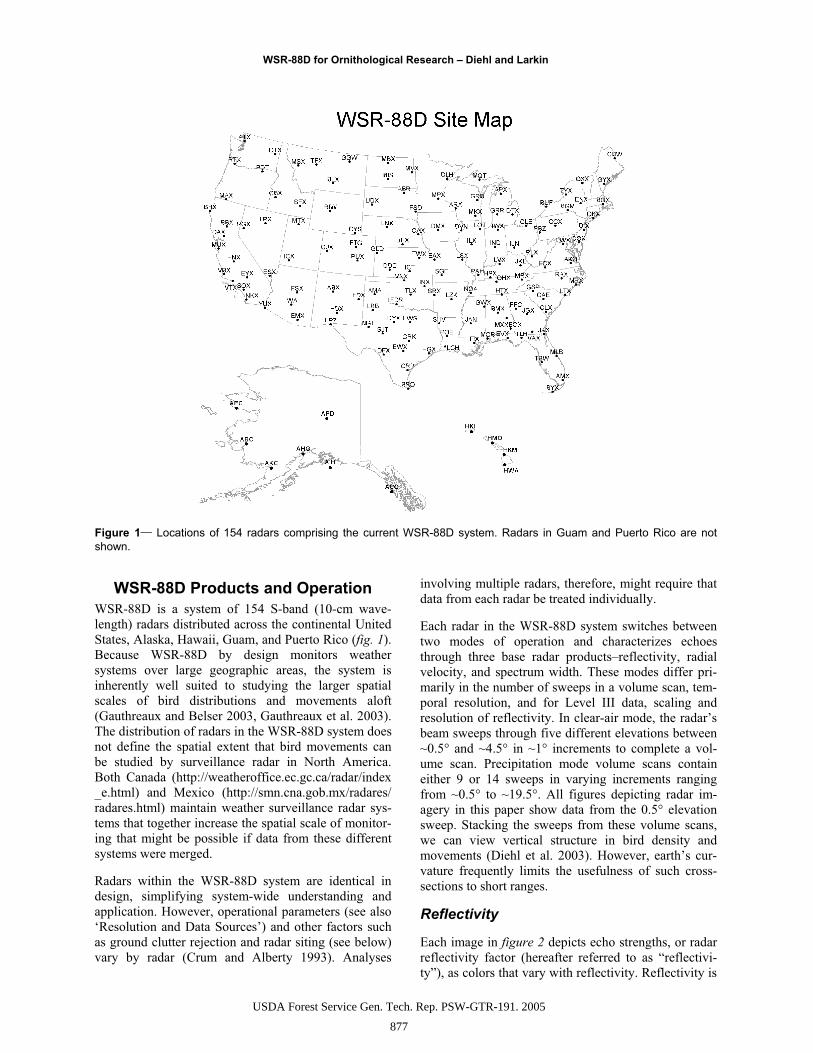
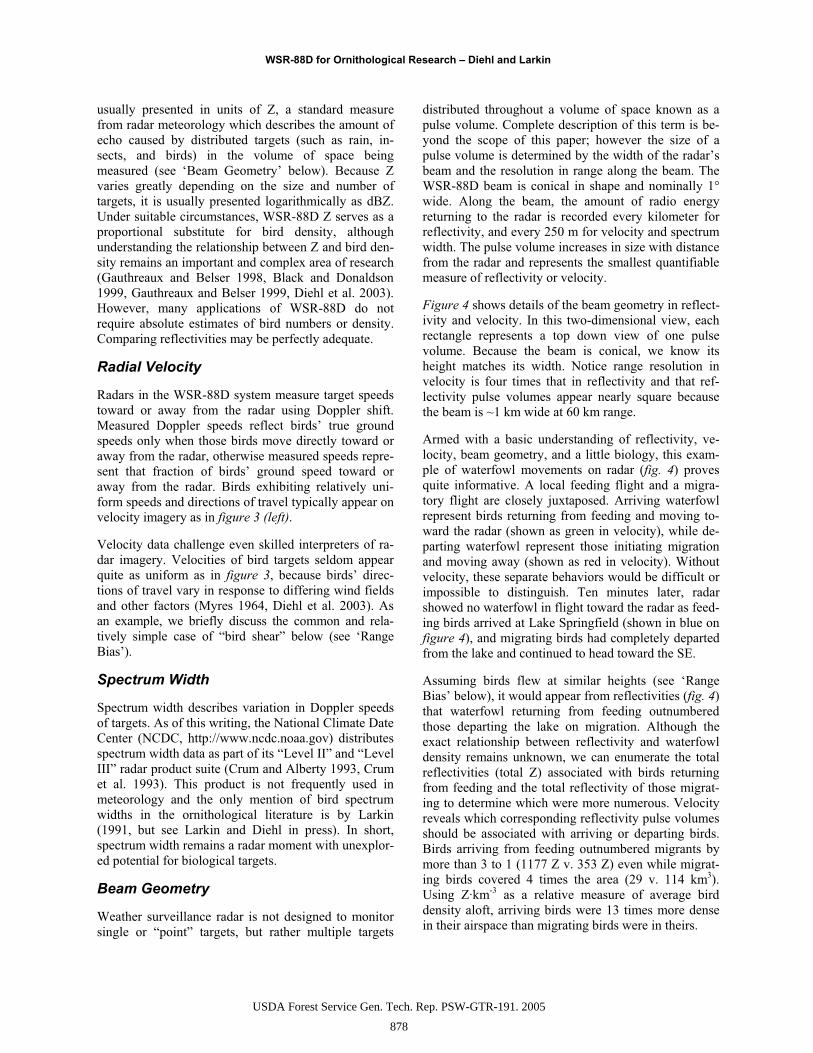
Each image in figure 2 depicts echo strengths, or radar reflectivity factor (hereafter referred to as “reflectivi-ty”), as colors that vary with reflectivity. Reflectivity is
USDA Forest Service Gen. Tech. Rep. PSW-GTR-191. 2005
877
WSR-88D for Ornithological Research – Diehl and Larkin
usually presented in units of Z, a standard measure from radar meteorology which describes the amount of echo caused by distributed targets (such as rain, in-sects, and birds) in the volume of space being measured (see ‘Beam Geometry’ below). Because Z varies greatly depending on the size and number of targets, it is usually presented logarithmically as dBZ. Under suitable circumstances, WSR-88D Z serves as a proportional substitute for bird density, although understanding the relationship between Z and bird den-sity remains an important and complex area of research (Gauthreaux and Belser 1998, Black and Donaldson 1999, Gauthreaux and Belser 1999, Diehl et al. 2003). However, many applications of WSR-88D do not require absolute estimates of bird numbers or density. Comparing reflectivities may be perfectly adequate.
Radial Velocity
Radars in the WSR-88D system measure target speeds toward or away from the radar using Doppler shift. Measured Doppler speeds reflect birds’ true ground speeds only when those birds move directly toward or away from the radar, otherwise measured speeds repre-sent that fraction of birds’ ground speed toward or away from the radar. Birds exhibiting relatively uni-form speeds and directions of travel typically appear on velocity imagery as in figure 3 (left).
Velocity data challenge even skilled interpreters of ra-dar imagery. Velocities of bird targets seldom appear quite as uniform as in figure 3, because birds’ direc-tions of travel vary in response to differing wind fields and other factors (Myres 1964, Diehl et al. 2003). As an example, we briefly discuss the common and rela-tively simple case of “bird shear” below (see ‘Range Bias’).
Spectrum Width
Spectrum width describes variation in Doppler speeds of targets. As of this writing, the National Climate Date Center (NCDC, http://www.ncdc.noaa.gov) distributes spectrum width data as part of its “Level II” and “Level III” radar product suite (Crum and Alberty 1993, Crum et al. 1993). This product is not frequently used in meteorology and the only mention of bird spectrum widths in the ornithological literature is by Larkin (1991, but see Larkin and Diehl in press). In short, spectrum width remains a radar moment with unexplor-ed potential for biological targets.
Beam Geometry
Weather surveillance radar is not designed to monitor single or “point” targets, but rather multiple targets
distributed throughout a volume of space known as a pulse volume. Complete description of this term is be-yond the scope of this paper; however the size of a pulse volume is determined by the width of the radar’s beam and the resolution in range along the beam. The WSR-88D beam is conical in shape and nominally 1° wide. Along the beam, the amount of radio energy returning to the radar is recorded every kilometer for reflectivity, and every 250 m for velocity and spectrum width. The pulse volume increases in size with distance from the radar and represents the smallest quantifiable measure of reflectivity or velocity.
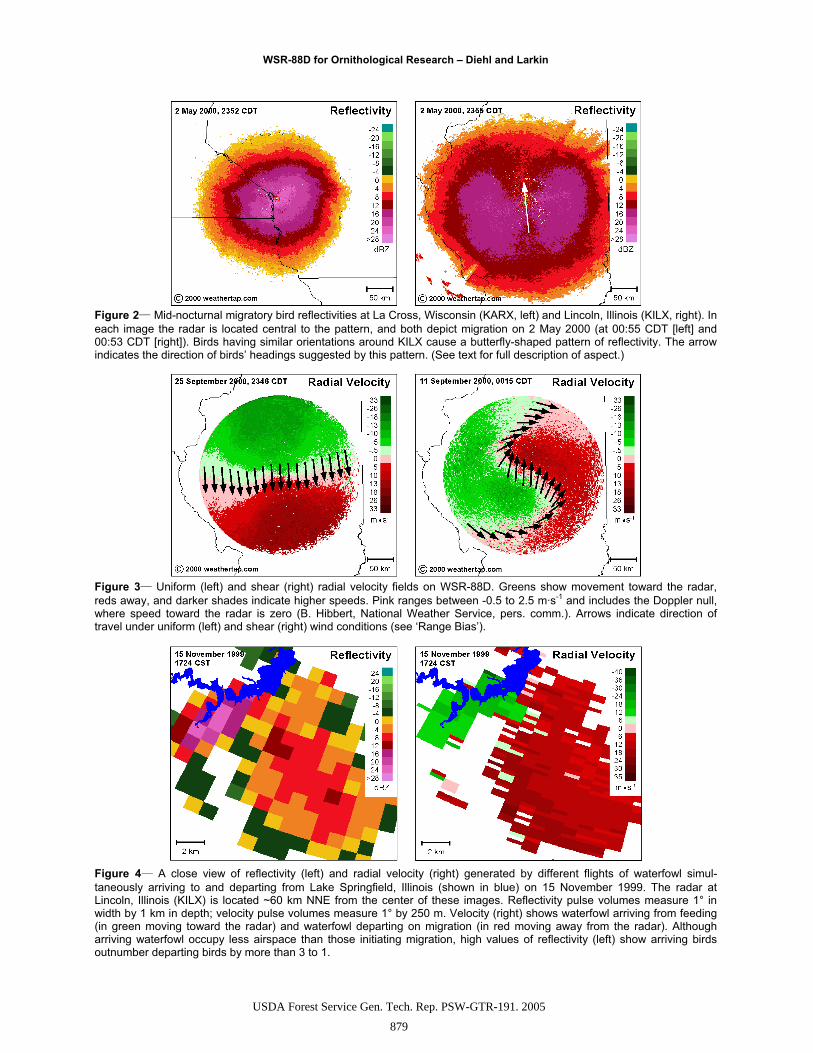
Figure 4 shows details of the beam geometry in reflect-ivity and velocity. In this two-dimensional view, each rectangle represents a top down view of one pulse volume. Because the beam is conical, we know its height matches its width. Notice range resolution in velocity is four times that in reflectivity and that ref-lectivity pulse volumes appear nearly square because the beam is ~1 km wide at 60 km range.
Armed with a basic understanding of reflectivity, ve-locity, beam geometry, and a little biology, this exam-ple of waterfowl movements on radar (fig. 4) proves quite informative. A local feeding flight and a migra-tory flight are closely juxtaposed. Arriving waterfowl represent birds returning from feeding and moving to-ward the radar (shown as green in velocity), while de-parting waterfowl represent those initiating migration and moving away (shown as red in velocity). Without velocity, these separate behaviors would be difficult or impossible to distinguish. Ten minutes later, radar showed no waterfowl in flight toward the radar as feed-ing birds arrived at Lake Springfield (shown in blue on figure 4), and migrating birds had completely departed from the lake and continued to head toward the SE.
Assuming birds flew at similar heights (see ‘Range Bias’ below), it would appear from reflectivities (fig. 4)that waterfowl returning from feeding outnumbered those departing the lake on migration. Although the exact relationship between reflectivity and waterfowl density remains unknown, we can enumerate the total reflectivities (total Z) associated with birds returning from feeding and the total reflectivity of those migrat-ing to determine which were more numerous. Velocity reveals which corresponding reflectivity pulse volumes should be associated with arriving or departing birds. Birds arriving from feeding outnumbered migrants by more than 3 to 1 (1177 Z v. 353 Z) even while migrat-ing birds covered 4 times the area (29 v. 114 km3).Using Z·km-3 as a relative measure of average bird density aloft, arriving birds were 13 times more dense in their airspace than migrating birds were in theirs.
USDA Forest Service Gen. Tech. Rep. PSW-GTR-191. 2005
878
WSR-88D for Ornithological Research – Diehl and Larkin
Figure 2 Mid-nocturnal migratory bird reflectivities at La Cross, Wisconsin (KARX, left) and Lincoln, Illinois (KILX, right). In each image the radar is located central to the pattern, and both depict migration on 2 May 2000 (at 00:55 CDT [left] and 00:53 CDT [right]). Birds having similar orientations around KILX cause a butterfly-shaped pattern of reflectivity. The arrow indicates the direction of birds’ headings suggested by this pattern. (See text for full description of aspect.)
Figure 3 Uniform (left) and shear (right) radial velocity fields on WSR-88D. Greens show movement toward the radar, reds away, and darker shades indicate higher speeds. Pink ranges between -0.5 to 2.5 m·s-1 and includes the Doppler null, where speed toward the radar is zero (B. Hibbert, National Weather Service, pers. comm.). Arrows indicate direction of travel under uniform (left) and shear (right) wind conditions (see ‘Range Bias’).
Figure 4 A close view of reflectivity (left) and radial velocity (right) generated by different flights of waterfowl simul-taneously arriving to and departing from Lake Springfield, Illinois (shown in blue) on 15 November 1999. The radar at Lincoln, Illinois (KILX) is located ~60 km NNE from the center of these images. Reflectivity pulse volumes measure 1° in width by 1 km in depth; velocity pulse volumes measure 1° by 250 m. Velocity (right) shows waterfowl arriving from feeding (in green moving toward the radar) and waterfowl departing on migration (in red moving away from the radar). Although arriving waterfowl occupy less airspace than those initiating migration, high values of reflectivity (left) show arriving birdsoutnumber departing birds by more than 3 to 1.
USDA Forest Service Gen. Tech. Rep. PSW-GTR-191. 2005
879
WSR-88D for Ornithological Research – Diehl and Larkin
Range Bias
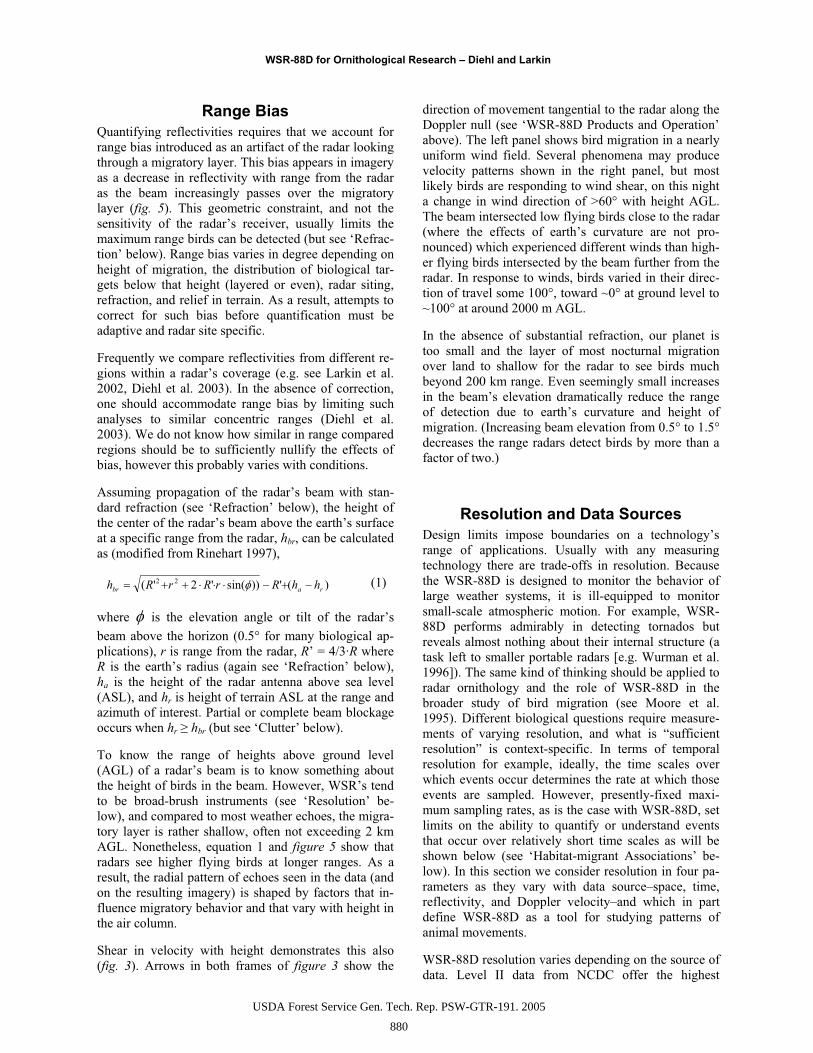
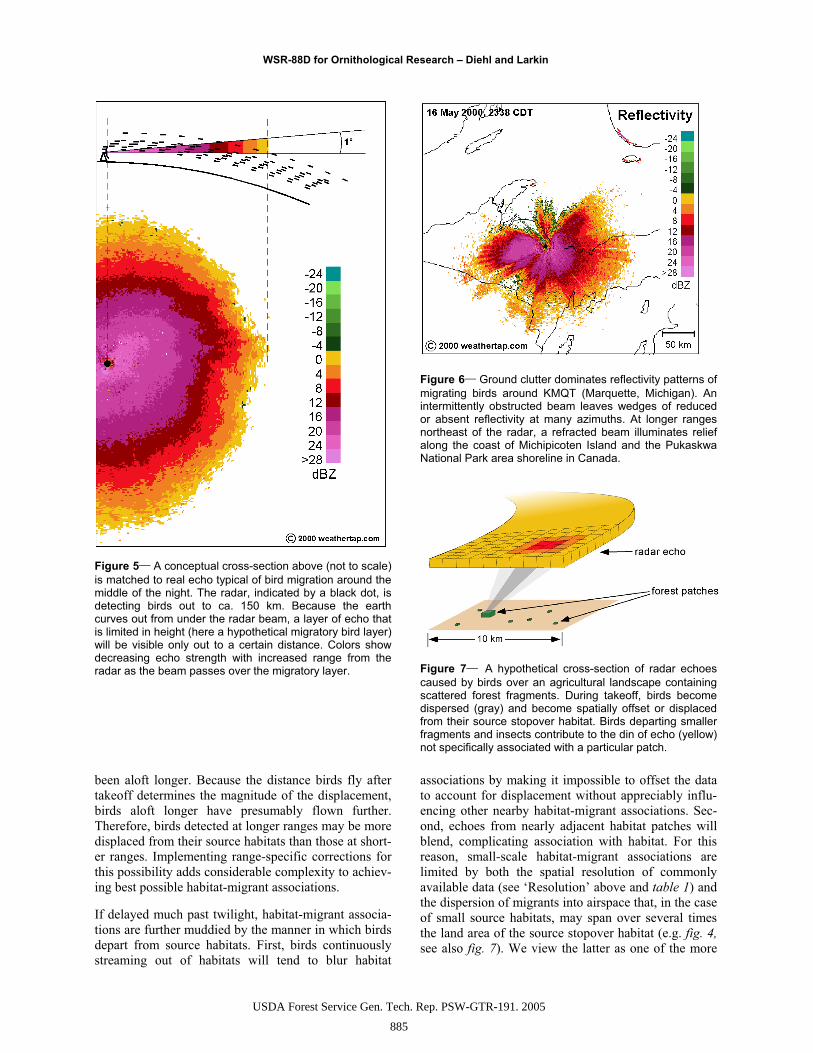
Quantifying reflectivities requires that we account for range bias introduced as an artifact of the radar looking through a migratory layer. This bias appears in imagery as a decrease in reflectivity with range from the radar as the beam increasingly passes over the migratory layer (fig. 5). This geometric constraint, and not the sensitivity of the radar’s receiver, usually limits the maximum range birds can be detected (but see ‘Refrac-tion’ below). Range bias varies in degree depending on height of migration, the distribution of biological tar-gets below that height (layered or even), radar siting, refraction, and relief in terrain. As a result, attempts to correct for such bias before quantification must be adaptive and radar site specific.
Frequently we compare reflectivities from different re-gions within a radar’s coverage (e.g. see Larkin et al. 2002, Diehl et al. 2003). In the absence of correction, one should accommodate range bias by limiting such analyses to similar concentric ranges (Diehl et al. 2003). We do not know how similar in range compared regions should be to sufficiently nullify the effects of bias, however this probably varies with conditions.
Assuming propagation of the radar’s beam with stan-dard refraction (see ‘Refraction’ below), the height of the center of the radar’s beam above the earth’s surface at a specific range from the radar, hbr, can be calculated as (modified from Rinehart 1997),
)('))sin('2'( 22rabr hhRrRrRh (1)
where is the elevation angle or tilt of the radar’s
beam above the horizon (0.5° for many biological ap-plications), r is range from the radar, R’ = 4/3·R where R is the earth’s radius (again see ‘Refraction’ below), ha is the height of the radar antenna above sea level (ASL), and hr is height of terrain ASL at the range and azimuth of interest. Partial or complete beam blockage occurs when hr hbr (but see ‘Clutter’ below).
To know the range of heights above ground level (AGL) of a radar’s beam is to know something about the height of birds in the beam. However, WSR’s tend to be broad-brush instruments (see ‘Resolution’ be-low), and compared to most weather echoes, the migra-tory layer is rather shallow, often not exceeding 2 km AGL. Nonetheless, equation 1 and figure 5 show that radars see higher flying birds at longer ranges. As a result, the radial pattern of echoes seen in the data (and on the resulting imagery) is shaped by factors that in-fluence migratory behavior and that vary with height in the air column.
Shear in velocity with height demonstrates this also (fig. 3). Arrows in both frames of figure 3 show the
direction of movement tangential to the radar along the Doppler null (see ‘WSR-88D Products and Operation’ above). The left panel shows bird migration in a nearly uniform wind field. Several phenomena may produce velocity patterns shown in the right panel, but most likely birds are responding to wind shear, on this night a change in wind direction of >60° with height AGL. The beam intersected low flying birds close to the radar (where the effects of earth’s curvature are not pro-nounced) which experienced different winds than high-er flying birds intersected by the beam further from the radar. In response to winds, birds varied in their direc-tion of travel some 100°, toward ~0° at ground level to ~100° at around 2000 m AGL.
In the absence of substantial refraction, our planet is too small and the layer of most nocturnal migration over land to shallow for the radar to see birds much beyond 200 km range. Even seemingly small increases in the beam’s elevation dramatically reduce the range of detection due to earth’s curvature and height of migration. (Increasing beam elevation from 0.5° to 1.5° decreases the range radars detect birds by more than a factor of two.)
Resolution and Data Sources
Design limits impose boundaries on a technology’s range of applications. Usually with any measuring technology there are trade-offs in resolution. Because the WSR-88D is designed to monitor the behavior of large weather systems, it is ill-equipped to monitor small-scale atmospheric motion. For example, WSR-88D performs admirably in detecting tornados but reveals almost nothing about their internal structure (a task left to smaller portable radars [e.g. Wurman et al. 1996]). The same kind of thinking should be applied to radar ornithology and the role of WSR-88D in the broader study of bird migration (see Moore et al. 1995). Different biological questions require measure-ments of varying resolution, and what is “sufficient resolution” is context-specific. In terms of temporal resolution for example, ideally, the time scales over which events occur determines the rate at which those events are sampled. However, presently-fixed maxi-mum sampling rates, as is the case with WSR-88D, set limits on the ability to quantify or understand events that occur over relatively short time scales as will be shown below (see ‘Habitat-migrant Associations’ be-low). In this section we consider resolution in four pa-rameters as they vary with data source–space, time, reflectivity, and Doppler velocity–and which in part define WSR-88D as a tool for studying patterns of animal movements.
WSR-88D resolution varies depending on the source of data. Level II data from NCDC offer the highest
USDA Forest Service Gen. Tech. Rep. PSW-GTR-191. 2005
880
WSR-88D for Ornithological Research – Diehl and Larkin
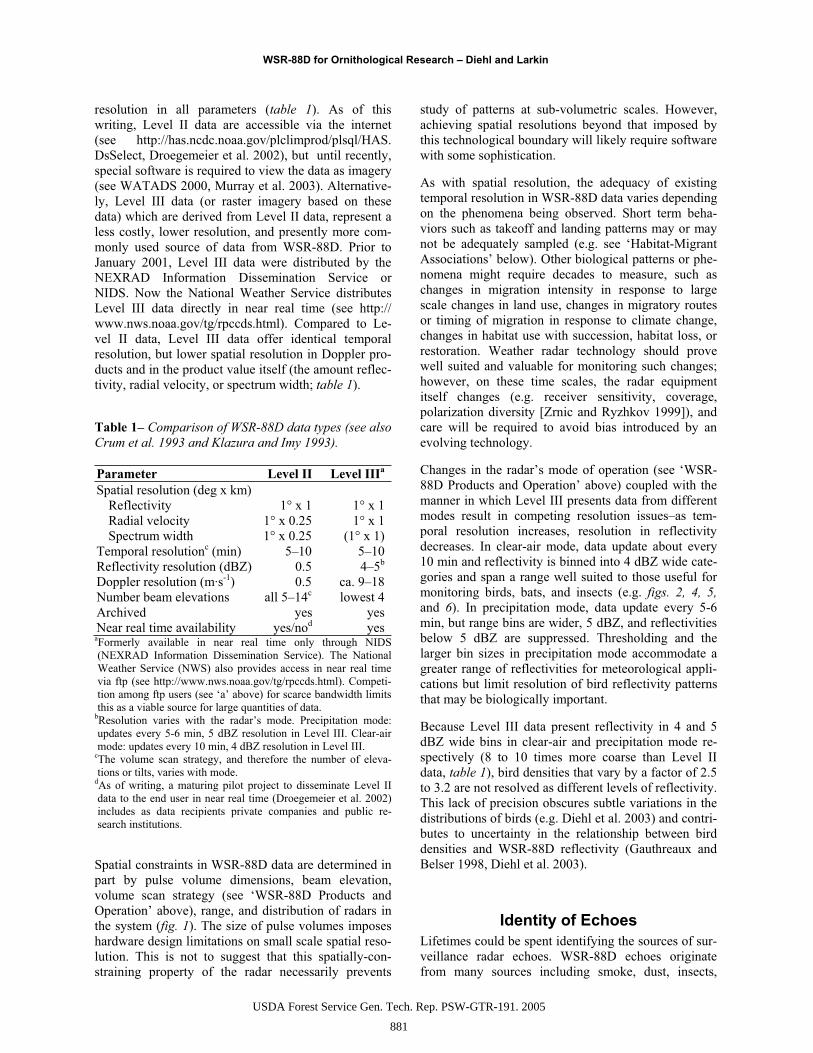
resolution in all parameters (table 1). As of this writing, Level II data are accessible via the internet (see http://has.ncdc.noaa.gov/plclimprod/plsql/HAS. DsSelect, Droegemeier et al. 2002), but until recently, special software is required to view the data as imagery (see WATADS 2000, Murray et al. 2003). Alternative-ly, Level III data (or raster imagery based on these data) which are derived from Level II data, represent a less costly, lower resolution, and presently more com-monly used source of data from WSR-88D. Prior to January 2001, Level III data were distributed by the NEXRAD Information Dissemination Service or NIDS. Now the National Weather Service distributes Level III data directly in near real time (see http:// www.nws.noaa.gov/tg/rpccds.html). Compared to Le-vel II data, Level III data offer identical temporal resolution, but lower spatial resolution in Doppler pro-ducts and in the product value itself (the amount reflec-tivity, radial velocity, or spectrum width; table 1).
Table 1– Comparison of WSR-88D data types (see also
Crum et al. 1993 and Klazura and Imy 1993).
Parameter Level II Level IIIa
Spatial resolution (deg x km) Reflectivity 1° x 1 1° x 1 Radial velocity 1° x 0.25 1° x 1 Spectrum width 1° x 0.25 (1° x 1)
Temporal resolutionc (min) 5–10 5–10 Reflectivity resolution (dBZ) 0.5 4–5b
Doppler resolution (m·s-1) 0.5 ca. 9–18 Number beam elevations all 5–14c lowest 4 Archived yes yes Near real time availability yes/nod yes
aFormerly available in near real time only through NIDS (NEXRAD Information Dissemination Service). The National Weather Service (NWS) also provides access in near real time via ftp (see http://www.nws.noaa.gov/tg/rpccds.html). Competi-tion among ftp users (see ‘a’ above) for scarce bandwidth limits this as a viable source for large quantities of data.
bResolution varies with the radar’s mode. Precipitation mode: updates every 5-6 min, 5 dBZ resolution in Level III. Clear-air mode: updates every 10 min, 4 dBZ resolution in Level III.
cThe volume scan strategy, and therefore the number of eleva-tions or tilts, varies with mode.
dAs of writing, a maturing pilot project to disseminate Level II data to the end user in near real time (Droegemeier et al. 2002) includes as data recipients private companies and public re-search institutions.
Spatial constraints in WSR-88D data are determined in part by pulse volume dimensions, beam elevation, volume scan strategy (see ‘WSR-88D Products and Operation’ above), range, and distribution of radars in the system (fig. 1). The size of pulse volumes imposes hardware design limitations on small scale spatial reso-lution. This is not to suggest that this spatially-con-straining property of the radar necessarily prevents
study of patterns at sub-volumetric scales. However, achieving spatial resolutions beyond that imposed by this technological boundary will likely require software with some sophistication.
As with spatial resolution, the adequacy of existing temporal resolution in WSR-88D data varies depending on the phenomena being observed. Short term beha-viors such as takeoff and landing patterns may or may not be adequately sampled (e.g. see ‘Habitat-Migrant Associations’ below). Other biological patterns or phe-nomena might require decades to measure, such as changes in migration intensity in response to large scale changes in land use, changes in migratory routes or timing of migration in response to climate change, changes in habitat use with succession, habitat loss, or restoration. Weather radar technology should prove well suited and valuable for monitoring such changes; however, on these time scales, the radar equipment itself changes (e.g. receiver sensitivity, coverage, polarization diversity [Zrnic and Ryzhkov 1999]), and care will be required to avoid bias introduced by an evolving technology.
Changes in the radar’s mode of operation (see ‘WSR-88D Products and Operation’ above) coupled with the manner in which Level III presents data from different modes result in competing resolution issues–as tem-poral resolution increases, resolution in reflectivity decreases. In clear-air mode, data update about every 10 min and reflectivity is binned into 4 dBZ wide cate-gories and span a range well suited to those useful for monitoring birds, bats, and insects (e.g. figs. 2, 4, 5, and 6). In precipitation mode, data update every 5-6 min, but range bins are wider, 5 dBZ, and reflectivities below 5 dBZ are suppressed. Thresholding and the larger bin sizes in precipitation mode accommodate a greater range of reflectivities for meteorological appli-cations but limit resolution of bird reflectivity patterns that may be biologically important.
Because Level III data present reflectivity in 4 and 5 dBZ wide bins in clear-air and precipitation mode re-spectively (8 to 10 times more coarse than Level II data, table 1), bird densities that vary by a factor of 2.5 to 3.2 are not resolved as different levels of reflectivity. This lack of precision obscures subtle variations in the distributions of birds (e.g. Diehl et al. 2003) and contri-butes to uncertainty in the relationship between bird densities and WSR-88D reflectivity (Gauthreaux and Belser 1998, Diehl et al. 2003).
Identity of Echoes
Lifetimes could be spent identifying the sources of sur-veillance radar echoes. WSR-88D echoes originate from many sources including smoke, dust, insects,
USDA Forest Service Gen. Tech. Rep. PSW-GTR-191. 2005
881
WSR-88D for Ornithological Research – Diehl and Larkin
birds, bats, many forms of precipitation, chaff, clutter of all kinds, and so on. In addition, echoes from differ-ent taxonomic groups of birds are often so broadly overlapping in WSR-88D radar characteristics that they exhibit little identifying signature per se without con-sidering the broader non-radar context of those echoes (Russell et al. 1998, Harmata et al. 1999; see also Emlen 1974). Landbirds, waterfowl, and roosting birds might remain as mysterious unidentified radar “angels” (to borrow a term from the early history of radar met-eorology, Eastwood 1967, pp. 60-76) without informa-tion on the timing of migration, feeding behavior, and habitat preferences. Although the list is not exhaustive, bird echoes exhibit the following characteristics:
occur in strength only certain times of year
occur in strength only certain times of day
tend to emanate from particular habitats in particular ways depending on taxa
tend to appear over large geographic areas
tend to appear when weather is suitable for migration
tend to exceed in strength echoes caused by insects (but there is overlap)
exhibit velocities (speed and direction) that differ considerably from the wind’s (Gauth-reaux and Belser 1998, see below)
exhibit patterns consistent with known migra-tory behavior aloft (e.g. aspect effects [see above], dawn ascent and reorientation [Diehl et al. 2003])
tend to decrease in reflectivity radially be-cause most birds are low flying and concen-trate in the lower two kilometers of the tropo-sphere (see ‘Range Bias’ above)
exhibit characteristic spectrum widths (Larkin and Diehl in press)
Most non-bird echoes are avoided by including only data that meet most of these criteria (although ground clutter can remain a problem, see below). However, because birds and insects often migrate together, analy-ses of bird migrations almost invariably include some insects. Research in progress seeks to learn the degree to which insects contribute to reflectivities, radial velocities, and spectrum widths.
In quantifying bird migrations using WSR-88D, the contribution of insects which bias measured reflectivi-ties, velocities, and spectrum widths attributed to birds
should be minimized. This might be accomplished in several ways. First, include only the strongest migra-tions that produce echo strengths generally not attain-able by insects (Larkin 1983, Gauthreaux and Belser 1998). A preferable alternative method considers the velocities of birds and insects with respect to the wind. Prevailing winds largely determine the speed and direc-tion of migrating insects. Birds by comparison exhibit velocities that differ from wind in speed, direction, or both. In this way insect-dominated migrations can be detected and removed from analysis (Gauthreaux and Belser 1998). Finally, migrations dominated by insects often differ from those dominated by birds in spectrum width (Larkin and Diehl in press).
Future versions of WSR should boast polarization di-versity, the ability to transmit and receive radio energy where the electric field varies in its polarization with respect to the surface of the earth (the 88D is currently fixed at horizontal polarization). Research surveillance radars equipped with polarization diversity already demonstrate potential to separate bird from insect echoes (Mueller and Larkin 1985, Zrnic and Ryzhkov 1999).
Sunset
Because each radar measures bird movements at large spatial scales, the setting sun might introduce bias in reflectivity along an east-west gradient as birds take flight following the terminator. As an example, con-sider the influence of the terminator passing through typical WSR-88D coverage at 42° latitude on the appearance of birds on radar shortly after takeoff. At this latitude, the east-west span of echoes shortly after takeoff when birds are most closely associated with their source habitats is approximately 130 km. The terminator passes over this coverage area in about 6 minutes at ~20 km·min-1. Compared to the duration of takeoff (ca. 30 min.; Hebrard 1971, Akesson et al. 1996), the terminator passes rather quickly and could introduce bias in measures of bird reflectivity at a single radar. However, studies comparing data from multiple radars at similar latitudes will have to adjust for this effect.
Aspect
Birds and insects scatter different amounts of radar echo depending on which aspect of these animals’ bo-dies faces the radar. Animals detected side-on reflect more radar energy than when detected head- or tail-on (Edwards and Houghton 1959). It follows that similar bird and insect densities aloft may produce reflectivit-ies that vary greatly in strength at different azimuths
USDA Forest Service Gen. Tech. Rep. PSW-GTR-191. 2005
882

WSR-88D for Ornithological Research – Diehl and Larkin
depending on the orientation of animals’ bodies with respect to the radar (fig. 2; Edwards and Houghton 1959, Schaefer 1976, Mueller and Larkin 1985, Buur-ma 1995). The effect is most apparent during mid-migratory flight and is especially pronounced in figure 2 (right).
Aspect effects indicate that targets are biological, how-ever, such effects complicate use of surveillance radar in relating bird numbers to radar reflectivity or compar-ing reflectivities at different azimuths (Diehl et al. 2003). Figure 2 (right) shows aspect responsible for order-of-magnitude differences (12 dBZ between azimuths 353° and 79°) at similar ranges in reflectivity during cruising flight. Bias caused by aspect effects (if present at all) may be swamped by the strong influence of other factors on birds’ behaviors, particularly during times other than cruising flight. For example, the distribution of stopover habitat in the landscape is often strongly reflected in the pattern of echoes during takeoff.
The strength of aspect effects varies depending on the proportion of targets that assume similar headings, the dimensions of targets, and possibly the size of targets with respect to the wavelength of the radar (further de-scription of this later point is beyond the scope of this paper, but see Doviak and Zrnic 1993, pg. 35). Under certain migratory conditions, aspect effects may be-come more apparent as birds encounter circumstances that cause them to be oriented similarly, such as during dawn reorientation (Myres 1964, Diehl et al. 2003). Also, the proportion of high aspect (length/width ratio) targets such as insects in the migratory pool, when oriented similarly, will amplify aspect effects.
Regarding figure 2, it remains unclear why the effects of aspect differ so dramatically in these images from two separate radars while occurring at the same time within ~400 km of each other. The spatial coverage and rate of decrease in reflectivity with range also differs considerably between the images. Such differences may reflect real biology, for instance that on this night birds migrated lower over SW Wisconsin than over central Illinois. Alternatively, such patterns might emerge if the amount of refraction varied at the two cites or if KARX was sited considerably higher than KILX. (KARX height exceeds KILX’s by only 52 m, not enough to fully account for a ~50 km difference in maximum range of detection.) Such uncertainties high-light some of the discrepancies that emerge when com-paring observations between different radars.
Clutter
One scientist’s noise is another’s signal. This succinct-ly describes the often competing interests of radar
meteorologists and radar biologists where “clutter” is a matter of opinion. Rinehart (1997) describes clutter as “…echoes that interfere with observation of desired signals on a radar…”. Clutter includes airborne targets (e.g. from a meteorological or ornithological perspec-tive - chaff, smoke, aircraft) although the term is usu-ally used in reference to targets on the ground or the ground itself where topographic relief obstructs the radars beam either partially or completely.
Human infrastructure represents a common source of unwanted ground clutter echoes which appear in WSR-88D data. Recurring ground clutter idiosyncratic to each radar can be mapped locally. These clutter maps then mask out areas of strong clutter. Nonetheless echoes caused by more dynamic sources such as vehi-cles on overpasses or trains find their way through ex-isting WSR-88D clutter filters (Chrisman et al. 1995) and into data. Ground clutter echoes are often strong and their inclusion in the data could severely bias measures of reflectivity attributed to birds if not avoid-ed or removed through further filtering. Because ground clutter concentrates near the radar, conservative approaches to avoiding the effects of clutter might include discarding echoes within a certain range or along particular azimuths. Unfortunately, these rather straightforward approaches often discard bird echoes along with the clutter. More sophisticated approaches employ software to identify and specific “clutter like” radar data while leaving biological or other desired echoes.
Relief in terrain often obstructs a radar’s beam either partially or entirely (Klazura and Imy 1993) depending on the obstructing object’s size, height, and distance from the radar, and the elevation of the beam and beam width at the range of the obstruction. Complete ob-struction of the beam is easily seen, usually as a wedge devoid of echo (fig. 6). Similar wedge shaped areas of reduced reflectivity occur during partial beam block-age. Because partial blockage effectively eliminates low height targets as sources of echo, range is also reduced at these azimuths (fig. 6). Sometimes radars detect targets behind obstructing objects when diffrac-tion spreads the radio energy that comprises the radar’s beam into the geometric shadow of those obstructions.
For these reasons, beam blockage limits the efficacy of some radars for ornithological studies; at least reported reflectivities at such radars should be open to suspi-cion. The simplest way to minimize ground clutter as a source of bias is to avoid quantifying suspect regions of radar coverage. Alternatively, using data from higher elevation sweeps of the radar’s beam reduces the beam’s encounters with ground based clutter. Unfortu-nately, this also reduces the radar’s usefulness for low-height applications such as habitat-migrant associations (see below).
USDA Forest Service Gen. Tech. Rep. PSW-GTR-191. 2005
883
WSR-88D for Ornithological Research – Diehl and Larkin
During atmospheric conditions that promote non-standard or anomalous propagation of the beam (see ‘Refraction’ below), ground clutter may appear in un-usual places or at exceptionally long ranges from the radar. Therefore quantifying reflectivities at longer ranges (and presumably at greater heights, see ‘Range Bias’ above) does not necessarily eliminate the likeli-hood of encountering ground clutter. Ground clutter may variously appear at many ranges depending on whether and how the atmosphere influences refraction.
Refraction
Radar radio energy propagates in straight lines only in a uniform medium. The earth’s atmosphere is not uni-form, so the direction radar energy propagates changes as it passes through the atmosphere. Under certain cir-cumstances, the propagation path of a refracting radar beam can be calculated. During standard atmospheric conditions, temperature and moisture gradients that decrease monotonically with increased height produce a “standard refraction” gradient which tends to bend the beam along a path, R’, equal to 4/3R where R is earth’s radius. For this reason, estimates of beam height must take standard refraction into account (see Eqn. 1 and ‘Range Bias’ above).
Steeper than normal gradients in moisture or tempera-ture cause superrefraction, resulting in anomalous propagation of the radar’s beam. A superrefractive atmosphere can change the propagation of a radar’s beam strongly enough to detect low targets such as migrating birds at exceptionally long ranges (4/3R > R’
R). For example in figure 2, a superrefractive atmosphere around KLOT might explain differences in the maximum range radars at KARX and KLOT detected birds. In more extreme cases, radar energy can be refracted back toward earth resulting in ground clutter echoes (R’ < R) or propagated along layers in the atmosphere called ducts. In figure 6, a radar beam likely propagating though an atmospheric duct echoes off relief along the coast of Michipicoten Island and Pukaskwa National Park, Canada.
Habitat-Migrant Associations
Probably the most anticipated ornithological applica-tion of WSR-88D to date involves associating patterns of bird echoes at takeoff with the stopover habitats from which they departed (Moore et al. 1995; see also Moore 2000). WSR reveals birds’ stopover habitats as nocturnal migration begins with a sudden exodus around evening twilight. After several minutes, birds climb high enough to be visible as radar echoes, where stronger echoes represent more birds. At this early
stage of a night's migration, bird reflectivities through-out the coverage range of a radar can vary by orders of magnitude, with stronger echoes occurring over habitat that held more birds during the day. In short, radars reveal stopover habitat use from the birds’ migratory behavior at takeoff, and this capability can be exploited to estimate relative bird densities associated with speci-fic landscapes or habitat types (Gauthreaux and Belser 1998).
This method leads to large scale quantitative informat-ion on where migratory birds stopover, in what num-bers or densities, and what land use and other charac-teristics of the landscape act to explain observed distributions of birds. By quantitatively identifying areas exhibiting high landbird use during stopover, these observations have implications for on-the-ground landbird conservation. Accurately quantifying habitat-migrant associations, however, requires that biologists who apply WSR for these purposes overcome or at least consider several challenges.
Displacement and Dispersion
Birds initiating migration move away from their stop-over habitats at speeds and directions that vary with season, prevailing winds, and other factors. Birds may require several minutes flight time after takeoff to gain sufficient altitude to become visible as radar echoes. As a result of flight beneath the radar’s beam, migrating birds might first appear as echoes several kilometers from their departing stopover habitats. The resulting spatial separation or displacement between bird echoes and their source habitats, if corrected, yields more appropriate associations between stopover habitats and the number of birds (i.e. amount of reflectivity) ema-nating from those habitats. This is depicted conceptu-ally in figure 7 where, in the absence of correction, direct spatial association between the landcover and bird echoes would result in the strongest echoes (red) improperly being associated with agriculture. As the shaded gray of figure 7 implies, habitat-migrant asso-ciations improve in accuracy if made earlier in the takeoff phase. The trade-off to this strategy is that earlier in the migration, birds are closer to the ground and even less visible to radar at range due to earth’s curvature. To account for this spatial separation be-tween bird echoes during takeoff and the stopover habitats from which birds emerged, reflectivities can be shifted to directly overlay departure locations. How-ever, methods for determining the amount of displace-ment should avoid assumptions about which habitats are associated with which bird echoes.
The amount of displacement may vary with range from the radar. In the absence of refraction and other con-founding factors, birds detected at longer ranges are flying at higher altitudes (fig. 5) and presumably have
USDA Forest Service Gen. Tech. Rep. PSW-GTR-191. 2005
884
WSR-88D for Ornithological Research – Diehl and Larkin
Figure 5 A conceptual cross-section above (not to scale) is matched to real echo typical of bird migration around the middle of the night. The radar, indicated by a black dot, is detecting birds out to ca. 150 km. Because the earth curves out from under the radar beam, a layer of echo that is limited in height (here a hypothetical migratory bird layer) will be visible only out to a certain distance. Colors show decreasing echo strength with increased range from the radar as the beam passes over the migratory layer.
Figure 6 Ground clutter dominates reflectivity patterns of migrating birds around KMQT (Marquette, Michigan). An intermittently obstructed beam leaves wedges of reduced or absent reflectivity at many azimuths. At longer ranges northeast of the radar, a refracted beam illuminates relief along the coast of Michipicoten Island and the Pukaskwa National Park area shoreline in Canada.
Figure 7 A hypothetical cross-section of radar echoes caused by birds over an agricultural landscape containing scattered forest fragments. During takeoff, birds become dispersed (gray) and become spatially offset or displaced from their source stopover habitat. Birds departing smaller fragments and insects contribute to the din of echo (yellow) not specifically associated with a particular patch.
been aloft longer. Because the distance birds fly after takeoff determines the magnitude of the displacement, birds aloft longer have presumably flown further. Therefore, birds detected at longer ranges may be more displaced from their source habitats than those at short-er ranges. Implementing range-specific corrections for this possibility adds considerable complexity to achiev-ing best possible habitat-migrant associations.
If delayed much past twilight, habitat-migrant associa-tions are further muddied by the manner in which birds depart from source habitats. First, birds continuously streaming out of habitats will tend to blur habitat
associations by making it impossible to offset the data to account for displacement without appreciably influ-encing other nearby habitat-migrant associations. Sec-ond, echoes from nearly adjacent habitat patches will blend, complicating association with habitat. For this reason, small-scale habitat-migrant associations are limited by both the spatial resolution of commonly available data (see ‘Resolution’ above and table 1) and the dispersion of migrants into airspace that, in the case of small source habitats, may span over several times the land area of the source stopover habitat (e.g. fig. 4,see also fig. 7). We view the latter as one of the more
USDA Forest Service Gen. Tech. Rep. PSW-GTR-191. 2005
885
WSR-88D for Ornithological Research – Diehl and Larkin
profound obstacles to using WSR-88D to make small scale habitat-migrant associations.
Data Selection
Once echoes are determined to be caused predomi-nantly by birds, radar data suitable for habitat-migrant associations must be selected. As indicated above, these data typically occur during takeoff when birds are still spatially associated with the habitats they recently departed. Usually, only two or perhaps three sweeps of the radar’s beam capture data suitable for association with habitat. The process of choosing which of these sweeps best represents the distribution of birds in stopover habitat before takeoff balances (1) selecting data where migration is sufficiently developed against (2) selecting data where migration has not advanced so far as to allow displacement and dispersion (see above) to compromise tight habitat-migrant associations. Ide-ally, objective data selection emerges from simple criteria having a biological basis.
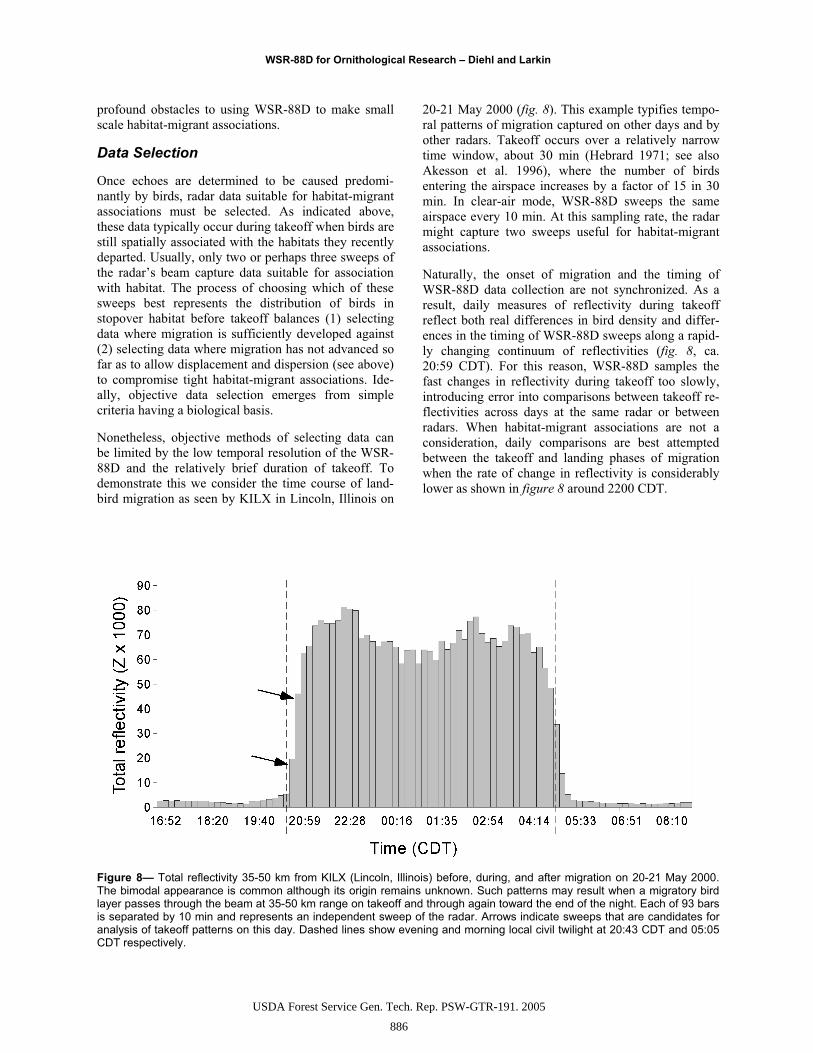
Nonetheless, objective methods of selecting data can be limited by the low temporal resolution of the WSR-88D and the relatively brief duration of takeoff. To demonstrate this we consider the time course of land-bird migration as seen by KILX in Lincoln, Illinois on
20-21 May 2000 (fig. 8). This example typifies tempo-ral patterns of migration captured on other days and by other radars. Takeoff occurs over a relatively narrow time window, about 30 min (Hebrard 1971; see also Akesson et al. 1996), where the number of birds entering the airspace increases by a factor of 15 in 30 min. In clear-air mode, WSR-88D sweeps the same airspace every 10 min. At this sampling rate, the radar might capture two sweeps useful for habitat-migrant associations.
Naturally, the onset of migration and the timing of WSR-88D data collection are not synchronized. As a result, daily measures of reflectivity during takeoff reflect both real differences in bird density and differ-ences in the timing of WSR-88D sweeps along a rapid-ly changing continuum of reflectivities (fig. 8, ca. 20:59 CDT). For this reason, WSR-88D samples the fast changes in reflectivity during takeoff too slowly, introducing error into comparisons between takeoff re-flectivities across days at the same radar or between radars. When habitat-migrant associations are not a consideration, daily comparisons are best attempted between the takeoff and landing phases of migration when the rate of change in reflectivity is considerably lower as shown in figure 8 around 2200 CDT.
Figure 8— Total reflectivity 35-50 km from KILX (Lincoln, Illinois) before, during, and after migration on 20-21 May 2000. The bimodal appearance is common although its origin remains unknown. Such patterns may result when a migratory bird layer passes through the beam at 35-50 km range on takeoff and through again toward the end of the night. Each of 93 bars is separated by 10 min and represents an independent sweep of the radar. Arrows indicate sweeps that are candidates for analysis of takeoff patterns on this day. Dashed lines show evening and morning local civil twilight at 20:43 CDT and 05:05 CDT respectively.
USDA Forest Service Gen. Tech. Rep. PSW-GTR-191. 2005
886

WSR-88D for Ornithological Research – Diehl and Larkin
Summary
Over the past few years, Imagery of bird migration from the WSR-88D system rekindled interest in radar ornithology in the United States. However, correctly using these data to advance knowledge of avian behavior during flight, stopover biology, and bird con-servation and education challenges research biologists. In this paper we explored many factors, often inter-acting, that may influence interpretation and quan-tification of WSR-88D echoes for ornithological research.
We hope that practical boundaries to the range of or-nithological applications for WSR emerge from this paper. The physics and geometry constraining most weather radars’ views of the world remains fixed and must be accommodated when applied to biological res-earch, yet we hesitate to suggest many absolute limits to its use in such studies. The potential of WSR-88D and related systems for ornithological research remains largely unexplored, and weather surveillance radar itself is an evolving technology (Serafin and Wilson 2000).
In the future, improved radars and methods of distrib-uting data will advance radar ornithology considerably. Higher precision Level II data is already becoming broadly available (Droegemeier et al. 2002) and other surveillance radar systems (specifically TDWR or Terminal Doppler Weather Radar; see Serafin and Wilson 2000, Droegemeier et al. 2002) may provide more resolute and complementary coverage of migra-tion. If and when existing radars in the WSR-88D system are outfitted with dual-polarization (Zahrai and Zrnic 1997), new base products will become available. These may be capable of enhancing the radar’s ability to discriminate migration dominated by birds versus insects (Zrnic and Ryzhkov 1998), improve ground clutter filtering and suppress 2nd trip echo (Zrnic et al. 1998), and reveal biological behaviors with greater clarity (e.g. aspect effects, see Zrnic and Ryzhkov 1999).
Acknowledgments
We thank J. Black for helpful discussions and anony-mous reviewers for their comments on an earlier draft of this paper. We also thank M. Woodrey for inviting us to present on this subject at the 3rd International Partners in Flight Conference, and thanks to our colleagues at the Moss Point, Mississippi workshop for providing perspective toward content. R. Parsons and Weathertap.com generously provided data from WSR-88D for support of this and other radar biological work. This work was supported in part by National Science Foundation grant DEB-0073114.
Literature Cited Akesson, S., T. Alerstam, and A. Hedenstrom. 1996. Flight
initiation of nocturnal passerine migrants in relation to celestial orientation conditions at twilight. Journal of Avian Biology 27: 95-102.
Black, J. E. and N. Donaldson. 1999. Comments on display of bird movements on the WSR-88D: Patterns and quantification. Weather and Forecasting 14: 1039-1940.
Bruderer, B. 1997a. The study of bird migration by radar Part 1: The technical basis. Naturwissenschaften 84: 1-8.
Bruderer, B. 1997b. The study of bird migration by radar Part 2: Major achievements. Naturwissenschaften 84:45-54.
Buurma, L. S. 1995. Long-range surveillance radars as indica-tors of bird numbers aloft. Israel Journal of Zoology 41: 221-236.
Chrisman, J. N., D. M. Rinderknecht, and R. S. Hamilton. 1995. WSR-88D clutter suppression and its impact on meteor-ological data interpretation. In: The First WSR-88D User's Conference. Norman, Oklahoma; 9-20.
Crum, T. D. and R. L. Alberty. 1993. The WSR-88D and the WSR-88D Operational Support Facility. Bulletin of the American Meteorological Society 74: 1669-1687.
Crum, T. D., R. L. Alberty, and D. W. Burgess. 1993. Recording, archiving, and using WSR-88D data. Bulletin of the American Meteorological Society 74: 645-653.
Diehl, R. H., R. P. Larkin, and J. E. Black. 2003. Bird migration over the Great Lakes. Auk 120: 278-290.
Doviak, R. J. and D. S. Zrnic. 1993. Doppler radar and weather observations. San Diego, California: Academic Press.
Droegemeier, K. K., K. Kelleher, T. D. Crum, J. J. Levit, S. A. Del Greco, L. Miller, C. Sinclair, M. Benner, D. W. Fulker, and H. Edmon. 2002. Project CRAFT: A test bed for demonstrating the real time acquisition and archival of WSR-88D Level II data. In: 18th International Conference on Interactive Information Processing Systems (IIPS) for Meteorology, Oceanography, and Hydrology. Orlando, Florida: American Meteorological Society; 136-139.
Eastwood, E. 1967. Radar ornithology. London, UK: Methuen.
Edwards, J. and E. W. Houghton. 1959. Radar echoing area polar diagrams of birds. Nature 184: 1059.
Emlen, S. T. 1974. Problems in identifying bird species by radar signature analyses: intra-specific variability. In: Proceedings of a Conference on the Biological Aspects of the Bird/Aircraft Collision Problem. South Carolina: Clem-son University; 509-524.
Gauthreaux, S. A., Jr. 1970. Weather radar quantification of bird migration. BioScience 20: 17-20.
Gauthreaux, S. A., Jr. 1971. A radar and direct visual study of passerine spring migration in southern Louisiana. Auk 88: 343-365.
USDA Forest Service Gen. Tech. Rep. PSW-GTR-191. 2005
887
WSR-88D for Ornithological Research – Diehl and Larkin
Gauthreaux, S. A. and C. G. Belser. 1998. Displays of bird movements on the WSR-88D: Patterns and quantif-ication. Weather and Forecasting 13: 453-464.
Gauthreaux, S. A., Jr. and C. G. Belser. 1999. Reply to "Com-ments on display of bird migration on the WSR-88D: patterns and quantification". Weather and Forecasting 14: 1041-1042.
Gauthreaux, S. A., Jr. and C. G. Belser. 2003. Radar ornithol-ogy and biological conservation. Auk 120:266-277.
Gauthreaux, S. A., Jr., C. G. Belser, and D. Van Blaricom. 2003. Using a network of WSR-88D weather surveillance radars to define patterns of bird migration at large spatial scales. Pp. 335–346 in Avian migration (P. Bert-hold, E. Gwinner, and E. Sonnenschein, Eds.). Springer-Verlag, Germany.
Harmata, A. R., K. M. Podruzny, J. R. Zelenak, and M. L. Morrison. 1999. Using marine surveillance radar to study bird movements and impact assessment. Wildlife Society Bulletin 27: 44-52.
Hebrard, J. J. 1971. The nightly initiation of passerine migra-tion in spring: A direct visual study. Ibis 113: 8-18.
Klazura, G. E. and D. A. Imy. 1993. A description of the initial set of analysis products available from the NEXRAD WSR-88D System. Bulletin of the American Meteorol-ogical Society 73: 1293-1311.
Lack, D. and G. C. Varley. 1945. Detection of birds by radar.Nature 156: 446.
Larkin, R. P. 1983. Evaluation of NEXRAD for bird hazard warning. Report to United States Air Force, AFESC; 49 p.
Larkin, R. P. 1991. Sensitivity of NEXRAD algorithms to echoes from birds and insects. In: 25th International Con-ference on Radar Meteorology. Paris, France: American Meteorological Society; 203-205.
Larkin, R. P. and R. H. Diehl. In press. Spectrum width of flying animals on Doppler radar. In: Proceedings of 15th Conference on Biometeorology/Aerobiology and 16th Congress of Biometeorology. Kansas City, Missouri.
Larkin, R. P., B. Evans, and R. H. Diehl. 2002. Nocturnal flight calls of Dickcissels and Doppler radar echoes. Journal of Field Ornithology 73: 2-8.
Lowery, G. H., Jr. 1951. A quantitative study of the nocturnal migration of birds. University of Kansas Publications of the Museum of Natural History 3: 361-472.
Lowery, G. H., Jr. and R. J. Newman. 1966. A continent wide view of bird migration on four nights in October. Auk83: 547-586.
Moore, F. R., editor. 2000. Stopover ecology of nearctic-neo-tropical landbird migrants: Habitat relationships and conservation implications. Studies in Avian Biology No. 20; 133 p.
Moore, F. R., S. A. Gauthreaux, P. Kerlinger, and T. R. Simons. 1995. Habitat requirements during migration: Import-ant link in conservation. In: T. E. Martin and D. M. Finch, editors. Ecology and management of neotropical migratory Birds. New York, USA: Oxford University Press; 121-144.
Mueller, E. A. and R. P. Larkin. 1985. Insects observed using dual-polarization radar. Journal of Atmospheric and Oceanic Technology 2: 49-54.
Murray, D., J. McWhiter, S. Wier, S. Emmerson. 2003. The Integrated Data Viewer: A web-enabled application for scientific analysis and visualization. Draft manuscript for 19th International Conference on Interactive Information and Processing Systems for Meteterology, Oceanography, and Hydrology.
Myres, M. T. 1964. Dawn ascent and reorientation of Scand-anavian thrushes (Turdus spp.) migrating at night over the northeastern Atlantic Ocean in autumn. Ibis 106: 7-51.
Nisbet, I. C. T. 1963. Quantitative study of migration with 23-centimetre radar. Ibis 105: 435-460.
Norberg, U. M. 1990. Vertebrate flight: Mechanics, physiol-ogy, morphology, ecology, and evolution. Zoophysiology vol. 27. New York, NY: Springer-Verlag.
Rinehart, R. E. 1997. Radar for meteorologists. Grand Forks, ND: Rinehart Publishing.
Russell, K. R., D. S. Mizrahi, and S. A. Gauthreaux. 1998. Large-scale mapping of Purple Martin premigratory roosts using WSR-88d weather surveillance radar.Journal of Field Ornithology 69: 316-325.
Schaefer, G. W. 1976. Radar observations of insect flight. In: R. C. Rainey, editor. Insect Flight. London, UK: Blackwell Scientific Publications; 157-197.
Serafin, R. J. and J. W. Wilson. 2000. Operational weather radar in the United States: Progress and opportunity.Bulletin of the American Meteorological Society 81: 501-518.
Vaughn, C. R. 1985. Birds and insects as radar targets: A review. Proceedings of the Institute of Electical and Electronics Engineers (IEEE) 73: 205-227.
WATADS (WSR-88D Algorithm Testing and Display System). 2000. Reference guide for version 10.2. Storm Scale Applications Division, National Severe Storms Laboratory.
Wurman, J., J. M. Straka, and E. N. Rasmussen. 1996. Fine-scale Doppler radar observations of tornadoes. Science 272: 1774-1777.
Zahrai, A. and D. Zrnic. 1997. Implementation of polarimetric capability for the WSR-88D (NEXRAD) radar. In: 13th International Conference on Interactive Information and Processing Systems for Meteorology, Oceanography, and Hydrology, paper 9.5. Long Beach, CA: American Meteor-ological Society.
Zrnic, D. S. and A. V. Ryzhkov. 1998. Observations of insects and birds with a polarimetric radar. IEEE Transactions on Geoscience & Remote Sensing 36: 661-668.
Zrnic, D. S. and A. V. Ryzhkov. 1999. Polarimetry for weather surveillance radars. Bulletin of the American Meteorol-ogical Society 80: 389-406.
Zrnic, D. S., A. Zahrai, R. J. Doviak, J. Carter, and S. Torres. 1998. Polarimetric upgrades of the NOAA's WSR-88D Research and Development Radar. In: 14th International Conference on Interactive Information Processing Systems for Meteorology, Hydrology, and Oceanography. Phoenix, Arizona: American Meteorological Society; 55-58.
USDA Forest Service Gen. Tech. Rep. PSW-GTR-191. 2005
888