introduction to uds clinical measures · health information technology (hit) capabilities,...
TRANSCRIPT
1
Bureau of Primary Health Care (BPHC) December 14, 2016 1–2:30 p.m. (EST)
Introduction to 2016 UDS Clinical Measures
2
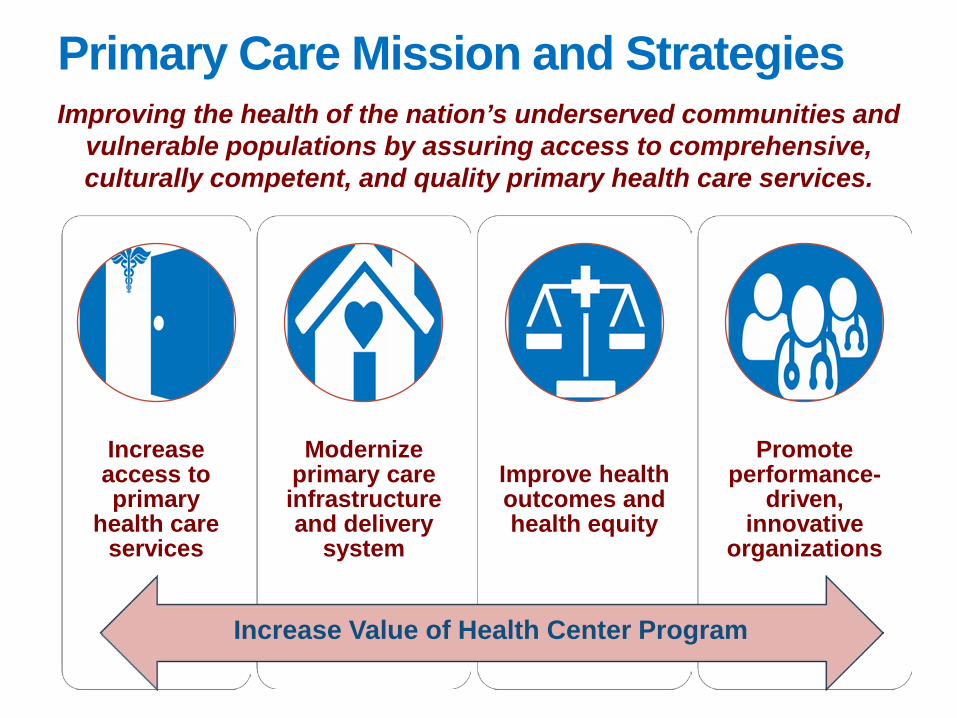
Increase access to primary
health care services
Modernize primary care infrastructure and delivery
system
Improve health outcomes and health equity
Promote performance-
driven, innovative
organizations
Increase Value of Health Center Program
Primary Care Mission and Strategies Improving the health of the nation’s underserved communities and
vulnerable populations by assuring access to comprehensive, culturally competent, and quality primary health care services.
3
• Understand the structure of the clinical tables • Understand the changes to the clinical measures • Identify ways to check data accuracy and reliability • Identify benchmarks for assessing clinical quality
(where available) • BPHC’s three-year health center trends and
program averages • National benchmarks, including Healthy People
2020
Objectives of this Webinar
4
• Introduction to Uniform Data System (UDS) Clinical Tables
• Changes to 2016 UDS Clinical Tables • Clinical Measures Overview • Meeting the Measurement Standard • Data Reporting Methods • Tips to Ensure Data Accuracy • Reminders, Strategies, and References • Questions
Agenda
5
INTRODUCTION TO UDS CLINICAL TABLES AND CHANGES FOR 2016
6
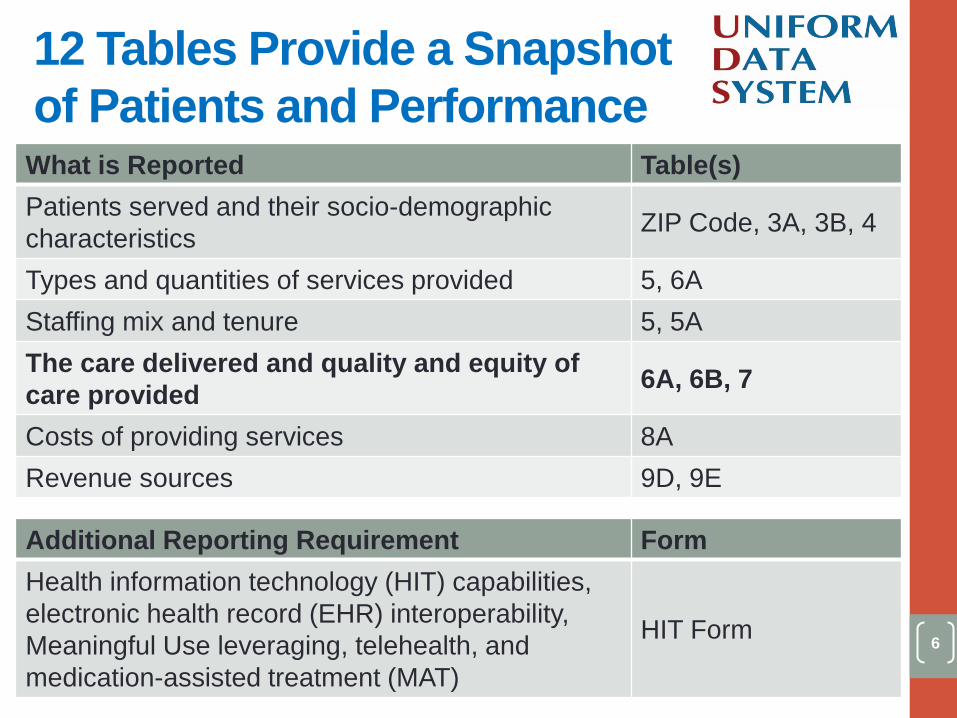
What is Reported Table(s) Patients served and their socio-demographic characteristics ZIP Code, 3A, 3B, 4
Types and quantities of services provided 5, 6A Staffing mix and tenure 5, 5A The care delivered and quality and equity of care provided 6A, 6B, 7
Costs of providing services 8A Revenue sources 9D, 9E
Additional Reporting Requirement Form Health information technology (HIT) capabilities, electronic health record (EHR) interoperability, Meaningful Use leveraging, telehealth, and medication-assisted treatment (MAT)
HIT Form
12 Tables Provide a Snapshot of Patients and Performance
7
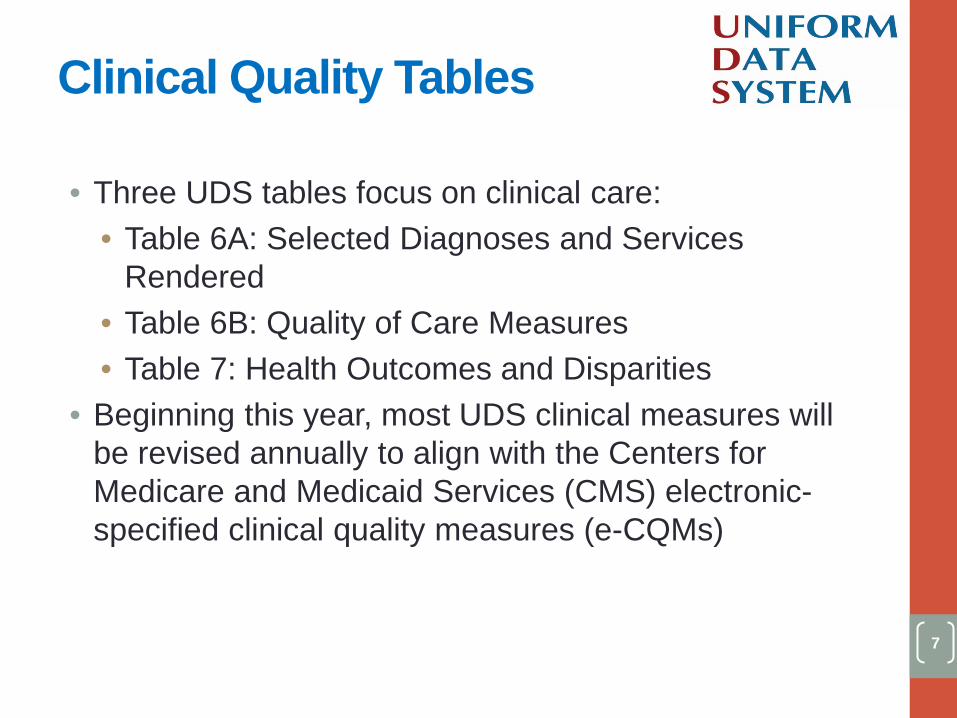
• Three UDS tables focus on clinical care: • Table 6A: Selected Diagnoses and Services
Rendered • Table 6B: Quality of Care Measures • Table 7: Health Outcomes and Disparities
• Beginning this year, most UDS clinical measures will be revised annually to align with the Centers for Medicare and Medicaid Services (CMS) electronic-specified clinical quality measures (e-CQMs)
Clinical Quality Tables
8
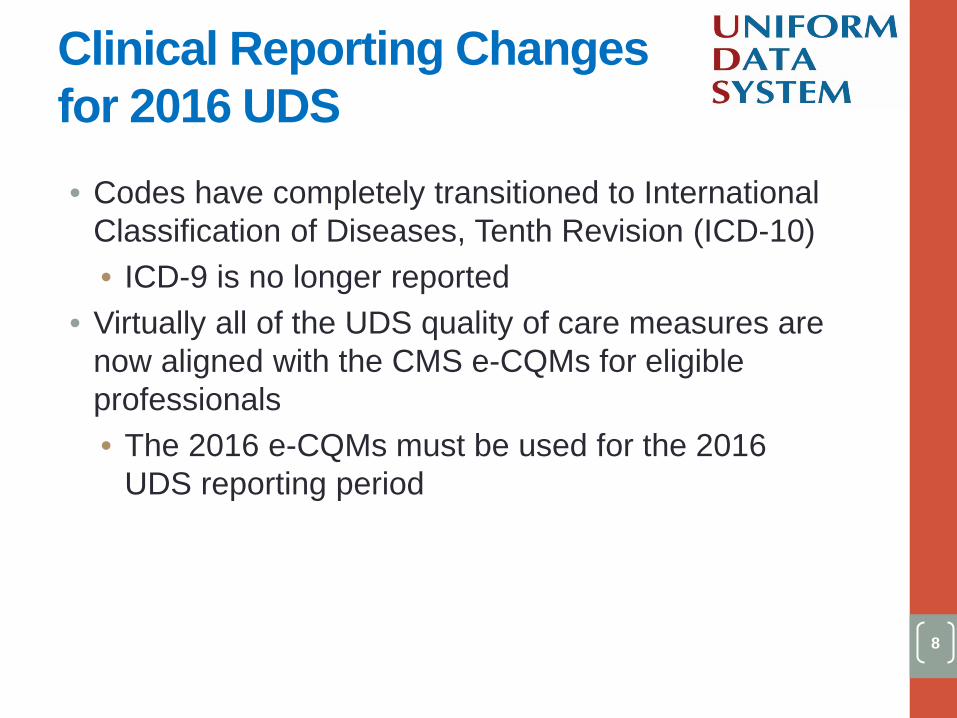
• Codes have completely transitioned to International Classification of Diseases, Tenth Revision (ICD-10) • ICD-9 is no longer reported
• Virtually all of the UDS quality of care measures are now aligned with the CMS e-CQMs for eligible professionals • The 2016 e-CQMs must be used for the 2016
UDS reporting period
Clinical Reporting Changes for 2016 UDS
9
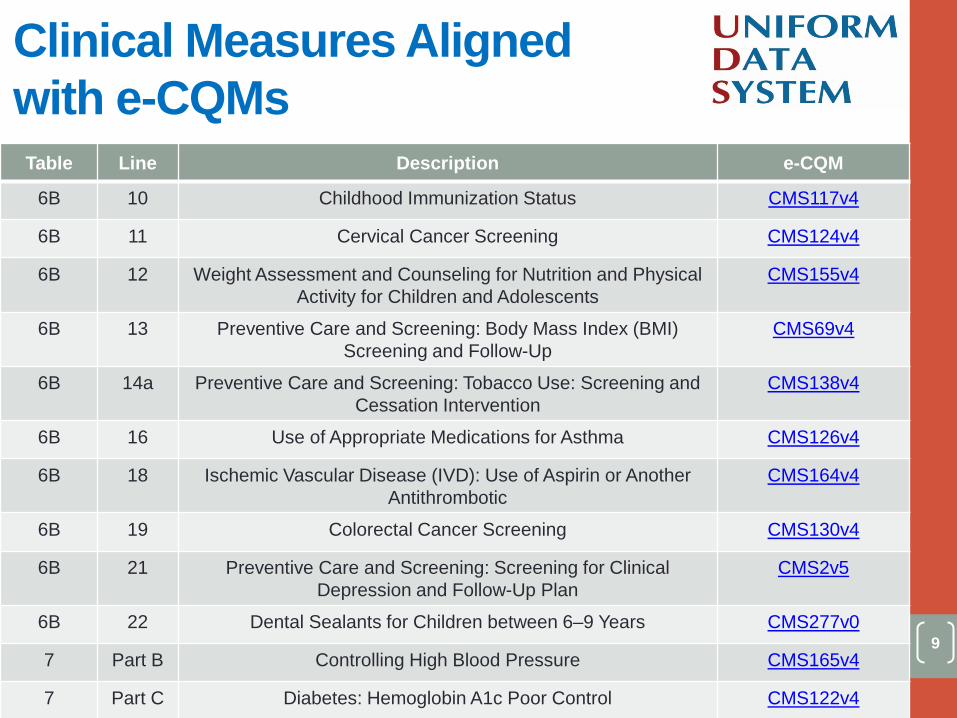
Table Line Description e-CQM
6B 10 Childhood Immunization Status CMS117v4
6B 11 Cervical Cancer Screening CMS124v4
6B 12 Weight Assessment and Counseling for Nutrition and Physical Activity for Children and Adolescents
CMS155v4
6B 13 Preventive Care and Screening: Body Mass Index (BMI) Screening and Follow-Up
CMS69v4
6B 14a Preventive Care and Screening: Tobacco Use: Screening and Cessation Intervention
CMS138v4
6B 16 Use of Appropriate Medications for Asthma CMS126v4
6B 18 Ischemic Vascular Disease (IVD): Use of Aspirin or Another Antithrombotic
CMS164v4
6B 19 Colorectal Cancer Screening CMS130v4
6B 21 Preventive Care and Screening: Screening for Clinical Depression and Follow-Up Plan
CMS2v5
6B 22 Dental Sealants for Children between 6–9 Years CMS277v0
7 Part B Controlling High Blood Pressure CMS165v4
7 Part C Diabetes: Hemoglobin A1c Poor Control CMS122v4
Clinical Measures Aligned with e-CQMs
10
Including Measurement Standards and Tips to Ensure Data Accuracy
CLINICAL MEASURES OVERVIEW
11
Table 6A: Selected Diagnoses and Services Rendered
12
blank
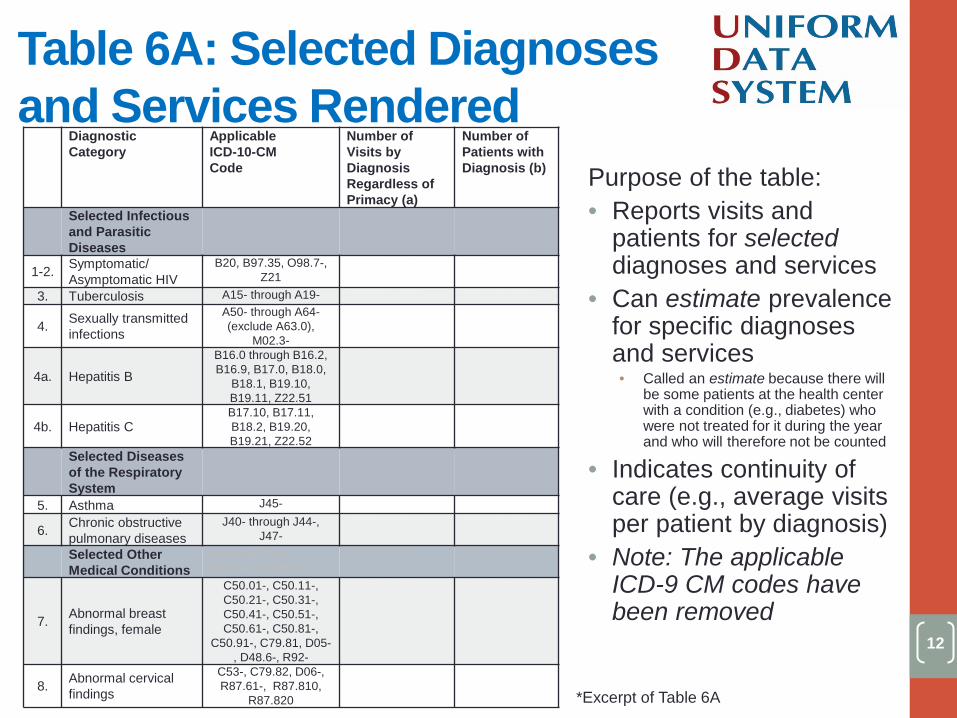
Diagnostic Category
Applicable ICD-10-CM Code
Number of Visits by Diagnosis Regardless of Primacy (a)
Number of Patients with Diagnosis (b)
Selected Infectious and Parasitic Diseases
Selected Infectious and Parasitic Diseases
Selected Infectious and Parasitic Diseases
Selected Infectious and Parasitic Diseases
Selected Infectious and Parasitic Diseases
1-2. Symptomatic/ Asymptomatic HIV
B20, B97.35, O98.7-, Z21
<blank for demonstration> <blank for demonstration>
3. Tuberculosis A15- through A19- <blank for demonstration> <blank for demonstration>
4. Sexually transmitted infections
A50- through A64- (exclude A63.0),
M02.3-
<blank for demonstration> <blank for demonstration>
4a. Hepatitis B B16.0 through B16.2, B16.9, B17.0, B18.0,
B18.1, B19.10, B19.11, Z22.51
<blank for demonstration> <blank for demonstration>
4b. Hepatitis C B17.10, B17.11, B18.2, B19.20, B19.21, Z22.52
<blank for demonstration> <blank for demonstration>
Selected Diseases of the Respiratory System
Selected Diseases of the Respiratory System
Selected Diseases of the Respiratory System
Selected Diseases of the Respiratory System
Selected Diseases of the Respiratory System
5. Asthma J45- <blank for demonstration> <blank for demonstration>
6. Chronic obstructive pulmonary diseases
J40- through J44-, J47-
<blank for demonstration> <blank for demonstration>
Selected Other Medical Conditions
Selected Other Medical Conditions
Selected Other Medical Conditions
Selected Other Medical Conditions
7. Abnormal breast findings, female
C50.01-, C50.11-, C50.21-, C50.31-, C50.41-, C50.51-, C50.61-, C50.81-,
C50.91-, C79.81, D05-, D48.6-, R92-
<blank for demonstration> <blank for demonstration>
8. Abnormal cervical findings
C53-, C79.82, D06-, R87.61-, R87.810,
R87.820
<blank for demonstration> <blank for demonstration>
Purpose of the table: • Reports visits and
patients for selected diagnoses and services
• Can estimate prevalence for specific diagnoses and services • Called an estimate because there will
be some patients at the health center with a condition (e.g., diabetes) who were not treated for it during the year and who will therefore not be counted
• Indicates continuity of care (e.g., average visits per patient by diagnosis)
• Note: The applicable ICD-9 CM codes have been removed
*Excerpt of Table 6A
Table 6A: Selected Diagnoses and Services Rendered
13
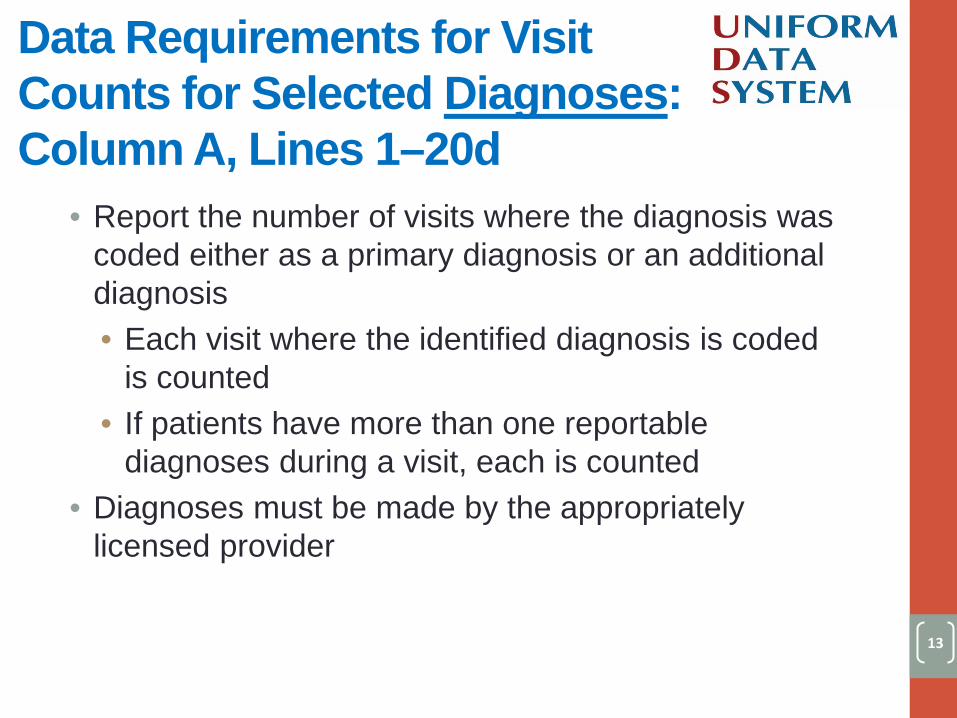
• Report the number of visits where the diagnosis was coded either as a primary diagnosis or an additional diagnosis • Each visit where the identified diagnosis is coded
is counted • If patients have more than one reportable
diagnoses during a visit, each is counted • Diagnoses must be made by the appropriately
licensed provider
Data Requirements for Visit Counts for Selected Diagnoses: Column A, Lines 1–20d
14
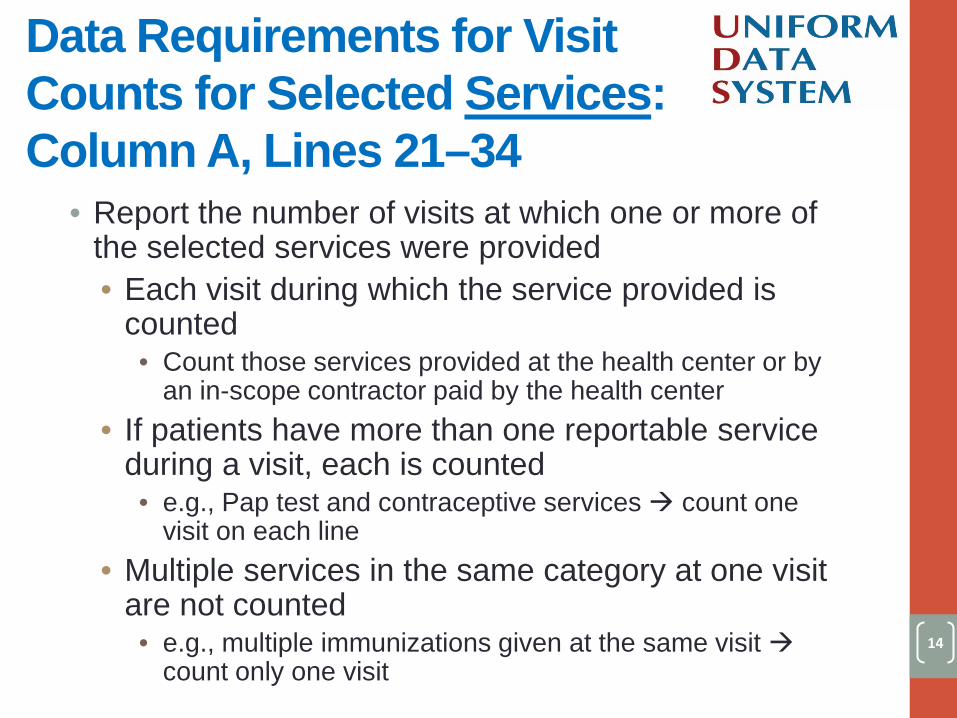
• Report the number of visits at which one or more of the selected services were provided • Each visit during which the service provided is
counted • Count those services provided at the health center or by
an in-scope contractor paid by the health center • If patients have more than one reportable service
during a visit, each is counted • e.g., Pap test and contraceptive services count one
visit on each line • Multiple services in the same category at one visit
are not counted • e.g., multiple immunizations given at the same visit
count only one visit
Data Requirements for Visit Counts for Selected Services: Column A, Lines 21–34
15
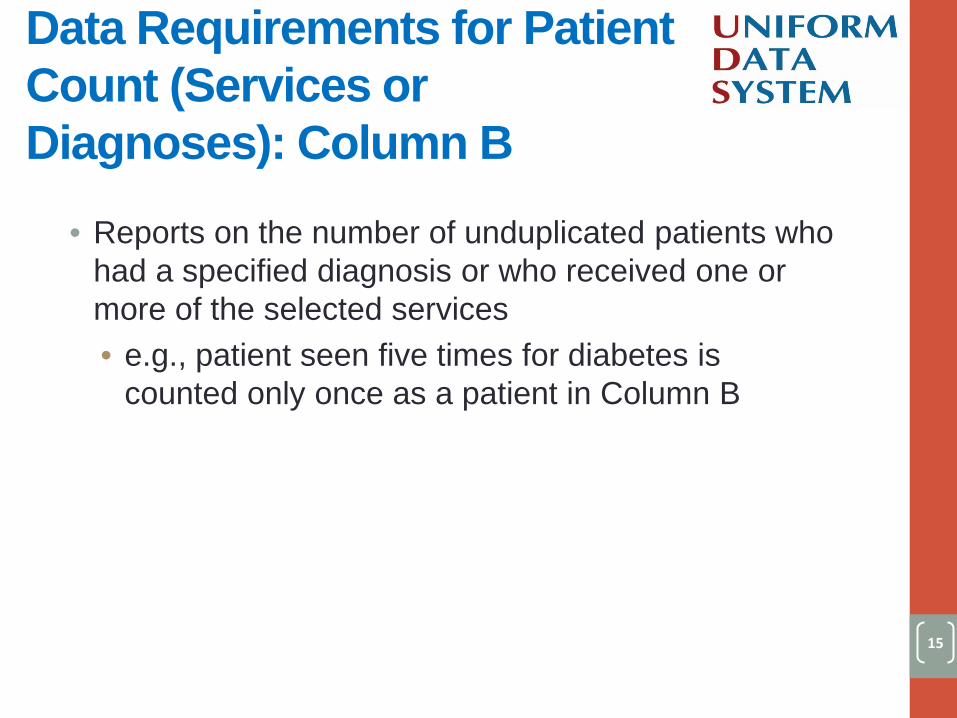
• Reports on the number of unduplicated patients who had a specified diagnosis or who received one or more of the selected services • e.g., patient seen five times for diabetes is
counted only once as a patient in Column B
Data Requirements for Patient Count (Services or Diagnoses): Column B
16
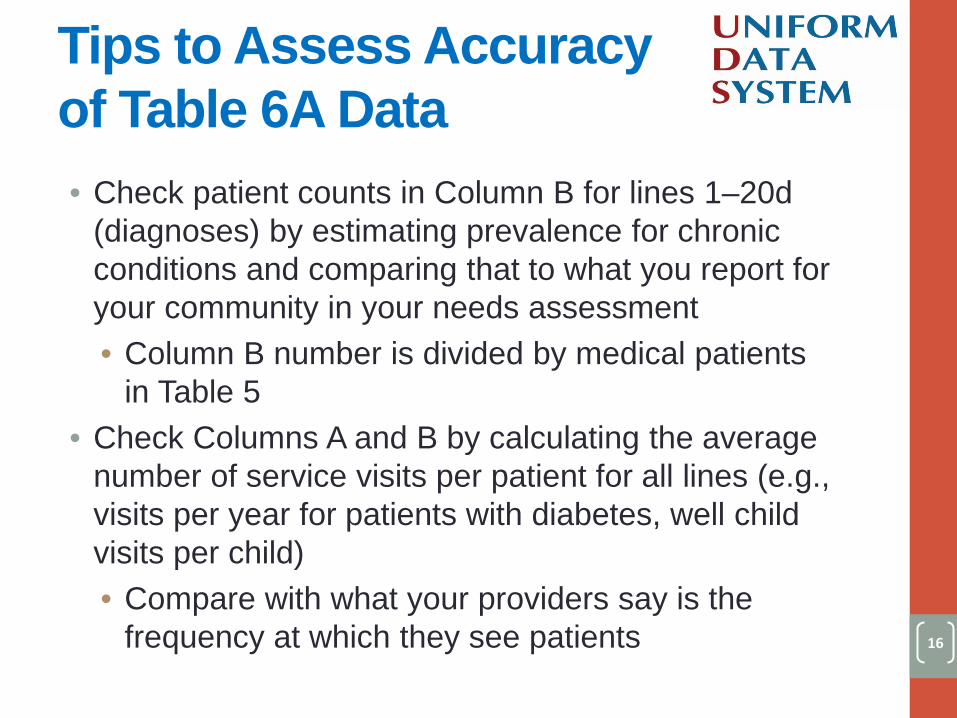
• Check patient counts in Column B for lines 1–20d (diagnoses) by estimating prevalence for chronic conditions and comparing that to what you report for your community in your needs assessment • Column B number is divided by medical patients
in Table 5 • Check Columns A and B by calculating the average
number of service visits per patient for all lines (e.g., visits per year for patients with diabetes, well child visits per child) • Compare with what your providers say is the
frequency at which they see patients
Tips to Assess Accuracy of Table 6A Data
17
TABLE 6B: QUALITY OF CARE MEASURES
18
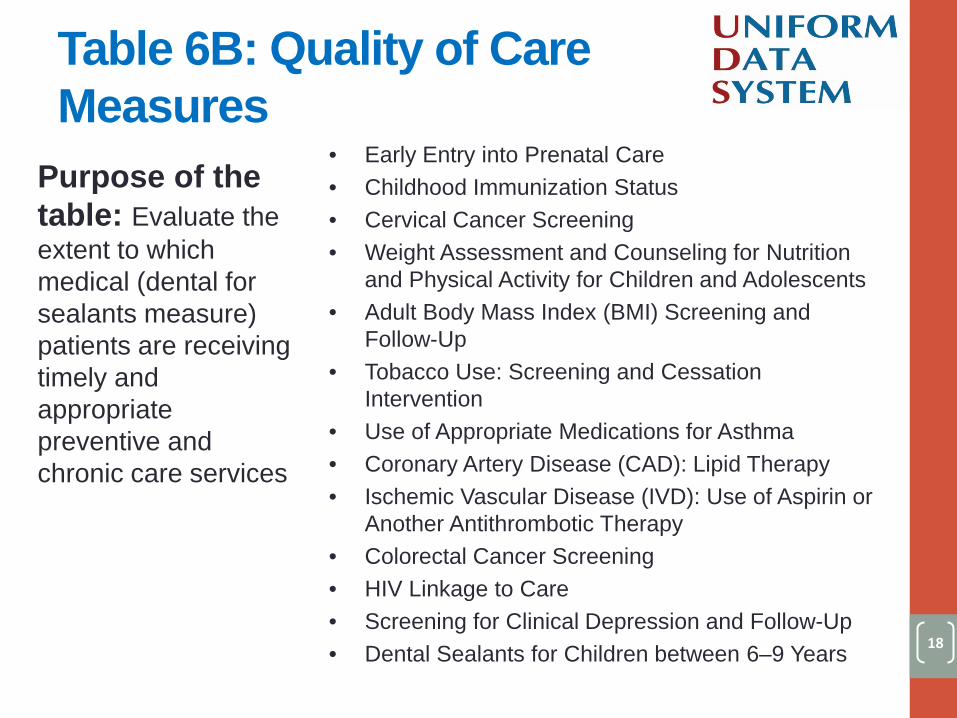
• Early Entry into Prenatal Care • Childhood Immunization Status • Cervical Cancer Screening • Weight Assessment and Counseling for Nutrition
and Physical Activity for Children and Adolescents • Adult Body Mass Index (BMI) Screening and
Follow-Up • Tobacco Use: Screening and Cessation
Intervention • Use of Appropriate Medications for Asthma • Coronary Artery Disease (CAD): Lipid Therapy • Ischemic Vascular Disease (IVD): Use of Aspirin or
Another Antithrombotic Therapy • Colorectal Cancer Screening • HIV Linkage to Care • Screening for Clinical Depression and Follow-Up • Dental Sealants for Children between 6–9 Years
Purpose of the table: Evaluate the extent to which medical (dental for sealants measure) patients are receiving timely and appropriate preventive and chronic care services
Table 6B: Quality of Care Measures
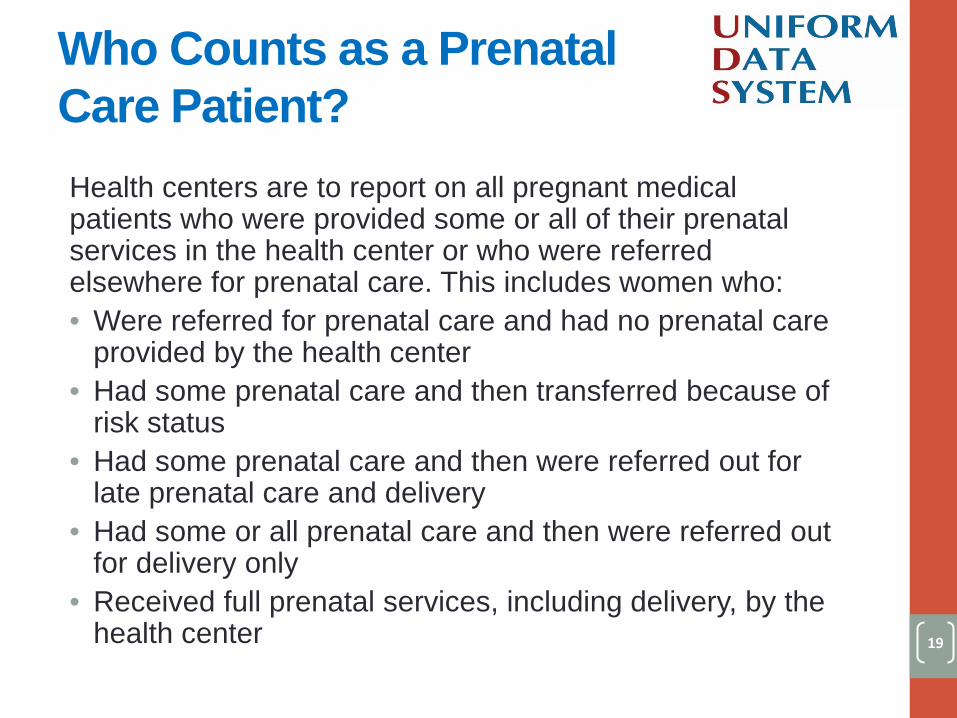
Health centers are to report on all pregnant medical patients who were provided some or all of their prenatal services in the health center or who were referred elsewhere for prenatal care. This includes women who: • Were referred for prenatal care and had no prenatal care
provided by the health center • Had some prenatal care and then transferred because of
risk status • Had some prenatal care and then were referred out for
late prenatal care and delivery • Had some or all prenatal care and then were referred out
for delivery only • Received full prenatal services, including delivery, by the
health center
19
Who Counts as a Prenatal Care Patient?

20
• Report the total number of patients who received or were referredfor prenatal care services at any time during the reporting period byage group.
• Include all women receiving any prenatal care during the reportingyear, including the delivery of her child, regardless of when thatcare was initiated, including women who:• Began or were referred for prenatal care during the previous reporting
period and continued into this reporting period,• Began or were referred for care and delivered during the reporting year, or• Began or were referred for their care in this reporting period, but will not/did
not deliver until the next year.• Age is reported as of June 30 of the reporting year
Line Age Number of Patients (a) 1 Less than 15 years [blank for demonstration] 2 Ages 15–19 [blank for demonstration] 3 Ages 20–24 [blank for demonstration] 4 Ages 25–44 [blank for demonstration] 5 Ages 45 and over [blank for demonstration] 6 Total Patients (sum lines 1–5) [blank for demonstration]
Age Categories for Prenatal Care Patients
21
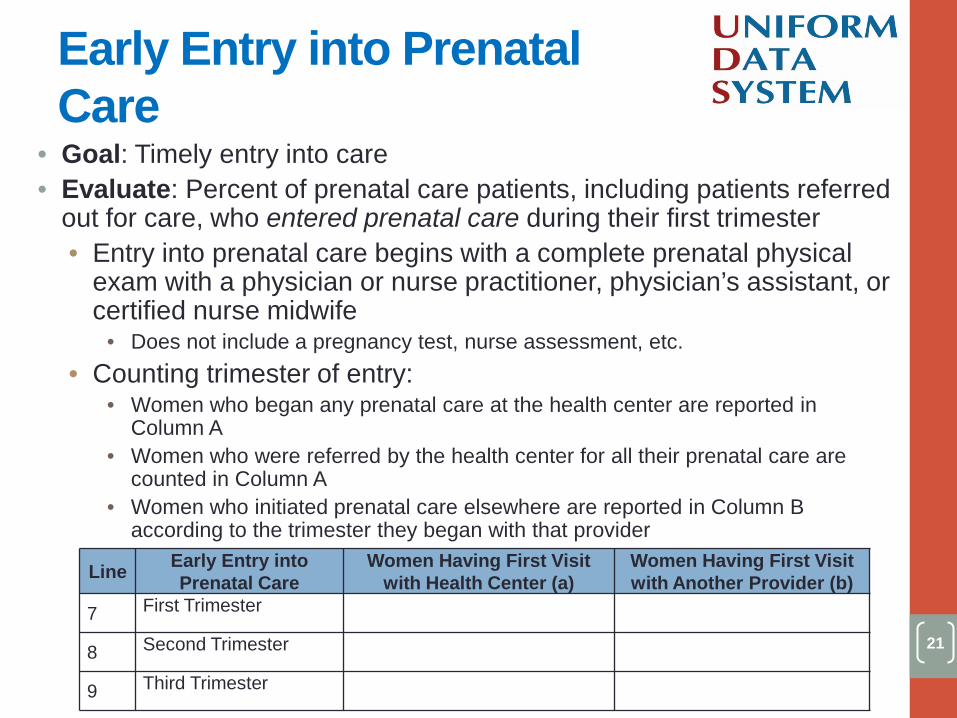
• Goal: Timely entry into care • Evaluate: Percent of prenatal care patients, including patients referred
out for care, who entered prenatal care during their first trimester • Entry into prenatal care begins with a complete prenatal physical
exam with a physician or nurse practitioner, physician’s assistant, or certified nurse midwife
• Does not include a pregnancy test, nurse assessment, etc. • Counting trimester of entry:
• Women who began any prenatal care at the health center are reported in Column A
• Women who were referred by the health center for all their prenatal care are counted in Column A
• Women who initiated prenatal care elsewhere are reported in Column B according to the trimester they began with that provider
Line Early Entry into Prenatal Care
Women Having First Visit with Health Center (a)
Women Having First Visit with Another Provider (b)
7 First Trimester [blank for demonstration] [blank for demonstration]
8 Second Trimester [blank for demonstration] [blank for demonstration]
9 Third Trimester [blank for demonstration] [blank for demonstration]
Early Entry into Prenatal Care
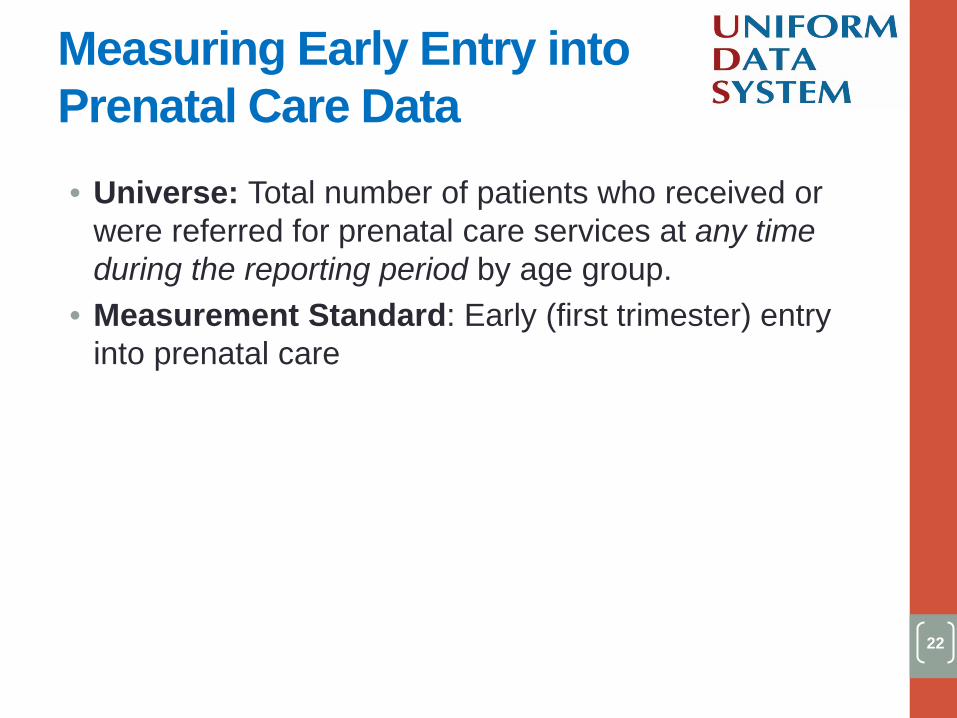
• Universe: Total number of patients who received or were referred for prenatal care services at any time during the reporting period by age group.
• Measurement Standard: Early (first trimester) entry into prenatal care
22
Measuring Early Entry into Prenatal Care Data
23
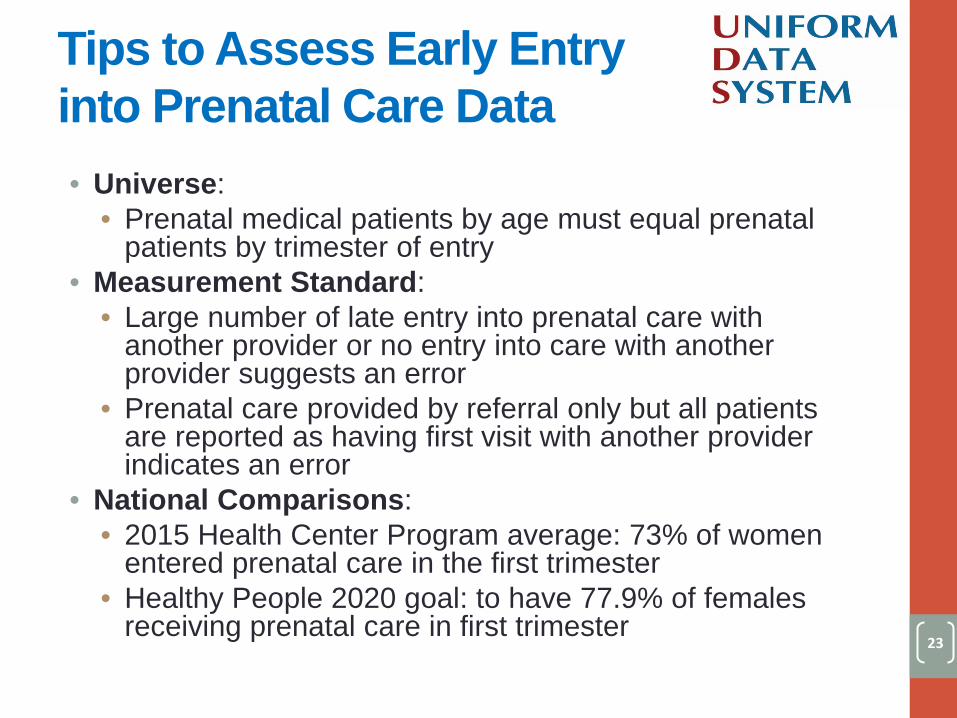
• Universe: • Prenatal medical patients by age must equal prenatal
patients by trimester of entry • Measurement Standard:
• Large number of late entry into prenatal care with another provider or no entry into care with another provider suggests an error
• Prenatal care provided by referral only but all patients are reported as having first visit with another provider indicates an error
• National Comparisons: • 2015 Health Center Program average: 73% of women
entered prenatal care in the first trimester • Healthy People 2020 goal: to have 77.9% of females
receiving prenatal care in first trimester
Tips to Assess Early Entry into Prenatal Care Data
24
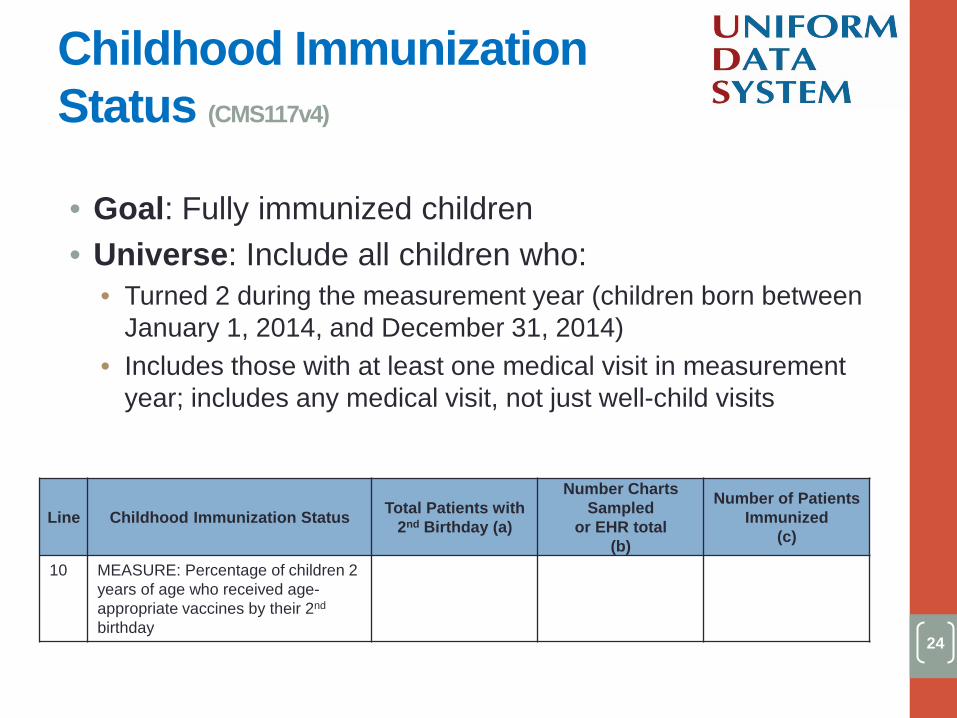
• Goal: Fully immunized children • Universe: Include all children who:
• Turned 2 during the measurement year (children born between January 1, 2014, and December 31, 2014)
• Includes those with at least one medical visit in measurement year; includes any medical visit, not just well-child visits
Line Childhood Immunization Status Total Patients with 2nd Birthday (a)
Number Charts Sampled
or EHR total (b)
Number of Patients Immunized
(c)
10 MEASURE: Percentage of children 2 years of age who received age-appropriate vaccines by their 2nd
birthday
Blank for demonstration
Blank for demonstration
Blank for demonstration
Childhood Immunization Status (CMS117v4)
25
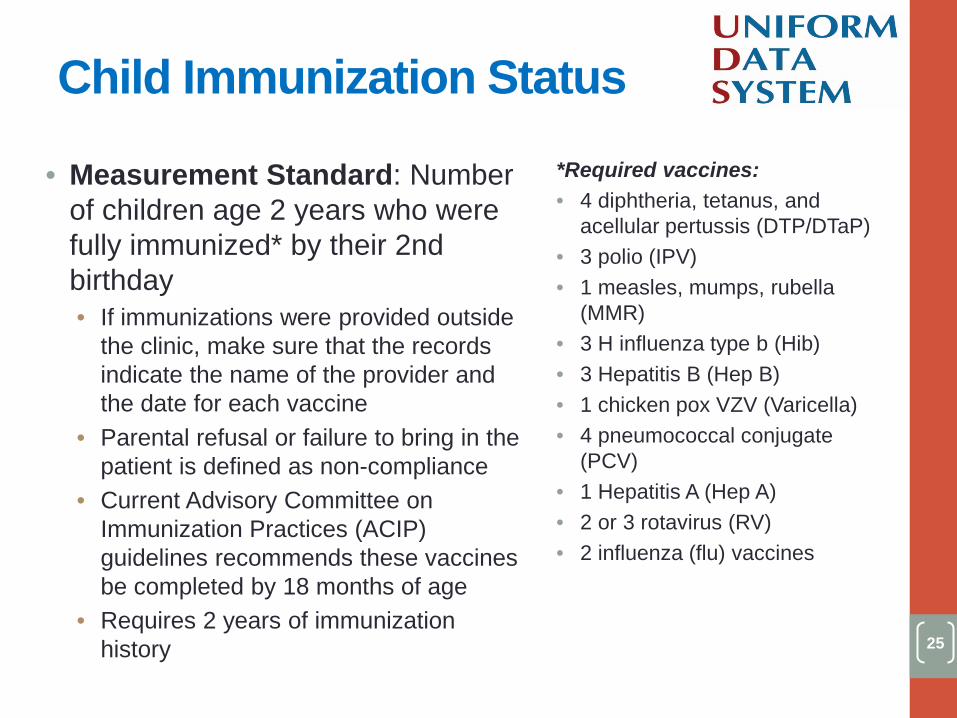
• Measurement Standard: Number of children age 2 years who were fully immunized* by their 2nd birthday • If immunizations were provided outside
the clinic, make sure that the records indicate the name of the provider and the date for each vaccine
• Parental refusal or failure to bring in the patient is defined as non-compliance
• Current Advisory Committee on Immunization Practices (ACIP) guidelines recommends these vaccines be completed by 18 months of age
• Requires 2 years of immunization history
*Required vaccines: • 4 diphtheria, tetanus, and
acellular pertussis (DTP/DTaP) • 3 polio (IPV) • 1 measles, mumps, rubella
(MMR) • 3 H influenza type b (Hib) • 3 Hepatitis B (Hep B) • 1 chicken pox VZV (Varicella) • 4 pneumococcal conjugate
(PCV) • 1 Hepatitis A (Hep A) • 2 or 3 rotavirus (RV) • 2 influenza (flu) vaccines
Child Immunization Status
26
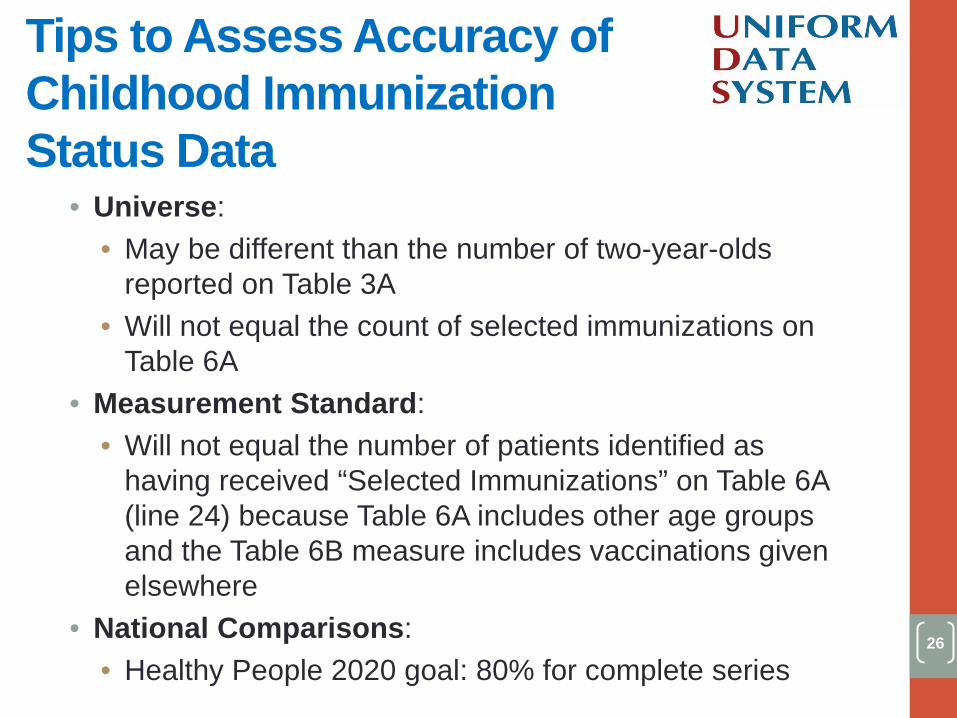
• Universe: • May be different than the number of two-year-olds
reported on Table 3A • Will not equal the count of selected immunizations on
Table 6A • Measurement Standard:
• Will not equal the number of patients identified as having received “Selected Immunizations” on Table 6A (line 24) because Table 6A includes other age groups and the Table 6B measure includes vaccinations given elsewhere
• National Comparisons: • Healthy People 2020 goal: 80% for complete series
Tips to Assess Accuracy of Childhood Immunization Status Data
27
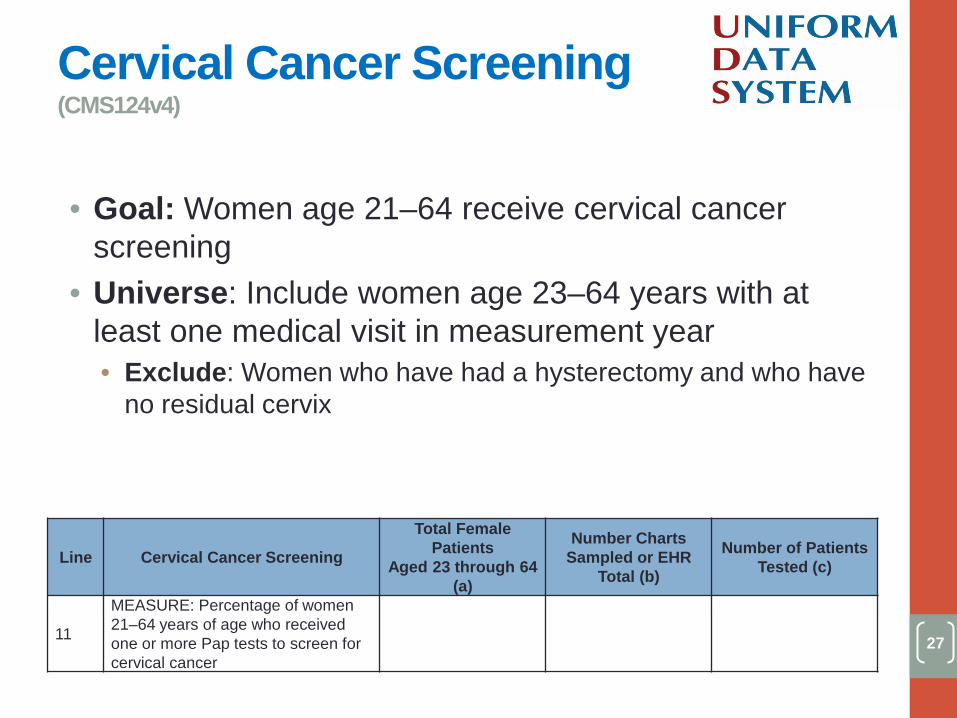
• Goal: Women age 21–64 receive cervical cancer screening
• Universe: Include women age 23–64 years with at least one medical visit in measurement year • Exclude: Women who have had a hysterectomy and who have
no residual cervix
Line Cervical Cancer Screening
Total Female Patients
Aged 23 through 64 (a)
Number Charts Sampled or EHR
Total (b)
Number of Patients Tested (c)
11
MEASURE: Percentage of women 21–64 years of age who received one or more Pap tests to screen for cervical cancer
[blank for demonstration] [blank for demonstration] [blank for demonstration]
Cervical Cancer Screening (CMS124v4)
28
• Measurement Standard: Women who received one or more documented Pap tests (regardless of where performed) during the measurement year or prior two calendar years • Documentation in the medical record of a test
performed outside of the health center must include the date the test was performed, who performed it, and the findings
• By including a note indicating that a “patient was referred” • By including a note that “patient reported receiving Pap test” • By noting that the patient refuses or failed to return for the
test • May need three years of data
Cervical Cancer Screening Data
29
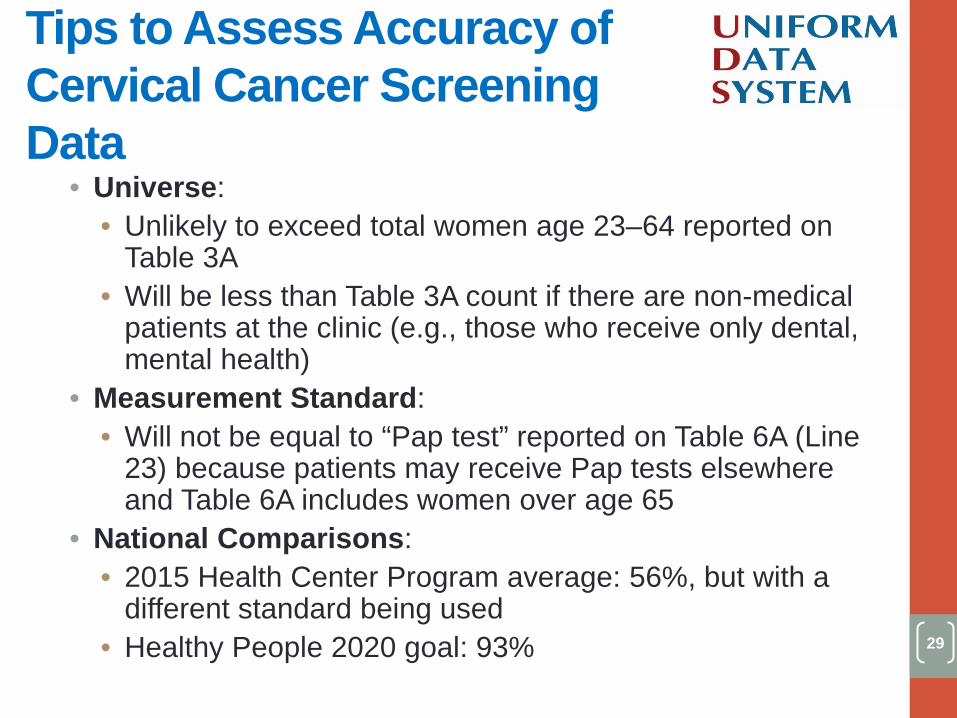
• Universe: • Unlikely to exceed total women age 23–64 reported on
Table 3A • Will be less than Table 3A count if there are non-medical
patients at the clinic (e.g., those who receive only dental, mental health)
• Measurement Standard: • Will not be equal to “Pap test” reported on Table 6A (Line
23) because patients may receive Pap tests elsewhere and Table 6A includes women over age 65
• National Comparisons: • 2015 Health Center Program average: 56%, but with a
different standard being used • Healthy People 2020 goal: 93%
Tips to Assess Accuracy of Cervical Cancer Screening Data

30
• Goal: Children and adolescents have their weight assessed and receive related counseling
• Universe: Include children ages 3–17 who had at least one medical visit in a clinical setting during the measurement year • Exclude: patients with a diagnosis of pregnancy
during the reporting year
Line Weight Assessment and Counseling for Nutrition and
Physical Activity for Children and Adolescents
Total Patients Aged 3 through
17 (a)
Number Charts Sampled or EHR
Total (b)
Number of Patients with Counseling and
BMI Documented (c)
12 MEASURE: Percentage of patients 3–17 years of age with a BMI percentile and counseling on nutrition and physical activity documented
[blank for demonstration]
[blank for demonstration]
[blank for demonstration]
Weight Assessment and Counseling for Nutrition and Physical Activity for Children and Adolescents (CMS155v4)
31
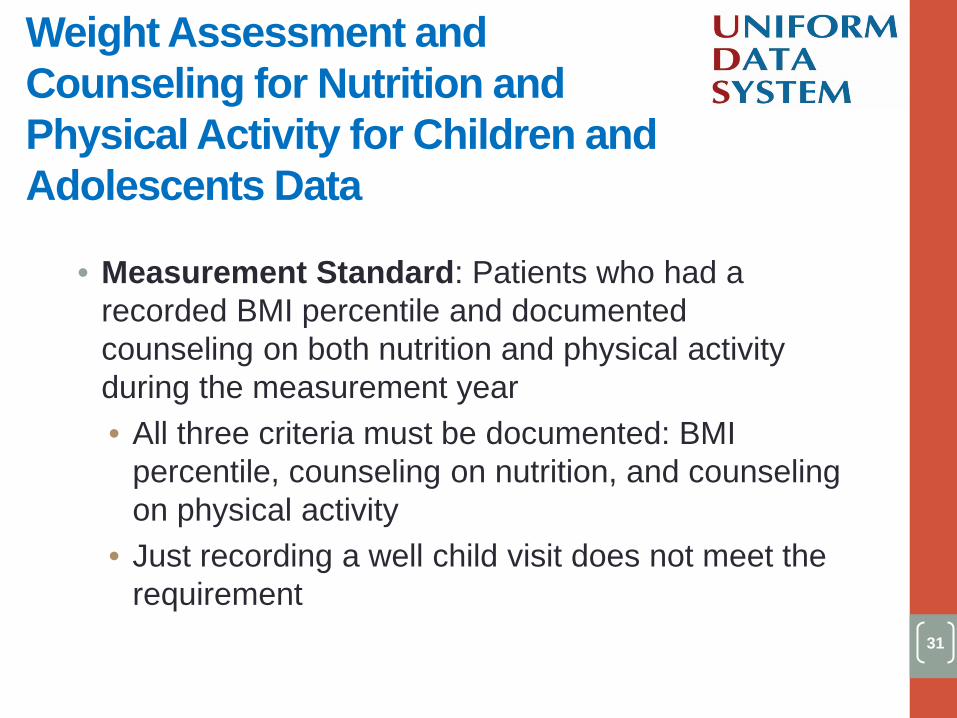
• Measurement Standard: Patients who had a recorded BMI percentile and documented counseling on both nutrition and physical activity during the measurement year • All three criteria must be documented: BMI
percentile, counseling on nutrition, and counseling on physical activity
• Just recording a well child visit does not meet the requirement
Weight Assessment and Counseling for Nutrition and Physical Activity for Children and Adolescents Data
32
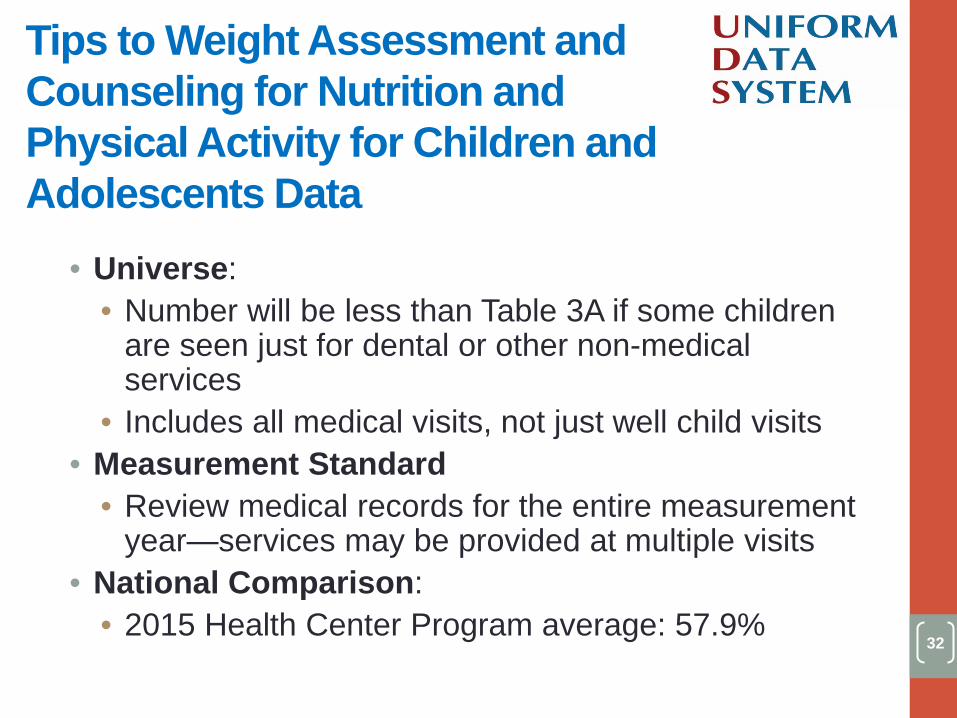
• Universe: • Number will be less than Table 3A if some children
are seen just for dental or other non-medical services
• Includes all medical visits, not just well child visits • Measurement Standard
• Review medical records for the entire measurement year—services may be provided at multiple visits
• National Comparison: • 2015 Health Center Program average: 57.9%
Tips to Weight Assessment and Counseling for Nutrition and Physical Activity for Children and Adolescents Data
33
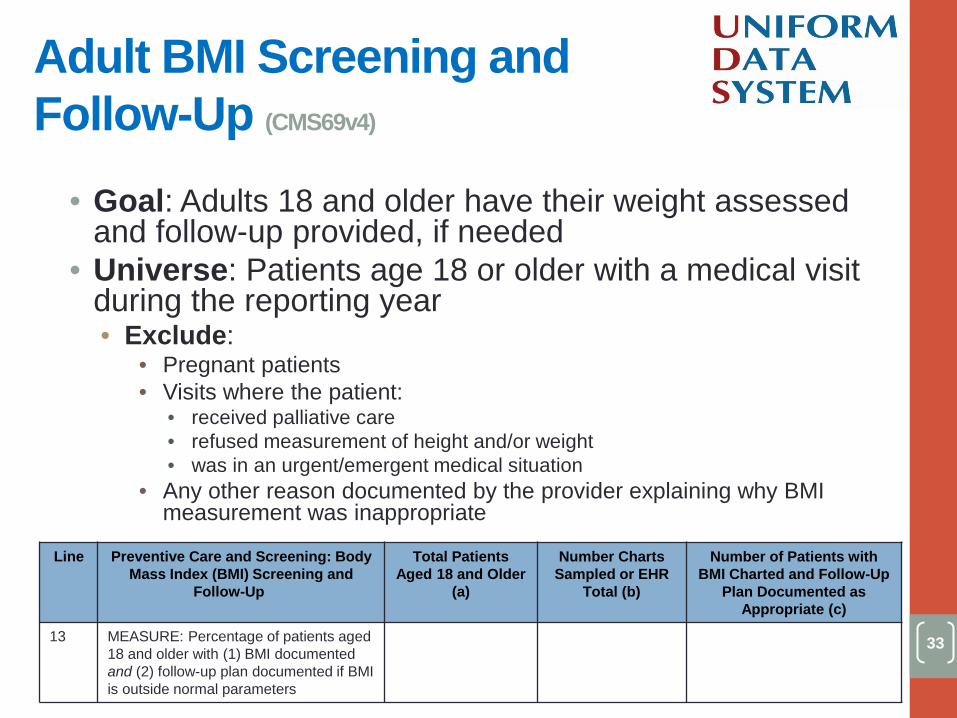
• Goal: Adults 18 and older have their weight assessed and follow-up provided, if needed
• Universe: Patients age 18 or older with a medical visit during the reporting year • Exclude:
• Pregnant patients • Visits where the patient:
• received palliative care • refused measurement of height and/or weight • was in an urgent/emergent medical situation
• Any other reason documented by the provider explaining why BMI measurement was inappropriate
Line Preventive Care and Screening: Body Mass Index (BMI) Screening and
Follow-Up
Total Patients Aged 18 and Older
(a)
Number Charts Sampled or EHR
Total (b)
Number of Patients with BMI Charted and Follow-Up
Plan Documented as Appropriate (c)
13 MEASURE: Percentage of patients aged 18 and older with (1) BMI documented and (2) follow-up plan documented if BMI is outside normal parameters
[blank for demonstration]
[blank for demonstration]
[blank for demonstration]
Adult BMI Screening and Follow-Up (CMS69v4)
34
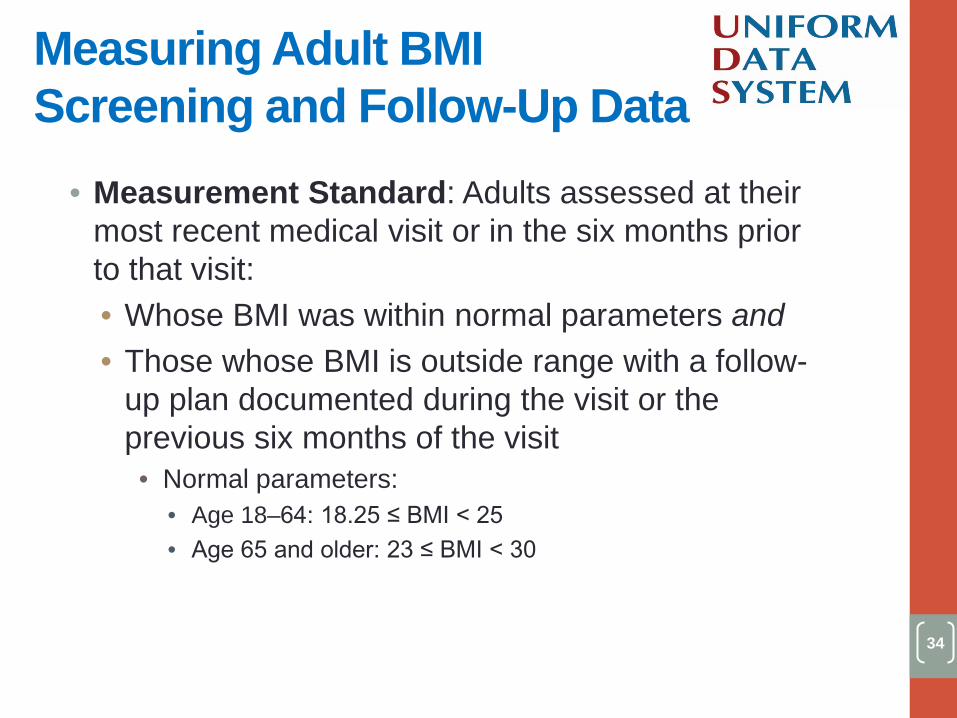
• Measurement Standard: Adults assessed at their most recent medical visit or in the six months prior to that visit: • Whose BMI was within normal parameters and • Those whose BMI is outside range with a follow-
up plan documented during the visit or the previous six months of the visit • Normal parameters:
• Age 18–64: 18.25 ≤ BMI < 25 • Age 65 and older: 23 ≤ BMI < 30
Measuring Adult BMI Screening and Follow-Up Data
35
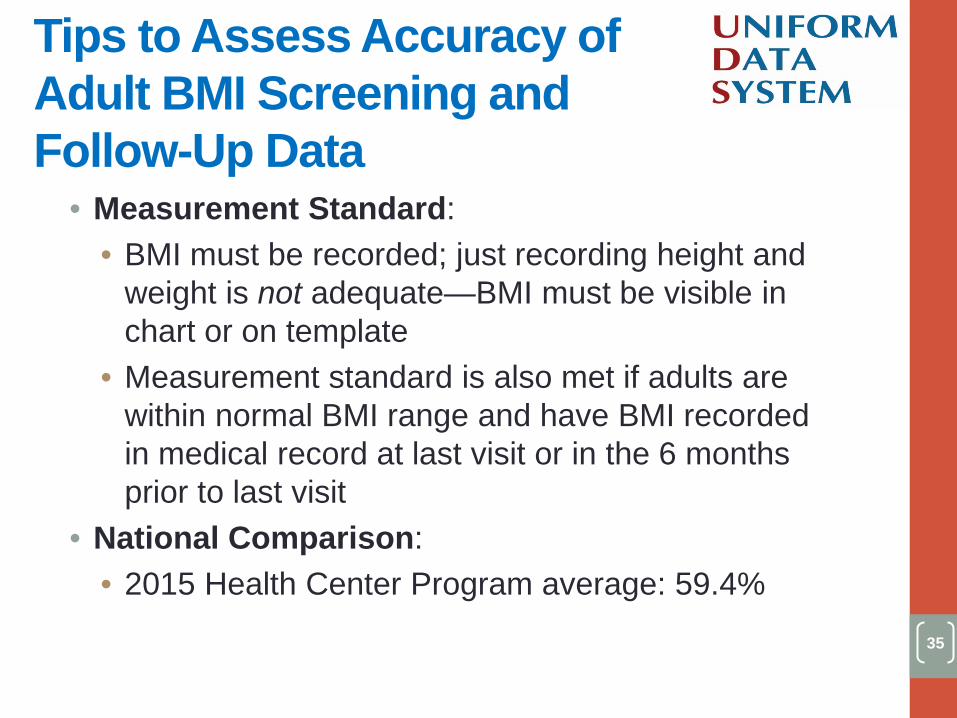
• Measurement Standard: • BMI must be recorded; just recording height and
weight is not adequate—BMI must be visible in chart or on template
• Measurement standard is also met if adults are within normal BMI range and have BMI recorded in medical record at last visit or in the 6 months prior to last visit
• National Comparison: • 2015 Health Center Program average: 59.4%
Tips to Assess Accuracy of Adult BMI Screening and Follow-Up Data
36
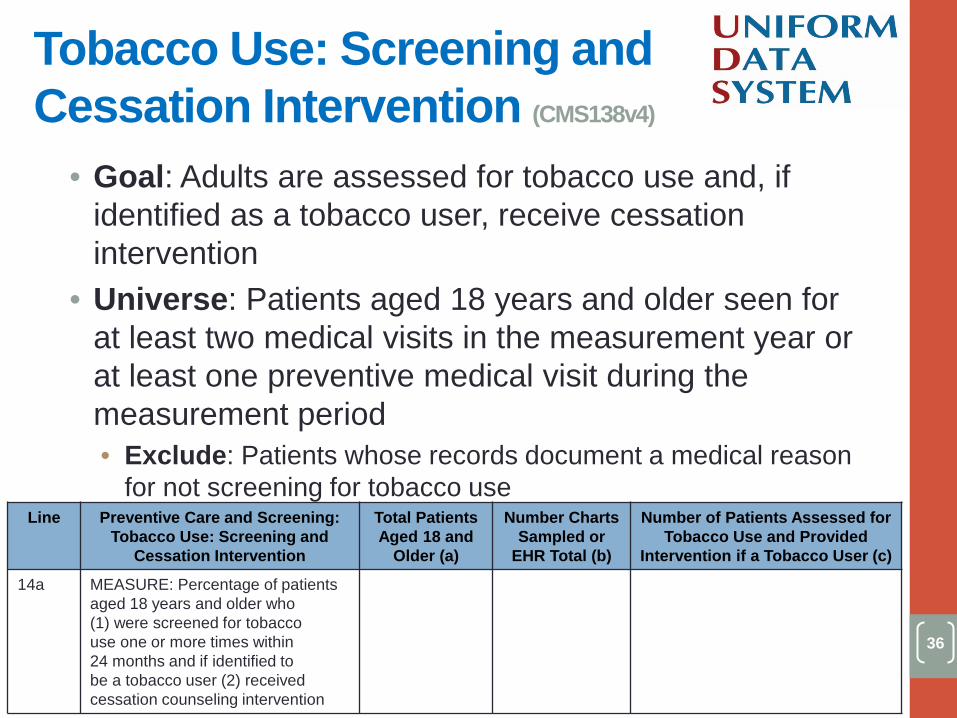
• Goal: Adults are assessed for tobacco use and, if identified as a tobacco user, receive cessation intervention
• Universe: Patients aged 18 years and older seen for at least two medical visits in the measurement year or at least one preventive medical visit during the measurement period • Exclude: Patients whose records document a medical reason
for not screening for tobacco use Line Preventive Care and Screening:
Tobacco Use: Screening and Cessation Intervention
Total Patients Aged 18 and
Older (a)
Number Charts Sampled or
EHR Total (b)
Number of Patients Assessed for Tobacco Use and Provided
Intervention if a Tobacco User (c)
14a MEASURE: Percentage of patients aged 18 years and older who (1) were screened for tobacco use one or more times within 24 months and if identified to be a tobacco user (2) received cessation counseling intervention
[blank for demonstration]
[blank for demonstration]
[blank for demonstration]
Tobacco Use: Screening and Cessation Intervention (CMS138v4)
37
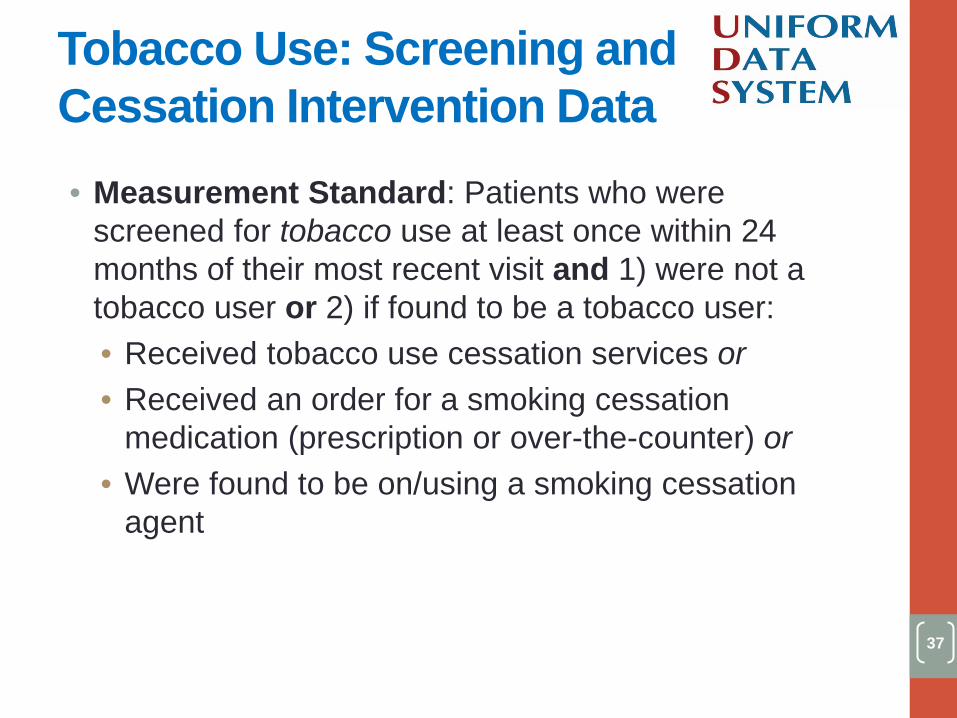
• Measurement Standard: Patients who were screened for tobacco use at least once within 24 months of their most recent visit and 1) were not a tobacco user or 2) if found to be a tobacco user: • Received tobacco use cessation services or • Received an order for a smoking cessation
medication (prescription or over-the-counter) or • Were found to be on/using a smoking cessation
agent
Tobacco Use: Screening and Cessation Intervention Data
38
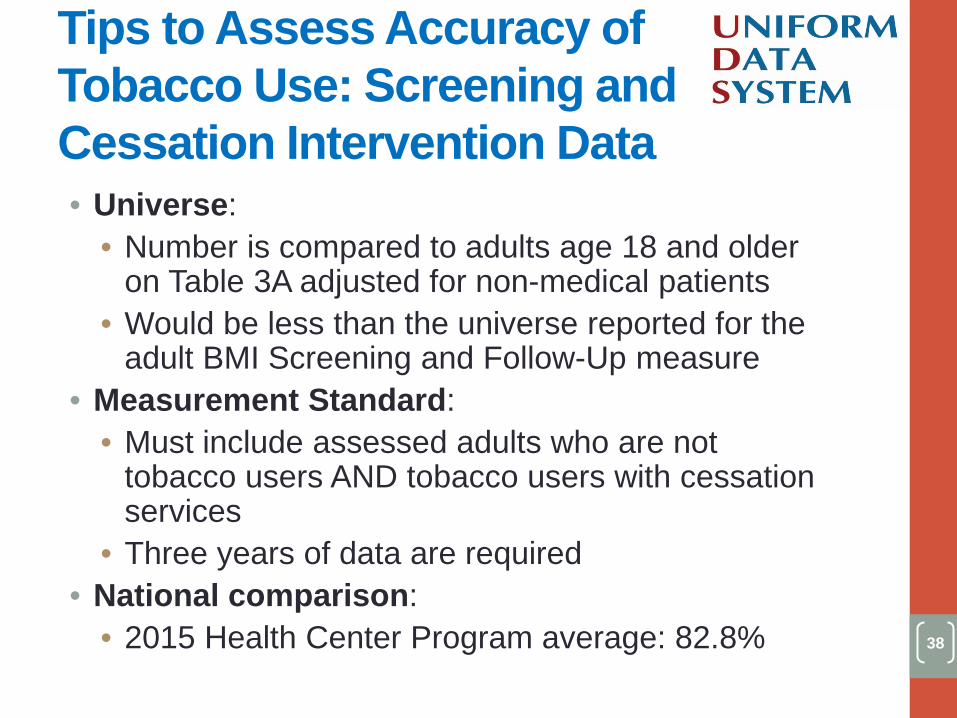
• Universe: • Number is compared to adults age 18 and older
on Table 3A adjusted for non-medical patients • Would be less than the universe reported for the
adult BMI Screening and Follow-Up measure • Measurement Standard:
• Must include assessed adults who are not tobacco users AND tobacco users with cessation services
• Three years of data are required • National comparison:
• 2015 Health Center Program average: 82.8%
Tips to Assess Accuracy of Tobacco Use: Screening and Cessation Intervention Data
39
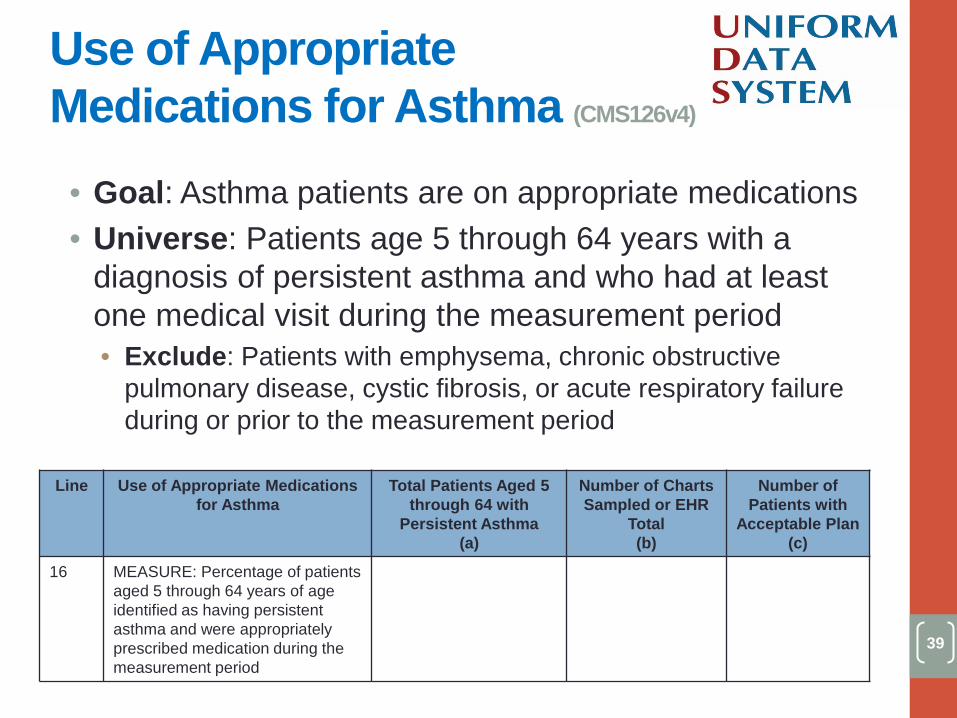
• Goal: Asthma patients are on appropriate medications • Universe: Patients age 5 through 64 years with a
diagnosis of persistent asthma and who had at least one medical visit during the measurement period • Exclude: Patients with emphysema, chronic obstructive
pulmonary disease, cystic fibrosis, or acute respiratory failure during or prior to the measurement period
Line Use of Appropriate Medications
for Asthma Total Patients Aged 5
through 64 with Persistent Asthma
(a)
Number of Charts Sampled or EHR
Total (b)
Number of Patients with
Acceptable Plan (c)
16 MEASURE: Percentage of patients aged 5 through 64 years of age identified as having persistent asthma and were appropriately prescribed medication during the measurement period
[blank for demonstration] [blank for demonstration]
[blank for demonstration]
Use of Appropriate Medications for Asthma (CMS126v4)
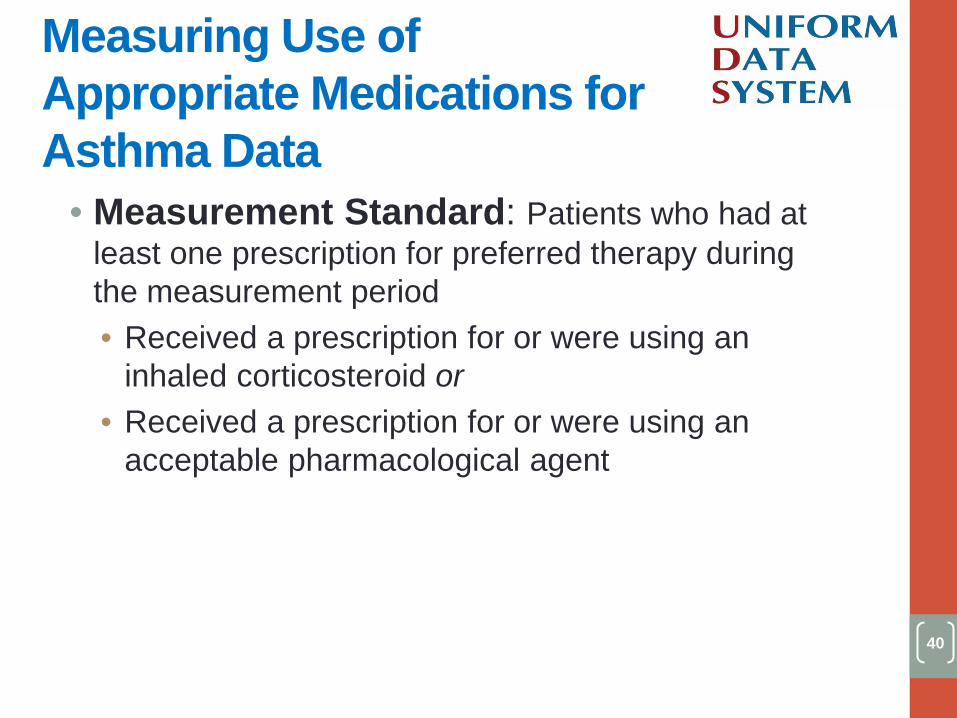
• Measurement Standard: Patients who had at least one prescription for preferred therapy during the measurement period • Received a prescription for or were using an
inhaled corticosteroid or • Received a prescription for or were using an
acceptable pharmacological agent
40
Measuring Use of Appropriate Medications for Asthma Data

41
• Universe: • Estimated prevalence: 2015 BPHC average
indicates 3% • Will not be equal to the number of patients
identified as having “Asthma” on Table 6A, Line 5 because of differences in age, severity, and visit criteria
Tips to Assess Accurate Use of Appropriate Medications for Asthma Data

42
• Goal: CAD patients with high LDL (low-density lipoprotein) are on lipid-lowering therapy
• Universe: Patients 18 years of age and older who had an active diagnosis of CAD or who have had a myocardial infarction (MI) or cardiac surgery in the past, with at least one medical visit during the measurement period and had at least two medical visits ever • Exclude: individuals whose last LDL lab test during
measurement year was <130 mg/dL or with an allergy to or a history of adverse outcomes from or intolerance to LDL-lowering medications
Line Coronary Artery Disease (CAD): Lipid Therapy
Total Patients aged 18 And Older With
CAD Diagnosis (a)
Number Charts Sampled or EHR
Total (b)
Number of Patients Prescribed A Lipid Lowering Therapy
(c)
17
MEASURE: Patients aged 18 and older with a diagnosis of CAD who were prescribed a lipid-lowering therapy
[blank for demonstration]
[blank for demonstration]
[blank for demonstration]
Coronary Artery Disease (CAD): Lipid Therapy
43
• Measurement Standard: CAD patients in the universe who received a prescription for, were provided with, or were taking lipid-lowering medications
Measuring CAD Lipid Therapy
44
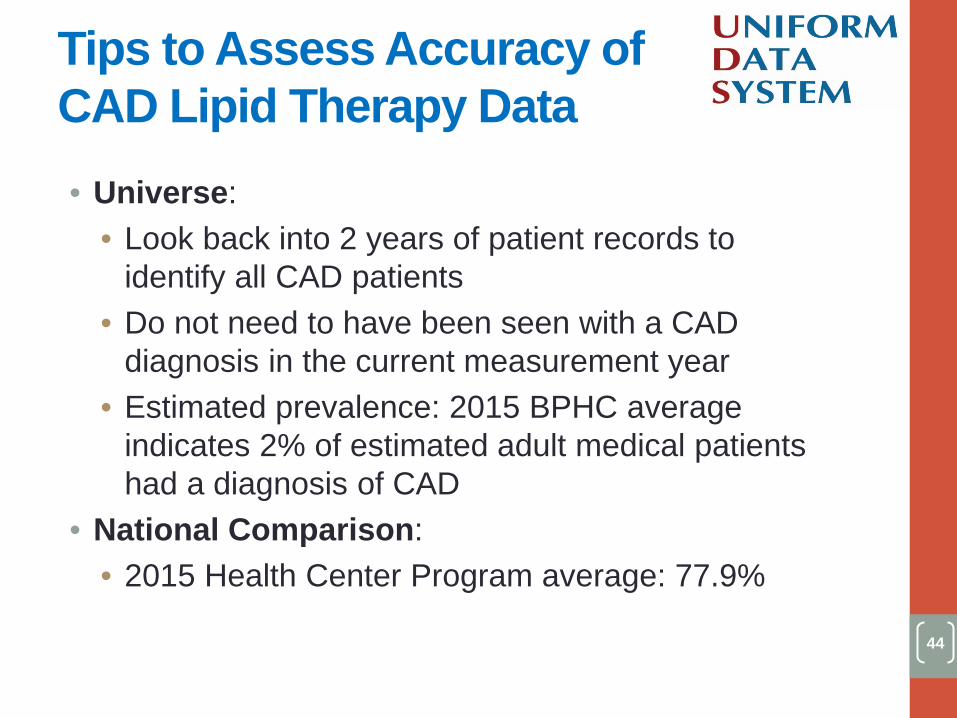
• Universe: • Look back into 2 years of patient records to
identify all CAD patients • Do not need to have been seen with a CAD
diagnosis in the current measurement year • Estimated prevalence: 2015 BPHC average
indicates 2% of estimated adult medical patients had a diagnosis of CAD
• National Comparison: • 2015 Health Center Program average: 77.9%
Tips to Assess Accuracy of CAD Lipid Therapy Data
45
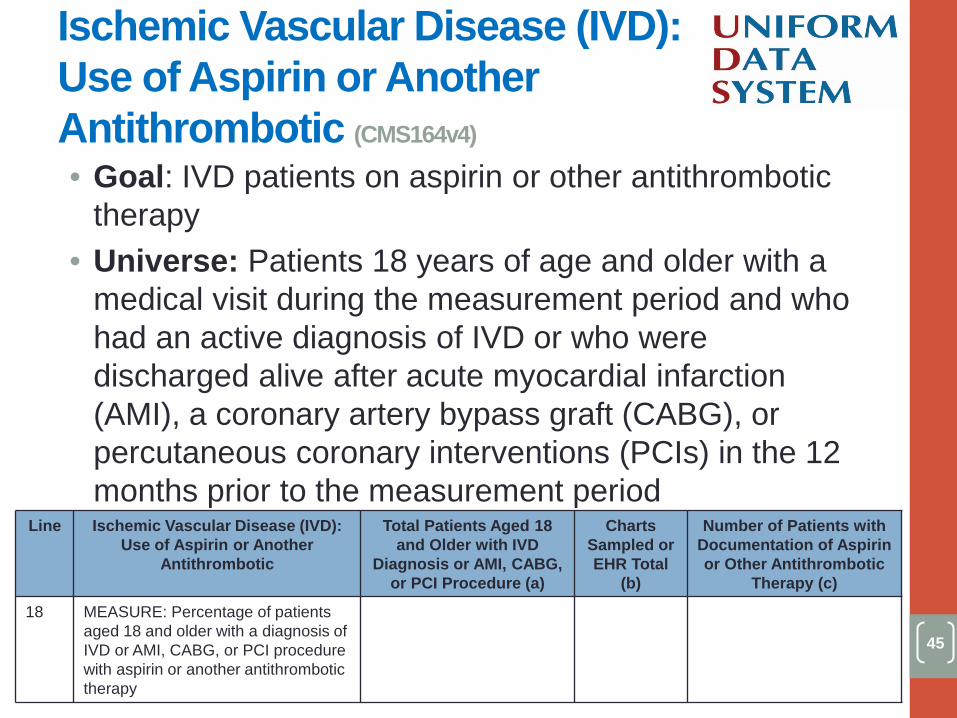
• Goal: IVD patients on aspirin or other antithrombotic therapy
• Universe: Patients 18 years of age and older with a medical visit during the measurement period and who had an active diagnosis of IVD or who were discharged alive after acute myocardial infarction (AMI), a coronary artery bypass graft (CABG), or percutaneous coronary interventions (PCIs) in the 12 months prior to the measurement period
Line Ischemic Vascular Disease (IVD): Use of Aspirin or Another
Antithrombotic
Total Patients Aged 18 and Older with IVD
Diagnosis or AMI, CABG, or PCI Procedure (a)
Charts Sampled or EHR Total
(b)
Number of Patients with Documentation of Aspirin or Other Antithrombotic
Therapy (c)
18 MEASURE: Percentage of patients aged 18 and older with a diagnosis of IVD or AMI, CABG, or PCI procedure with aspirin or another antithrombotic therapy
[blank for demonstration] [blank for demonstration]
[blank for demonstration]
Ischemic Vascular Disease (IVD): Use of Aspirin or Another Antithrombotic (CMS164v4)
46
• Measurement Standard: Documentation of use of aspirin or another antithrombotic medication during the measurement period
Measuring IVD: Use of Aspirin or Another Antithrombotic
47
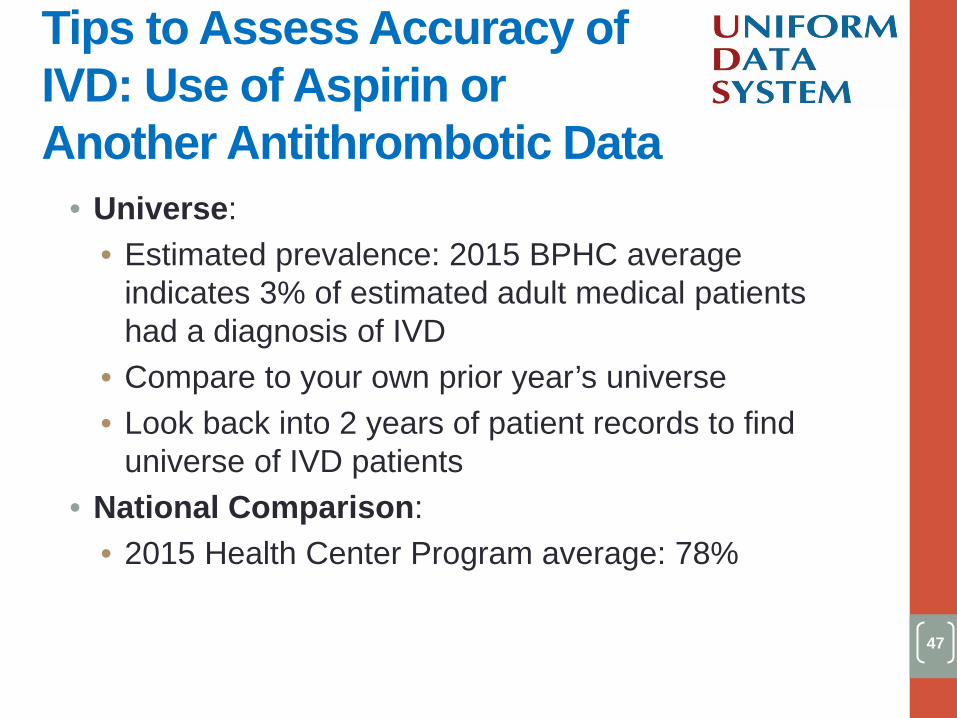
• Universe: • Estimated prevalence: 2015 BPHC average
indicates 3% of estimated adult medical patients had a diagnosis of IVD
• Compare to your own prior year’s universe • Look back into 2 years of patient records to find
universe of IVD patients • National Comparison:
• 2015 Health Center Program average: 78%
Tips to Assess Accuracy of IVD: Use of Aspirin or Another Antithrombotic Data
48
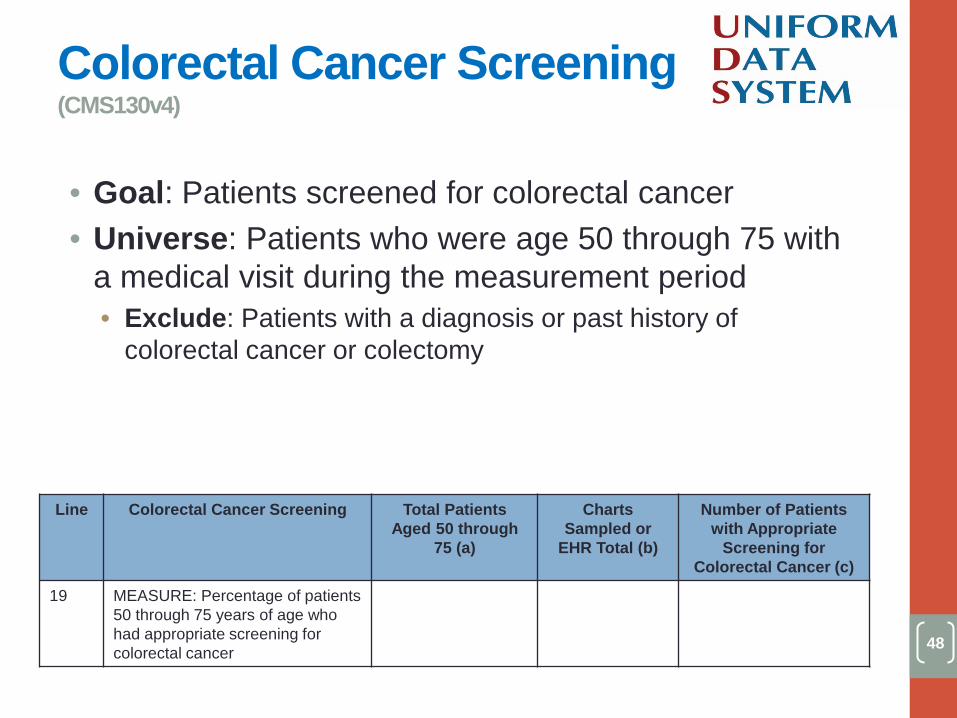
• Goal: Patients screened for colorectal cancer • Universe: Patients who were age 50 through 75 with
a medical visit during the measurement period • Exclude: Patients with a diagnosis or past history of
colorectal cancer or colectomy
Line Colorectal Cancer Screening Total Patients Aged 50 through
75 (a)
Charts Sampled or
EHR Total (b)
Number of Patients with Appropriate
Screening for Colorectal Cancer (c)
19 MEASURE: Percentage of patients 50 through 75 years of age who had appropriate screening for colorectal cancer
[blank for demonstration]
[blank for demonstration]
[blank for demonstration]
Colorectal Cancer Screening (CMS130v4)
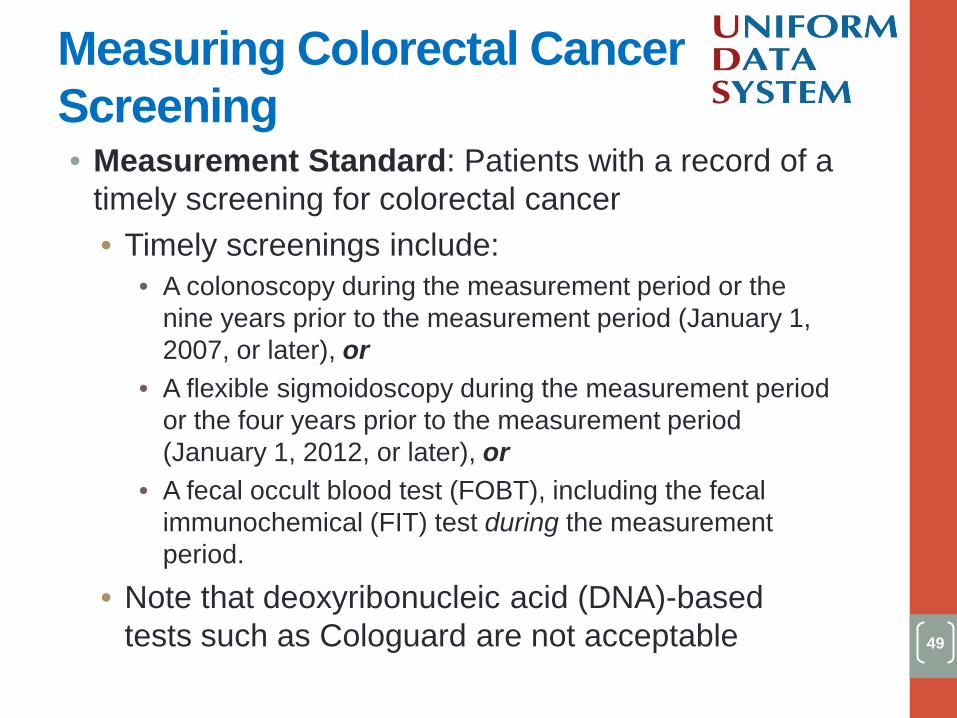
49
• Measurement Standard: Patients with a record of a timely screening for colorectal cancer • Timely screenings include:
• A colonoscopy during the measurement period or the nine years prior to the measurement period (January 1, 2007, or later), or
• A flexible sigmoidoscopy during the measurement period or the four years prior to the measurement period (January 1, 2012, or later), or
• A fecal occult blood test (FOBT), including the fecal immunochemical (FIT) test during the measurement period.
• Note that deoxyribonucleic acid (DNA)-based tests such as Cologuard are not acceptable
Measuring Colorectal Cancer Screening
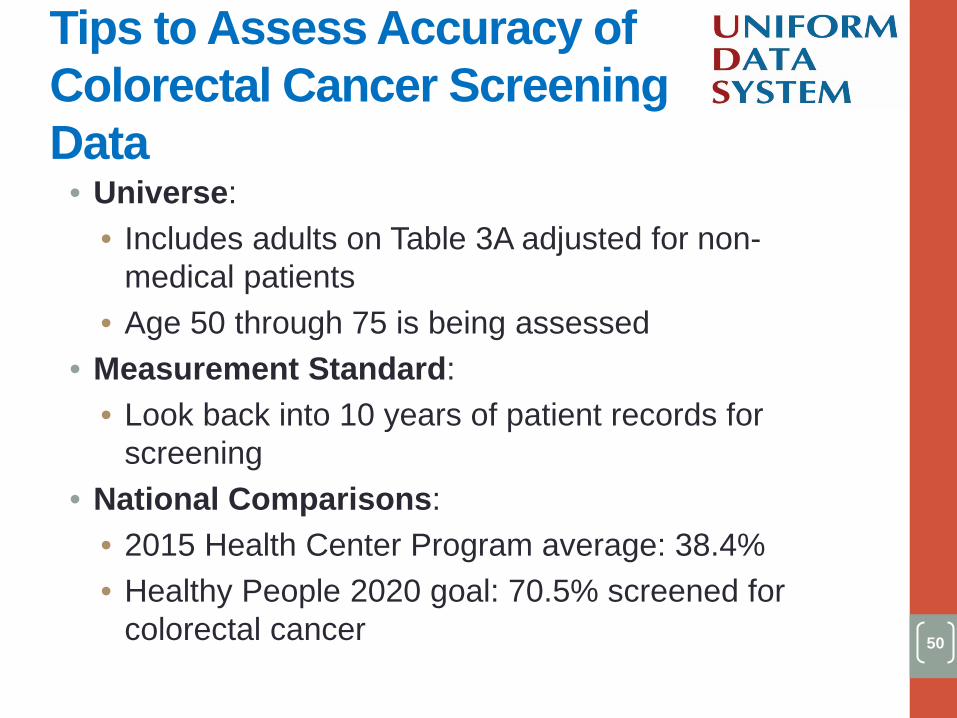
50
• Universe: • Includes adults on Table 3A adjusted for non-
medical patients • Age 50 through 75 is being assessed
• Measurement Standard: • Look back into 10 years of patient records for
screening • National Comparisons:
• 2015 Health Center Program average: 38.4% • Healthy People 2020 goal: 70.5% screened for
colorectal cancer
Tips to Assess Accuracy of Colorectal Cancer Screening Data
51
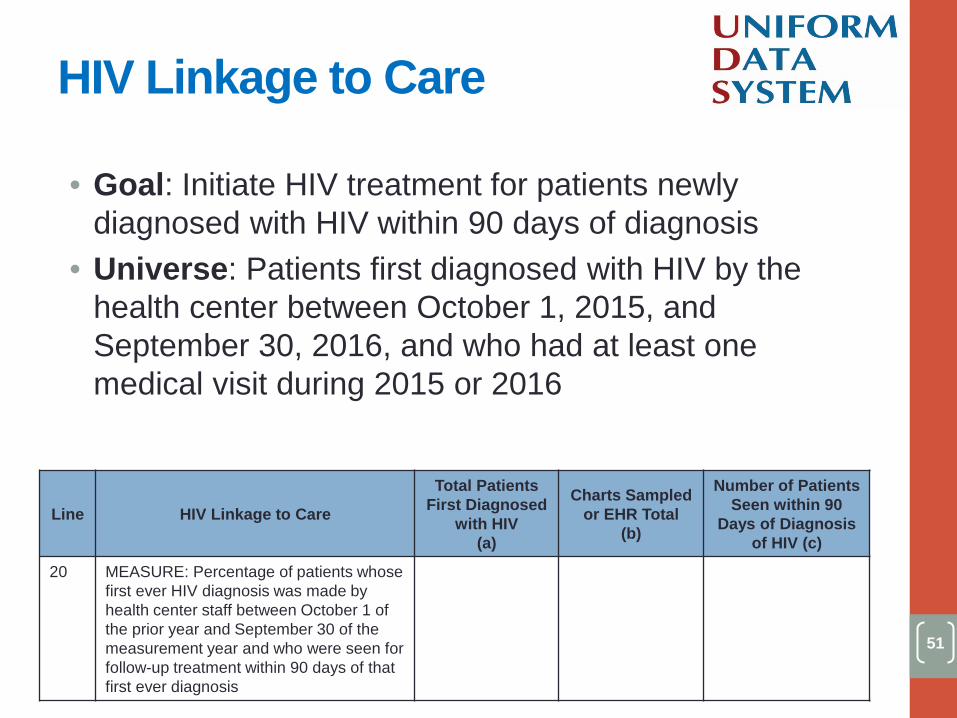
• Goal: Initiate HIV treatment for patients newly diagnosed with HIV within 90 days of diagnosis
• Universe: Patients first diagnosed with HIV by the health center between October 1, 2015, and September 30, 2016, and who had at least one medical visit during 2015 or 2016
Line HIV Linkage to Care
Total Patients First Diagnosed
with HIV (a)
Charts Sampled or EHR Total
(b)
Number of Patients Seen within 90
Days of Diagnosis of HIV (c)
20 MEASURE: Percentage of patients whose first ever HIV diagnosis was made by health center staff between October 1 of the prior year and September 30 of the measurement year and who were seen for follow-up treatment within 90 days of that first ever diagnosis
[blank for demonstration]
[blank for demonstration]
[blank for demonstration]
HIV Linkage to Care
52
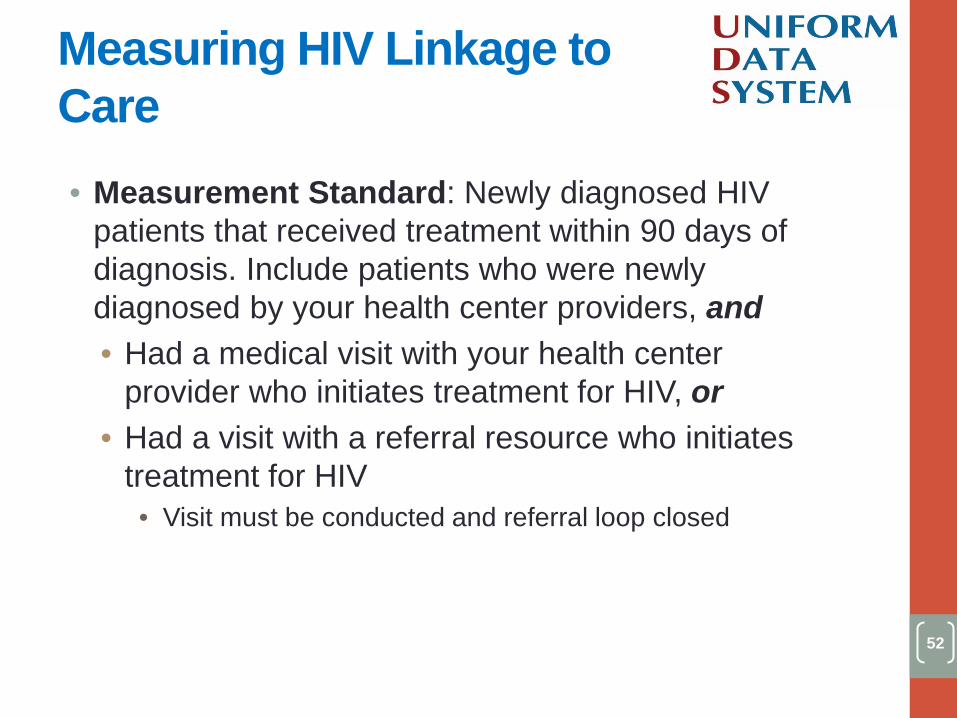
• Measurement Standard: Newly diagnosed HIV patients that received treatment within 90 days of diagnosis. Include patients who were newly diagnosed by your health center providers, and • Had a medical visit with your health center
provider who initiates treatment for HIV, or • Had a visit with a referral resource who initiates
treatment for HIV • Visit must be conducted and referral loop closed
Measuring HIV Linkage to Care
53
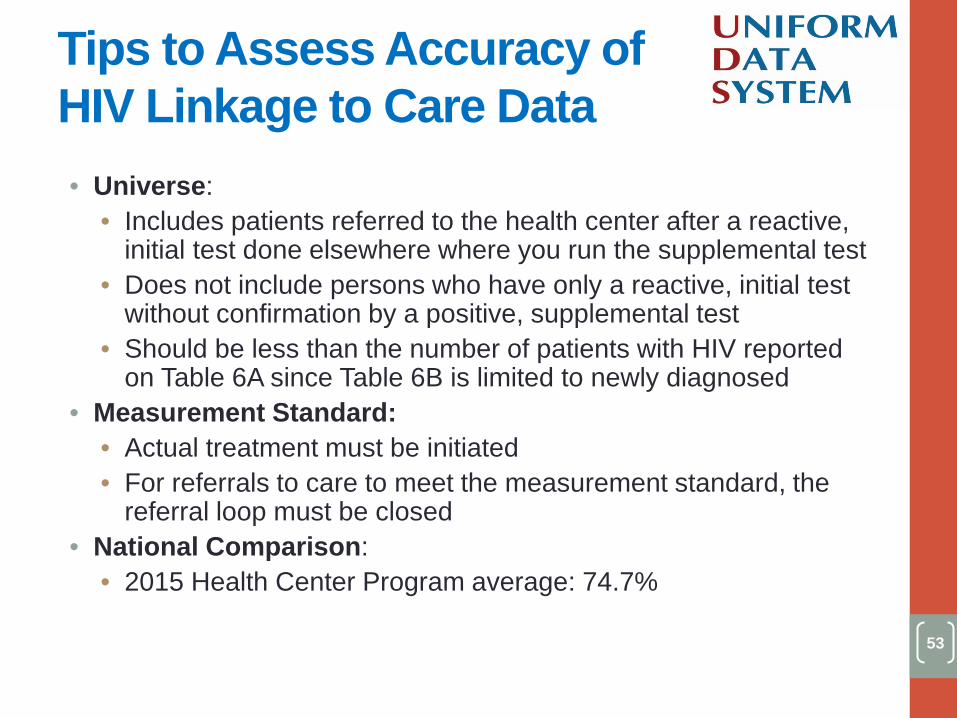
• Universe: • Includes patients referred to the health center after a reactive,
initial test done elsewhere where you run the supplemental test • Does not include persons who have only a reactive, initial test
without confirmation by a positive, supplemental test • Should be less than the number of patients with HIV reported
on Table 6A since Table 6B is limited to newly diagnosed • Measurement Standard:
• Actual treatment must be initiated • For referrals to care to meet the measurement standard, the
referral loop must be closed • National Comparison:
• 2015 Health Center Program average: 74.7%
Tips to Assess Accuracy of HIV Linkage to Care Data

54
• Goal: Patients are screened yearly for depression using a standardized tool and, if positive, have a follow-up plan documented
• Universe: Patients age 12 years and older with at least one medical visit during the measurement period • Exclude:
• Patients who refuse to participate • Patients who are in urgent or emergent situations • Patients whose functional capacity or motivation to improve affects the
accuracy of results • Patients with an active diagnosis for depression or a diagnosis of
bipolar disorder Line Preventive Care and Screening:
Screening for Clinical Depression and Follow-Up Plan
Total Patients Aged 12 and
Older (a)
Charts Sampled or EHR Total (b)
Number of Patients Screened for Depression and Follow-Up
Plan Documented as Appropriate
(c)
21 MEASURE: Percentage of patients age 12 and older who were (1) screened for depression with a standardized tool and, if screening was positive, (2) had a follow-up plan documented
[blank for demonstration]
[blank for demonstration]
[blank for demonstration]
Screening for Clinical Depression and Follow-Up Plan (CMS2v5.0)
55
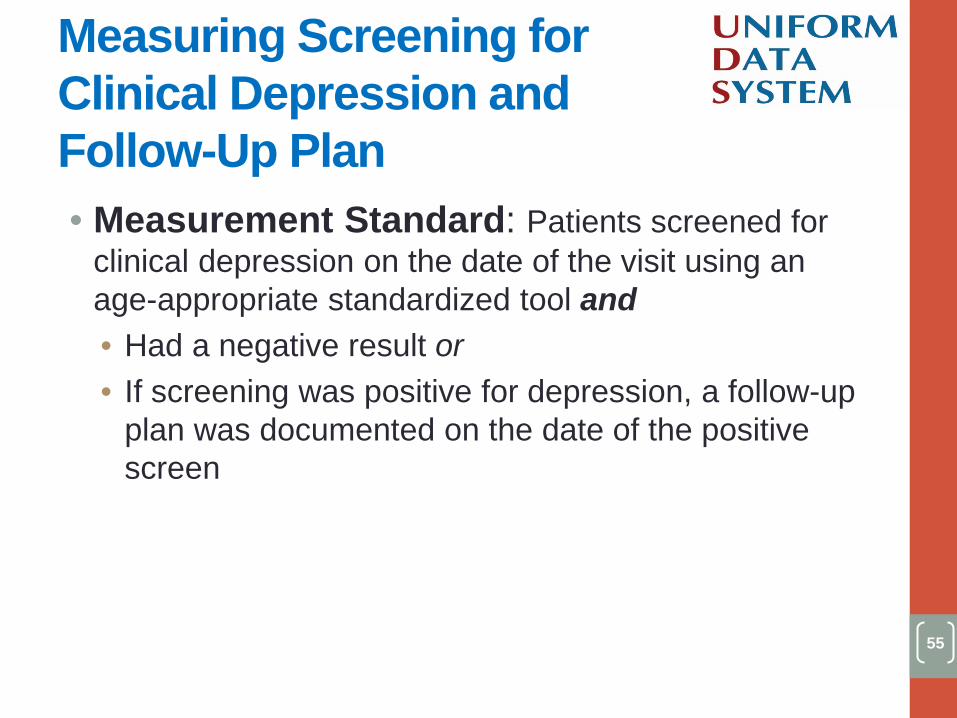
• Measurement Standard: Patients screened for clinical depression on the date of the visit using an age-appropriate standardized tool and • Had a negative result or • If screening was positive for depression, a follow-up
plan was documented on the date of the positive screen
Measuring Screening for Clinical Depression and Follow-Up Plan
56
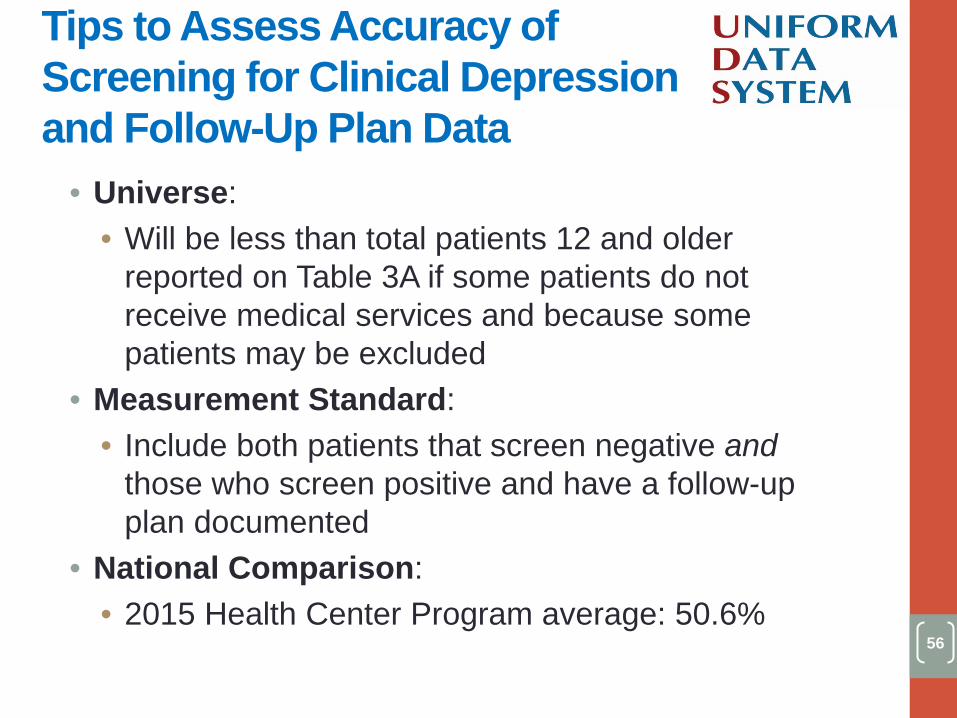
• Universe: • Will be less than total patients 12 and older
reported on Table 3A if some patients do not receive medical services and because some patients may be excluded
• Measurement Standard: • Include both patients that screen negative and
those who screen positive and have a follow-up plan documented
• National Comparison: • 2015 Health Center Program average: 50.6%
Tips to Assess Accuracy of Screening for Clinical Depression and Follow-Up Plan Data
57
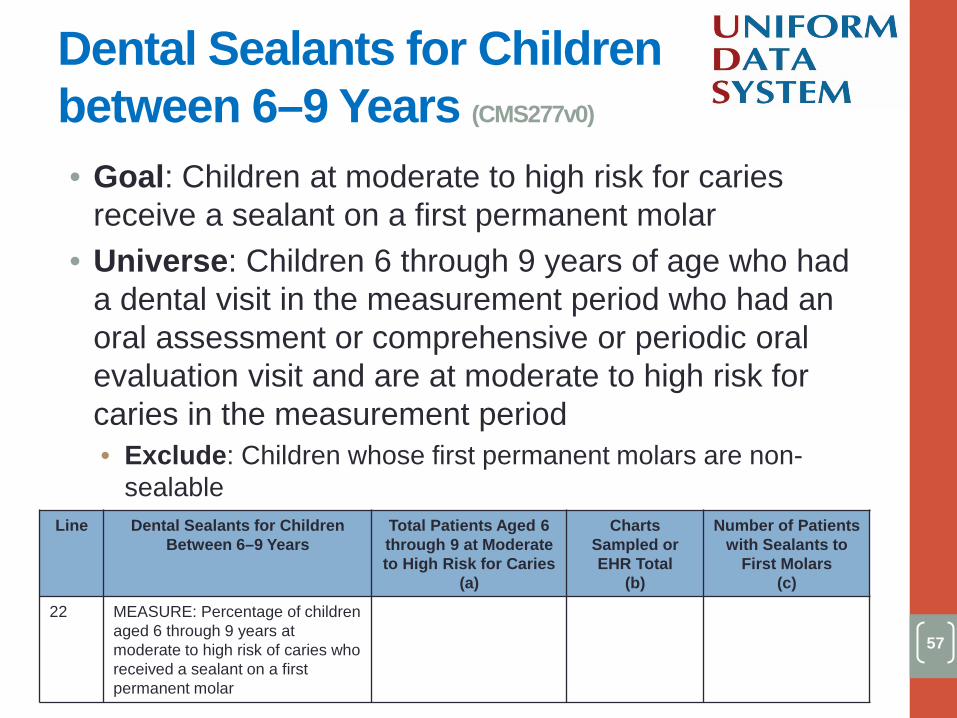
• Goal: Children at moderate to high risk for caries receive a sealant on a first permanent molar
• Universe: Children 6 through 9 years of age who had a dental visit in the measurement period who had an oral assessment or comprehensive or periodic oral evaluation visit and are at moderate to high risk for caries in the measurement period • Exclude: Children whose first permanent molars are non-
sealable Line Dental Sealants for Children
Between 6–9 Years Total Patients Aged 6 through 9 at Moderate to High Risk for Caries
(a)
Charts Sampled or EHR Total
(b)
Number of Patients with Sealants to
First Molars (c)
22 MEASURE: Percentage of children aged 6 through 9 years at moderate to high risk of caries who received a sealant on a first permanent molar
[blank for demonstration] [blank for demonstration]
[blank for demonstration]
Dental Sealants for Children between 6–9 Years (CMS277v0)
58
• Measurement Standard: Children who received a sealant on a permanent first molar tooth during the measurement period
Measuring Dental Sealants for Children between 6–9 Years
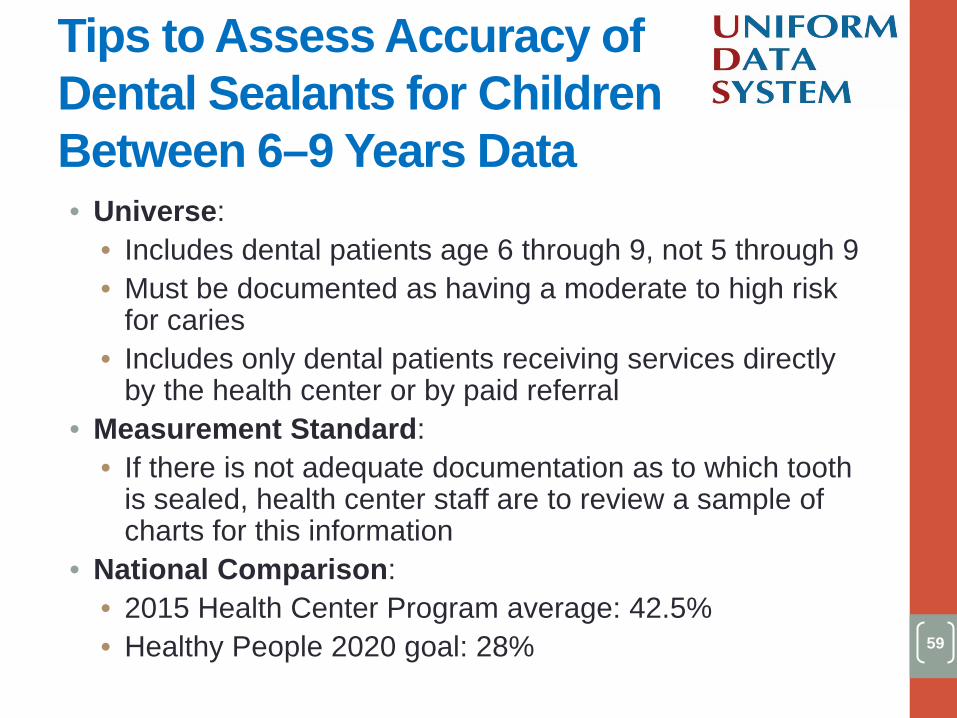
59
• Universe: • Includes dental patients age 6 through 9, not 5 through 9 • Must be documented as having a moderate to high risk
for caries • Includes only dental patients receiving services directly
by the health center or by paid referral • Measurement Standard:
• If there is not adequate documentation as to which tooth is sealed, health center staff are to review a sample of charts for this information
• National Comparison: • 2015 Health Center Program average: 42.5% • Healthy People 2020 goal: 28%
Tips to Assess Accuracy of Dental Sealants for Children Between 6–9 Years Data
60
TABLE 7: HEALTH OUTCOMES AND DISPARITIES
61
• Evaluate the extent to which medical patients are receiving clinical intervention which will lead to good long-term health outcomes • If these measurable outcomes are improved, then
later negative health outcomes will be less likely • Measurable process outcomes are evaluated
• Low Birth Weight • Controlling High Blood Pressure • Diabetes: Hemoglobin A1c Poor Control
Purpose of Table 7
62
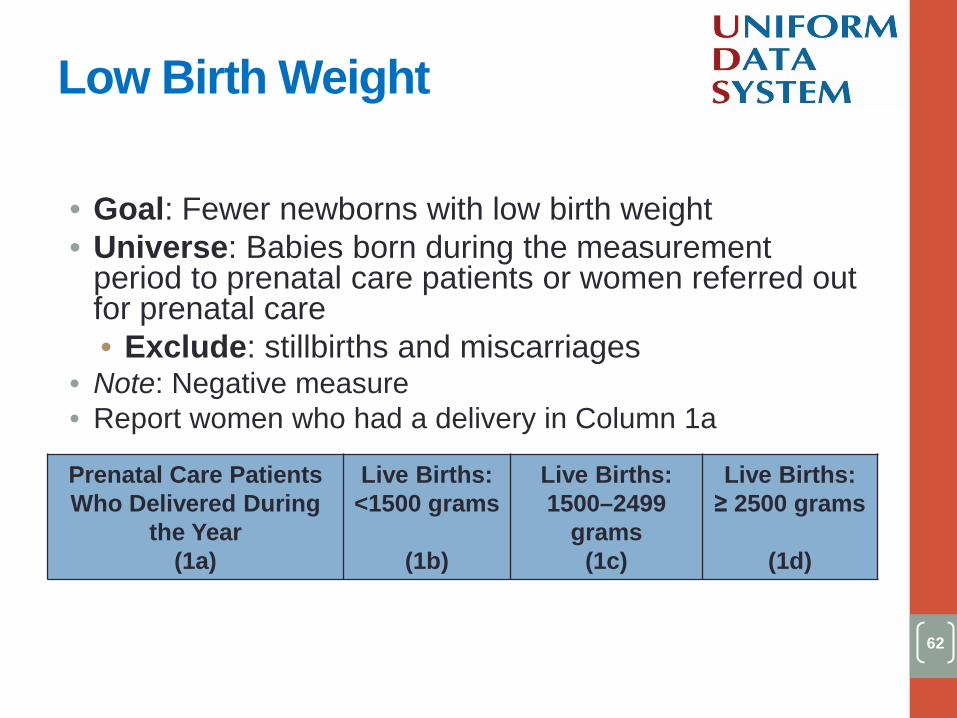
• Goal: Fewer newborns with low birth weight • Universe: Babies born during the measurement
period to prenatal care patients or women referred out for prenatal care • Exclude: stillbirths and miscarriages
• Note: Negative measure • Report women who had a delivery in Column 1a
Prenatal Care Patients Who Delivered During
the Year (1a)
Live Births: <1500 grams
(1b)
Live Births: 1500–2499
grams (1c)
Live Births: ≥ 2500 grams
(1d)
Low Birth Weight
63
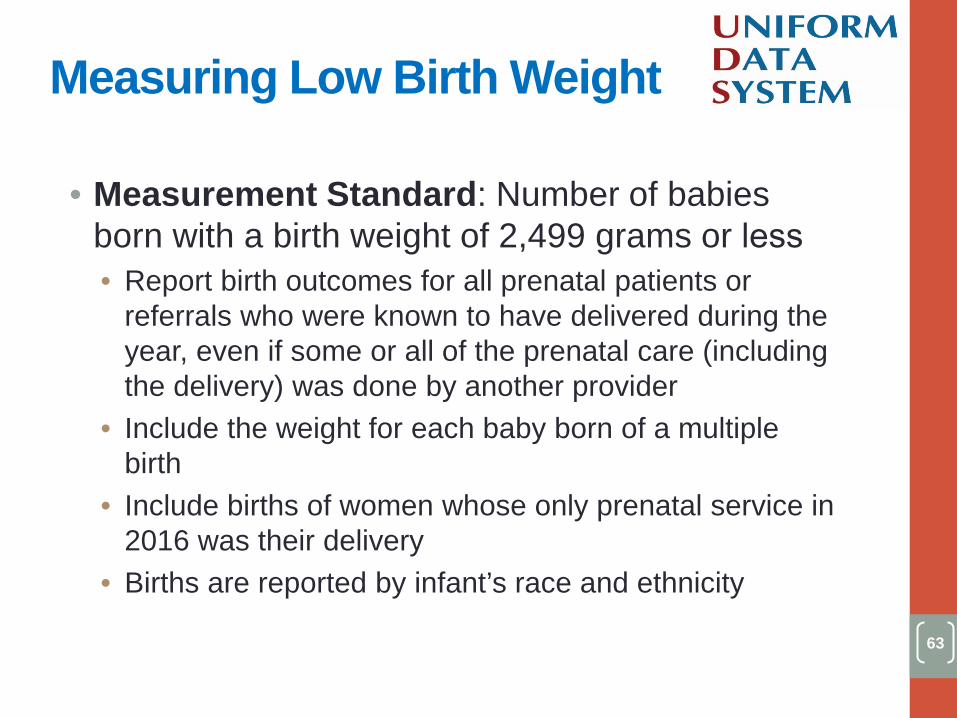
• Measurement Standard: Number of babies born with a birth weight of 2,499 grams or less• Report birth outcomes for all prenatal patients or
referrals who were known to have delivered during theyear, even if some or all of the prenatal care (includingthe delivery) was done by another provider
• Include the weight for each baby born of a multiplebirth
• Include births of women whose only prenatal service in2016 was their delivery
• Births are reported by infant’s race and ethnicity
Measuring Low Birth Weight
64
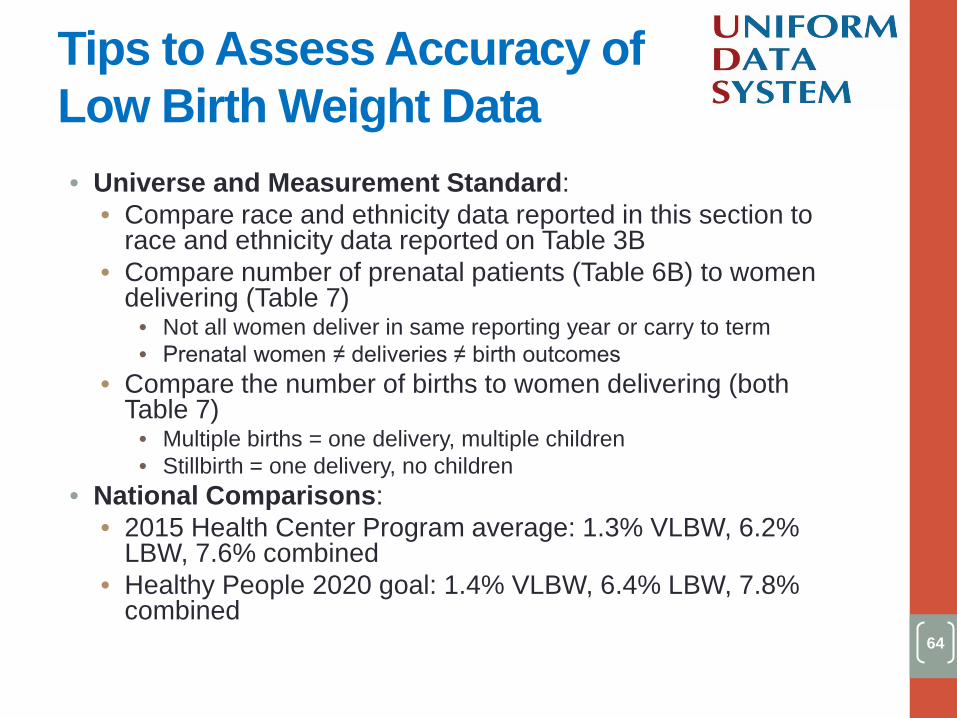
• Universe and Measurement Standard: • Compare race and ethnicity data reported in this section to
race and ethnicity data reported on Table 3B • Compare number of prenatal patients (Table 6B) to women
delivering (Table 7) • Not all women deliver in same reporting year or carry to term • Prenatal women ≠ deliveries ≠ birth outcomes
• Compare the number of births to women delivering (both Table 7)
• Multiple births = one delivery, multiple children • Stillbirth = one delivery, no children
• National Comparisons: • 2015 Health Center Program average: 1.3% VLBW, 6.2%
LBW, 7.6% combined • Healthy People 2020 goal: 1.4% VLBW, 6.4% LBW, 7.8%
combined
Tips to Assess Accuracy of Low Birth Weight Data
65
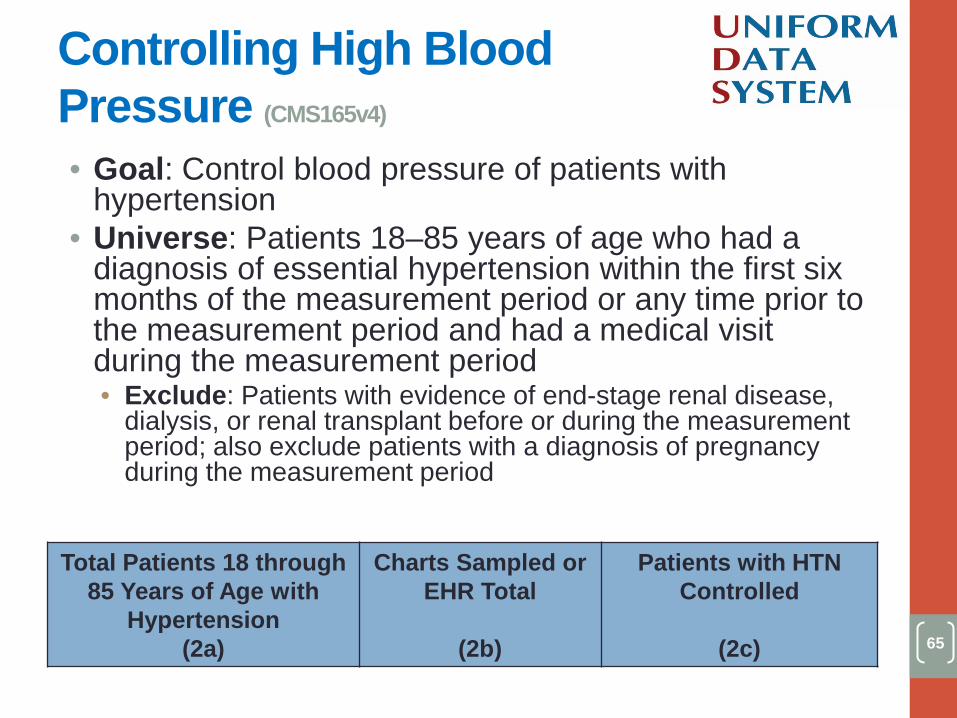
• Goal: Control blood pressure of patients with hypertension
• Universe: Patients 18–85 years of age who had a diagnosis of essential hypertension within the first six months of the measurement period or any time prior to the measurement period and had a medical visit during the measurement period • Exclude: Patients with evidence of end-stage renal disease,
dialysis, or renal transplant before or during the measurement period; also exclude patients with a diagnosis of pregnancy during the measurement period
Total Patients 18 through 85 Years of Age with
Hypertension (2a)
Charts Sampled or EHR Total
(2b)
Patients with HTN Controlled
(2c)
Controlling High Blood Pressure (CMS165v4)
66
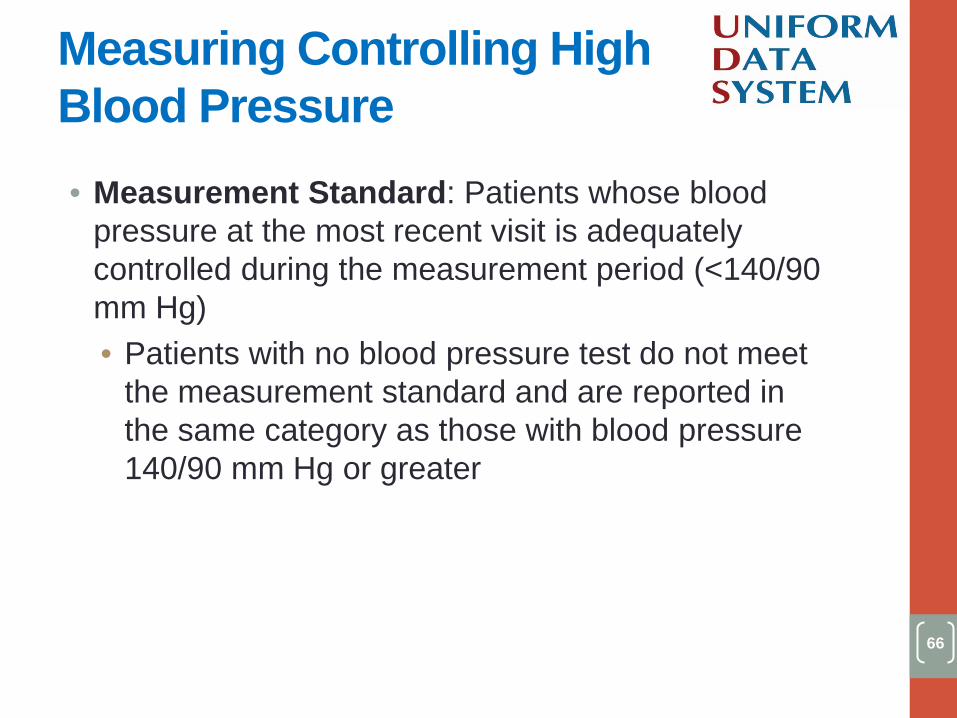
• Measurement Standard: Patients whose blood pressure at the most recent visit is adequately controlled during the measurement period (<140/90 mm Hg) • Patients with no blood pressure test do not meet
the measurement standard and are reported in the same category as those with blood pressure 140/90 mm Hg or greater
Measuring Controlling High Blood Pressure
67
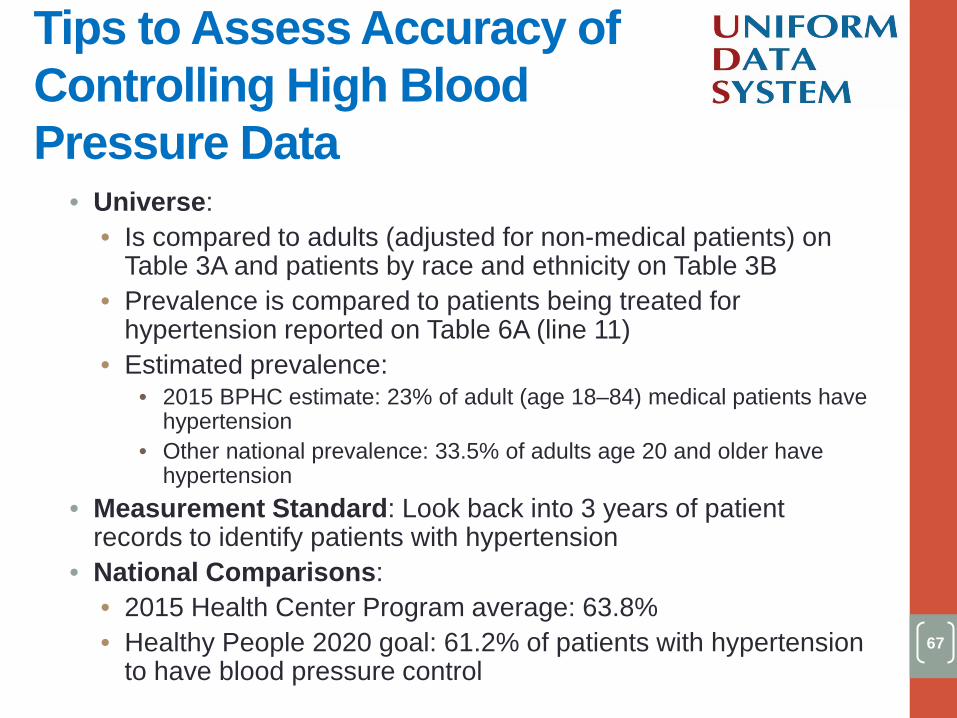
• Universe: • Is compared to adults (adjusted for non-medical patients) on
Table 3A and patients by race and ethnicity on Table 3B • Prevalence is compared to patients being treated for
hypertension reported on Table 6A (line 11) • Estimated prevalence:
• 2015 BPHC estimate: 23% of adult (age 18–84) medical patients have hypertension
• Other national prevalence: 33.5% of adults age 20 and older have hypertension
• Measurement Standard: Look back into 3 years of patient records to identify patients with hypertension
• National Comparisons: • 2015 Health Center Program average: 63.8% • Healthy People 2020 goal: 61.2% of patients with hypertension
to have blood pressure control
Tips to Assess Accuracy of Controlling High Blood Pressure Data
68
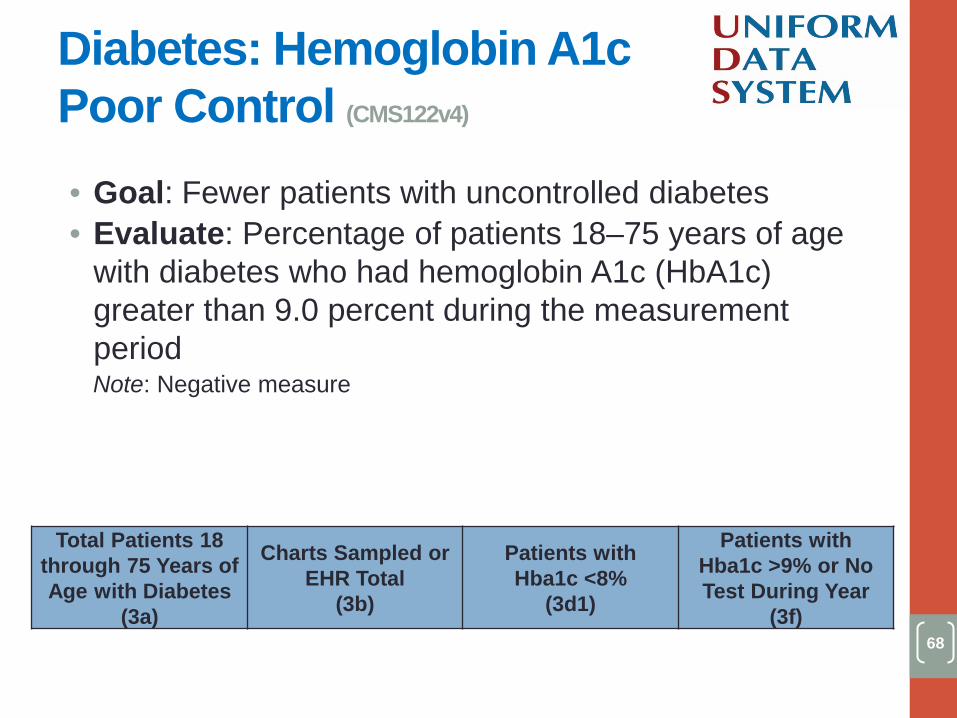
• Goal: Fewer patients with uncontrolled diabetes • Evaluate: Percentage of patients 18–75 years of age
with diabetes who had hemoglobin A1c (HbA1c) greater than 9.0 percent during the measurement period Note: Negative measure
Total Patients 18 through 75 Years of Age with Diabetes
(3a)
Charts Sampled or EHR Total
(3b)
Patients with Hba1c <8%
(3d1)
Patients with Hba1c >9% or No Test During Year
(3f)
Diabetes: Hemoglobin A1c Poor Control (CMS122v4)
69
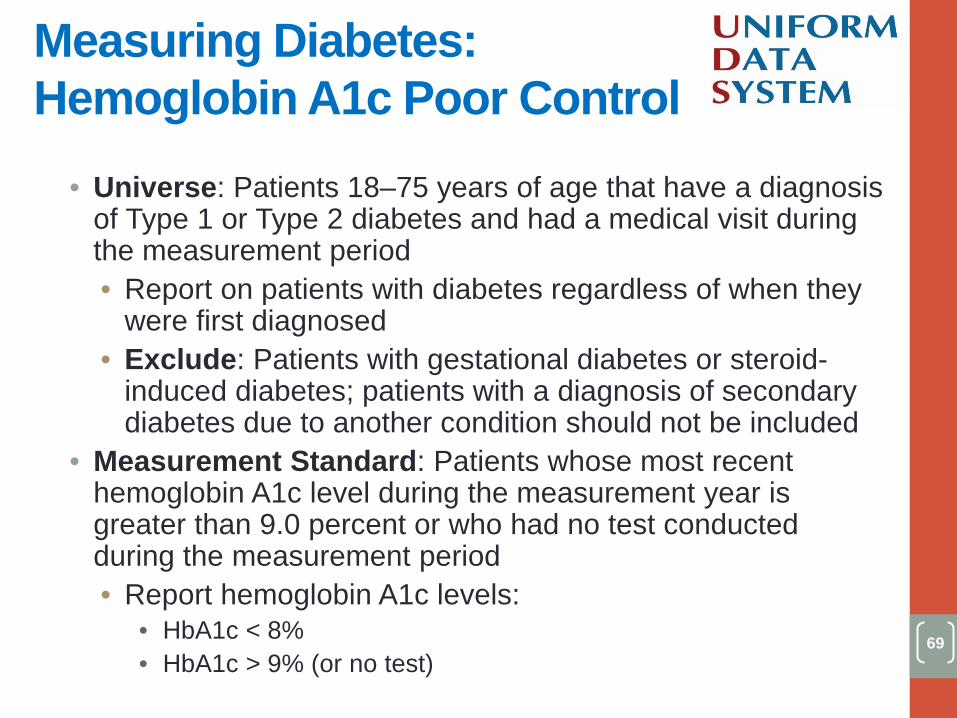
• Universe: Patients 18–75 years of age that have a diagnosis of Type 1 or Type 2 diabetes and had a medical visit during the measurement period • Report on patients with diabetes regardless of when they
were first diagnosed • Exclude: Patients with gestational diabetes or steroid-
induced diabetes; patients with a diagnosis of secondary diabetes due to another condition should not be included
• Measurement Standard: Patients whose most recent hemoglobin A1c level during the measurement year is greater than 9.0 percent or who had no test conducted during the measurement period • Report hemoglobin A1c levels:
• HbA1c < 8% • HbA1c > 9% (or no test)
Measuring Diabetes: Hemoglobin A1c Poor Control
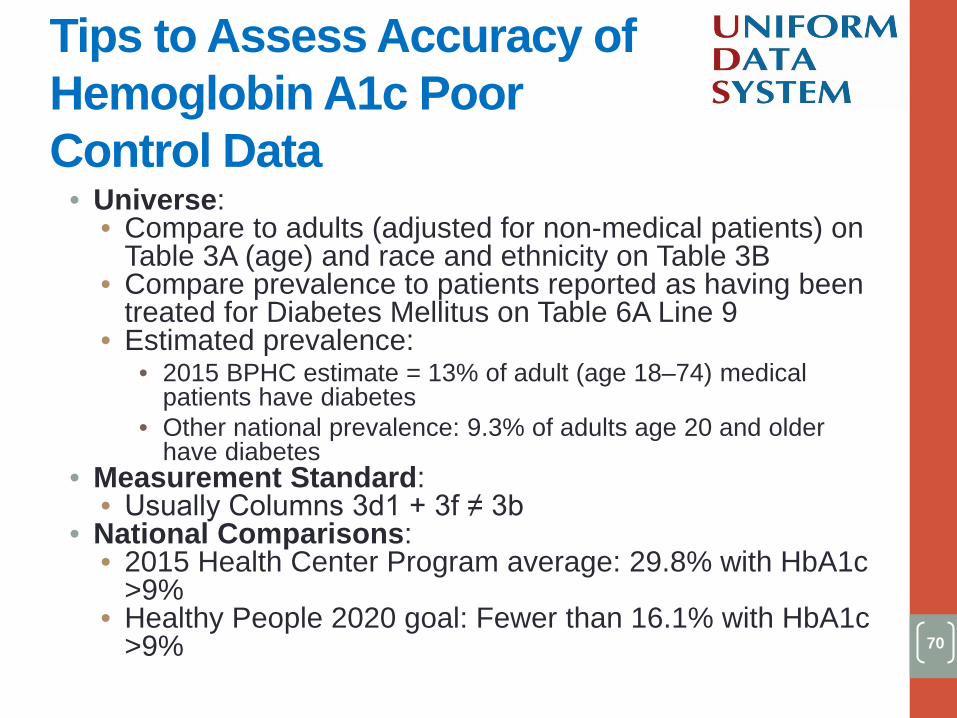
70
• Universe: • Compare to adults (adjusted for non-medical patients) on
Table 3A (age) and race and ethnicity on Table 3B • Compare prevalence to patients reported as having been
treated for Diabetes Mellitus on Table 6A Line 9 • Estimated prevalence:
• 2015 BPHC estimate = 13% of adult (age 18–74) medical patients have diabetes
• Other national prevalence: 9.3% of adults age 20 and older have diabetes
• Measurement Standard: • Usually Columns 3d1 + 3f ≠ 3b
• National Comparisons: • 2015 Health Center Program average: 29.8% with HbA1c
>9% • Healthy People 2020 goal: Fewer than 16.1% with HbA1c
>9%
Tips to Assess Accuracy of Hemoglobin A1c Poor Control Data
71
DATA REPORTING METHODS
72
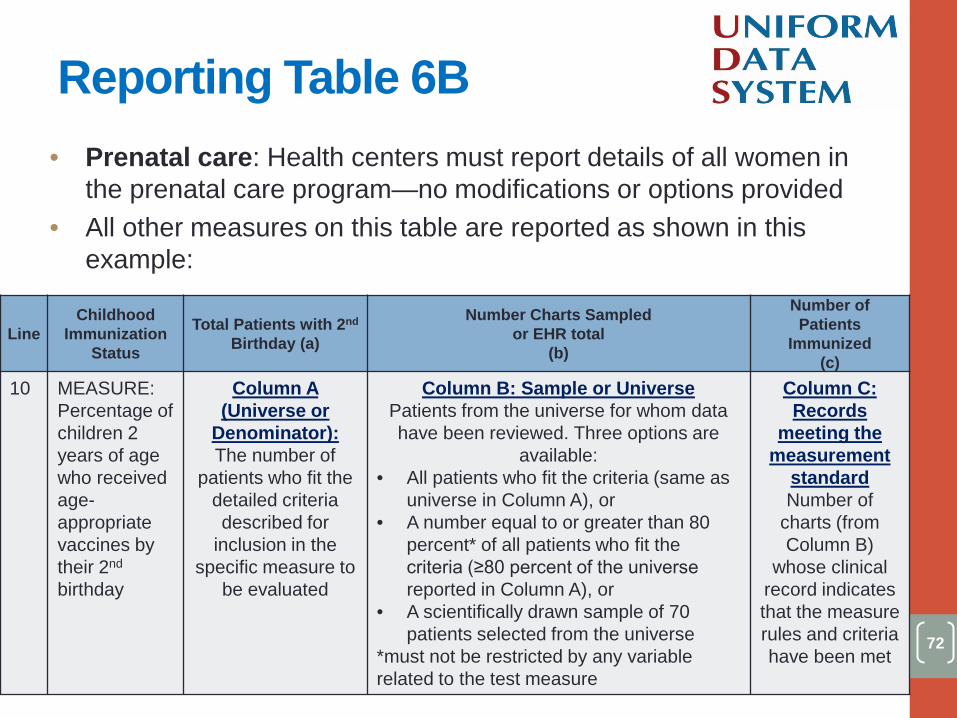
• Prenatal care: Health centers must report details of all women in the prenatal care program—no modifications or options provided
• All other measures on this table are reported as shown in this example:
Line Childhood
Immunization Status
Total Patients with 2nd Birthday (a)
Number Charts Sampled or EHR total
(b)
Number of Patients
Immunized (c)
10 MEASURE: Percentage of children 2 years of age who received age-appropriate vaccines by their 2nd
birthday
Column A (Universe or
Denominator): The number of
patients who fit the detailed criteria described for
inclusion in the specific measure to
be evaluated
Column B: Sample or Universe Patients from the universe for whom data have been reviewed. Three options are
available: • All patients who fit the criteria (same as
universe in Column A), or • A number equal to or greater than 80
percent* of all patients who fit the criteria (≥80 percent of the universe reported in Column A), or
• A scientifically drawn sample of 70 patients selected from the universe
*must not be restricted by any variable related to the test measure
Column C: Records
meeting the measurement
standard Number of
charts (from Column B)
whose clinical record indicates that the measure rules and criteria have been met
Reporting Table 6B
73
Prenatal Care Patients Who Delivered During the Year
(1a)
Live Births: <1500 grams
(1b)
Live Births: 1500–2499 grams
(1c)
Live Births: ≥ 2500 grams
(1d)
Total Patients 18 through 85 Years of Age with Hypertension (2a)
Charts Sampled or EHR Total (2b)
Patients with HTN Controlled (2c)
Total Patients 18 through 75 Years of Age with
Diabetes (3a)
Charts Sampled or EHR Total
(3b)
Patients with Hba1c <8% (3d1)
Patients with Hba1c >9% or No Test During Year
(3f)
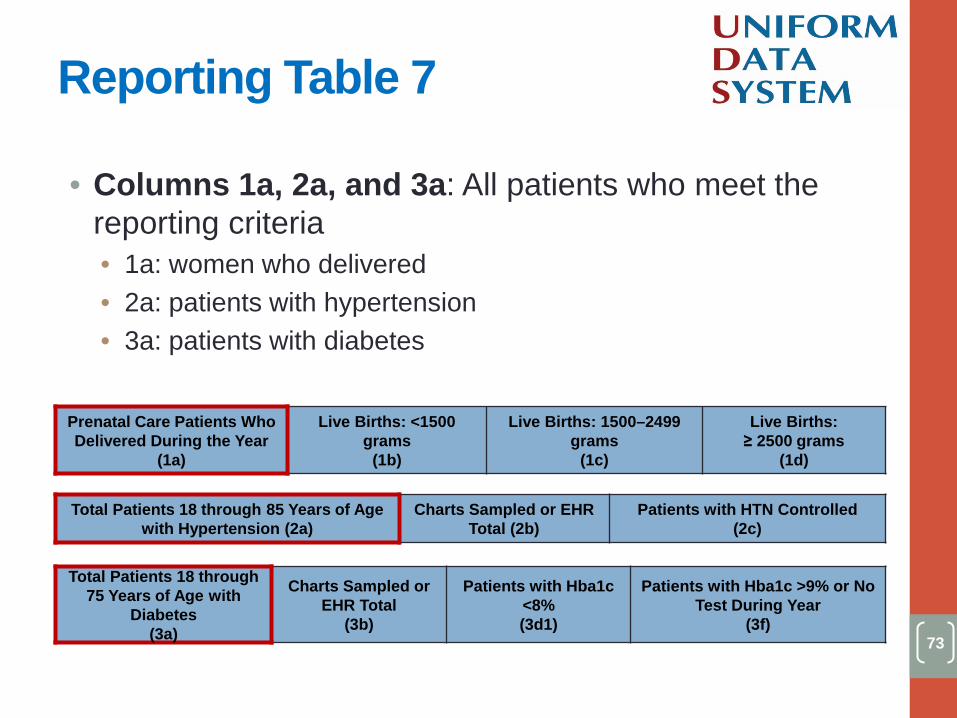
• Columns 1a, 2a, and 3a: All patients who meet the reporting criteria • 1a: women who delivered • 2a: patients with hypertension • 3a: patients with diabetes
Reporting Table 7
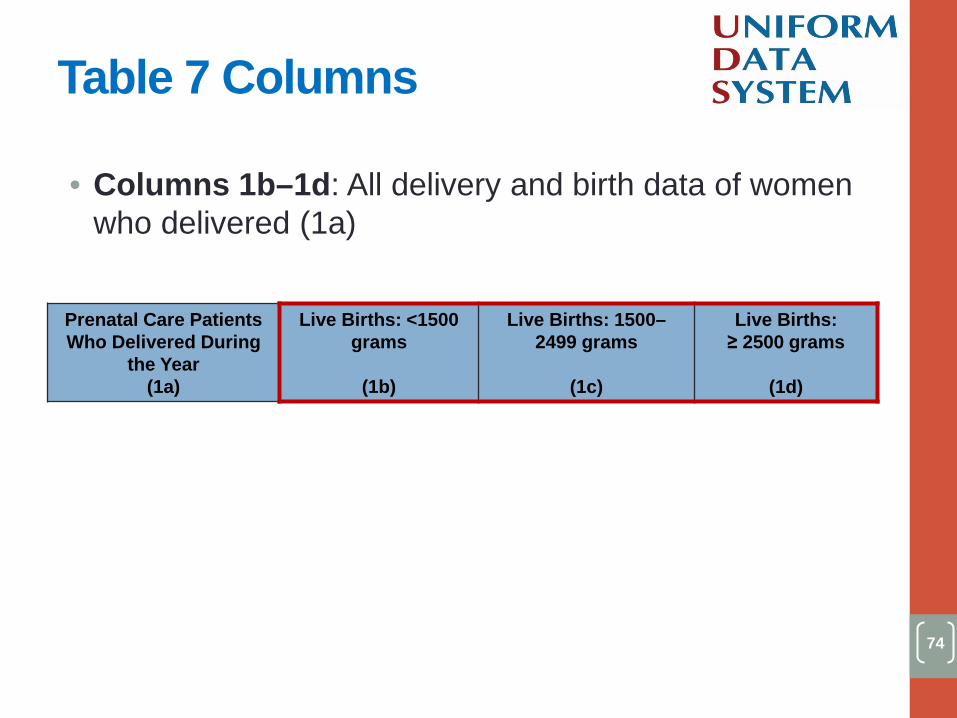
74
• Columns 1b–1d: All delivery and birth data of women who delivered (1a)
Prenatal Care Patients Who Delivered During
the Year (1a)
Live Births: <1500 grams
(1b)
Live Births: 1500– 2499 grams
(1c)
Live Births: ≥ 2500 grams
(1d)
Table 7 Columns
75
Total Patients 18 through 75 Years of Age with Diabetes
(3a)
Charts Sampled or EHR Total
(3b)
Patients with Hba1c <8% (3d1)
Patients with Hba1c >9% or No Test
During Year (3f)
Total Patients 18 through 85 Years of Age with Hypertension
(2a)
Charts Sampled or EHR Total
(2b)
Patients with HTN Controlled
(2c)
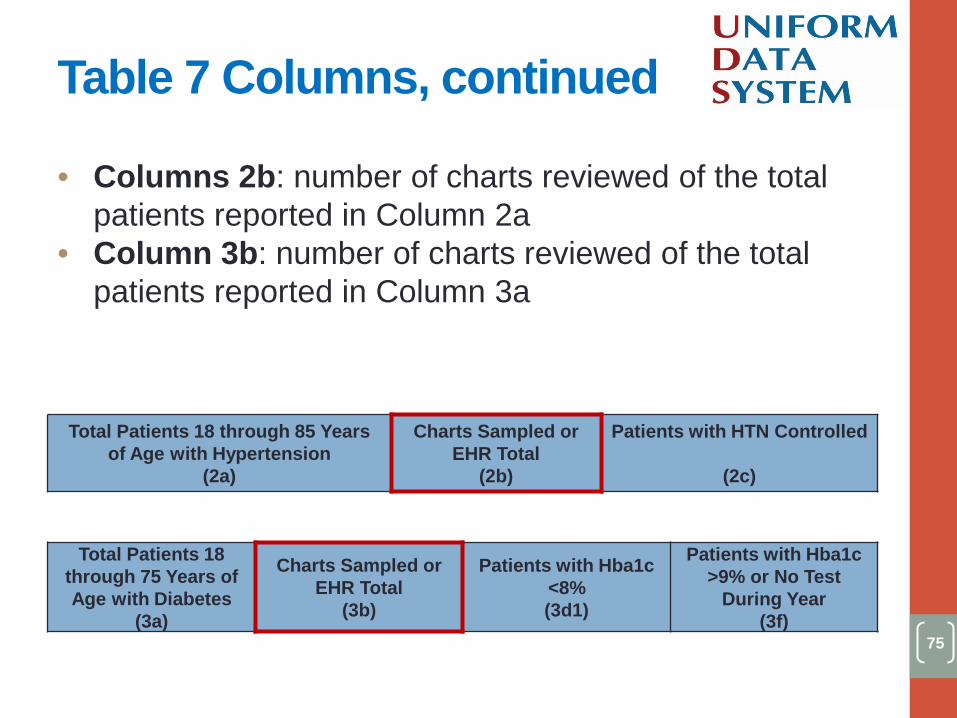
• Columns 2b: number of charts reviewed of the total patients reported in Column 2a
• Column 3b: number of charts reviewed of the total patients reported in Column 3a
Table 7 Columns, continued
76
Total Patients 18 through 75 Years of Age with Diabetes
(3a)
Charts Sampled or EHR Total
(3b)
Patients with Hba1c <8% (3d1)
Patients with Hba1c >9% or No Test
During Year (3f)
Total Patients 18 through 85 Years of Age with Hypertension
(2a)
Charts Sampled or EHR Total
(2b)
Patients with HTN Controlled
(2c)
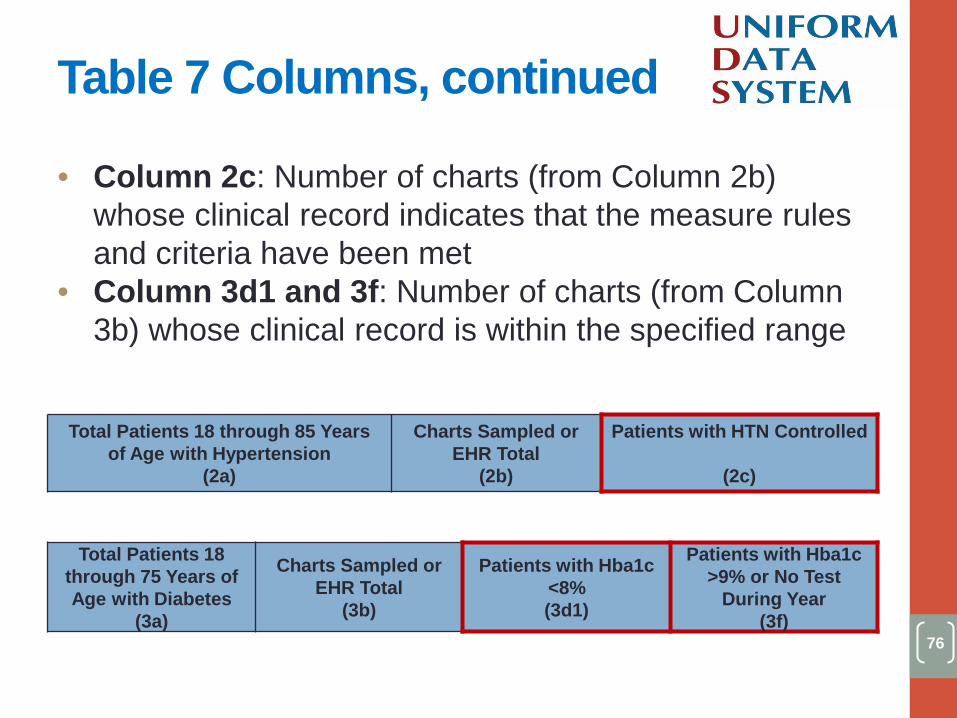
• Column 2c: Number of charts (from Column 2b) whose clinical record indicates that the measure rules and criteria have been met
• Column 3d1 and 3f: Number of charts (from Column 3b) whose clinical record is within the specified range
Table 7 Columns, continued
77
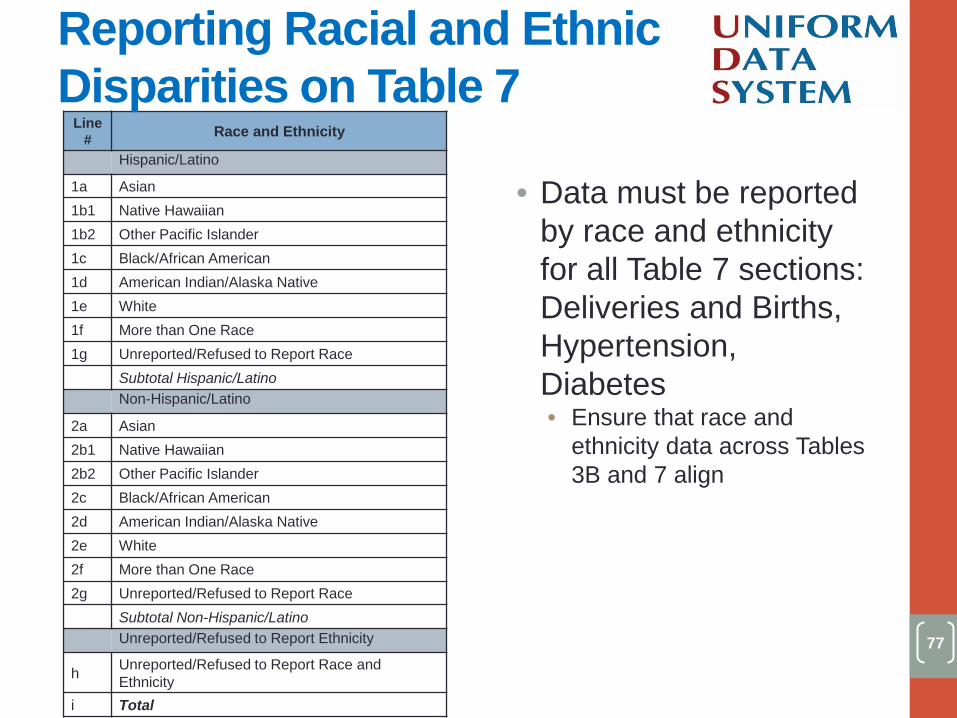
• Data must be reported by race and ethnicity for all Table 7 sections: Deliveries and Births, Hypertension, Diabetes • Ensure that race and
ethnicity data across Tables 3B and 7 align
Line # Race and Ethnicity
<blank for demonstration> Hispanic/Latino
1a Asian 1b1 Native Hawaiian 1b2 Other Pacific Islander 1c Black/African American 1d American Indian/Alaska Native 1e White 1f More than One Race 1g Unreported/Refused to Report Race Subtotal Subtotal Hispanic/Latino <blank for demonstration> Non-Hispanic/Latino
2a Asian 2b1 Native Hawaiian 2b2 Other Pacific Islander 2c Black/African American 2d American Indian/Alaska Native 2e White 2f More than One Race 2g Unreported/Refused to Report Race Subtotal Subtotal Non-Hispanic/Latino <blank for demonstration> Unreported/Refused to Report Ethnicity
h Unreported/Refused to Report Race and Ethnicity
i Total
Reporting Racial and Ethnic Disparities on Table 7
78
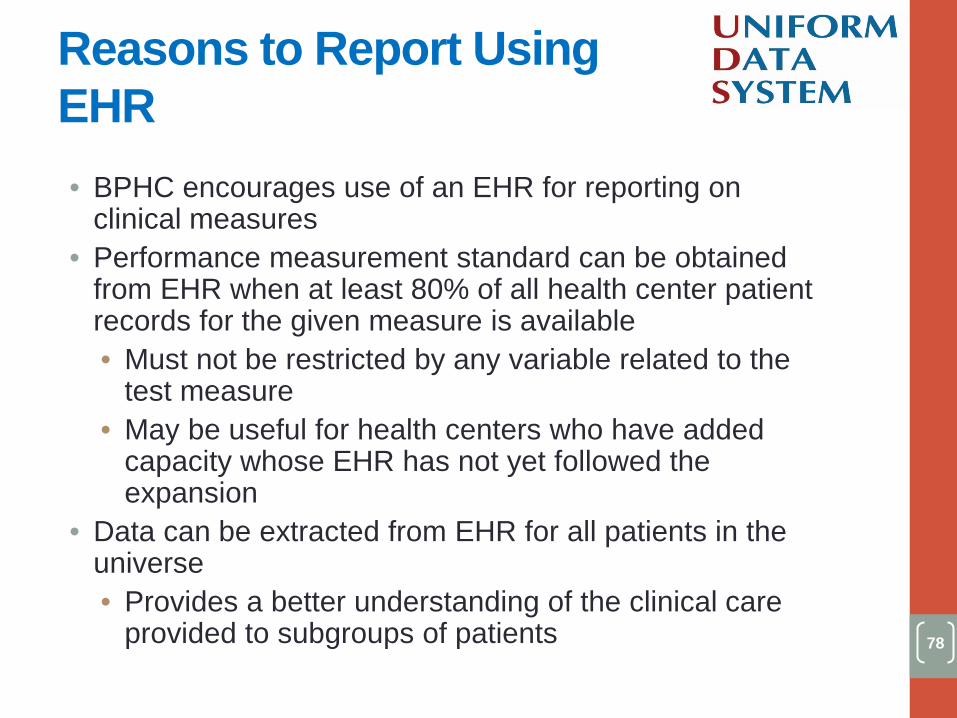
• BPHC encourages use of an EHR for reporting on clinical measures
• Performance measurement standard can be obtained from EHR when at least 80% of all health center patient records for the given measure is available • Must not be restricted by any variable related to the
test measure • May be useful for health centers who have added
capacity whose EHR has not yet followed the expansion
• Data can be extracted from EHR for all patients in the universe • Provides a better understanding of the clinical care
provided to subgroups of patients
Reasons to Report Using EHR
79
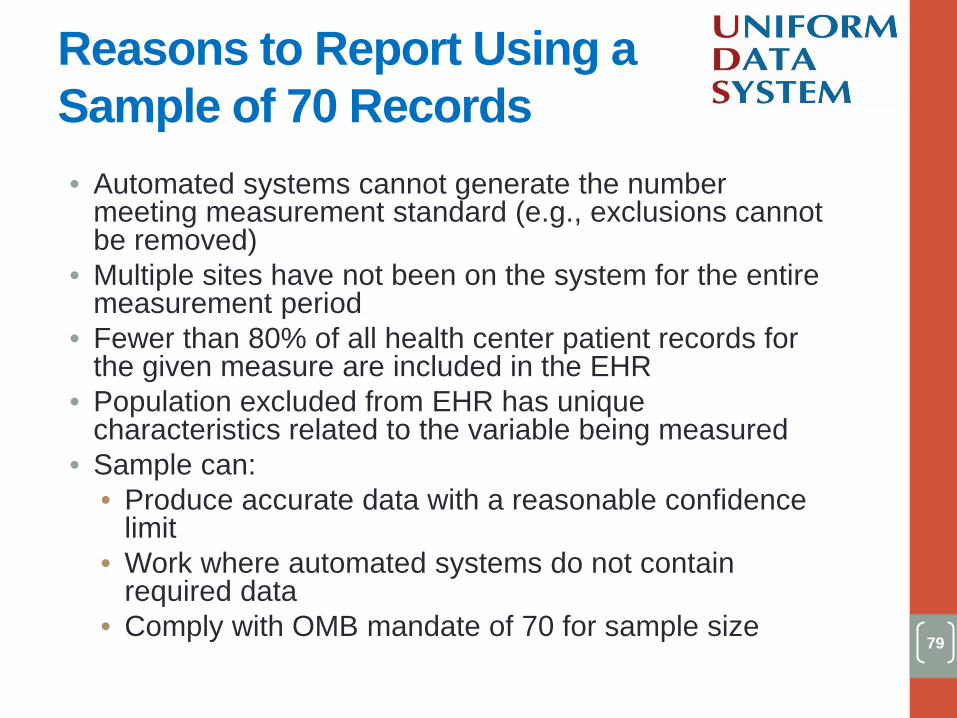
• Automated systems cannot generate the number meeting measurement standard (e.g., exclusions cannot be removed)
• Multiple sites have not been on the system for the entire measurement period
• Fewer than 80% of all health center patient records for the given measure are included in the EHR
• Population excluded from EHR has unique characteristics related to the variable being measured
• Sample can: • Produce accurate data with a reasonable confidence
limit • Work where automated systems do not contain
required data • Comply with OMB mandate of 70 for sample size
Reasons to Report Using a Sample of 70 Records
80
REMINDERS, STRATEGIES, AND REFERENCES
81
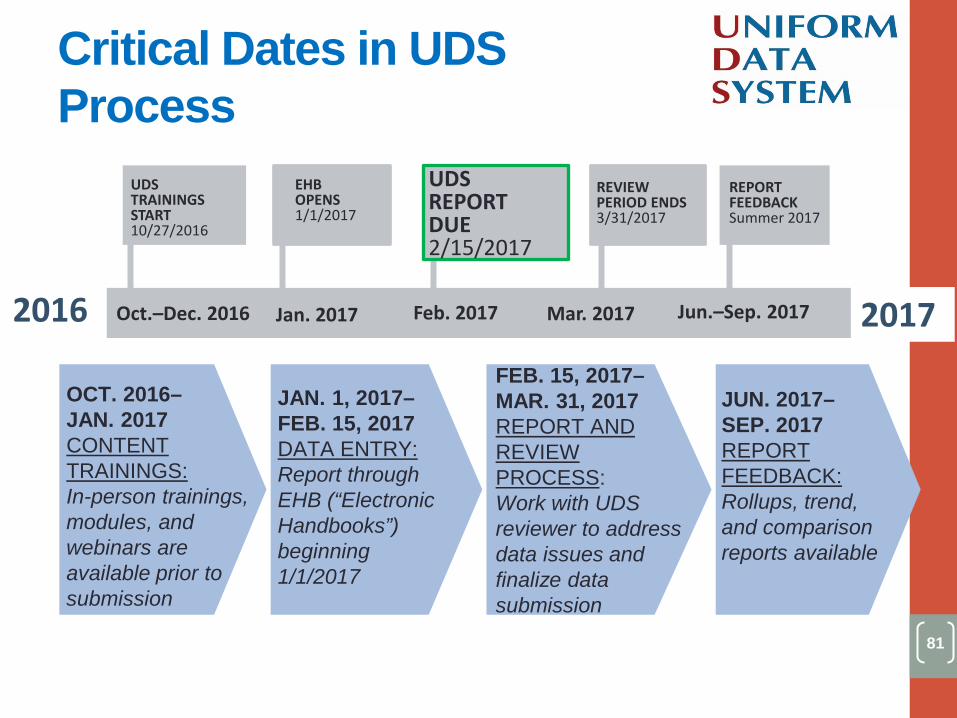
Oct.–Dec. 2016 Jan. 2017 Jun.–Sep. 2017 Feb. 2017 Mar. 2017 2016 2017
UDS TRAININGS START 10/27/2016
EHB OPENS 1/1/2017
UDS REPORT DUE 2/15/2017
REVIEW PERIOD ENDS 3/31/2017
REPORT FEEDBACK Summer 2017
OCT. 2016– JAN. 2017 CONTENT TRAININGS: In-person trainings, modules, and webinars are available prior to submission
FEB. 15, 2017–MAR. 31, 2017 REPORT AND REVIEW PROCESS: Work with UDS reviewer to address data issues and finalize data submission
JUN. 2017– SEP. 2017 REPORT FEEDBACK: Rollups, trend, and comparison reports available
JAN. 1, 2017– FEB. 15, 2017 DATA ENTRY: Report through EHB (“Electronic Handbooks”) beginning 1/1/2017
Critical Dates in UDS Process
82
• Work as a team: Tables are interrelated • Adhere to definitions and instructions: Refer to the manual,
fact sheets, and other resources and apply definitions • Check your data before submitting
• Check data trends and relationships across tables, refer to last year’s reviewer’s letter, and compare data to benchmarks
• Address edits in electronic handbook (EHB) by correcting or providing explanations that demonstrate your understanding
• “The number is correct” is not sufficient • Report on time but do not submit incomplete reports
• Work with your reviewer
Strategies for Successful Reporting
83
• Local trainings: http://www.bphcdata.net/html/bphctraining.html • Online training modules, manual, fact sheets, webinars,
and other technical assistance materials, including PALs available: • BPHC HRSA Website • UDS Training Website
• Technical support from a UDS reviewer during the review period
• Primary Care Associations or National Cooperative Agreements
• Telephone and email support line for UDS reporting questions and use of UDS data: 866-837-4357 or EHB Support • HRSA Call Center for EHB account access and roles: 877-464-4772 • BPHC Helpline for EHB system issues: 877-974-2742
Available Assistance

84
• eCQI Resource Center • Clinical Quality Measures • National Quality Forum • Million Hearts Hypertension Control Change Package • Substance Abuse and Mental Health Services Administration
(SAMHSA)-HRSA Center for Integrated Health Solutions for resources related to depression screening and follow-up
• United States Health Information Knowledgebase (USHIK) • Healthy People 2020 • U.S. Preventive Services Task Force
• Obesity in Adults Screening • HIV Screening
• State Tobacco Statistics • State Diabetes Statistics • CDC National Center for Health Statistics State Facts
Performance Measures References
85
Upcoming Webinars • Using UDS Data and Reports for Program
Evaluation and Quality (1/11/2017) Past Webinars • Preparing for and Understanding Your UDS
Submission (11/17/2016) • UDS for Bureau of Health Workforce Grantees
(11/3/2016) Webinars will be archived on HRSA’s BPHC Health Center Program website.
Webinars
86
Questions?
87
Thank you for attending this webinar and for all of your hard work to provide comprehensive and
accurate data to BPHC!
Ongoing questions can be addressed to [email protected]
866-UDS-HELP
Thank you!