introduction to wireshark network analysis - software...
TRANSCRIPT

Introduction to Wireshark Network Analysis

Page 2 of 24
Table of Contents
INTRODUCTION 4
Overview 4
CAPTURING LIVE DATA 5
Preface 6
Capture Interfaces 6
Capture Options 6
Performing the Capture 8
ANALYZING CAPTURED PACKETS 10
Packet List Pane 11
No. 11
Time 11
Source 11
Destination 11
Protocol 11
Info 11
Filtering Packets 11
Filter Expressions 12
Following TCP Streams 18
Time Stamps 20
Wireshark Messages 20
Packet List Messages 20
Packet Details Messages 21
Page 3 of 24
RESOURCES 23
Website 23
Wiki 23
Q&A Site 23
CONCLUSION 24

Page 4 of 24
Introduction
The purpose of this paper is to provide the reader with an overview of the Wireshark packet capture utility
and how it can be used. Wireshark is a network packet analyzer, meaning it will try to capture network
packets and display the packet data with as much detail as possible. A network packet analyzer is an
application used to examine what’s going on inside a network cable, similar to how a voltmeter is used by
an electrician to examine what’s going on inside an electric cable.
Overview
Wireshark can capture traffic from various network media types, including wireless LAN. The supported
media types can be found at http://wiki.wireshark.org/CaptureSetup/NetworkMedia. In addition, Wireshark
can open packets captured from a large number of other capture programs, and save packets captured in a
large number of formats of other capture programs. Wireshark is an open source software project, and is
released under the GNU General Public License. This means you can use Wireshark on any number of
computers, and all source code is freely available under the GPL. Wireshark does not manipulate anything
on the network or send any packets on the network—it only analyzes data from the network.
Page 5 of 24
Capturing Live Data
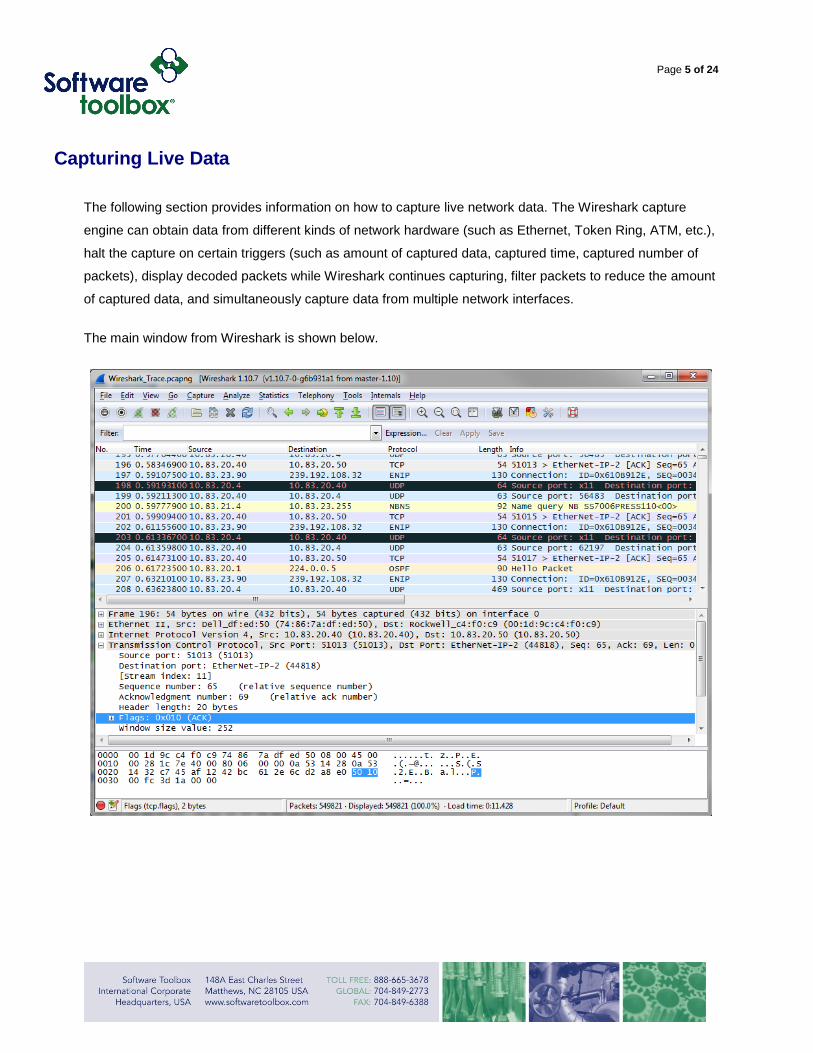
The following section provides information on how to capture live network data. The Wireshark capture
engine can obtain data from different kinds of network hardware (such as Ethernet, Token Ring, ATM, etc.),
halt the capture on certain triggers (such as amount of captured data, captured time, captured number of
packets), display decoded packets while Wireshark continues capturing, filter packets to reduce the amount
of captured data, and simultaneously capture data from multiple network interfaces.
The main window from Wireshark is shown below.

Page 6 of 24
Preface
It can be difficult to set up Wireshark to capture packets for the first time. You are required to have
Administrator privileges to start a live capture. Make sure to choose the right network interface to capture
data from, and run your capture during the correct time to include the network traffic you want to see.
The following sections will explore the Wireshark user interface and provide you with a guide to capturing
live data.
Capture Interfaces
When you select "Interfaces" from the Capture menu, you will see the dialog box below. Because the
"Capture Interfaces" dialog is capturing live data, it consumes a lot of system resources. Therefore, you will
want to close this dialog as soon as possible to prevent excessive system load.
All of the available interfaces may not be displayed. This dialog box will only show the local interfaces of
which Wireshark is aware. It will not show interfaces marked as hidden, or detect the remote interfaces
available. The toggle buttons can be used to select one or more interfaces.
Capture Options
When you select “Options” from the Capture menu, you will see the following dialog box. In most cases, the
default settings here are fine.

Page 7 of 24
The capture frame shows the settings for all available interfaces. By marking the checkboxes in the first
column, the interfaces are selected to be captured from. As Wireshark can capture on multiple interfaces, it
is possible to choose to capture on all available interfaces. Normally a network interface will only "receive"
packets directly addressed to the interface. Promiscuous mode allows the interface to receive all packets
that it sees whether they are addressed to the interface or not.
The “Capture Filter” field allows you to specify a filter for all interfaces selected. The “File” field allows you to
specify the file name that will be used for the capture file. If the field is left blank, the capture data will be
Page 8 of 24
stored in a temporary file. By checking “Use multiple files”, Wireshark will automatically switch to a new file
when a specific trigger condition occurs.
Enabling “Resolve MAC addresses” or “Resolve network-layer names” allows you to control whether or not
Wireshark translates these addresses into names. “Resolve transport-layer name” allows you to control
whether or not Wireshark translates transport addresses into protocols.
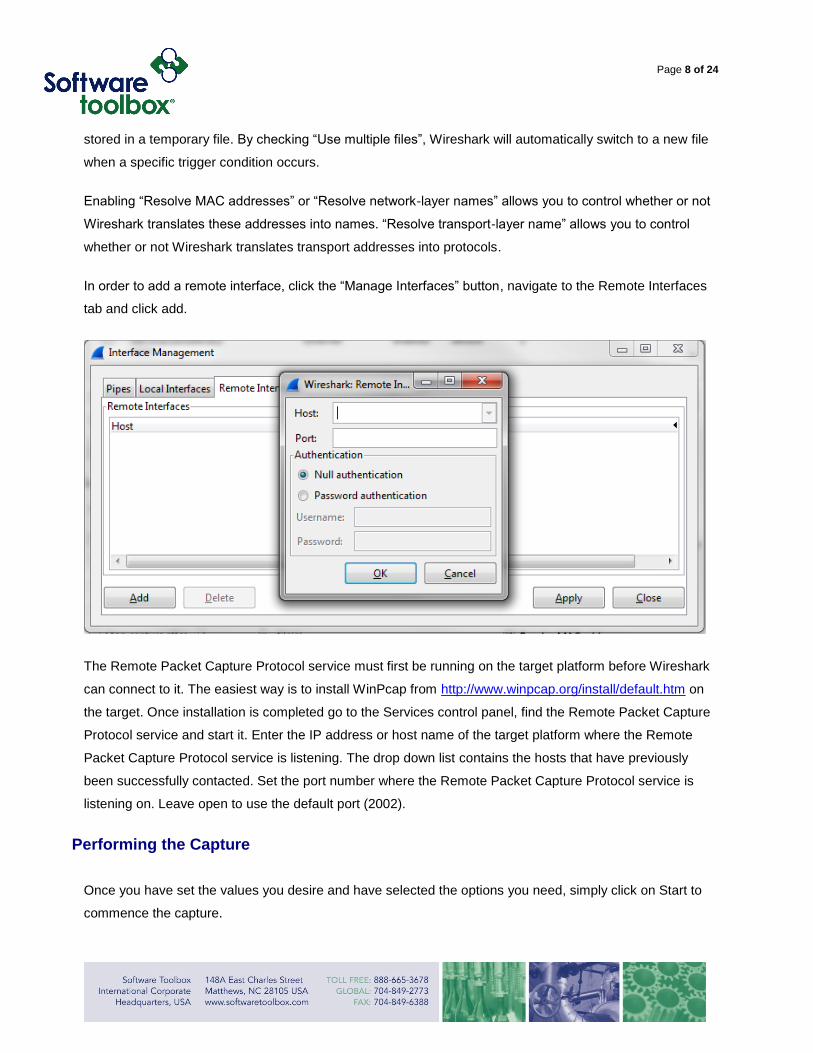
In order to add a remote interface, click the “Manage Interfaces” button, navigate to the Remote Interfaces
tab and click add.
The Remote Packet Capture Protocol service must first be running on the target platform before Wireshark
can connect to it. The easiest way is to install WinPcap from http://www.winpcap.org/install/default.htm on
the target. Once installation is completed go to the Services control panel, find the Remote Packet Capture
Protocol service and start it. Enter the IP address or host name of the target platform where the Remote
Packet Capture Protocol service is listening. The drop down list contains the hosts that have previously
been successfully contacted. Set the port number where the Remote Packet Capture Protocol service is
listening on. Leave open to use the default port (2002).
Performing the Capture
Once you have set the values you desire and have selected the options you need, simply click on Start to
commence the capture.

Page 9 of 24
When you are reading to stop the capture, you can choose stop from the Capture Menu or select the stop
button from the main toolbar.
You can save captured packets simply by using the “Save As” menu item from the File menu under
Wireshark. You can choose which packets to save and which file format to be used.
Page 10 of 24
Analyzing Captured Packets
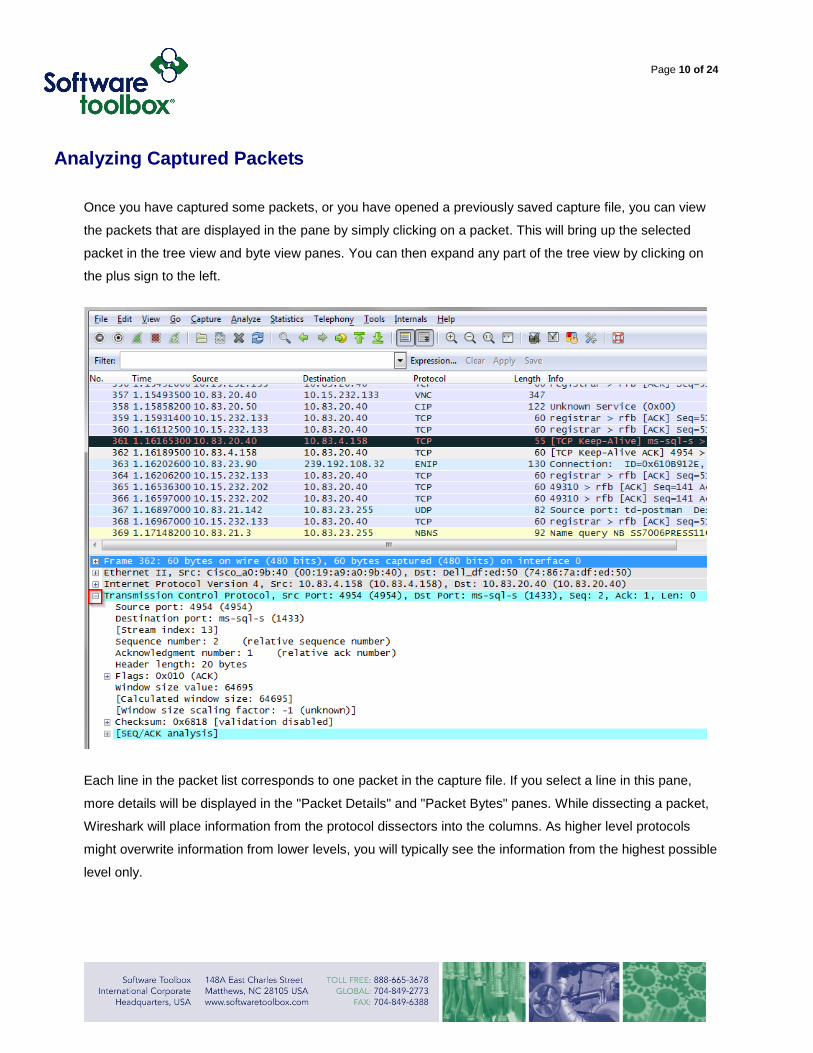
Once you have captured some packets, or you have opened a previously saved capture file, you can view
the packets that are displayed in the pane by simply clicking on a packet. This will bring up the selected
packet in the tree view and byte view panes. You can then expand any part of the tree view by clicking on
the plus sign to the left.
Each line in the packet list corresponds to one packet in the capture file. If you select a line in this pane,
more details will be displayed in the "Packet Details" and "Packet Bytes" panes. While dissecting a packet,
Wireshark will place information from the protocol dissectors into the columns. As higher level protocols
might overwrite information from lower levels, you will typically see the information from the highest possible
level only.
Page 11 of 24
Packet List Pane
The default columns will show the following items.
No.
The number of the packet in the capture file. This number won't change, even if a display filter is used.
Time
The timestamp of the packet. The presentation format of this timestamp can be changed.
Source
The address where this packet is coming from.
Destination
The address where this packet is going to.
Protocol
The protocol name in an abbreviated version.
Info
Additional information about the packet content. You can sort the packets by Source, Destination, Protocol,
etc. by clicking on the corresponding column header.
Filtering Packets
Display filters allow you to concentrate on the packets of interest. They allow you to select packets by
Protocol, the presence of a field, the values of fields, a comparison between fields, etc.
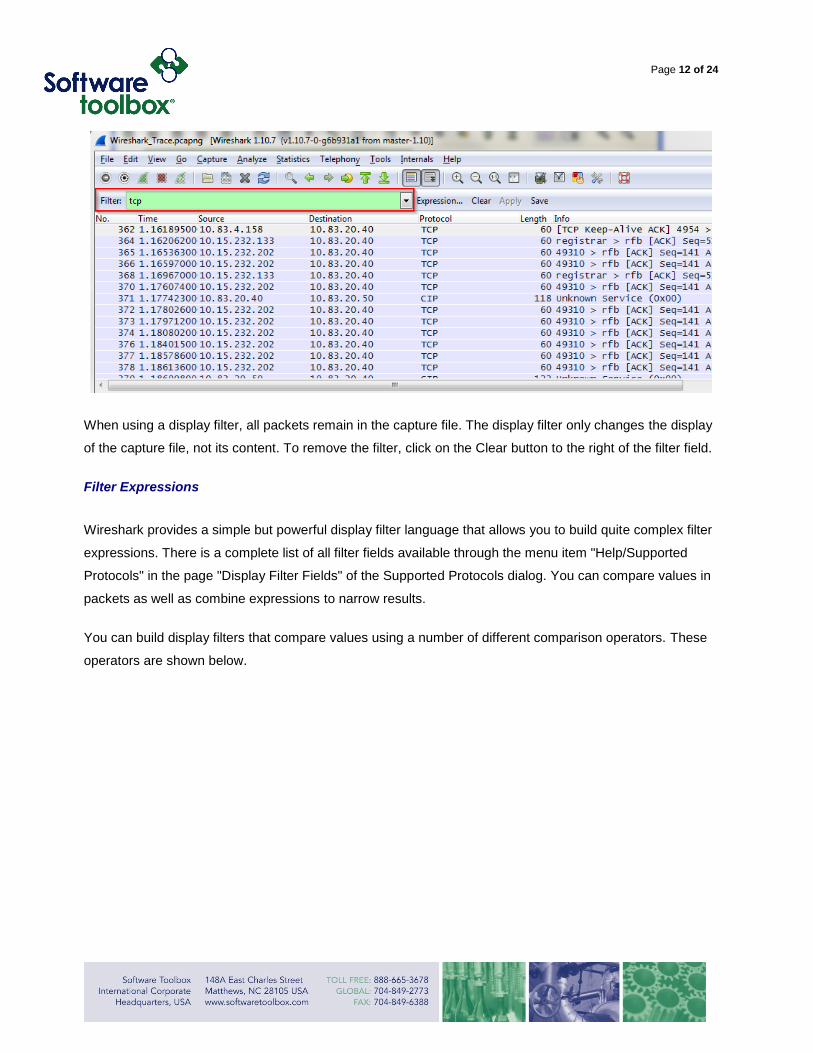
To select packets based on protocol type, simply type the protocol in which you are interested in the filter
toolbar of the Wireshark window and press enter. All protocol and field names are entered in lowercase.
Page 12 of 24
When using a display filter, all packets remain in the capture file. The display filter only changes the display
of the capture file, not its content. To remove the filter, click on the Clear button to the right of the filter field.
Filter Expressions
Wireshark provides a simple but powerful display filter language that allows you to build quite complex filter
expressions. There is a complete list of all filter fields available through the menu item "Help/Supported
Protocols" in the page "Display Filter Fields" of the Supported Protocols dialog. You can compare values in
packets as well as combine expressions to narrow results.
You can build display filters that compare values using a number of different comparison operators. These
operators are shown below.

Page 13 of 24
People often use a filter string to display something like ip.addr == 1.2.3.4, which will display all packets
containing the IP address 1.2.3.4. They use ip.addr != 1.2.3.4 to see all packets not containing the IP
address 1.2.3.4 in it. Unfortunately, this does display the expected results.
Instead, that expression will be true for packets with a source or destination IP address equal to 1.2.3.4.
This is because the expression ip.addr != 1.2.3.4 must be read as "the packet contains a field named
ip.addr with a value different from 1.2.3.4". Since an IP datagram contains both a source and a destination
address, the expression will evaluate to true whenever at least one of the two addresses differs from
1.2.3.4.

Page 14 of 24
If you want to filter out all packets containing IP datagrams to or from IP address 1.2.3.4, then the correct
filter is !(ip.addr == 1.2.3.4) because it reads "show me all the packets for which it is not true that a field
named ip.addr exists with a value of 1.2.3.4", or in other words, "filter out all packets for which there are no
occurrences of a field named ip.addr with the value 1.2.3.4".
All protocol fields are typed. You can find a list of the different display filter field types along with expression
examples below.

Page 15 of 24
Page 16 of 24
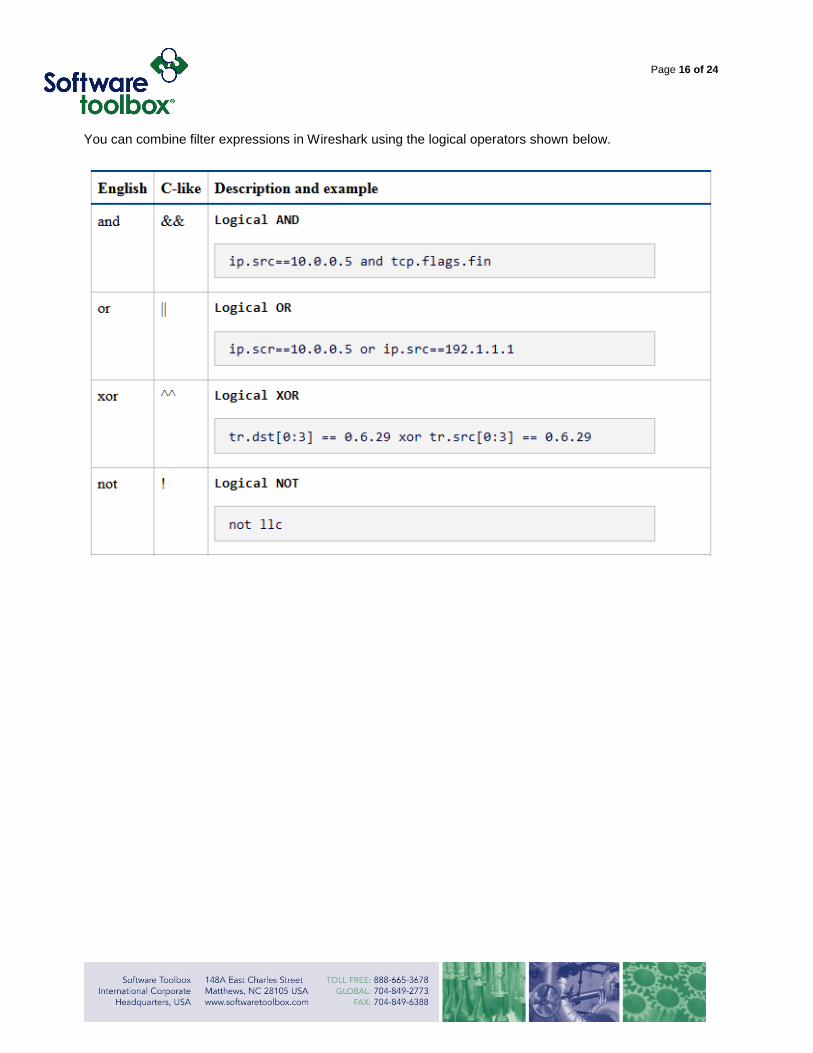
You can combine filter expressions in Wireshark using the logical operators shown below.

Page 17 of 24

Page 18 of 24
When you are familiar with the Wireshark filtering system and know what labels you want to use in your
filters, it can be quick and easy to type a filter string. However, if you are new to Wireshark or are working
with a slightly unfamiliar protocol, it can be very confusing to do so. The Filter Expression dialog box, shown
below, helps with this.
Following TCP Streams
If you are working with TCP based protocols it can be helpful to see the data from a TCP stream in the way
that the application layer sees it. To do this, select a TCP packet in the stream you are interested in, and
then select the Follow TCP Stream menu item from the Wireshark Tools menu or the context menu in the
packet list.

Page 19 of 24
Wireshark will set an appropriate display filter and pop up a dialog box with all the data from the TCP
stream in order. “Follow TCP Stream” installs a display filter to select all the packets in the TCP stream you
have selected.

Page 20 of 24
The stream content is displayed in the same sequence as it appeared on the network. Traffic from A to B is
marked in red, while traffic from B to A is marked in blue. Non-printable characters will be replaced by dots.
The stream content won't be updated while doing a live capture. To obtain the latest content you will need
to reopen the dialog.
Time Stamps
Each packet is time stamped as it comes in. While capturing, Wireshark gets the time stamps from the
WinPcap library, which in turn gets them from the operating system. If the capture data is loaded from a
capture file, Wireshark gets the data from that file.
The internal format that Wireshark uses to keep a packet time stamp consists of the date (in days since
1.1.1970) and the time of day (in nanoseconds since midnight). You can adjust the way Wireshark displays
the time stamp data in the packet list. While reading or writing capture files, Wireshark converts the time
stamp data between the capture file format and the internal format as required. Wireshark uses the
WinPcap capture library, which supports microsecond resolution. Unless you are working with specialized
capturing hardware, this resolution should be fine.
Every capture file format that Wireshark knows supports time stamps. The time stamp precision supported
by a specific capture file format differs widely. The common capture file format that is used by Wireshark
supports a fixed microsecond resolution "0.123456" only. Writing data into a capture file format that doesn't
provide the capability to store the actual precision will lead to loss of information.
Wireshark does not create any time stamps itself, but simply obtains them from somewhere else. Therefore,
accuracy will depend on the capture system (operating system, performance, etc.) that you use. USB
connected network adapters usually have poor time stamp accuracy.
Wireshark Messages
Wireshark provides you with additional information generated out of the plain packet data or it may need to
indicate dissection problems. Messages generated by Wireshark are usually placed in brackets.
Packet List Messages
The following messages might appear in the packet list.
Page 21 of 24
[Malformed Packet]
Malformed packet means the protocol dissector cannot dissect the contents of the packet any further. This
can be caused by any of the reasons shown below.
1. Wireshark may have chosen the wrong protocol dissector for this packet. This will happen if you are
using a protocol on an abnormal TCP or UDP port. You can try selecting Analyze | Decode to fix
this problem.
2. The packet is longer than a single frame and it is not reassembled.
3. The packet is actually wrong (malformed), meaning that a part of the packet does not follow the
protocol specifications.
4. The corresponding protocol dissector contains bugs, or is still incomplete.
You will have to look into the specific situation to determine the reason. You could disable the dissector by
disabling the protocol on the Analyze menu, and then check how Wireshark displays the packet. If it’s TCP,
you could enable reassembly for TCP and the specific dissector in the Edit | Preferences menu. You could
also check the packet contents yourself by reading the packet bytes and comparing it to the protocol
specification. This could reveal a dissector bug or confirm that the packet is indeed wrong.
[Packet size limited during capture]
The packet size was limited during capture means that, while dissecting, the current protocol dissector ran
out of packet bytes and had to stop. The only solution is to repeat the entire capture process again with a
higher packet size limitation.
Packet Details Messages
The following messages might appear in the packet details.
[Response in frame: 123]
This message means the current packet is the request of a detected request/response pair. You can jump
to the corresponding response packet by double clicking on this message.
Page 22 of 24
[Request in frame: 123]
Same as "Response in frame: 123". See above.
[Time from request: 0.123 seconds]
This message is the time between the request and the response packets.
[Stream setup by PROTOCOL (frame 123)]
The session control protocol (SDP, H225, etc.) message signaled the creation of this session. You can
jump to the corresponding packet by double clicking on this message.

Page 23 of 24
Resources
If you have problems or need help with Wireshark, there are several places you can look.
Website
You will find lots of useful information on the Wireshark homepage at http://www.wireshark.org.
You can get the latest copy of the program from the Wireshark website at
http://www.wireshark.org/download.html.
Wiki
The Wireshark Wiki at http://wiki.wireshark.org provides a wide range of information related to Wireshark
and packet capture in general. You will find a lot of information that is not included in this document.
Q&A Site
The Wireshark Q&A site at http://ask.wireshark.org offers a resource for questions. You can search what
questions were asked before and what answers were given by people who knew about the issue.

Page 24 of 24
Conclusion
This document is meant to give the reader a brief overview of network troubleshooting using Wireshark. As
always, if you need help troubleshooting do not hesitate to contact us.
Please send your questions to [email protected] and we will respond as quickly as possible.
We would also welcome any feedback you have regarding this or any of our other papers.