introduction - university of central florida€¦ · web viewgiven the recent growth of bss...
TRANSCRIPT

Hail a Cab or Ride a Bike? A Travel Time Comparison of Taxi and Bicycle-Sharing Systems in New York City
Ahmadreza Faghih-ImaniPostdoctoral Fellow
Department of Civil EngineeringUniversity of Toronto
E-mail: [email protected]
Sabreena AnowarPostdoctoral Fellow
Department of Civil EngineeringUniversity of Toronto
Ph: 416-978-0864Email: [email protected]
Eric J. MillerProfessor
Department of Civil EngineeringUniversity of Toronto
Ph: 416-978-4076; Fax: 416-978-6813E-mail: [email protected]
Naveen Eluru*Associate Professor
Department of Civil, Environmental and Construction EngineeringUniversity of Central Florida
Ph: 407-823-4815; Fax: 407-823-3315E-mail: [email protected]
March, 2017
*Corresponding author

Abstract
In this paper, we examine the hypothesis that bicycles can compete with cars in terms of travel time in dense urban areas. We conduct a detailed investigation of the differences in observed travel times by taxi and a bicycle-sharing system (BSS) in New York City in 2014. The taxi trips with origins and destinations in proximity to BSS stations are identified and compared to BSS trips from the same origin and destinations. The travel time comparison is conducted along following dimensions: (a) all trips, (b) temporal dimension including different time periods of the day, weekday versus weekend, and seasonal variation, and (c) distance categories. It is found that during weekdays’ AM, Midday and PM time periods for more than half of OD pairs with distance less than 3km, BSS is either faster or competitive with taxi mode. To further shed light on the travel time comparison, we develop a multivariate analysis using a random utility framework in the form of a panel mixed multinomial logit model. Identifying and understanding the factors that influence the travel time differences can help planners to enhance the BSS service offerings. The provision of information to bicycling-inclined individuals on the “faster” alternative could be used as a marketing tool to attract higher usage for BSS within dense urban cores. The comparison of BSS and taxi can also shed light on the competition between bicycle and car modes in general in dense urban areas.
Keywords: bicycle sharing systems, CitiBike New York, taxi, travel time, panel mixed multinomial logit model
1

1. INTRODUCTION
In most urban regions, individuals who do not have access to, or prefer not to use, personal vehicles have the option of either using public transit or hailing a taxi. While public transit systems are constrained by predefined routes and fixed schedules, taxi services provide on-demand service from practically any location and at any time of day (particularly with increasing adoption of ridesharing apps such as Uber and Lyft). For a fare, taxi services provide individuals with convenient door-to-door car trips without the stress of having to find a parking spot. Taxi services in an urban region are particularly useful for visitors, elderly individuals, individuals with disabilities, and individuals travelling during off-peak hours or locations with low transit accessibility. The share of taxi trips is less than 1 percent of all trips in the United States. However, as expected, this share is higher in dense urban areas with high congestion, limited and expensive parking provisions. For example, the taxi share in New York City is about 7 times higher than the US national average (NHTS 2009). Despite its small share, taxi plays an important role in our transportation system.
Recently, urban regions have added a new on-demand transportation service in the form of bicycle sharing systems (BSS). BSS offer a reliable, practical and sustainable transportation option for short to medium distance urban utilitarian and recreational trips. BSS has also enhanced the public perception of cycling as an everyday travel mode and thus have contributed to expanding the cycling demographic (Goodman et al., 2014). Evidence from earlier studies also showed that the existence of BSS in a city improves cyclists’ safety (Murphy and Usher, 2015; Fishman and Schepers, 2016). With the excellent coverage provided by most BSS in urban core regions, these systems offer spatial and temporal accessibility that rivals taxi services within urban cores. The two modes also have access time associated with them; for a bicycle, it is the walking time to a station while for a taxi it corresponds to the waiting time for a taxi to arrive. While the BSS service does not offer door-to-door service, the walking distances involved in dense urban areas is not prohibitively large to dissuade usage. BSS services are usually priced lower relative to taxi services while also providing physical activity benefits to the individual and environmental benefits to the society. To be sure, not all trips are equally competitive between taxi and BSS. Not all individuals, depending on their physical condition and trip purpose, are able/willing to bicycle in urban conditions with heavy automobile traffic. Further, individuals are unlikely to consider BSS during inclement weather and for long trips (>6km or so). At the same time, with the growing prevalence of urban bicycling in most cities (McLeod, 2014), it is worthwhile investigating the differences between taxi services and BSS.
A preliminary analysis of data from the Lyon BSS demonstrated that bicycles can compete with cars in terms of speed in core downtown areas, particularly during the morning peak hours (Jensen et al., 2010). Building on this work, in our study, we conduct a detailed investigation of the differences in travel times by taxi and BSS. The taxi trips with origins and destinations in proximity to BSS stations are identified and compared in our analysis. The analysis examines various dimensions, including: different time periods of the day, weekday versus weekend, seasonal variation, and distance. In addition to a detailed comparison, a multivariate analysis using a random utility framework is developed to identify factors that affect the competitiveness of the two modes. Towards this purpose, our study defines a spatio-temporal dependent variable - BSS station-station competitiveness by time period - with three levels: (1) auto is faster, (2) bicycle is faster and (3) both alternatives are competitive. The three alternatives are generated to allow for the recognition that depending on traffic conditions (for taxi) and
2

individual level bicycling characteristics travel time is likely to exhibit significant variability. The research exercise is undertaken for the New York City region using detailed trip level data from the CitiBike system and geocoded taxi data for 2014.
The rest of the paper is organized as follows: Section 2 reviews earlier studies and positions the current effort. Data preparation steps are described in the third section. A detailed descriptive analysis is presented in Section 4. The fifth section discusses the multivariate analysis and presents potential policy implications. Finally, section 6 concludes the paper.
2. EARLIER WORK AND RESEARCH CONTEXT
The two modes of interest in our research effort – taxi and BSS – are substantially different in terms of their existence in North American cities. Taxi services have been prevalent for a long time while BSS is an emerging system. Several research efforts have examined these systems independently. A brief review of the literature for each mode is provided below.
There is a vast body of literature on taxi services. Earlier studies examined taxi services from different perspectives, including regulation (Schaller, 2007; Çetin and Eryigit, 2011), demand and pricing (Chang and Chu, 2009; Milioti et al., 2015; Zhang and Ukkusuri, 2016), and impact of emerging technologies such as electric and autonomous vehicles (Jung et al., 2014; Burghout et al., 2015; Chrysostomou et al., 2016). Several studies analyzed different aspects of taxi operations including taxi passenger search schemes and routing of vacant taxis to improve the efficiency of taxi services (Yang and Wong, 1998; Kim et al., 2005; Wong et al., 2008; Wong et al., 2014; Wong et al., 2015; Zhan et al., 2015; Zhang et al., 2016). Crash injury severity and safety issues related to taxi services are also examined by several researchers (Dalziel, and Job, 1997; Peltzer, and Renner, 2003; Lam, 2004; Tseng, 2013; Tay and Choi, 2016). Recently, several studies investigated the rise of app-based, on-demand ride services such as Uber and their impacts on taxi market and transportation systems (Sun and Edara, 2015; Cramer and Krueger 2016; Harding et al., 2016; Rayle et al., 2016). Further, several investigations used taxi data to estimate link-level travel time on the street network considering taxis as vehicle probes (Zhan et al., 2013; Deng et al., 2015; Zhan and Ukkusuri, 2015).
Given the recent growth of BSS around the world, the research on BSS has increased in the past few years. BSS studies employed survey data and BSS operation data in order to better understand users’ travel behavior and choice process, as well as BSS usage and demand (for a review of recent literature on BSS, please see Fishman, 2016). Several studies investigated the relationship between BSS usage and demand with bicycling infrastructure, land use and built environment, public transportation infrastructure, temporal and meteorological attributes (Rixey, 2013; Faghih-Imani et al., 2014; Gebhart and Noland, 2014; Faghih-Imani and Eluru, 2015; Wang et al., 2015; Faghih-Imani and Eluru, 2016a; Faghih-Imani and Eluru, 2016b). Further, another subset of studies concentrated on operational issues of BSS including identifying problematic stations, efficiency of operator rebalancing program, and proposing new methods for optimizing bicycle rebalancing operations and repositioning trucks’ routing schemes (Vogel and Mattfeld, 2011; Nair et al., 2013; Raviv et al., 2013; Fricker and Gast, 2014; Pfrommer et al., 2014).
From our review, it is evident that there are many studies that separately examine different aspects of bike share and taxi systems. But there is a paucity of literature that examines
3

these two systems in a single study. The study by Jensen et al (2010) was the only attempt that we came across that provided insights by comparing BSS to the automobile mode. However, their comparison was limited to comparing the BSS average speed with the reported average car speed in the downtown of European cities rather than observed speed distributions. In the current study, we endeavour to bridge this gap in the literature. Specifically, we examine taxi and BSS travel times in an urban area employing trip data from CitiBike bicycle-sharing system and taxi service for New York City in 2014. We limit our attention to taxi trips made within the service area of CitiBike. We identify taxi trips with origin and destination within 250-meter of a CitiBike station. We assume that such taxi trips are possible candidates to be substituted by BSS trips since there are CitiBike stations nearby the trips’ origin and destination.
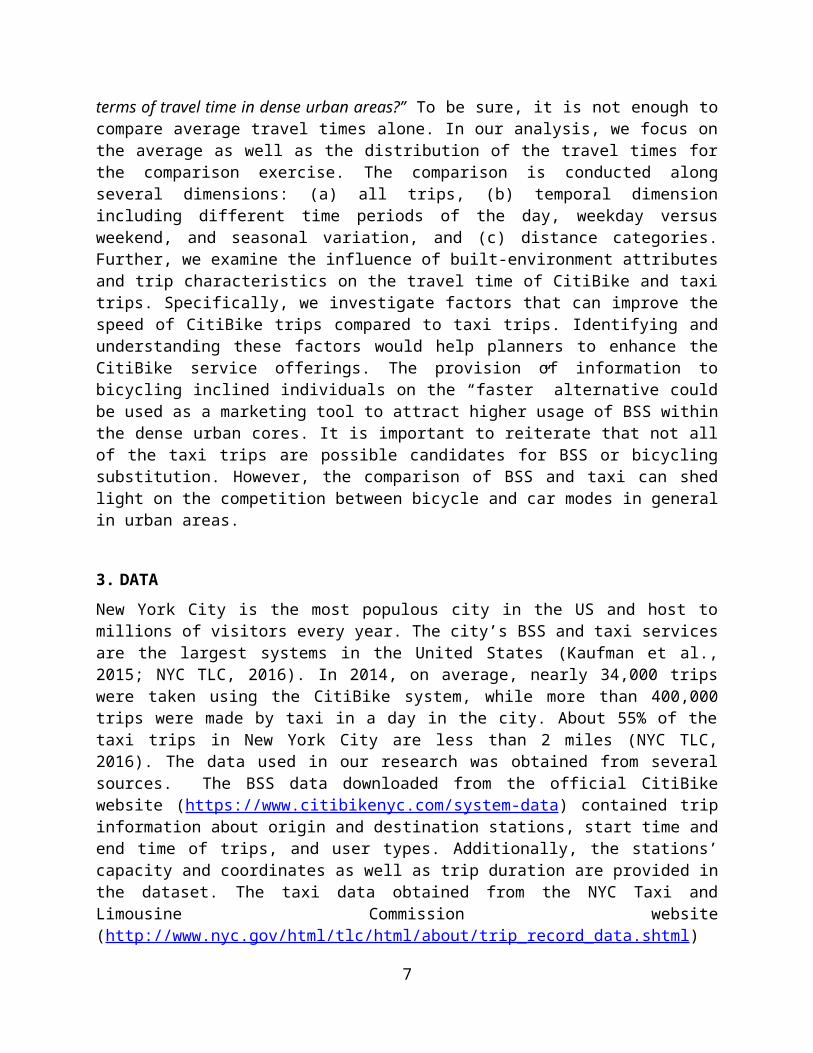
The trip datasets of CitiBike and taxi provide the travel times of each trip between origins and destinations, allowing us to compare travel times of CitiBike and taxi trips with the same origin and destination for a given time period. Thus, we can empirically examine the hypothesis “Can bicycles compete with cars in terms of travel time in dense urban areas?” To be sure, it is not enough to compare average travel times alone. In our analysis, we focus on the average as well as the distribution of the travel times for the comparison exercise. The comparison is conducted along several dimensions: (a) all trips, (b) temporal dimension including different time periods of the day, weekday versus weekend, and seasonal variation, and (c) distance categories. Further, we examine the influence of built-environment attributes and trip characteristics on the travel time of CitiBike and taxi trips. Specifically, we investigate factors that can improve the speed of CitiBike trips compared to taxi trips. Identifying and understanding these factors would help planners to enhance the CitiBike service offerings. The provision of information to bicycling inclined individuals on the “faster” alternative could be used as a marketing tool to attract higher usage of BSS within the dense urban cores. It is important to reiterate that not all of the taxi trips are possible candidates for BSS or bicycling substitution. However, the comparison of BSS and taxi can shed light on the competition between bicycle and car modes in general in urban areas.
3. DATA
New York City is the most populous city in the US and host to millions of visitors every year. The city’s BSS and taxi services are the largest systems in the United States (Kaufman et al., 2015; NYC TLC, 2016). In 2014, on average, nearly 34,000 trips were taken using the CitiBike system, while more than 400,000 trips were made by taxi in a day in the city. About 55% of the taxi trips in New York City are less than 2 miles (NYC TLC, 2016). The data used in our research was obtained from several sources. The BSS data downloaded from the official CitiBike website (https://www.citibikenyc.com/system-data) contained trip information about origin and destination stations, start time and end time of trips, and user types. Additionally, the stations’ capacity and coordinates as well as trip duration are provided in the dataset. The taxi data obtained from the NYC Taxi and Limousine Commission website (http://www.nyc.gov/html/tlc/html/about/trip_record_data.shtml) contains information regarding pick-up and drop-off times and locations, trip distances, fares, and driver-reported passenger counts. The built environment attributes such as bicycle routes and subway stations were derived from the New York City open data source (http://opendata.cityofnewyork.us/) while the socio-demographic characteristics were gathered from the US 2010 census.
4

Several data compilation steps were undertaken to ensure consistent conditions for comparing BSS and taxi data. For our analysis, we used the taxi and CitiBike trips data for 2014. Then, from both datasets, records with missing or inconsistent information as well as trips with the same origin and destination were deleted. Next, night trips were deleted from both datasets and trips made between 7AM to 22PM were retained for analysis. We believe that for night trips, the travel time would not be a contributing factor in individuals’ decision-making process. Further, from the trip databases, it was not clear whether the trips were made directly from origin to destination or several stops were made in between. Thus, in order to reduce the error caused by such trips, we removed trips longer than the 99 percentile threshold based on the trip duration. Therefore, the final samples included taxi trips less than 45 minutes and CitiBike trips less than 60 minutes. It is important to highlight that in the CitiBike system, the first 45 minutes (30 minutes) of each ride is included in the price of annual membership (daily passes) and there is an extra cost for each additional 15 minutes. Therefore, it is likely that users with multiple stops in a trip actually return the bicycle to a station at each stop and start a new trip after the stop. Thus, we expect that the duration of the trips recorded in CitiBike dataset is likely to be equal or close to the actual ride time (as opposed to retaining the bike and pursuing a series of stops).
The CitiBike system had 332 stations in 2014, providing us with a set of 109,892 origin-destination (OD) pairs. We created a 250-meter buffer around each station and then assigned the taxi trips to the nearest CitiBike stations, based on their pick-up and drop-off locations. Thus, taxi trips which did not have a pick-up and drop-off location within the 250-meter buffer were not assigned to any CitiBike station. Hence, we obtained a dataset of taxi trips that have the corresponding origin and destination stations in the CitiBike system. Therefore, based on the start time of trips, we were able to find a taxi trip and CitiBike trip with almost the same (within the maximum of 250 meters) origin and destination. The 250-meter threshold was employed based on the preferred walking distance as reported in earlier research, the average distance between the CitiBike stations and the dense urban form of New York City: a typical New York City block is about 60 meters (Forsyth and Krizek, 2010; Kaufman et al., 2015).
As expected, the number of taxi trips between OD pairs are significantly higher than the number of corresponding CitiBike trips. In fact, for some OD pairs, in some time periods, trips from the CitiBike system are not observed (on very few occasions, the taxi trips were also not observed). Thus, for each time period, not all of the 109,892 OD pairs have trips observed for comparison. Figure 1, presents the location of CitiBike stations and the total number of CitiBike and taxi trips around New York City. The observed travel patterns for CitiBike and taxi trips are very similar; the highly used CitiBike stations are in the areas that also register higher taxi trips.
4. DESCRIPTIVE ANALYSIS
We computed mean travel times for all the trips between station origin and destination pairs for CitiBike trips and assigned taxi trips. In addition, to capture the temporal variations, we computed mean travel times for different time periods: AM (7:00-10:00), Midday (10:00-16:00), PM (16:00-19:00), and Evening (19:00-22:00). We also examine the travel times on weekdays vs. weekends. Further, the travel times by the first month of each season are considered to observe seasonal effects. For these dimensions, we compute the travel time difference between CitiBike and taxi trips. Figure 2 displays the travel time difference between CitiBike and taxi trips (i.e. taxi travel time - CitiBike travel time) for station OD pairs by time period. The positive
5

values are when CitiBike is faster than taxi for an OD pair while the negative values are when taxi is the faster mode. As expected, taxi is slightly faster than CitiBike for all time resolutions. The weekday travel times are more in favor of CitiBike compared to weekend travel times. The seasonal differences are marginal with slower taxi trips in January a possible outcome of adverse weather condition affecting vehicular flow. On average, within the BSS range, taxi trips are about 6.5 minutes faster than CitiBike trips. However, when we look at weekday peak hours when the road network is more likely to be congested, the difference in travel times reduces. Taxi is 3.7, 4.3 and 4.4 minutes faster than CitiBike on weekday AM, Midday and PM time periods, respectively. It is interesting to note that there are certain OD pairs for which travel time by CitiBike is about 30-40 minutes less than the taxi travel time. This result highlights that although on average travel time by bicycle is more than car (which is expected since cars are motorized and faster than bicycles), we find several OD pairs around the city for which bicycles are the faster mode of travel due to car traffic congestion or street network characteristics such as one-way streets.
Further, we identify OD pairs for which CitiBike travel time is less than taxi travel time. Overall, for about 6.3 percent of all the OD pairs available for comparison, CitiBike is the faster mode of travel. The share increases for weekday AM, Midday and PM time periods to 10.9%, 12.6% and 9.9%, respectively. Another important factor in comparing car and bicycle travel time is the trip distance; for long trip distances, bicycle is not an attractive option. Moreover, it is expected that when the trip distance increases, the increase in travel time for CitiBike would be more than the increase in travel time for Taxi. Thus, we examine the OD pairs by the distance of travel. Figure 3 presents the share of OD pairs within each trip distance segment that CitiBike is faster than taxi overall, by time period. It must be noted that the number of observed OD pairs for comparison decreases when we focus on a specific distance and time period. Thus, in addition to the share of OD pairs, the number of observed OD pairs for comparison are presented in Figure 3. The results clearly indicate that bicycle can be a competitive mode to taxi in terms of travel time for shorter distance trips. In fact, overall about 17% of OD pairs with the distance less than 1 km and about 10% of OD pairs with the distance between 1 - 2 km experience average CitiBike travel time lower than average taxi travel times. Further, on weekdays, for about 20-36% of OD pairs with distance less than 2km (depending on distance and time of day), the CitiBike is the faster mode of travel compared to taxi.
The analysis so far has focussed on the sample means of the taxi and CitiBike travel times. It is necessary to recognize that actual travel time realized exhibits significant variability across different trips. For example, an experienced bicyclist with knowledge of the city traveling between two stations is likely to have a shorter travel time compared to the travel time realized for a novice bicyclist. Similarly, based on traffic congestion, the taxi travel time between the same origin and destination could vary substantially. Thus, based on bicyclist demographics, trip purpose, origin and destination bicycle facilities and connectivity, traffic conditions, and taxi driver behavior, there is bound to be substantial variability in travel time across the two modes. The variations across trips by mode results in a situation where no single mode is faster across all trips between the OD pair. Toward clearly highlighting the faster mode for the OD pair, we generate a 90% confidence band for travel time based on the mean and standard deviation of travel times between station pairs in the BSS system. Based on this computation, we can identify three states of comparison: (1) travel time for CitiBike is statistically lower than travel time for taxi (i.e. the higher end of the 90% band for CitiBike travel time is lower than the lower end of the 90% band for taxi travel time), (2) travel time for CitiBike is statistically not different from
6
travel time for taxi and (3) travel time for CitiBike is statistically higher than travel time for taxi. The three levels obtained thus provide us with information on the OD pairs where a particular mode is faster while also providing us information on OD pairs where both modes are competitive. Thus, policy makers can examine these OD pairs to understand how we can promote the sustainable alternatives.
Based on the above characterization, the share of the three levels by trip distance and weekday time periods are presented in Figure 4. The results show that for more than 50% of OD pairs with distance less than 3km, CitiBike is either the faster or a competitive mode of travel. The results clearly indicate that for an OD pair within a reasonable distance in New York City, the bicycle mode compared to car mode is a very competitive mode of travel in terms of travel time and even in some cases faster especially during weekday peak hours.
5. PANEL MIXED MULTINOMIAL LOGIT MODEL
The descriptive analysis has clearly demonstrated that CitiBike offers a competitive mode of travel for a reasonable proportion of station OD pairs around the city across different time periods. The distance of the trip and time period of the day are the prominent factors influencing the competitiveness of the CitiBike system. To draw insights on possible other characteristics that could potentially affect the competiveness, the three-level variable defined above is employed as the dependent variable in a multivariate analysis based on a random utility framework. Specifically, for each station OD pair the dependent variable is generated for four time periods: AM, Midday, PM and Evening time periods. We limit our analysis to weekdays, trips between 7AM and 10PM, and trips shorter than 5km. These assumptions yield a total of 87,112 OD pairs for comparison. As investigating such a large sample might be computationally time-consuming we randomly sample 20,000 station OD pairs1. The alternative shares for the final sample are: The CitiBike is the faster mode for 4.8% of the OD pairs, the taxi is the faster mode for 50.5% of the OD pairs and the CitiBike and taxi are competitive for the remaining 44.7% of OD pairs. A panel mixed multinomial logit model (MMNL) to account for repeated measures (for more details, please see Bhat and Sardesai, 2006; Anowar et al. 2015) for each OD pair is employed for model estimation.
5.1. Exogenous Variables
Exogenous variables considered in our analysis can be classified into three broad groups: a) temporal attributes, b) trip attributes, and c) CitiBike station attributes. A dummy variable for each time period in our panel data was created to capture the time of day effect. Trip attributes included the street network distance between the origin and destination of every trip. For taxi trips, the distance traveled are recorded in dataset. For each OD pair, we calculated the average trip distance reported by taxi drivers in our modeling effort. While the actual bicycle trip might involve a different route, we believe the computed distance would be an appropriate indicator of the distance between origin and destination. Moreover, a categorical variable indicating whether the trip needed to cross a bridge (i.e. origin or destination in two boroughs of Manhattan or Brooklyn) or not was also generated.
1 The reader would note that in CitiBike data there might not be any trips observed between some OD pairs for all 4 time periods. Hence, the final panel data consists of 60,553 records with an average of 3.03 repetition for OD pairs.
7

Several variables were considered under the CitiBike station attribute group. The variables in CitiBike station attributes groups were considered for both origin and destination stations of a trip. Population density was calculated at the census block level and employment density at the zip code level. Other attributes were considered at a station buffer level. For the station buffer level variables, we employed a 250-meter buffer around each station. To recognize the impact of the transportation network, the length of street network and cycling facilities around each station were computed. Further, the presence of transit (subway and Path train) stations and the number of restaurants (including coffee shops and bars) were considered as points of interest attributes in our analysis. The station capacity was also considered in our model estimation process.
5.2. Model Estimation Results
In our estimation effort, we choose the CitiBike Faster alternative as the base and estimate the coefficients for the other two alternatives. The final log-likelihood at convergence for the panel MMNL model is -44422.5 while the log-likelihood value at constants is -51487.7. Clearly, this indicates that the estimated coefficients provide statistically significant improvements at any level of significance. It must be noted that several specifications were tested before reaching the final results. The coefficients for the two alternatives were combined when their effects were similar. The model estimation results are presented in Table 1. All of the estimated parameters are significant at the 95% level of confidence or better.
The constant estimates are consistent with the overall share of alternatives. For temporal attributes, we selected the Evening period as the base and estimated the coefficients for AM, Midday and PM periods. The results indicate that during the time periods when traffic congestion is expected, CitiBike tends to be faster. Lower negative coefficients for Competitive alternative suggest that during peak hours even if bicycle is not the faster mode, it is more likely to be a competing mode.
One of the most important variables in the trip attributes category is trip distance. As expected, trip distance has positive coefficients for both Taxi Faster and Competitive alternatives. The results highlight that for longer trips, the taxi (car) mode is preferable while for shorter trips, the CitiBike (bicycle) mode can be a good competitor. The estimate for crossing a bridge between Manhattan and Brooklyn provides interesting results. Typically, bridges act as bottlenecks on a road network and thus increase the traffic congestion and vehicular travel time. However, bridges in our study have specific bicycle paths, creating an opportunity for cyclists to pass the congested car lanes. The significant negative coefficient clearly indicates that for crossing a bridge between an OD pair, CitiBike (bicycle) mode can be the faster alternative.
We estimated separate parameters for station attributes at both origins and destinations of trips. The estimates for station capacity variables for both origin and destination are negative indicating that when origin and destination have higher station capacity, it is more likely that CitiBike is the faster mode of travel. It is plausible since higher station capacity enables BSS users to easily find a dock to return the bicycle. Moreover, stations with higher capacity are more likely to be in dense areas with higher traffic congestion and thus it takes longer to travel by taxis (cars) in those areas. The length of bicycle facilities variable has opposite impacts for origins and destinations. The CitiBike is more likely to be the faster mode when the length of bicycle facilities is higher at the destination station. This is an interesting result, particularly for planners
8

who want to justify the installation of bicycle facilities around the city. The results show that if we increase bicycle facilities in a city, the travel time for bicycles decreases and thus we can expect a modal shift towards cycling (for a review of factors influencing bicycle mode see Hunt and Abraham, 2007; Heinen et al. 2010). On the other hand, when the length of the street network around origin and destination increases, the travel time for taxi reduces as indicated by positive coefficients of the length of street network variable for both origin and destination. The areas with more street network are less likely to experience traffic congestion and offer alternative routes to avoid congestion. The number of restaurants and presence of transit stations serve as measures for point of interests around origins and destinations. The estimated results also demonstrate that when the origin or destinations are located in busy areas with increased number of points of interests, CitiBike is likely to be the faster mode. This result is also confirmed by the population and job density estimates. CitiBike (bicycle) might be a more reliable mode for trips in higher job density neighbourhoods while in areas with more residents, taxi is the faster mode since the streets would have less traffic congestion.
The influence of unobserved factors affecting station Origin-Destination was illustrated by the presence of significant standard deviation parameters. The parameters that exhibited the presence of a distributional effect include constant for the taxi mode is faster, station capacity at origin and destination, the length of streets at origin and destination. These unobserved effects improve the model fit and provide enhanced parameter accuracy.
5.3. Policy Analysis
To investigate the influence of new bicycling infrastructure, we conducted a policy analysis based on the estimated model. Specifically, we examine the trade-off in the competitiveness of CitiBike (bicycle) and taxi (car), by considering changes in exogenous variables. In our policy analysis, we consider the two variables that policy makers can influence to improve the non-motorized mode: the length of bicycle facilities and CitiBike stations’ capacity. We focus on the following infrastructure improvements: 1) 50% increase in the length of bicycle facilities in the origin and destination buffer; 2) 1 km increase in the length of bicycle facilities in the buffer; 3) 20% increase in the station capacity; 4) increasing the station capacity by 20 bicycles (the reader should note that the average station capacity of CitiBike system is about 34 bicycles); 5) 1 km increase in the distance between origin and destination stations. Based on these variable changes, the model from section 5.2 was employed to predict the new shares across the three alternatives. The differences between the policy scenarios and the base scenarios are computed. The differences in alternative shares are computed as absolute changes and presented in Table 2.
Several observations can be made from the policy analysis results. First, improvements in the bicycle infrastructure by increasing the length of bicycle facilities or increasing the size of CitiBike stations increases the probability that CitiBike is the faster alternative. The finding provides evidence to policy makers that investment in bicycling can lead to increased competitiveness of the bicycle mode particularly in dense urban cores. Second, the results indicate that with the simultaneous increase in bicycle length by 1km and CitiBike station capacity by 20, about 4% increase in the share of the CitiBike Mode Faster alternative would be obtained. Third, as expected, lengthening the trip distance between origin and destination is in favour of taxi mode. However, we observe that the additional station capacity or bicycle facilities can compensate for the negative impact of the distance and can further expand the
9

competitiveness of bicycle compared to car for longer distance trips. Based on our policy analysis, a 1 km increase in trip distance can be offset by an increase of about 19 bicycles in station capacity.
6. CONCLUSION
Taxi services have been a common element of transportation systems for a long time. However, given the recent growth of bicycle-sharing systems (BSS) around the world and with the excellent coverage and spatial and temporal accessibility provided by most BSS in urban core regions, BSS rivals taxi services within urban cores. We conducted a detailed analysis of the differences in travel times by taxi and BSS employing trip level data from New York City CitiBike system and taxi system in 2014. The taxi trips with origins and destinations in proximity to BSS stations were identified and compared in our analysis. Our results confirmed that bicycles can compete with cars in terms of travel time in dense urban areas. The results showed that on average, within the BSS range, taxi trips were slightly faster than CitiBike trips. However, when we investigated the time periods when the road network was more likely to be congested or within the shorter distance trip range, the difference in travel times reduced. The results demonstrated that during weekdays’ AM, Midday and PM time periods for more than 50% of OD pairs with distance less than 3km, CitiBike is either the faster or a competitive mode of travel.
Furthermore, a panel mixed multinomial logit model was developed to identify factors that affect the competitiveness of the two modes. The estimated results showed that when the origin or destinations were located in busy areas with increased number of points of interests or higher job density, CitiBike was likely to be the faster mode. The results demonstrated that increasing bicycle facilities in a city would decrease the bicycle travel time. Specifically, installation of bicycle facilities on segments of the road network with higher traffic congestion such as bridges and bottlenecks would create an opportunity for cyclists to pass vehicular traffic. The results of our multivariate analysis can help planners to enhance the BSS service offerings. The provision of information to bicycling-inclined individuals on the “faster” alternative could be useful as a marketing tool to attract higher usage of BSS within the dense urban cores. Furthermore, based on the policy analysis conducted, the results indicate a potential improvement in competitiveness of the CitiBike mode with investments in bicycling infrastructure such as lengthening the bicycle facilities and adding additional CitiBike capacity.
It is important to note that not all of the taxi trips are possible candidates for BSS or bicycling substitution. However, the comparison of BSS and taxi provide interesting insights on the competition between bicycle and car modes in general in urban areas. The multivariate model analysis offers insights that can be extended to other similar cities with bicycle infrastructure such as London. While the actual topography and station locations are different across cities, we expect similar findings for time of day effects and bicycle infrastructure variables in determining the competiveness between BSS and taxi. A research exercise explicitly comparing the model transferability is an opportunity for future work. In addition, the availability of bicycle route traveled for each trip would allow for consideration of route specific attributes in the comparison exercise. However, the level of analysis for such comparison would have to be at the trip level as opposed to the OD pair level analysis in our paper.
10

References
1. Anowar, S., Eluru, N., Miranda-Moreno, L.F. and M. Lee-Gosselin. Joint Econometric Analysis of Temporal and Spatial Flexibility of Activities, Vehicle Type Choice, and Primary Driver Selection. Transportation Research Record: Journal of the Transportation Research Board, No. 2495, 2015, pp.32-41.
2. Bhat, C.R. and R. Sardesai. The impact of stop-making and travel time reliability on commute mode choice. Transportation Research Part B: Methodological, Vol. 40, 2006, pp.709-730.
3. Burghout, W., Rigole, P.J. and I. Andreasson. Impacts of shared autonomous taxis in a metropolitan area. Presented at 94th Annual Meeting of the Transportation Research Board, 2015.
4. Çetin, T. and K.Y. Eryigit. Estimating the effects of entry regulation in the Istanbul taxicab market. Transportation Research Part A: Policy and Practice, Vol. 45, 2011, pp. 476-484.
5. Chang, S. and C.H. Chu. Taxi vacancy rate, fare, and subsidy with maximum social willingness-to-pay under log-linear demand function. Transportation Research Record: Journal of the Transportation Research Board, No. 2111, 2009, pp. 90-99.
6. Chrysostomou, K., Georgakis, A., Morfoulaki, M., Kotoula, K. and G. Myrovali. Using Big Taxi GPS Data to Investigate Feasibility of Electric Taxis in Thessaloniki, Greece. Presented at 95th Annual Meeting of the Transportation Research Board, 2016.
7. Cramer, J. and A.B. Krueger. Disruptive change in the taxi business: The case of Uber. The American Economic Review, Vol. 106, 2016, pp.177-182.
8. Dalziel, J.R. and R.S. Job. Motor vehicle accidents, fatigue and optimism bias in taxi drivers. Accident Analysis & Prevention, Vol. 29, 1997, pp.489-494.
9. Deng, B., Denman, S., Zachariadis, V. and Y. Jin. Estimating traffic delays and network speeds from low-frequency GPS taxis traces for urban transport modelling. European Journal of Transport and Infrastructure Research, Vol. 15, 2015, pp. 639-661.
10. Faghih-Imani A., and N. Eluru. Analyzing bicycle sharing system user destination choice preferences: An investigation of Chicago's Divvy system. Journal of Transport Geography, Vol. 44, 2015, pp. 53-64.
11. Faghih-Imani A., and N. Eluru. Incorporating the impact of spatio-temporal interactions on bicycle sharing system demand: A case study of New York CitiBike system. Journal of Transport Geography, Vol. 54, 2016a, pp. 218-227.
12. Faghih-Imani, A. and N. Eluru. Determining the role of bicycle sharing system infrastructure installation decision on usage: Case study of Montreal BIXI system. Transportation Research Part A: Policy and Practice, Vol. 94, 2016b, pp.685-698.
13. Faghih-Imani A., N. Eluru, A. El-Geneidy, M. Rabbat, and U. Haq. How land-use and urban form impact bicycle flows: Evidence from the bicycle-sharing system (BIXI) in Montreal. Journal of Transport Geography, Vol. 41, 2014, pp. 306-314.
14. Fishman, E. and Schepers, P. Global bike share: what the data tells us about road safety. Journal of Safety Research, Vol. 56, 2016, pp. 41-45.
15. Fishman, E. Bikeshare: A review of recent literature, Transport Reviews, Vol. 36, 2016, pp. 92-113.
16. Forsyth, A. and K.J. Krizek, 2010. Promoting walking and bicycling: assessing the evidence to assist planners. Built Environment, Vol. 36, pp.429-446.
11

17. Fricker, C., and N. Gast. Incentives and redistribution in homogeneous bike-sharing systems with stations of finite capacity. EURO Journal on Transportation and Logistics, 2014, pp.1–31.
18. Gebhart, K. and R. Noland. The Impact of weather conditions on bikeshare trips in Washington, DC. Transportation, Vol. 41, 2014, pp. 1205-1225.
19. Goodman, A., J., Green, and J. Woodcock. The role of bicycle sharing systems in normalising the image of cycling: An observational study of London cyclists. Journal of Transport & Health, Vol. 1, 2014, pp. 5-8.
20. Harding, S., Kandlikar, M. and S. Gulati. Taxi apps, regulation, and the market for taxi journeys. Transportation Research Part A: Policy and Practice, Vol. 88, 2016, pp.15-25.
21. Heinen, E., Van Wee, B. and K. Maat. Commuting by bicycle: an overview of the literature. Transport reviews, Vol. 30, 2010, pp.59-96.
22. Hunt, J.D. and J.E. Abraham. Influences on bicycle use. Transportation, Vol. 34, 2007, pp. 453-470.
23. Jensen, P., Rouquier, J.B., Ovtracht, N. and C. Robardet. Characterizing the speed and paths of shared bicycle use in Lyon. Transportation Research Part D: Transport and Environment, Vol. 15, 2010, pp. 522-524.
24. Jung, J., Chow, J.Y., Jayakrishnan, R. and J.Y. Park. Stochastic dynamic itinerary interception refueling location problem with queue delay for electric taxi charging stations. Transportation Research Part C: Emerging Technologies, Vol. 40, 2014, pp.123-142.
25. Kaufman, S. M., L. Gordon-Koven, N. Levenson and M. L. Moss. Citi Bike: The First Two Years. The Rudin Center for Transportation Policy and Management, 2015. Accessed online on June 6th 2016 at: http://wagner.nyu.edu/rudincenter/wp-content/uploads/2015/06/Citi_Bike_First_Two_Years_RudinCenter.pdf.
26. Kim, H., Oh, J.S. and R. Jayakrishnan. Effect of taxi information system on efficiency and quality of taxi services. Transportation Research Record: Journal of the Transportation Research Board, No. 1903, 2005, pp.96-104.
27. Lam, L.T. Environmental factors associated with crash-related mortality and injury among taxi drivers in New South Wales, Australia. Accident Analysis & Prevention, Vol. 36, 2004, pp.905-908.
28. McLeod, K. Where We Ride: Analysis of Bicycle Commuting in American Cities, League of American Bicyclists, 2014. Accessed online on Feb 28th 2017 at: http://bikeleague.org/sites/default/files/Where_We_Ride_2014_data_web.pdf
29. Milioti, C.P., Karlaftis, M.G. and D. Spyropoulou. Impact of the Financial Recession on the Taxi Market: Perceptions of Travelers and Taxi Drivers. Transportation Research Record: Journal of the Transportation Research Board, No. 2536, 2015, pp. 67-75.
30. Murphy, E., and J., Usher. The role of bicycle-sharing in the city: Analysis of the Irish experience. International Journal of Sustainable Transportation, Vol. 9, 2015, pp. 116-125.
31. Nair, R., Miller-Hooks, E., Hampshire, R. C., and A. Bušić. Large-Scale Vehicle Sharing Systems: Analysis of Vélib’. International Journal of Sustainable Transportation, Vol. 7, 2013, pp. 85–106.
32. New York City Taxi and Limousine Commission: 2016 Fact book. http://www.nyc.gov/html/tlc/downloads/pdf/2016_tlc_factbook.pdf. Accessed online 20 July 2016.
12

33. NHTS, 2009. U.S. Department of Transportation, Federal Highway Administration, National Household Travel Survey 2009. URL: http://nhts.ornl.gov.
34. Peltzer, K. and W. Renner. Superstition, risk-taking and risk perception of accidents among South African taxi drivers. Accident Analysis & Prevention, Vol. 35, 2003, pp.619-623.
35. Pfrommer, J., Warrington, J., Schildbach, G. and M. Morari. Dynamic vehicle redistribution and online price incentives in shared mobility systems. IEEE Transactions on Intelligent Transportation Systems, Vol. 15, 2014, pp.1567-1578.
36. Raviv, T., Tzur, M. and I.A. Forma. Static repositioning in a bike-sharing system: models and solution approaches. EURO Journal on Transportation and Logistics, Vol. 2, 2013, pp. 187-229.
37. Rayle, L., Dai, D., Chan, N., Cervero, R. and S. Shaheen. Just a better taxi? A survey-based comparison of taxis, transit, and ridesourcing services in San Francisco. Transport Policy, Vol. 45, 2016, pp.168-17.
38. Rixey, R. Station-level forecasting of bikesharing ridership: Station network effects in three U.S. systems. Transportation Research Record: Journal of the Transportation Research Board, No. 2387, 2013, pp. 46-55.
39. Schaller, B. Entry controls in taxi regulation: Implications of US and Canadian experience for taxi regulation and deregulation. Transport Policy, Vol. 14, 2007, pp.490-506.
40. Sun, C. and P. Edara. Is Getting an Uber-Lyft from a Sidecar Different from Hailing a Taxi? Current Dynamic Ridesharing Controversy. Transportation Research Record: Journal of the Transportation Research Board, No. 2536, 2015, pp.60-66.
41. Tay, R. and J. Choi. Factors associated with crashes involving taxi owners and non-owners: A case of moral hazard and adverse selection?. Accident Analysis & Prevention, Vol. 87, 2016, pp.78-82.
42. Tseng, C.M. Operating styles, working time and daily driving distance in relation to a taxi driver's speeding offenses in Taiwan. Accident Analysis & Prevention, Vol. 52, 2013, pp.1-8.
43. Vogel, P. and D.C. Mattfeld. Strategic and operational planning of bike-sharing systems by data mining–a case study. In Computational Logistics, 2011, pp. 127-141.
44. Wang, X., G. Lindsey, J. Schoner and A. Harrison. Modeling bike share station activity: Effects of nearby businesses and jobs on trips to and from stations. Journal of Urban Planning and Development, Vol. 142, 2015, pp 1-9.
45. Wong, K.I., Wong, S.C., Yang, H. and J.H. Wu. Modeling urban taxi services with multiple user classes and vehicle modes. Transportation Research Part B: Methodological, Vol. 42, 2008, pp. 985-1007.
46. Wong, R.C.P., Szeto, W.Y. and S.C. Wong. A two-stage approach to modeling vacant taxi movements. Transportation Research Part C: Emerging Technologies, Vol. 59, 2015, pp. 147-163.
47. Wong, R.C.P., Szeto, W.Y. and S.C. Wong. Bi-level decisions of vacant taxi drivers traveling towards taxi stands in customer-search: Modeling methodology and policy implications. Transport Policy, Vol. 33, 2014, pp.73-81.
48. Yang, H. and S.C. Wong. A network model of urban taxi services. Transportation Research Part B: Methodological, Vol. 32, 1998, pp. 235-246.
49. Zhan, X. and S.V. Ukkusuri. Probabilistic urban link travel time estimation model using large-scale taxi trip data. Presented at 94th Annual Meeting of the Transportation Research Board, 2015.
13
50. Zhan, X., Hasan, S., Ukkusuri, S.V. and C. Kamga. Urban link travel time estimation using large-scale taxi data with partial information. Transportation Research Part C: Emerging Technologies, Vol. 33, 2013, pp.37-49.
51. Zhan, X., Qian, X. and S.V. Ukkusuri. A Graph-Based Approach to Measuring the Efficiency of an Urban Taxi Service System. IEEE Transactions on Intelligent Transportation Systems, Vol.PP, 2015, pp.1-11.
52. Zhang, W. and S.V. Ukkusuri. Optimal fleet size and fare setting in emerging taxi markets with stochastic demand. Computer‐Aided Civil and Infrastructure Engineering. Vol. 31, 2016, pp. 647-660.
53. Zhang, W., Ukkusuri, S.V. and J.J. Lu. Impacts of urban built environment on empty taxi trips using limited geolocation data. Transportation, 2016, pp.1-29.
14

Figure 1 CitiBike Station Locations and Total Number of Trips for CitiBike and Taxi
15

Figure 2 (Taxi Travel Time - CitiBike Travel Time) by each Time Period
16

17
Figure 3 Number (right) and Share (left) of OD Pairs by Distance Groups – Green: CitiBike is Faster; Red: Taxi is Faster

18
Figure 4 Comparison of Travel Time by Group Distance based on 90% Level of Confidence

Table 1 Panel Mixed Multinomial Logit Model Estimation Results
Taxi Mode is Faster* Taxi and CitiBike modes are competitive*
Coefficient t-stat. Coefficient t-stat.Constant 3.3248 11.391 2.8866 9.981Temporal Attributes (Evening as Base)AM -3.5682 -32.355 -2.0955 -19.393Midday -3.6438 -33.529 -2.3085 -21.572PM -2.8125 -25.643 -1.6795 -15.525
Trip AttributesDistance 1.1440 29.130 0.7566 20.332Crossing a Bridge -1.6914 -9.642 -1.6914 -9.642
Origin AttributesStation Capacity -0.0102 -2.687 -0.0102 -2.687Length of Bicycle Facilities 0.1650 3.140 0.1650 3.140Length of Streets 0.2013 5.280 0.2013 5.280Number of Restaurants -0.8819 -3.443 -0.8819 -3.443Job Density -0.4357 -13.136 -0.3407 -11.420
Destination AttributesStation Capacity -0.0203 -6.844 -0.0203 -6.844Length of Bicycle Facilities -0.2921 -5.181 -0.2021 -3.919Length of Streets 0.5123 9.150 0.5123 9.150Presence of Transit Station -0.3658 -5.535 -0.3658 -5.535Number of Restaurants -1.6342 -6.047 -1.6342 -6.047Population Density 0.3179 10.910 0.3179 10.910Job Density -0.7230 -21.482 -0.4563 -15.238
Standard Deviations EstimatesConstant 1.5932 68.773 - -Origin
Station Capacity 0.0241 10.154 0.0241 10.154Length of Streets 0.0853 2.280 0.0853 2.280
DestinationStation Capacity 0.0074 2.830 0.0074 2.830Length of Streets 0.2614 8.712 0.2614 8.712
* The CitiBike Mode is Faster alternative is the base.
19

Table 2 Policy Analysis Results
ScenariosAbsolute Change in the Alternative Probability
CitiBike Mode is Faster
Taxi and CitiBike modes are competitive
Taxi Mode is Faster
Length of Bicycle Facilities +50% 0.133% 0.630% -0.763%Length of Bicycle Facilities +1km 0.211% 1.269% -1.479%Station Capacity + 20% 1.250% -0.823% -0.428%Station Capacity + 20 Bicycles 3.594% -2.329% -1.264%Length of Bicycle Facilities +1km & Station Capacity + 20 Bicycles 3.918% -1.173% -2.744%
Trip Distance + 1km -2.170% -4.651% 6.821%
20