introduction - olyclimate.files.wordpress.com · web viewprojected climate change and impacts for...
TRANSCRIPT
Projected Climate Change and Impacts for the North Olympic Peninsula
A document prepared as part of the North Olympic Peninsula Resource Conservation and Development Council’s project; Planning for Climate Change on the North Olympic
Peninsula
December 2014
1

The Planning for Climate Change in the North Olympic Peninsula project is funded by a grant from the State of Washington Departments of Ecology and Commerce, through a National Estuary Program Puget Sound Watershed Protection and Restoration Grant.
2

Table of ContentsA. Introduction................................................................................................................................ 4
1. The North Olympic Peninsula Context..........................................................................................42. The Need to Plan for Climate Change on the North Olympic Peninsula.........................53. Observed and Projected Climate Trends in the Pacific Northwest (PNW)....................6
a) Temperature; Trends and Extremes.........................................................................................................7b) Precipitations; Trends, Extremes, Hydrology.......................................................................................9c) Oceans: Sea-level Rise Scenarios, Sea-surface Temperature, Acidification,..........................10
(1) Base Sea Level Rise Projections........................................................................................................10(2) Local Estimates of Vertical Land Movement...............................................................................11(3) Local Relative Sea Level Projections...............................................................................................13(4) Incorporating an Estimate of Intermittent Storm Impacts...................................................14(5) Limitations of This Approach............................................................................................................15(6) Sea Surface Temperature Increases and Ocean Acidification.............................................16
B. Climate Change on the North Olympic Peninsula........................................................181. Existing planning and projection reports (state and regional level).............................182. IPCC impact schematic: systems, drivers, impacts................................................................193. Collaborative Scoping Process: Focus Areas............................................................................22
a) Core Team Assembly, Interviews, Meetings, Solicitation..............................................................22b) Four Focus Areas: Systems, Drivers, Impacts.....................................................................................22
C. Exploring North Olympic Peninsula Vulnerabilities..................................................28a) Invitations, Organization, Process of the First Round of Workshops......................................28b) Vulnerability Exercise: Sensitivity and Adaptive Capacity...........................................................30
2. COMMUNITY VITALITY.....................................................................................................................36a) Relevant Climate Projections.....................................................................................................................36b) Draft Vulnerabilities and Prioritization Matrix.................................................................................39
3. WATER RESOURCES...........................................................................................................................45a) Relevant Climate Projections.....................................................................................................................45b) Draft Vulnerabilities and Prioritization Matrix.................................................................................47
4. NATURAL AND MANAGED ECOSYSTEMS.................................................................................55a) Relevant Climate Projections.....................................................................................................................55b) Draft Vulnerabilities and Prioritization Matrix.................................................................................58
5. CRITICAL INFRASTRUCTURE.........................................................................................................66a) Relevant Climate Projections.....................................................................................................................66b) Draft Vulnerabilities and Prioritization Matrix.................................................................................73
D. Prioritizing Vulnerabilities and Adaptation Planning..............................................821. Workshop Participant Review; Ongoing Data Gathering...................................................82
E. Appendix...................................................................................................................................... 831. Glossary....................................................................................................................................................832. GIS Mapping and Analysis................................................................................................................84
F. References................................................................................................................................. 92
3

A. Introduction
1. The North Olympic Peninsula Context
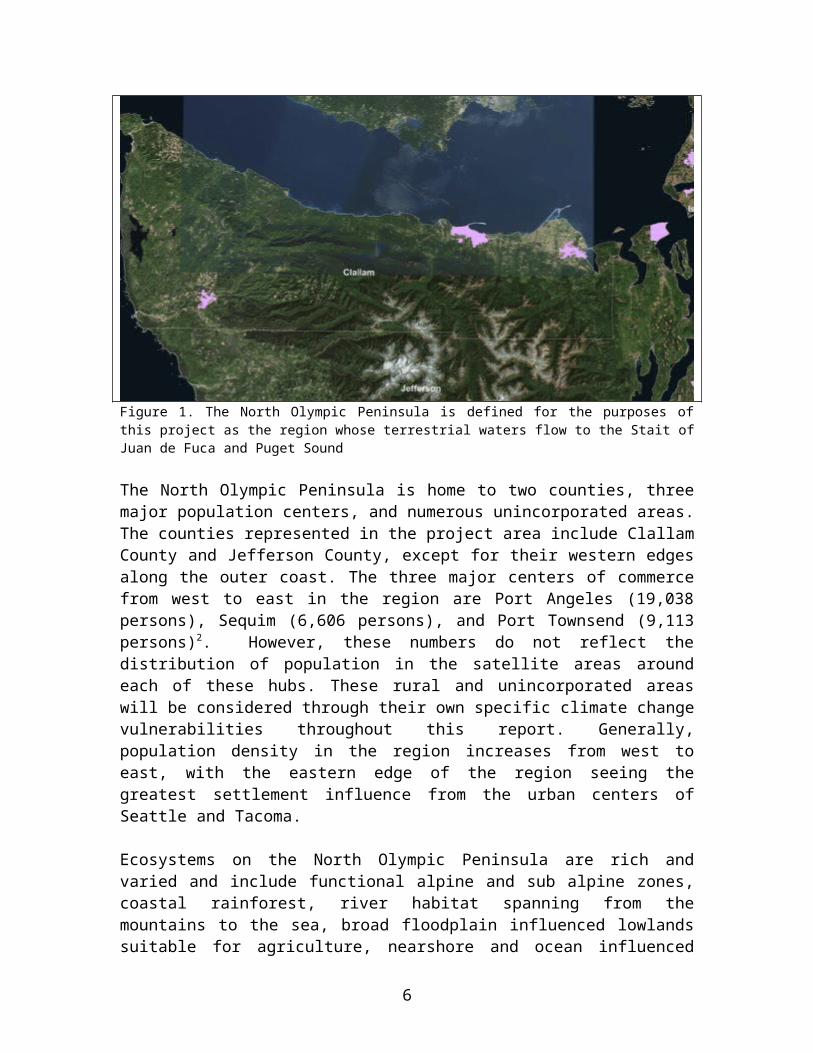
Climate change is occurring and shifting regional climate and weather patterns towards an uncertain future. Despite the ongoing scientific consensus on the scope and scale of climate change impacts at the global and national level, regional experiences have not received a comparable degree of research attention1. The Pacific Northwest (PNW) of the United States has historically experienced a climate founded in the interface of the North Pacific Ocean, North American Continent, and the tectonic forces that maintain that boundary. The Olympic Peninsula in Washington State is in many ways the epitome of that interface, representing the first coastline, mountain range, and population centers when travelling eastward from the ocean into the continent. Its historical climate travelling from west to east reflects this unique setting, with wet outer western coastlines, heavy precipitation in the coastal Olympic Mountains, more mild interior waterways and lowlands, and drier areas sitting in the eastern rainshadow of the Olympic Mountains. This report focuses on the North Olympic Peninsula (NOP), the region defined by the flow of water from the Olympic Mountains north to the Strait of Juan de Fuca and north eastward to Puget Sound.
Figure 1. The North Olympic Peninsula is defined for the purposes of this project as the region whose terrestrial waters flow to the Stait of Juan de Fuca and Puget Sound
The North Olympic Peninsula is home to two counties, three major population centers, and numerous unincorporated areas. The counties represented in the project area include Clallam County and Jefferson County, except for their western edges along the outer coast. The three major centers of commerce from west to east in the region are Port Angeles (19,038 persons), Sequim (6,606 persons), and Port Townsend (9,113
4

persons)2. However, these numbers do not reflect the distribution of population in the satellite areas around each of these hubs. These rural and unincorporated areas will be considered through their own specific climate change vulnerabilities throughout this report. Generally, population density in the region increases from west to east, with the eastern edge of the region seeing the greatest settlement influence from the urban centers of Seattle and Tacoma.
Ecosystems on the North Olympic Peninsula are rich and varied and include functional alpine and sub alpine zones, coastal rainforest, river habitat spanning from the mountains to the sea, broad floodplain influenced lowlands suitable for agriculture, nearshore and ocean influenced marine habitat, estuaries, sandspits, and protected bays. Humans have impacted these ecosystems, with the region seeing intensive fishing, logging, dam and levee construction, and land conversion to agricultural, residential, and industrial purposes. Specific aspects of these ecosystems, their human influence, and ultimate impacts of climate change will be covered in this report.
Some fundamental climate change and extreme weather risks to the Pacific Northwest have been increasingly detailed by researchers, mostly centering around: changes in the timing of precipitation and streamflow; coastal impacts from ongoing sea level rise, erosion, and increasing ocean acidity; forest disease, insect outbreak and wildfire risk; and agricultural impacts3. As a sub-region of the PNW, the North Olympic Peninsula (NOP) has an opportunity to reduce its climate change risk through the detailed assessment of climate related vulnerabilities and the creation of a Climate Preparedness Plan, the central mission of this project. This plan will inform the comprehensive and strategic planning processes of the cities, counties, tribes, Public Utility Districts, and ports within the NOP. The plan will include:
● A compilation of detailed local observations and projections of climate change using best available science;
● A prioritization of highly sensitive or vulnerable resources and locations;● A prioritized set of adaptation strategies and actions based on both the science
and the knowledge of local stakeholders;
The information and strategies of this Climate Preparedness Plan, as well as the discussions and information sharing that are part of the development of the plan, will act as input to current and future comprehensive and strategic planning efforts of the cities, counties, ports, and tribes.
2. The Need to Plan for Climate Change on the North Olympic Peninsula
“Climate Change, once considered an issue for a distant future, has moved firmly into the present” – (U.S. National Climate Assessment, 20144).
5
The Pacific Northwest is already experiencing drier summers, reduction in glacial mass, higher spring and lower summer river flows, and a more acidic ocean. These are not isolated incidents, but part of a larger regional and global trend of changing environmental conditions.
There is no longer a scientific debate about whether the climate is changing. The observed changes are part of a global pattern of change that is driven primarily by human activity5.
“Evidence for climate change abounds, from the top of the atmosphere to the depths of the oceans. Scientists and engineers from around the world have meticulously collected this evidence, using satellites and networks of weather balloons, thermometers, buoys, and other observing systems. Evidence of climate change is also visible in the observed and measured changes in location and behavior of species and functioning of ecosystems. Taken together, this evidence tells an unambiguous story: the planet is warming, and over the last half century, this warming has been driven primarily by human activity” (NCA6).
This current climate change is in contrast to slower, smaller scale, climate changes in the Earth’s history that have been driven by complex non-human events such as solar output, distance of the Earth from the sun, ocean circulation, and composition of the atmosphere. The burning of fossil fuels releases greenhouse gasses (primarily carbon dioxide, CO2) into the atmosphere. These gasses act like a blanket around the earth trapping in heat and warming the planet. The more greenhouse gasses present in the atmosphere, the thicker the “blanket” and higher the overall temperature.
Greenhouse gasses (GHGs), such as Carbon Dioxide, Methane, and Nitrous Oxide, have increased 40% since the industrial revolution, due primarily to human activities such as burning coal, oil, and natural gas. Based on the current concentrations of these gasses in the atmosphere, the planet is already committed to a certain amount of overall warming. Alongside efforts to reduce (‘mitigate’) human emissions of GHGs, planning efforts have been initiated to respond (‘adapt) to the expected impacts that are already being seen and are likely to come along with the current trajectory of GHG emissions.
Climate change mitigation and adaptation efforts are complex and require coordination among a broad range of stakeholders. Combining the current knowledge base of climate change science with the regional expertise in relevant sectors provides a foundation for action that will reduce the magnitude of impacts and costs of climate change over the long term, and ensure best possible outcomes for the natural, economic, social, and cultural assets of the North Olympic Peninsula.
3. Observed and Projected Climate Trends in the Pacific Northwest (PNW)
6

Farmers, fishermen, natural resource managers, public health practitioners, utility managers, emergency responders, coastal residents, businesses and others, have already noticed changes in the climate and extreme weather conditions on the North Olympic Peninsula. These changes are part of a larger trend of changes occurring at the regional, national, and global scale. This section provides an overview of those observed and projected changes in the Pacific Northwest (PNW), a resolution commonly used by climate scientists. More detailed and specific climate impacts or exposures for the North Olympic Peninsula will be covered in the four collaboratively scoped focus areas in section XX.
a) Temperature; Trends and Extremes
Over the last century, average annual air temperature in the Pacific Northwest has increased by 1.3°Farenheit (F)7. Average annual temperature for the 2050s is projected to increase 4.5°F to 5.8°F (relative to 1950-1999) depending on future greenhouse gas emissions scenarios8.
Figure 29: Observed and projected changes in temperature for the Pacific Northwest. Observed (1950-2011) regional mean annual temperature increases are shown in gray, and projected increases in blue and red (blue for a lower greenhouse gas emission scenario - RCP 4.5, and red for a higher greenhouse gas emissions scenario – RCP 8.5). Average annual temperature for the 2050s is projected to increase 4.5°F (RCP 4.5 - range 2.0°F to 6.7°F) to 5.8°F (RCP 8.5 -range 3.1°F to 8.5°F relative to 1950-19992.
Due to the large annual variation in seasonal temperature in the Pacific Northwest, an average annual increase of 4.5°F – 5.8°F by mid century may appear to hold minimal impact, but that is the same difference in average annual temperatures between recent
7

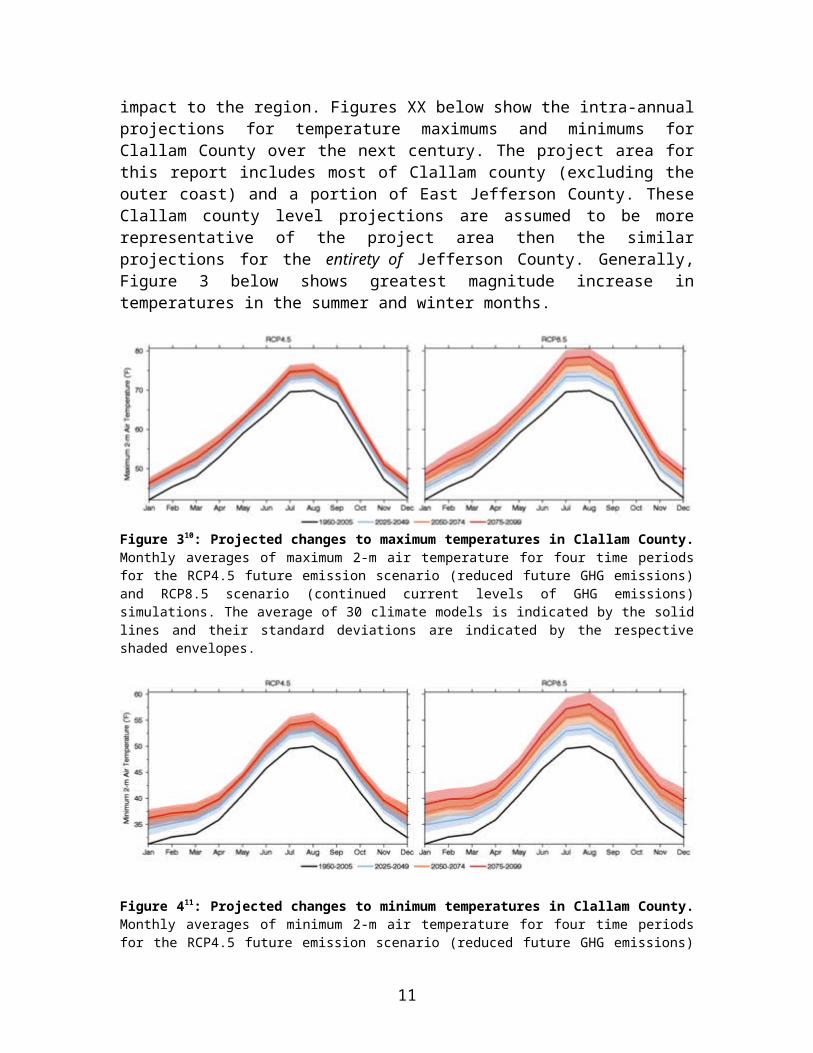
historical temperatures and the last ice age. More than the annual average temperature, the intra-annual (seasonal) changes and extreme weather events display a more accurate representation of the potential for climate change impact to the region. Figures XX below show the intra-annual projections for temperature maximums and minimums for Clallam County over the next century. The project area for this report includes most of Clallam county (excluding the outer coast) and a portion of East Jefferson County. These Clallam county level projections are assumed to be more representative of the project area then the similar projections for the entirety of Jefferson County. Generally, Figure 3 below shows greatest magnitude increase in temperatures in the summer and winter months.
Figure 310: Projected changes to maximum temperatures in Clallam County. Monthly averages of maximum 2-m air temperature for four time periods for the RCP4.5 future emission scenario (reduced future GHG emissions) and RCP8.5 scenario (continued current levels of GHG emissions) simulations. The average of 30 climate models is indicated by the solid lines and their standard deviations are indicated by the respective shaded envelopes.
Figure 411: Projected changes to minimum temperatures in Clallam County. Monthly averages of minimum 2-m air temperature for four time periods for the RCP4.5 future emission scenario (reduced future GHG emissions) and RCP8.5 scenario (continued current levels of GHG emissions) simulations. The average of 30 climate models is indicated by the solid lines and their standard deviations are indicated by the respective shaded envelopes.
8

The North Olympic Peninsula may be generally protected from extreme temperatures over the next century due to its location in the Pacific Northwest and close proximity to the ocean. Summer high temperatures could increase substantially, over 10 degrees Fahrenheit or more, however no significant trend has yet to be observed in daytime heat events (over the period 1895-2011)12. Changes in minimum temperatures are already being observed. The frost-free season has lengthened by 35 days relative to the historical period 1895-2011, and nighttime heat events have become more frequent in Western Washington State13.
b) Precipitations; Trends, Extremes, Hydrology
Year to year variability in precipitation (rain and snow) is historically quite large for the PNW, with some wet years (or decades) and other dry years (or decades). There is no long-term trend to drier or wetter conditions across the Pacific Northwest14.
However, changes in precipitation type have been observed. Throughout the Cascades, snowpack has decreased by about 25% from the middle of the 1900s15 and spring snowmelt is occurring earlier. Most climate projections for the PNW are in agreement regarding inter-seasonal changes, projecting a decrease in summer precipitation and an increase in fall and winter precipitation (see Figure 5 below)16.
Figure 517: Monthly average precipitation in Clallam County. Monthly averages of precipitation for four time periods for the RCP4.5 future emission scenario (reduced future GHG emissions) and RCP8.5 scenario (continued current levels of GHG emissions) simulations. The average of 30 climate models is indicated by the solid lines and their standard deviations are indicated by the respective shaded envelopes.
These changing precipitation patterns along with earlier snow melt and more precipitation falling as rain rather than snow due to higher temperatures will result in increased winter and spring runoff for many of the region’s rivers (see Figure XX below). Mixed rain and snow (‘transient’) watersheds will be the most affected. The North Olympic Peninsula region holds both rain dominated and ‘transient’ watersheds, this labeling represents a suite of characteristics of the watershed and not necessarily a single definitive aspect; ‘transient’ watersheds see rain and snow fall (less than 40% of winter precipitation is snow)18 in their tributaries throughout the year and will
9

experience peak flows in mid summer as the snow melts into its tributaries, while rain dominated watersheds will experience mostly rainfall in their tributaries throughout the year and see peak flows during heavy rain events (commonly fall and winter).
Figure 6: Monthly average runoff in Clallam County. Monthly averages of runoff for four time periods for the RCP4.5 future emission scenario (reduced future GHG emissions) and RCP8.5 scenario (continued current levels of GHG emissions) simulations. The average of 30 climate models is indicated by the solid lines and their standard deviations are indicated by the respective shaded envelopes.
Runoff will also be directly impacted by projected changes in heavy precipitation, particularly for a continued high emissions scenario, events with more than 1 inch of rain in 24 hours in Washington are project to increase 13% by the 2050s 19.
c) Oceans: Sea-level Rise Scenarios, Sea-surface Temperature, Acidification,
Global sea levels are rising. Oceans currently absorb more than 90% of the heat trapped by the increasing greenhouse gasses in the Earth’s atmosphere. As the oceans warm, their water’s expand. Warmer temperatures have also driven the melting of glaciers and ice sheets that continue to add fresh water to the oceans. About 40% of the observed sea level rise is due to the warming of the oceans and 60% is due to the freshwater additions to the oceans20. These global changes are important, but they don’t tell the entire story for sea level rise on the North Olympic Peninsula. The full experience of sea level rise is born out by the global and regional rates of sea level rise combined with the rates of local vertical land movement (which either increase or decrease the local relative rate of sea level rise). If the land is subsiding, that adds to the global rate of sea level rise, and conversely if the land is rising, that lowers the relative rate of sea level rise.
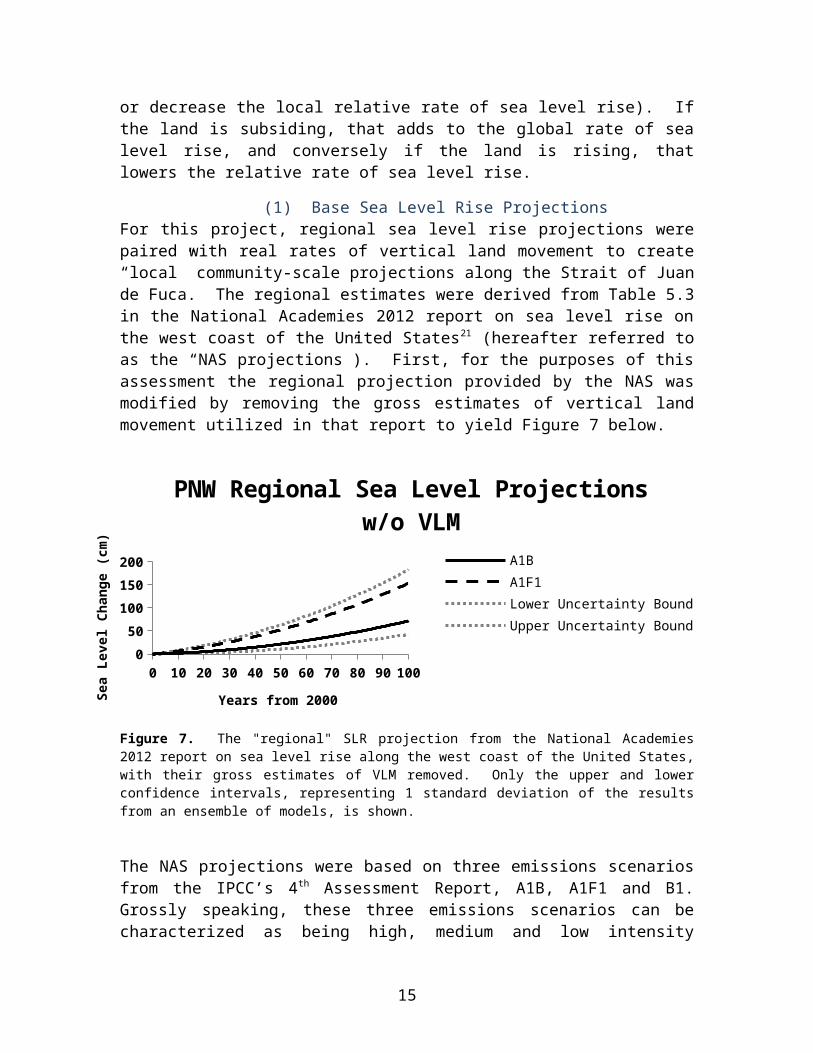
(1) Base Sea Level Rise ProjectionsFor this project, regional sea level rise projections were paired with real rates of vertical land movement to create “local” community-scale projections along the Strait of Juan de Fuca. The regional estimates were derived from Table 5.3 in the National Academies
10
2012 report on sea level rise on the west coast of the United States21 (hereafter referred to as the “NAS projections”). First, for the purposes of this assessment the regional projection provided by the NAS was modified by removing the gross estimates of vertical land movement utilized in that report to yield Figure 7 below.
0 10 20 30 40 50 60 70 80 90 1000
50
100
150
200
PNW Regional Sea Level Projections w/o VLM
A1BA1F1Lower Uncertainty BoundUpper Uncertainty Bound
Years from 2000
Sea
Leve
l Ch
ange
(cm
)
Figure 7. The "regional" SLR projection from the National Academies 2012 report on sea level rise along the west coast of the United States, with their gross estimates of VLM removed. Only the upper and lower confidence intervals, representing 1 standard deviation of the results from an ensemble of models, is shown.
The NAS projections were based on three emissions scenarios from the IPCC’s 4 th
Assessment Report, A1B, A1F1 and B1. Grossly speaking, these three emissions scenarios can be characterized as being high, medium and low intensity scenarios in terms of global carbon emissions22. Rahmstorf et al. (2012) argues that global sea level rise as measured by satellite altimetry is currently most closely tracking sea level rise projections associated with the A1F1 emissions scenario. As a result, the B1 scenario ranges, representing a sharp global turn towards lower carbon emissions, were excluded from this analysis.
(2) Local Estimates of Vertical Land MovementVertical land movement along the Strait of Juan de Fuca was estimated by “double-differencing” monthly sea level data from NOAA water level monitoring stations in Neah Bay, Port Angeles, Port Townsend and Seattle against water level measured at a reference station (see Santa-Maria Gomez, 2013). For this analysis, Friday Harbor was used as the reference station. Assuming that this relative movement is due to variations in the vertical motion of the land (versus unaccounted for settling of the dock or structure that the water level station sits on), this technique provides a fairly precise estimate of the relative vertical land movement (RVLM) at each station against the
11

reference station. The estimate of relative vertical movement at each station is given below:Table 1. Relative vertical land movement estimates for tide stations in coastal Washington. The relative estimates are tied into an absolute reference frame using a continuous GPS station (SC02) near the tide station in Friday Harbor
Station Relative VLM (mm/yr) Absolute VLM (mm/yr)
Friday Harbor 0 -0.16 ± 0.15*Seattle -1.04 ± 0.04 -1.20 ± 0.16Port Townsend -0.68 ± 0.09 -0.84 ± 0.18Port Angeles 1.06 ± 0.13 0.90 ± 0.20Neah Bay 2.76 ± 0.07 2.60 ± 0.17
The relative vertical land movements are then adjusted to an absolute, or geocentric, reference frame using the vertical land movement estimate from a continuous GPS station adjacent to the Friday Harbor water level monitoring station23. The estimated vertical velocity at station SC02 is marked with an asterisk in the table above.
The absolute vertical land movement estimates for each tide gauge, based on the method described above, are shown in Figure 8 below, along with vertical velocity estimates for a series of continuous GPS stations scattered throughout the region of interest. The GPS derived vertical land velocity estimates used in this analysis were provided by NASA’s Jet Propulsion Laboratory24.
12

Figure 8. Estimates of vertical land movement along a east-west trending transect through the Strait of Juan de Fuca.
(3) Local Relative Sea Level ProjectionsTo derive sea level projections that incorporate local rates of vertical land movement, the vertical land movement is applied uniformly to the NAS projections. For this preliminary assessment, the range of the best estimates associated with each emission scenario is used as an estimate of the range of possible future sea level scenarios. The resulting sea level rise projections for Neah Bay, Port Angeles and Port Townsend are given in Table XX below.
For this analysis, we use the Mean Higher High Water (MHHW) tidal datum for mapping, since it represents the average daily highest water level. For each community MHHW is related to NAVD88 (North American Vertical Datum of 1988, a geodetic survey
13

establishing vertical land movement rates between benchmarks), which is most often used as the vertical datum for LiDAR-derived DEMs, using the data in the table below.
Table 2. Vertical correction between NAVD88 and MHHW for three communities on the Strait of Juan de Fuca, as well as an estimated 10-year return frequency storm surge (above MHHW)
MHHW relative to NAVD88
10 year return frequency water level (m; MHHW)
Port Townsend 2.466 m* 0.85 ± 0.10Port Angeles 2.024 m 0.90 ± 0.05Neah Bay 2.169 m 1.10 ± 0.05
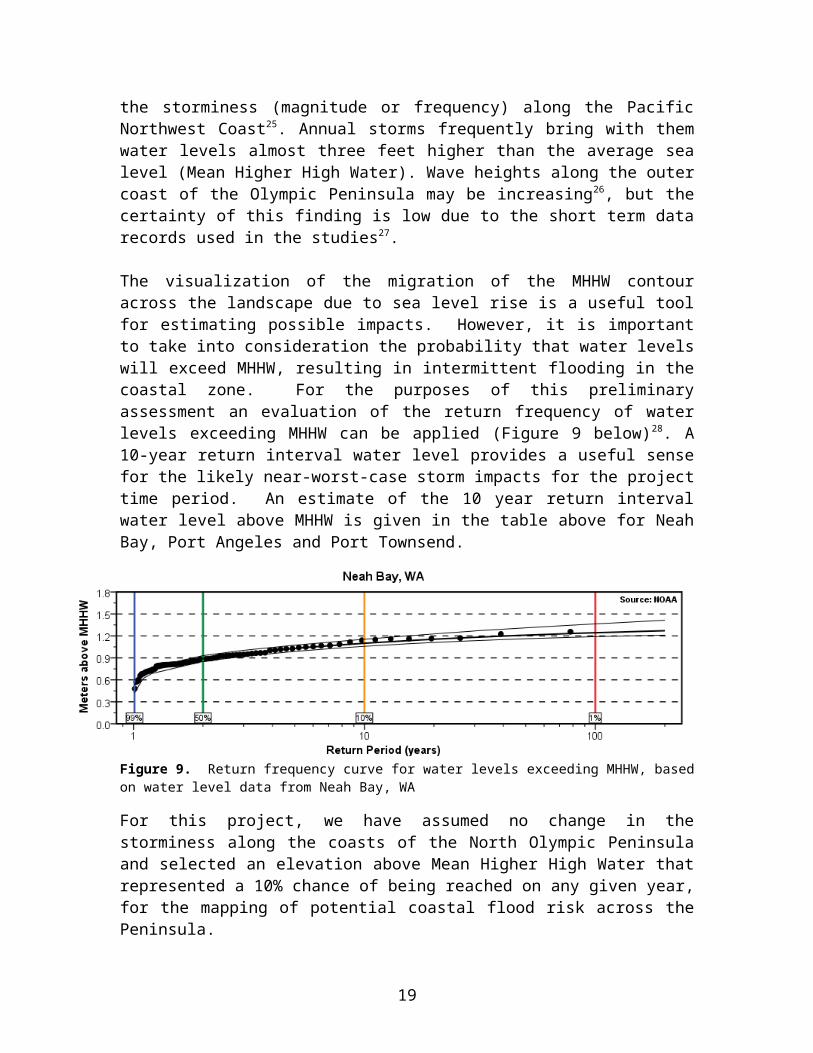
(4) Incorporating an Estimate of Intermittent Storm ImpactsMuch like it is with temperature and precipitation, it is not the changes in averages that will impacts the communities, ecosystems, and resources of the North Olympic Peninsula, it is the changes in extremes. There is currently no consensus on whether climate change will affect the storminess (magnitude or frequency) along the Pacific Northwest Coast25. Annual storms frequently bring with them water levels almost three feet higher than the average sea level (Mean Higher High Water). Wave heights along the outer coast of the Olympic Peninsula may be increasing26, but the certainty of this finding is low due to the short term data records used in the studies27.
The visualization of the migration of the MHHW contour across the landscape due to sea level rise is a useful tool for estimating possible impacts. However, it is important to take into consideration the probability that water levels will exceed MHHW, resulting in intermittent flooding in the coastal zone. For the purposes of this preliminary assessment an evaluation of the return frequency of water levels exceeding MHHW can be applied (Figure 9 below)28. A 10-year return interval water level provides a useful sense for the likely near-worst-case storm impacts for the project time period. An estimate of the 10 year return interval water level above MHHW is given in the table above for Neah Bay, Port Angeles and Port Townsend.
Figure 9. Return frequency curve for water levels exceeding MHHW, based on water level data from Neah Bay, WA
14
For this project, we have assumed no change in the storminess along the coasts of the North Olympic Peninsula and selected an elevation above Mean Higher High Water that represented a 10% chance of being reached on any given year, for the mapping of potential coastal flood risk across the Peninsula.
(5) Limitations of This ApproachThe Sea level rise approach described in this document does not take into account:
Geomorphic adjustment of the shoreline due to sea level change, wave energy changes or other climate-related shoreline impacts
Potential changes to the return frequency of water levels exceeding MHHW due to changes in storm patterns
Adjustments to MHHW due to changes in the tidal prism in Puget Sound Uncertainties in the estimates of VLM or in the sea level rise projections Seismic activity, which could dramatically change the observed patterns of
vertical land movement
15

Figure 10. Relative sea level rise projections for three communities on the Strait of Juan de Fuca, based on regional SLR projections (NAS, 2012) and local estimates of vertical land movement. Two “mapping scenarios” for each location of interest are proposed for mapping purposes of this project.
(6) Sea Surface Temperature Increases and Ocean Acidification
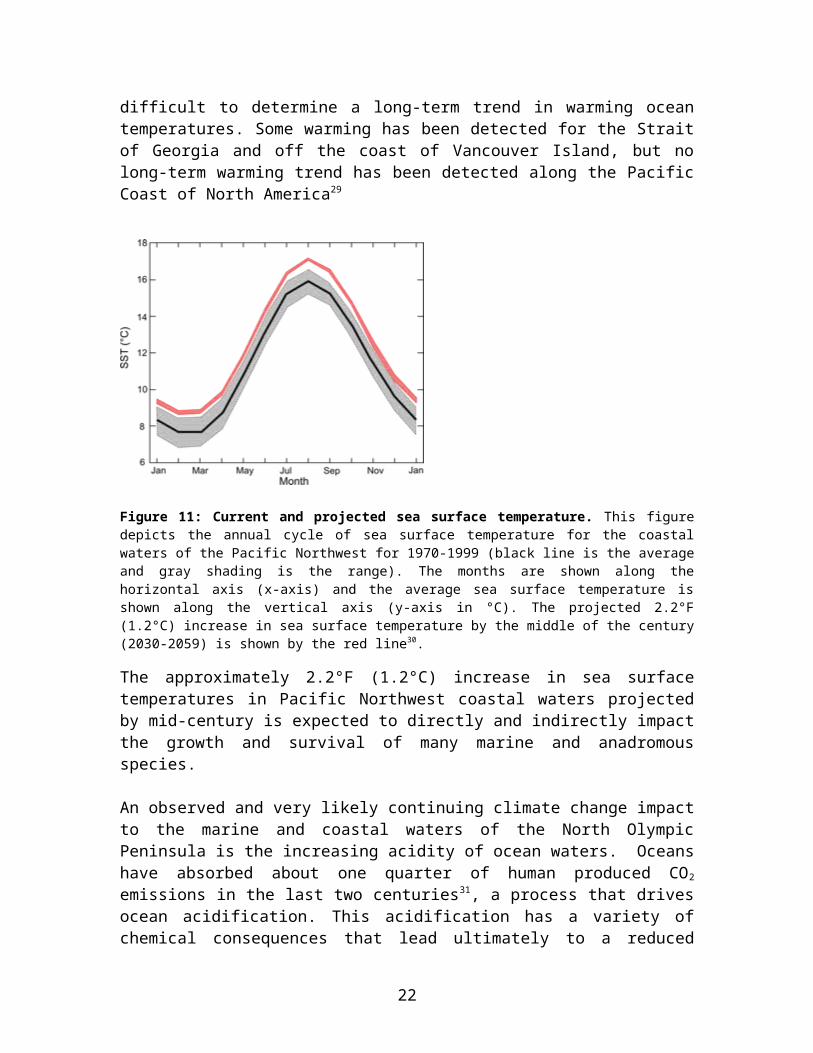
Warming atmospheric temperatures will also likely increase ocean temperatures. Due to the high variability of ocean temperatures due to seasonal and decadal changes it is difficult to determine a long-term trend in warming ocean temperatures. Some warming has been detected for the Strait of Georgia and off the coast of Vancouver Island, but no long-term warming trend has been detected along the Pacific Coast of North America29
16

Figure 11: Current and projected sea surface temperature. This figure depicts the annual cycle of sea surface temperature for the coastal waters of the Pacific Northwest for 1970-1999 (black line is the average and gray shading is the range). The months are shown along the horizontal axis (x-axis) and the average sea surface temperature is shown along the vertical axis (y-axis in °C). The projected 2.2°F (1.2°C) increase in sea surface temperature by the middle of the century (2030-2059) is shown by the red line30.
The approximately 2.2°F (1.2°C) increase in sea surface temperatures in Pacific Northwest coastal waters projected by mid-century is expected to directly and indirectly impact the growth and survival of many marine and anadromous species.
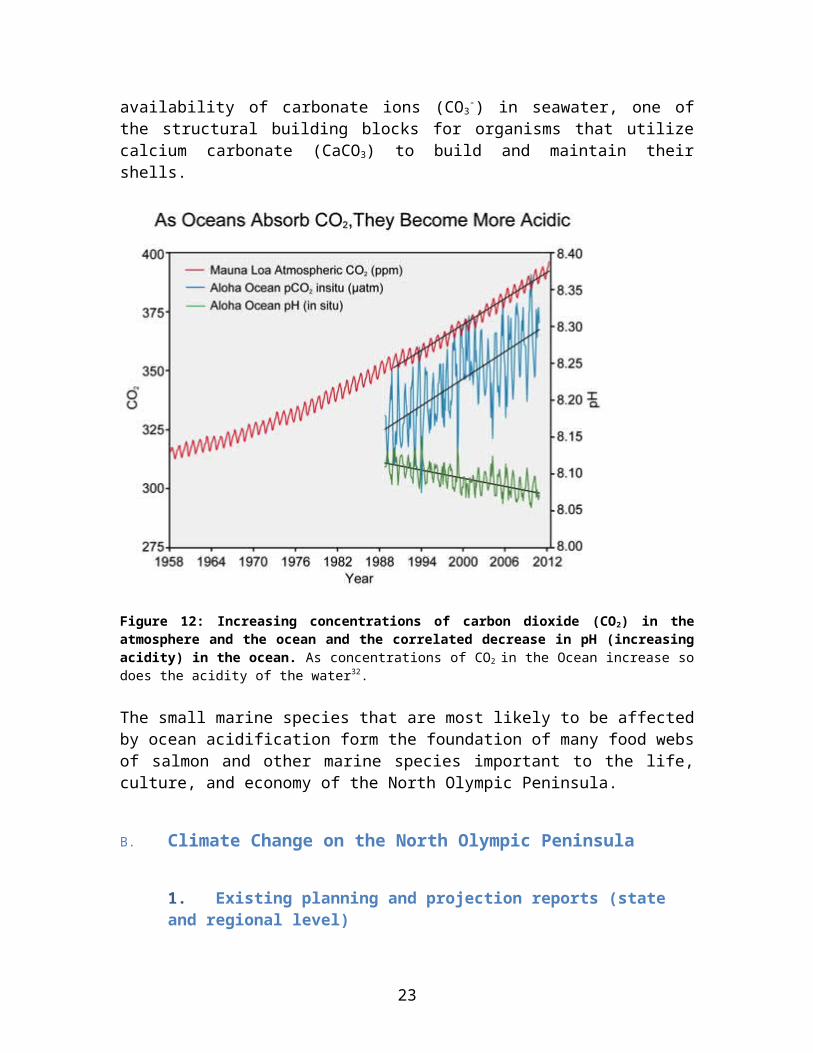
An observed and very likely continuing climate change impact to the marine and coastal waters of the North Olympic Peninsula is the increasing acidity of ocean waters. Oceans have absorbed about one quarter of human produced CO2 emissions in the last two centuries31, a process that drives ocean acidification. This acidification has a variety of chemical consequences that lead ultimately to a reduced availability of carbonate ions (CO3
-) in seawater, one of the structural building blocks for organisms that utilize calcium carbonate (CaCO3) to build and maintain their shells.
17

Figure 12: Increasing concentrations of carbon dioxide (CO2) in the atmosphere and the ocean and the correlated decrease in pH (increasing acidity) in the ocean. As concentrations of CO2 in the Ocean increase so does the acidity of the water32.
The small marine species that are most likely to be affected by ocean acidification form the foundation of many food webs of salmon and other marine species important to the life, culture, and economy of the North Olympic Peninsula.
B. Climate Change on the North Olympic Peninsula
1. Existing planning and projection reports (state and regional level)
The Pacific Northwest, in general, and Washington State in particular are fortunate in that they enjoy a long history of observing and recording climate and weather. There has been a substantial amount of effort to investigate, research, and study how the observed changes in climate have affected the natural and human system in the region and to project how those changes will affect that variety of systems in the future. For example, the Climate Impacts Group at the University of Washington was formed in 1995 and has been working on climate change issues across the state since that time. There are also a number of federal agencies, communities, Tribal nations, non-profit and private sector organizations that have been working together to contribute to the local and regional knowledge base about the impacts of climate change.
18
Recently, there has been an excellent body of research synthesizing climate related information at the regional scale. The 2014 National Climate Assessment33 chapters on the Pacific Northwest34, Coasts35, and supporting technical documents3637, combine to provide a comprehensive look at the state of climate science and the key issues facing the region as a whole. They highlight how changing streamflow patterns, sea level rise, ocean acidification, increased stress on forests and challenges to agriculture, will each substantially affect the region over the course of the coming decades.
Attention has also been paid to the critical natural resources of the region and the Olympic Peninsula in particular. A compilation of literature on the Climate Change Effects and Adaptation Approaches for Ecosystems, Habitats, and Species38completed in 2013 for the North Pacific Landscape Cooperative analyzed more than 250 documents and conducted more than 100 interviews to assess how climate change is already affecting and projected to affect the species and habitat of the region. A study by the Olympic National Park and the Olympic National Forest looked at how climate change will affect the natural resources in the lands they manage39. A report by the State of Washington’s Blue Ribbon Panel on Ocean Acidification40 provides a summary of the current state of knowledge on ocean acidification in the region, why it matters, how it will affect the marine species and economy of the State, and actions that can be taken to reduce those impacts and better monitor and prepare for future changes. The Olympic Coast National Marine Sanctuary completed a study last year considering how climate change will affect their specific geographic area and the species and habitats within that area41.
As it is applicable to this project, the findings from this diverse body of work are being incorporated into the analysis, ranking, and prioritization of potentially vulnerable sectors, resources, and assets on the North Olympic Peninsula.
This project does not aim to recreate or even summarize all of these existing PNW climate change efforts. Instead, it seeks to leverage this information as a foundation to work collaboratively with a diverse group of stakeholders from a variety of different sectors across the North Olympic Peninsula to develop a shared understanding of what those projected climate changes and impacts will mean to the people, ecosystems, and resources of the North Olympic Peninsula. This effort necessarily includes the organization of broad ‘focus areas’, specific to the NOP, that will be both directly and indirectly impacted by climate change. This foundational exploration of specific climate change impacts to the NOP will be used to advance the discussion of what adaptation strategies could be used to reduce these vulnerabilities and build overall climate resilience for the region.
2. IPCC impact schematic: systems, drivers, impacts
19

Climate is an overarching influence to all life on earth, constantly driving and responding to changes in inorganic and organic cycles. For the purposes of humanity’s efforts to assess and plan for the impacts of climate change, researchers have begun to delineate aspects of climate change to better organize and understand the scale, magnitude, and complexity of potential impacts. The Intergovernmental Panel on Climate Change (IPCC) in their most recent Assessment report (AR5) published in 2014 defines three overlapping dimensions of climate change: the Climate System, Human System, and Natural Systems. Further definitions of these systems by the IPCC are provided in the Glossary. Considering these three systems allows for assessment of potential changes to the climate system and the subsequent impacts of those changes to both human and natural systems, as well as these systems’ feedback and influence on the climate system. The interactions between these systems are considered “drivers” of climate change, which can include: warming temperatures, drought, extreme temperatures, extreme precipitation events, shifts in seasonal precipitation patterns, increasing or decreasing snow cover, cyclone/ hurricane activity, sea level rise, and ocean acidification.
Figure 13 below from the IPCC illustrates the drivers of influence between the three systems and provides a few informative examples42.
20

Figure 13: Earth Systems Schematic for Assessing Climate Change: “The earth system consists of three coupled and overlapping systems. Direct drivers of the human system on the climate system are denoted with a red arrow; some of these drivers may also directly affect natural systems. These effects can in turn influence other systems (dashed red arrows). Further influence on each of the systems on each other (confounding factors) that do not involve climate drivers are represented by blue arrows. Examples of drivers and their impacts are given in the table.”43
During this project, the IPCC defined Climate System, Natural System, and Human System were utilized in scoping and organizing climate change vulnerabilities specific to the North Olympic Peninsula.
21
3. Collaborative Scoping Process: Focus Areas
a) Core Team Assembly, Interviews, Meetings, Solicitation
This project is managed under the North Olympic Peninsula Resource Conservation & Development Council (NOPRC&D), and all members of the council are partners in this effort. That includes Jefferson County, Clallam County, the cities of Port Angeles, Sequim and Port Townsend, Clallam Economic Development Council, Ports of Port Townsend and Port Angeles, Clallam Conservation District, the Clallam PUD, Jamestown S’Klallam Tribe, Makah tribe, Lower and Elwha Klallam Tribe and Team Jefferson Economic Development Council. These groups were solicited for a representative to act as a member of the project “Core Team” who would meet monthly with the project team to discuss project progress and direct the project through scoping, outreach, and data review.
The first step in collaboratively involving the Core Team was initiated with structured interviews between core team members and the project team. This occurred over early August with project team members investigating each core team member’s familiarity with climate change projections, and exploration of each core team member’s key climate concerns. The results of these interviews were organized into Draft Key Concerns for the project, which included: Water Supplies; Critical Infrastructure; Agriculture and Forest Health; Economic Viability/Resilienc;, Shorelines;and Marine Species. These Key Concerns were presented alongside region-specific climate change projections to the core team during an in-person meeting on August 21st, 2014 in Sequim, WA. During this meeting, core team members were asked to consider how Key Concerns could either be collated or expanded to develop central “Focus Areas” that best represented the experience of climate change in the North Olympic Peninsula, with attention to the regions specific socio-economic structure, ecosystem, and culture. At the end of the meeting the core team voted on which three Key Concerns they would prioritize as most valuable for the objectives of this project, and which could be assessed further in a workshop alongside project partners. The result was four Focus Areas of: Community Vitality, Water Resources, Natural and Managed Ecosystems, and Critical Infrastructure. These Focus Areas were reviewed and refined a second time with the core team and a wider group of project partners during a webinar on September 12th, 2014.
b) Four Focus Areas: Systems, Drivers, Impacts
The four Focus Areas for this project: Community Vitality, Water Resources, Natural and Managed Ecosystems, and Critical Infrastructure, serve to organize and also prioritize climate change issues as they relate to the North Olympic Peninsula. They are the functional structure for the participatory process undertaken in this project in both
22
vulnerability assessment and adaptation planning. Following agreement on the Focus Areas themselves, the core team, project team, and project partners began to compile tables (building off the IPCC schematic described on page 21) detailing vulnerabilities under each Focus Area as they relate to the Human, Natural, and Climate Systems, as well as the drivers of climate change impacts between these systems.
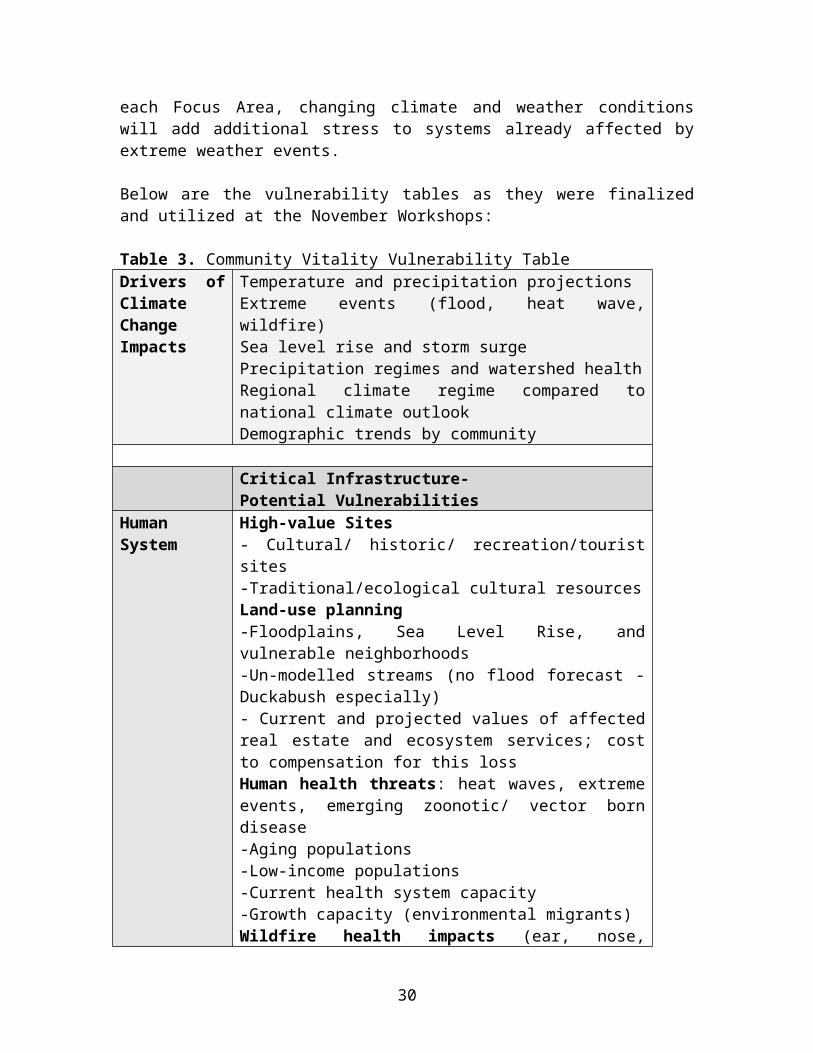
“Vulnerabilities” is a broadly encompassing term, defined by the IPCC as “The propensity or predisposition to be adversely affected. ‘Vulnerability’ encompasses a variety of concepts including sensitivity or susceptibility to harm and lack of capacity to cope and adapt.”44 The comprehensive list of potential vulnerabilities developed for each focus area was meant to act as a foundation for investigation into more specific vulnerabilities at the participatory “Climate Vulnerability Assessment Workshops” held on the NOP November 10th-14th, 2014. For many aspects of each Focus Area, changing climate and weather conditions will add additional stress to systems already affected by extreme weather events.
Below are the vulnerability tables as they were finalized and utilized at the November Workshops:
Table 3. Community Vitality Vulnerability TableDrivers of Climate Change Impacts
Temperature and precipitation projectionsExtreme events (flood, heat wave, wildfire)Sea level rise and storm surgePrecipitation regimes and watershed healthRegional climate regime compared to national climate outlookDemographic trends by community
Critical Infrastructure-Potential Vulnerabilities
Human System High-value Sites- Cultural/ historic/ recreation/tourist sites-Traditional/ecological cultural resourcesLand-use planning-Floodplains, Sea Level Rise, and vulnerable neighborhoods-Un-modelled streams (no flood forecast -Duckabush especially)- Current and projected values of affected real estate and ecosystem services; cost to compensation for this lossHuman health threats: heat waves, extreme events, emerging zoonotic/ vector born disease-Aging populations-Low-income populations-Current health system capacity-Growth capacity (environmental migrants)
23

Wildfire health impacts (ear, nose, throat, destruction of property, injury)
Natural System Ecosystem servicesEcosystem, habitat and species impacts-Current Shoreline erosion-Environmental rehabilitation/ conservation- Encroachment on plant and animals due to increasing population- Wildfire Risk
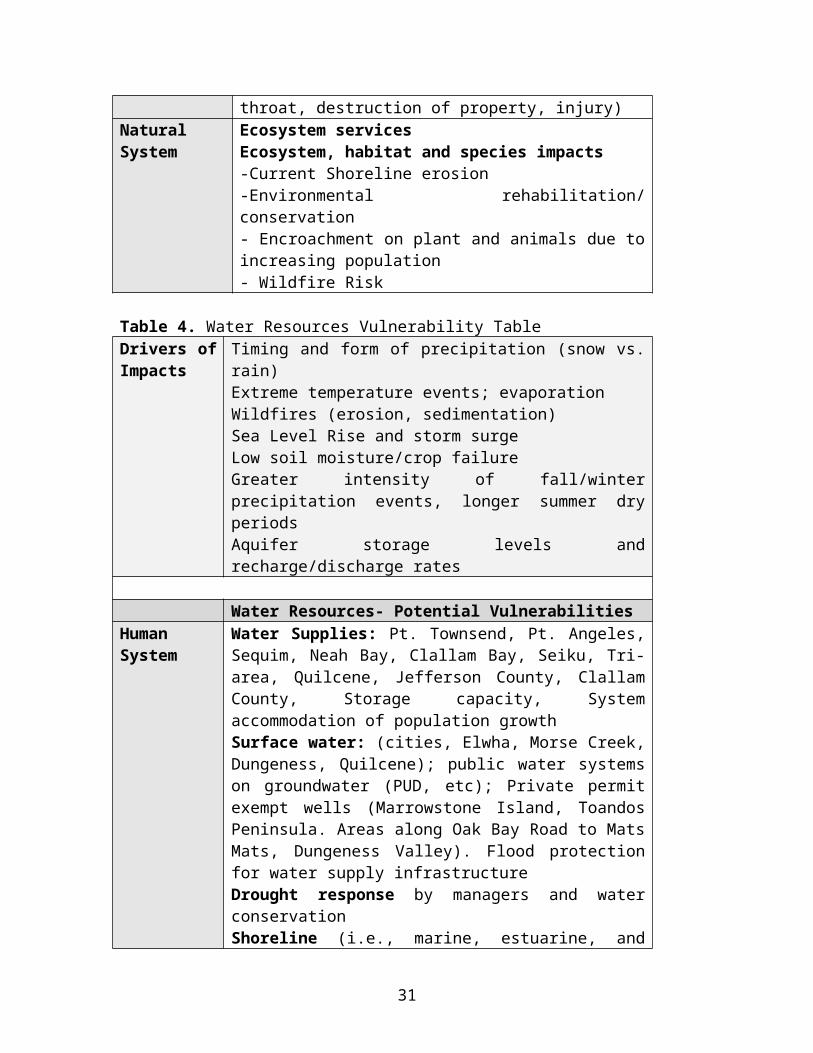
Table 4. Water Resources Vulnerability TableDrivers of Impacts
Timing and form of precipitation (snow vs. rain)Extreme temperature events; evaporationWildfires (erosion, sedimentation)Sea Level Rise and storm surgeLow soil moisture/crop failureGreater intensity of fall/winter precipitation events, longer summer dry periodsAquifer storage levels and recharge/discharge rates
Water Resources- Potential VulnerabilitiesHuman System
Water Supplies: Pt. Townsend, Pt. Angeles, Sequim, Neah Bay, Clallam Bay, Seiku, Tri-area, Quilcene, Jefferson County, Clallam County, Storage capacity, System accommodation of population growthSurface water: (cities, Elwha, Morse Creek, Dungeness, Quilcene); public water systems on groundwater (PUD, etc); Private permit exempt wells (Marrowstone Island, Toandos Peninsula. Areas along Oak Bay Road to Mats Mats, Dungeness Valley). Flood protection for water supply infrastructureDrought response by managers and water conservationShoreline (i.e., marine, estuarine, and freshwater shorelines) planning scenariosIrrigated lands: agricultural, urban, rural residentialWater Quality:Permitted point source waste water dischargers: city wastewater treatment plants and industrial sourcesStormwater dischargers: cities, roads, and highwaysNon-point sources of pollutions: rural residential, agriculture, forestryNon attainment of ambient water quality standards/loss of beneficial usesPoint sources limit production due to discharge limitations
24
Stormwater treatment or Best Management Practices neededEcosystem:Watersheds & Habitats- uplands- riparian zones and wetlands- estuarine and marineExtreme Events: Rain on snow eventsKing tides + rain on snow/extreme rain
Natural System
Groundwater: Increase in annual water deficit period = precipitation is evaporated or runs off before it can recharge water table (e.g. Chimacum)Higher intensity rainfall events running off before infiltrating and recharging groundwaterForm of Precipitation at various Elevations (snow or rain; rain-on-snow events)Saltwater intrusionSurface water availability in drought (groundwater potentially more available)Water Supply: How changes impact plants and animals:- Low baseflows in streams- summer drought impact on plant and animal species- reduction of snowpack impact on plant and animal speciesWatersheds and Habitats:- upland and channel erosion, sedimentation-native vegetation loss to changing site capability-Worsening water quality, bacterial proliferation, sediment loading-Fish toxicity; algal blooms, temperature, sediment-water and habitat quality doesn’t meet species life cycle needs- Plant and animal disease susceptibilityHydrology:higher winter runoff & streamflows, lower summer streamflows, reduced snowpack
Table 5. Natural and Managed Ecosystems Vulnerability TableDrivers of Impacts
Air temperature trend increases plant & soil evapotranspirationGrowing season, PhenologyDrought and heat wave frequency, duration, intensityHydrologic cycle shiftEcosystem ShiftsSea-level riseOcean Acidification
25

Agriculture, Forestry, Fisheries-Potential Vulnerabilities
Human System Agricultural and forest- Zoned lands in Clallam and Jefferson Counties- Rural residential and urban land in agricultural and forest production-Irrigation demands/ water allocation- Areas in flood plains- Ability to manage resilience to pests, weeds, and plant diseases- Temperature impacts on growing season, crop stress, crop selection, forest seedling selection (i.e., commercial, small forest, restoration)- Availability of sufficient best management practices to meet sustainability and conservation goalsUrban-wildland interfaceFishery and aquaculture in adjacent and regional waters-Shellfish and finfish farms (oyster, geoduck, etc.)-Hatcheries (salmonids and shellfish)-High value wild fisheries and hatchery to wild supplement programsEconomic connections-Employment related to or dependent on natural resource-based industries-Population dependent on primary and secondary natural resource-based industries- Strength of local markets, acute and long-termWater Quality:- forest and agricultural Best Management Practices increase cost of production- saltwater intrusion impacts on agricultural, forestry or freshwater fishery water suppliesAir Quality:Wildfire; non attainment of ambient air quality standardsForest and Ag. Management practices, controlled burning, tillageHuman health impacts (ear, nose, throat, destruction of property, injury)
Natural System Adaptive capacity of existing plant and animal speciesTemperature StressNatural Water balance availability, including changes in water supply for plants and animalsWater quality impact on fish and animals (due to increased runoff from agricultural lands due to climate change, etc.)
26

Wildfire impact on plants and animalsNatural sensitivity to pests, weeds, and plant diseases-Invasive species, abundance of pests and pollinatorsAvailability of ecosystem services, e.g. carbon, wetlands, habitatErosion - Current marine and watershed shoreline erosion, uplands and stream channelOcean acidification
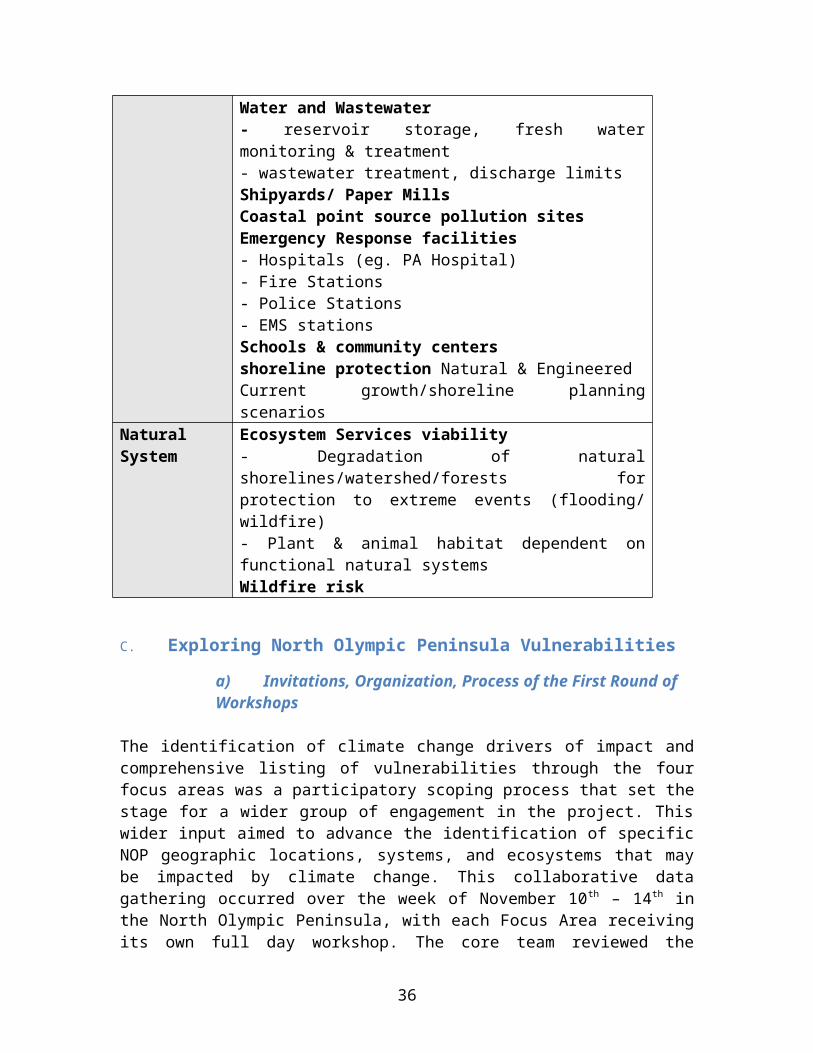
Table 6. Critical Infrastructure Vulnerability TableDrivers of Climate Change Impacts
Temperature and precipitation projectionsExtreme events (precipitation)Sea Level Rise and storm surgeDrought events
Critical Infrastructure-Potential Vulnerabilities
Human System Ports (Port of Port Angeles & Port of Port Townsend, Port of Neah Bay)Transportation Corridors: Hood Canal Bridge, RT 101, 104, Hwy 20/19/Water St., Hwy 112, select critical rural roadsEnergy production/ delivery systemsSolid waste treatment (eg. PA landfill) & Sea Level Rise/Storm surgeStormwater collection, conveyance, and storage/treatment facilities (PA stormwater treatment near Ennis Creek)Water and Wastewater- reservoir storage, fresh water monitoring & treatment- wastewater treatment, discharge limitsShipyards/ Paper MillsCoastal point source pollution sitesEmergency Response facilities- Hospitals (eg. PA Hospital)- Fire Stations- Police Stations- EMS stationsSchools & community centersshoreline protection Natural & EngineeredCurrent growth/shoreline planning scenarios
Natural System Ecosystem Services viability- Degradation of natural shorelines/watershed/forests for protection to extreme events (flooding/ wildfire)- Plant & animal habitat dependent on functional natural
27

systemsWildfire risk
C. Exploring North Olympic Peninsula Vulnerabilities
a) Invitations, Organization, Process of the First Round of Workshops
The identification of climate change drivers of impact and comprehensive listing of vulnerabilities through the four focus areas was a participatory scoping process that set the stage for a wider group of engagement in the project. This wider input aimed to advance the identification of specific NOP geographic locations, systems, and ecosystems that may be impacted by climate change. This collaborative data gathering occurred over the week of November 10th – 14th in the North Olympic Peninsula, with each Focus Area receiving its own full day workshop. The core team reviewed the subject matter described by the listed vulnerabilities under each Focus Area and helped identify which stakeholders might hold expertise. These stakeholders were invited to attend the workshop(s) most appropriate to their expertise.
Representatives from the following organizations were invited to attend each workshop:Community Vitality WorkshopClallam County Planning Department
Jefferson County Planning Department
Port Townsend Development Services
Port Angeles Planning, CED, Parks
Sequim Community Development
Ft Worden-State parks
Dungeness National Wildlife Refuge
Friends of Dungeness National Wildlife Refuge
FEMA
Walk and Livable Communities Institute
Olympic Climate Action
EDC Team Jefferson
Ft. Worden Marine Science Center
Feiro Marine Life Center
Jefferson County Chamber of Commerce
Clallam Bay-Sekiu Chamber Commerce
Sequim-Dungeness Chamber Commerce
Port Angeles Regional Chamber
Jefferson Co. Environmental Health
Clallam Co. Environmental Health
Makah Tribe
Lower Elwah Klallam Tribe
Jamestown S’Klallam Tribe
28

Clallam County EDC
Water Resources WorkshopWashington Dept. of Ecology
East Jefferson Watershed Council
Dungeness River Management Team
Water Resource Inventory Areas (WRIA) 17, 18, 19
Washington Water Trust
Clallam Conservation District
Jefferson Conservation District
WSU Extensions – Jefferson and Clallam Counties
City of Port Angeles Public Works
City of Sequim Public Works
City of Port Townsend Public Works
Jefferson County Public Works
Clallam County Public Works
Jefferson County Public Utilities District
Clallam County Public Utilities District
North Olympic Salmon Coalition
Olympic Climate Action
Local 20/20 Climate Action
WA Dept. of Fish and Wildlife
Olympic Environmental Council
Puget Sound Partnership
Jamestown S’Klallam Tribe
Makah Tribe
Lower Elwha Klallam Tribe
Port Gamble S’Klallam Tribe
Natural and Managed Ecosystem WorkshopJefferson Land Trust
North Olympic Land Trust
Jefferson County Planning
Clallam County Planning
WSU Extension
WA Department of Ecology
Jefferson County Environmental Health
Clallam County of Environmental Health
Jefferson Conservation Districts
Taylor Shellfish
Icicle Seafoods Aquaculture
North Olympic Salmon Coalition
Olympic National Park
WA Dept. Natural Resources
US Forest Service
Port Angeles Business Association
North Olympic Timber Action Committee
Jamestown S’Klallam Tribe
29
Clallam Conservation Districts
Cooperative Extension
Makah Tribe
Lower Elwha Klallam Tribe
Critical Infrastructure WorkshopPort of Port Townsend
Port of Port Angeles
Port of Neah Bay
Jefferson County Planning, Public Works
Clallam County Planning, Public Works
Jamestown S’Klallam Tribe
Makah Tribe
Lower Elwha Klallam Tribe
City of Port Angeles Public Works
City of Port Townsend Public Works
City of Sequim Public Works
Bonneville Power Administration
Port Angeles Utilities
Jefferson County Public Utility District
Clallam County Public Utility District
Regional Transportation Planning Organization
Jefferson County Emergency Management
Clallam County Emergency Management
WSU extension
WA Department Of Transportation
Port Townsend Paper Mill
Nippon, Port Angeles Mill
U.S. Coast Guard
U.S. Navy
Port Townsend & Port Angeles Hospitals
b) Vulnerability Exercise: Sensitivity and Adaptive Capacity
The four Focus Area workshops held over the week of November 10 th-14th involved two central sessions: in the morning a review of regional climate change projections most pertinent to the focus area was presented, followed after lunch by a vulnerability ranking exercise involving three breakout sessions within each workshop, where each session identified a range of specific vulnerabilities and then ranked these vulnerabilities on their sensitivity to the impacts of climate change and their ability to adapt to these impacts - “adaptive capacity”. The three breakout sessions for each workshop were as follows;
Community Vitality Workshop
Water Resources Workshop
Natural and Managed Ecosystem
Critical Infrastructure Workshop
30
WorkshopHigh value community sites
Land-use planning and population growth
Current and future demographics
Water supplies
Water quality
Watersheds
Agriculture & Forestry
Fisheries & aquaculture
Wildlife
Low-lying infrastructure
Transportation corridors and emergency management
Utilities, sewer, and solid waste
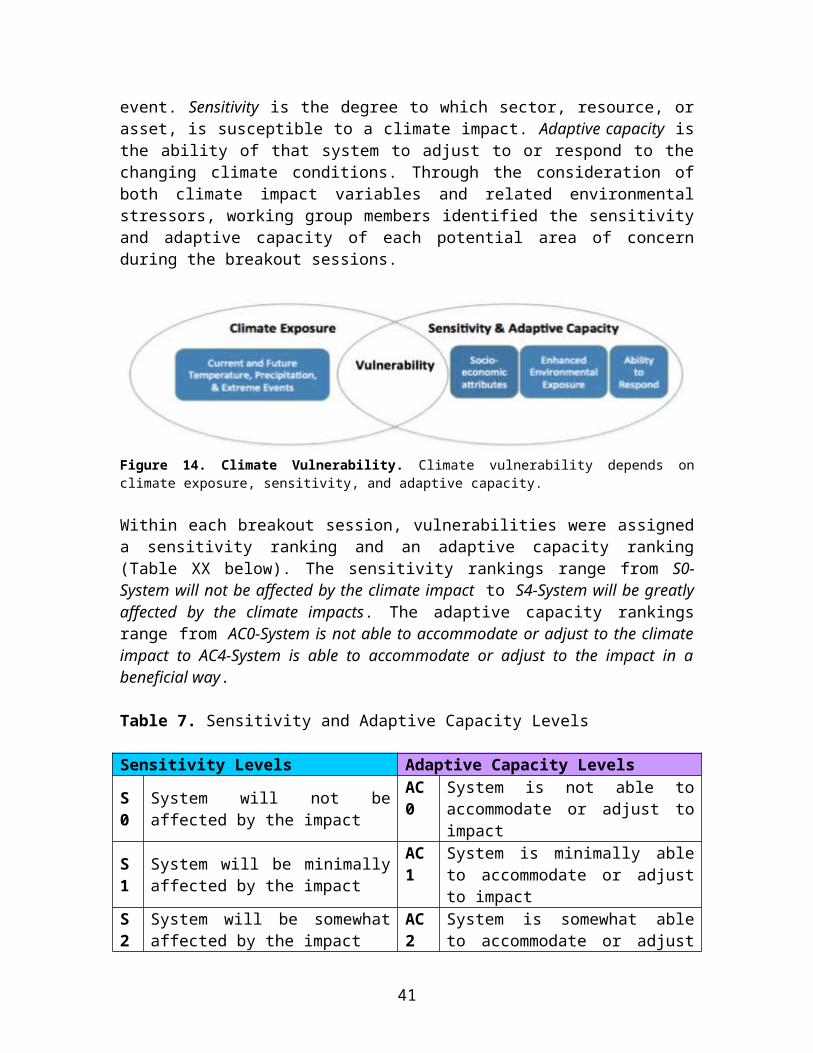
Within each breakout session, participants grouped vulnerability issues into categories suitable for ranking on subjective measures of sensitivity and adaptive capacity. Climate vulnerability depends on exposure, sensitivity, and adaptive capacity (as shown in Figure 14 below). Climate exposure is the extent and magnitude of a climate or weather event. Sensitivity is the degree to which sector, resource, or asset, is susceptible to a climate impact. Adaptive capacity is the ability of that system to adjust to or respond to the changing climate conditions. Through the consideration of both climate impact variables and related environmental stressors, working group members identified the sensitivity and adaptive capacity of each potential area of concern during the breakout sessions.
Figure 14. Climate Vulnerability. Climate vulnerability depends on climate exposure, sensitivity, and adaptive capacity.
Within each breakout session, vulnerabilities were assigned a sensitivity ranking and an adaptive capacity ranking (Table XX below). The sensitivity rankings range from S0-System will not be affected by the climate impact to S4-System will be greatly affected by the climate impacts. The adaptive capacity rankings range from AC0-System is not able to accommodate or adjust to the climate impact to AC4-System is able to accommodate or adjust to the impact in a beneficial way.
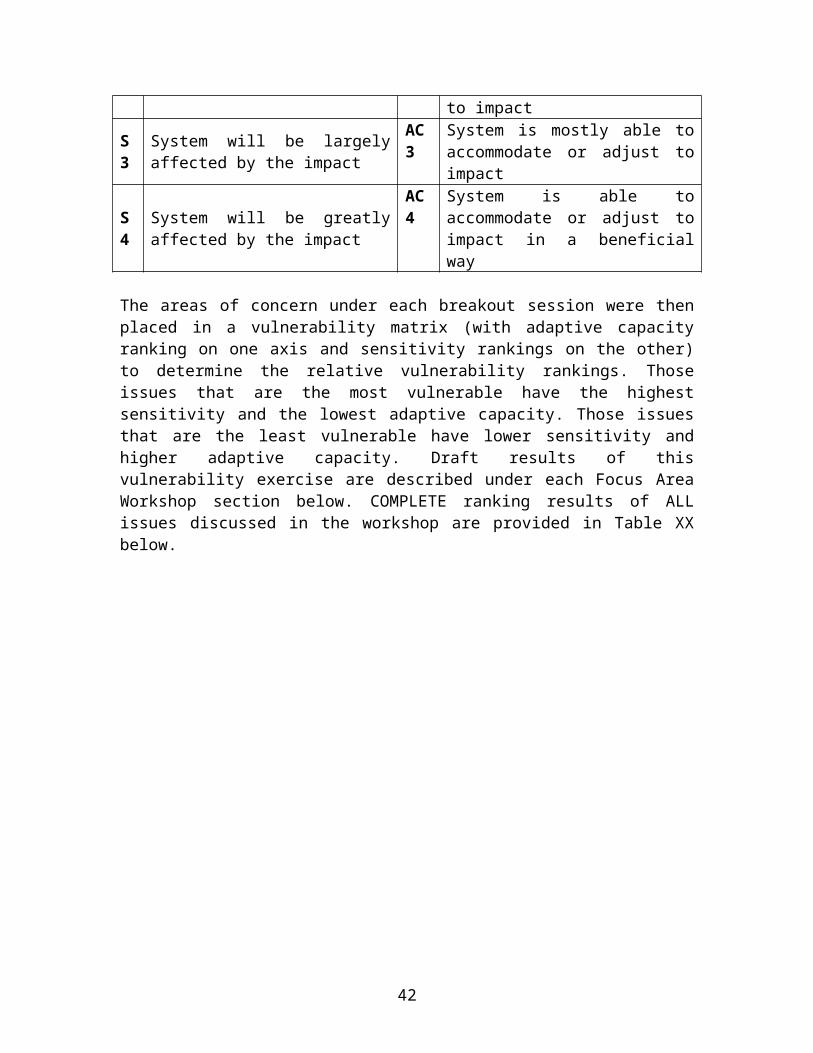
Table 7. Sensitivity and Adaptive Capacity Levels
Sensitivity Levels Adaptive Capacity Levels
31

S0 System will not be affected by the impact
AC0 System is not able to accommodate or adjust to impact
S1 System will be minimally affected by the impact
AC1 System is minimally able to accommodate or adjust to impact
S2 System will be somewhat affected by the impact
AC2 System is somewhat able to accommodate or adjust to impact
S3 System will be largely affected by the impact
AC3 System is mostly able to accommodate or adjust to impact
S4 System will be greatly affected by the impact
AC4 System is able to accommodate or adjust to impact in a beneficial way
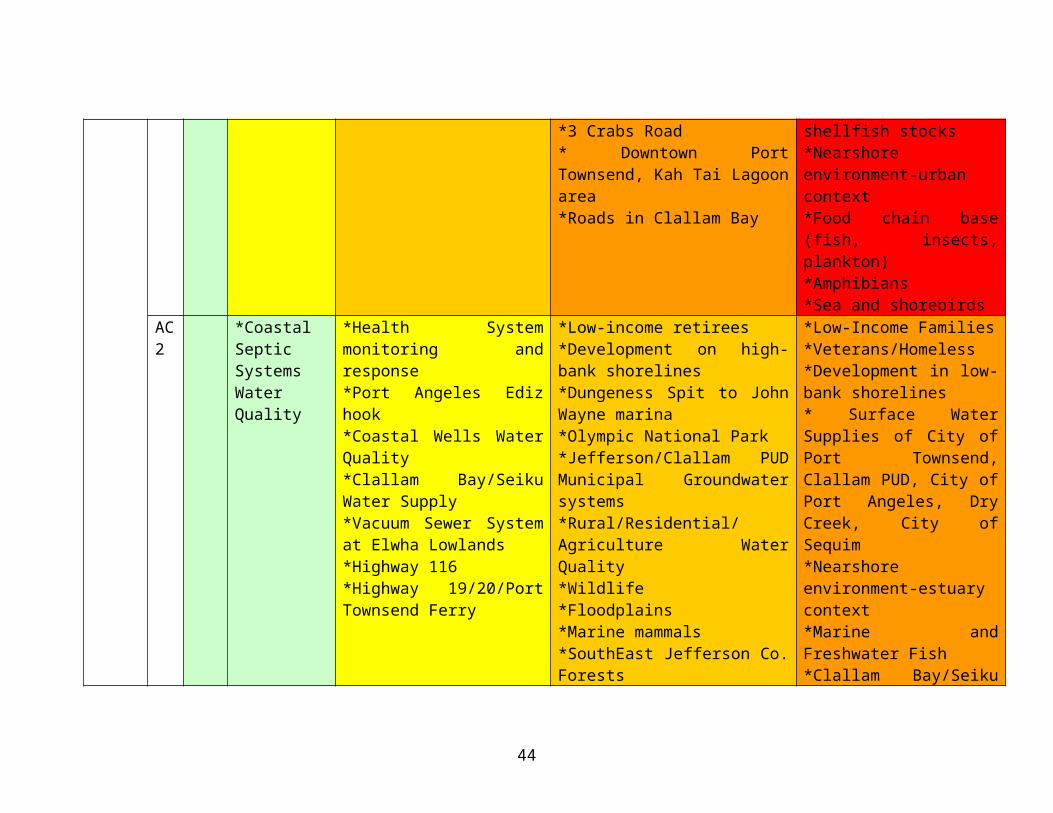
The areas of concern under each breakout session were then placed in a vulnerability matrix (with adaptive capacity ranking on one axis and sensitivity rankings on the other) to determine the relative vulnerability rankings. Those issues that are the most vulnerable have the highest sensitivity and the lowest adaptive capacity. Those issues that are the least vulnerable have lower sensitivity and higher adaptive capacity. Draft results of this vulnerability exercise are described under each Focus Area Workshop section below. COMPLETE ranking results of ALL issues discussed in the workshop are provided in Table XX below.
32
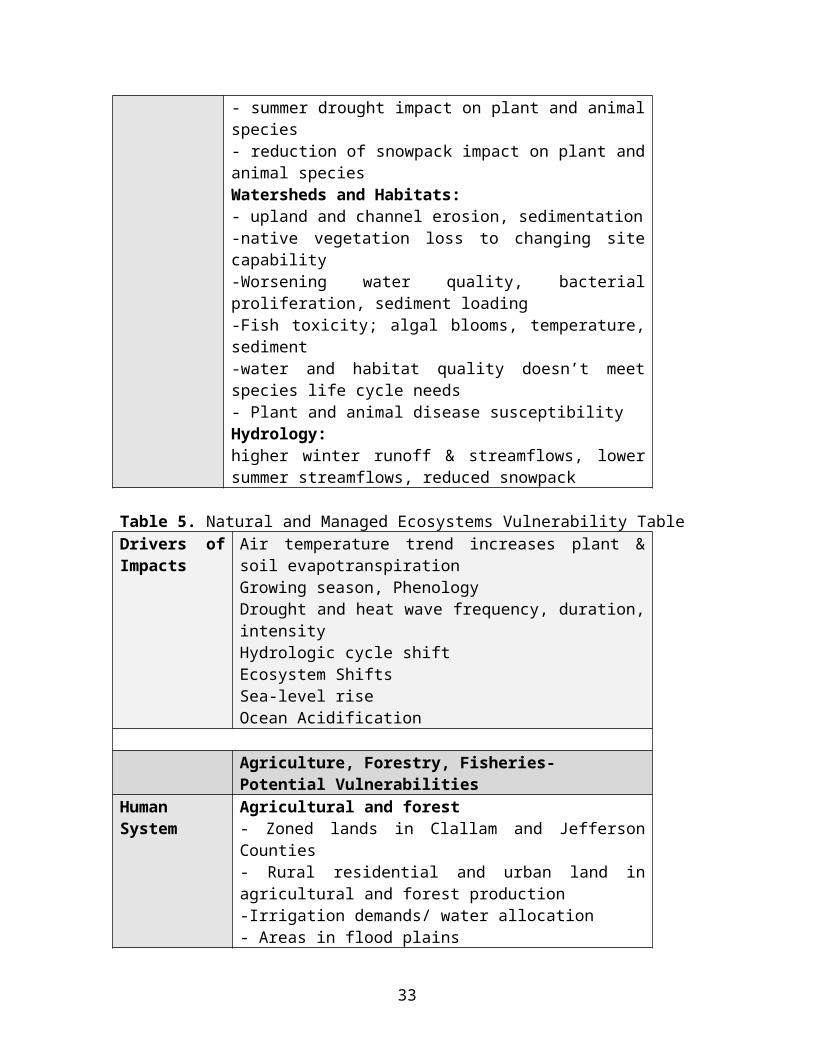
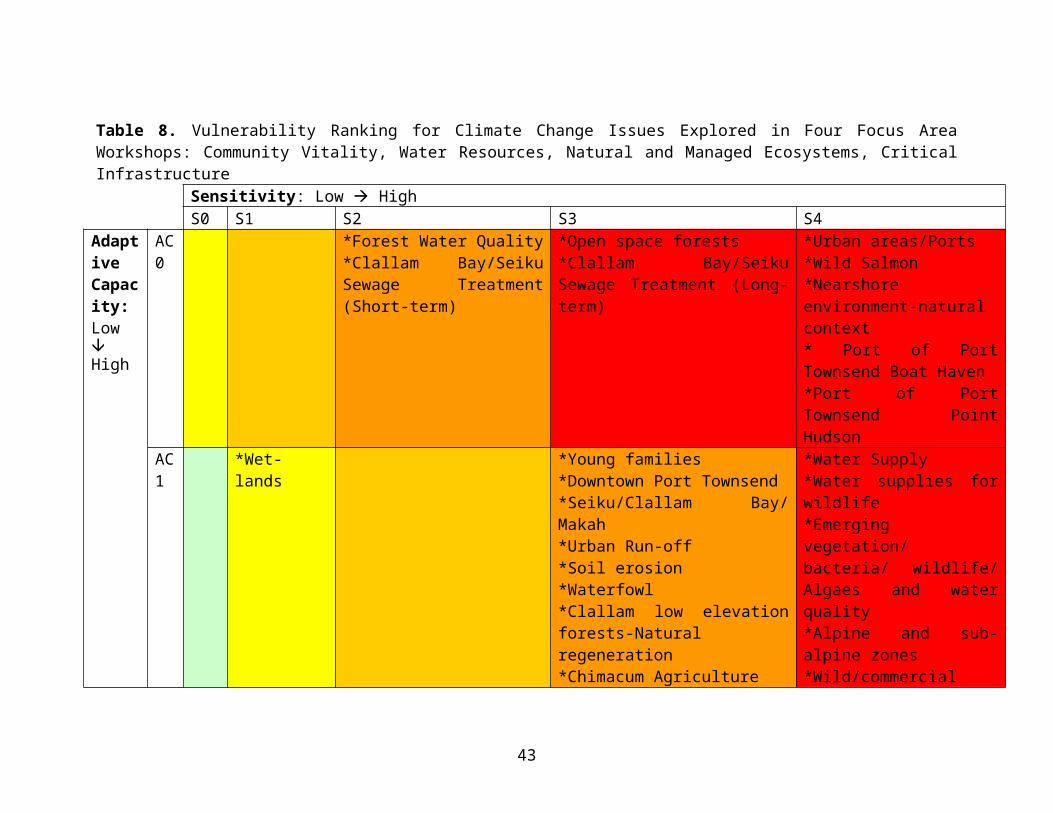
Table 8. Vulnerability Ranking for Climate Change Issues Explored in Four Focus Area Workshops: Community Vitality, Water Resources, Natural and Managed Ecosystems, Critical Infrastructure
Sensitivity: Low HighS0 S1 S2 S3 S4
Adaptive Capacity:LowHigh
AC0
*Forest Water Quality*Clallam Bay/Seiku Sewage Treatment (Short-term)
*Open space forests*Clallam Bay/Seiku Sewage Treatment (Long-term)
*Urban areas/Ports*Wild Salmon*Nearshore environment-natural context* Port of Port Townsend Boat Haven*Port of Port Townsend Point Hudson
AC1
*Wet-lands *Young families*Downtown Port Townsend*Seiku/Clallam Bay/ Makah*Urban Run-off*Soil erosion*Waterfowl*Clallam low elevation forests-Natural regeneration*Chimacum Agriculture*3 Crabs Road* Downtown Port Townsend, Kah Tai Lagoon area*Roads in Clallam Bay
*Water Supply*Water supplies for wildlife*Emerging vegetation/ bacteria/ wildlife/ Algaes and water quality*Alpine and sub-alpine zones*Wild/commercial shellfish stocks*Nearshore environment-urban context*Food chain base (fish, insects, plankton)*Amphibians*Sea and shorebirds
AC2
*Coastal Septic Systems
*Health System monitoring and response*Port Angeles Ediz hook
*Low-income retirees*Development on high-bank shorelines
*Low-Income Families*Veterans/Homeless*Development in low-bank
33

Water Quality *Coastal Wells Water Quality*Clallam Bay/Seiku Water Supply*Vacuum Sewer System at Elwha Lowlands*Highway 116*Highway 19/20/Port Townsend Ferry
*Dungeness Spit to John Wayne marina*Olympic National Park*Jefferson/Clallam PUD Municipal Groundwater systems*Rural/Residential/Agriculture Water Quality*Wildlife*Floodplains*Marine mammals*SouthEast Jefferson Co. Forests*High elevation forests -natural regeneration*Shellfish hatchery*Raptors*Songbirds*Septic Systems*Highway 112* Hoko/Ozette road*Forest Roads for fighting fires
shorelines* Surface Water Supplies of City of Port Townsend, Clallam PUD, City of Port Angeles, Dry Creek, City of Sequim*Nearshore environment-estuary context*Marine and Freshwater Fish*Clallam Bay/Seiku Sewer System (overall)*Stormwater Outfall Infrastructure*Highway 101
AC3
*Economically advantaged citizens*Electrical Transmission Infrastructure*Public Warning Systems (All
*Port Hadlock & Port Ludlow*Quilcene/Brinnon/Center Rd. Valley*Ft Worden/Ft Townsend/ Ft Flagler*Combined Sewer Overflow in Port Angeles* Lake Crescent Water Supply*Dungeness Agriculture
*Open space/Ag. Land*Stormwater management*Salmon hatchery*Small land mammals*Port Angeles Landfill*Highway 104/ Hood Canal Bridge*Morse Creek and Hot Springs Road* City of P.A. Industrial waterfront,
*Ft Worden lighthouse*Private Wells*Sewer Outfall Infrastructure
34

Hazards) *Quilcene Agriculture*Salmon aquaculture*Large land mammals
Ediz Hook and Lower Elwha
AC4
*Energy management* Clallam / Wheel / Ward / Burlingame bridges*Forest Roads to communication towers*South Jefferson County
*Low land river corridors*Clallam low elevation forests-managed*High elevation forests-managed
35
2. COMMUNITY VITALITY
a) Relevant Climate Projections
Community Vitality is a focus area aimed generally at topics of high value community sites, land-use planning and population growth, and current and future demographics. In addition to the general trends in temperature, precipitation, and ocean conditions described earlier in this report, there are additional climate change impacts specifically relevant to community vitality, including flooding and wildfire events, human health impacts, and climate migrants.
Figure 15: Over view of the NOP region and some of communities, key facilities, and federally managed lands as they relate to Community Vitality in the region.
Flooding and wildfire hold the potential to disrupt recreation, land use, and quality of life across the region. Current climate projections for the PNW suggest increasing fall and winter precipitation that falls in more extreme amounts45. This change paired with warmer overall temperatures causing more precipitation to fall as rain instead of snow, has resulted in projections of higher occurrences of flooding. Figure 16 below illustrates projected increase in 20 year flood cycles for the region.
36

Figure 16.46 Ratio of the 20 year flood magnitudes for simulated future and historic streamflows at select locations in the PNW. Size of dot shows relative change of occurrence of 20 year flood events (in the historical period those flood magnitudes that occurred on average once every 20 years). The A1B scenario represents a future where little attempt is made at greenhouse gas (GHGs) emissions reductions, B1 represents a future where reductions in GHG emissions are undertaken.
Climate modeling represented in Figure 16 above suggests that under current GHG emission amounts, by the 2040s the Elwha River may see 20 year floods occurring every 17 years, and the Dungeness may see 20 year floods occurring every 14 years. Wildfire risk could also increase in the region, although mediators of that risk include the magnitude of future pest infestations, tree species survival, and forest management.47
Although not always a direct impact to health, climate change has influence on many indirect impact pathways to human health. Figure 17 below illustrates some of these pathways.
37

Figure 17.48 Climate Change health effects pathways
Figure 17 above demonstrates that climate can impact human health directly through extreme weather and heat events and works through intermediate factors to hold influence on other health outcomes. Looking at this range of health outcomes, the most vulnerable populations to the health impacts of climate change are those over 65, children, poor and socially isolated individuals, the mentally ill, outdoor laborers, and those with cardiac or other underlying health problems49.
Of particular interest to health in the North Olympic Peninsula is the changing window of opportunity in the proliferation of Harmful Algal Blooms (HABs) and their associated illnesses, including Paralytic Shellfish Poisoning (PSP). Figure 18 below shows the increasing window of opportunity for the proliferation of temperature dependent HABs by increasing Sea surface Temperatures (SSTs).
38
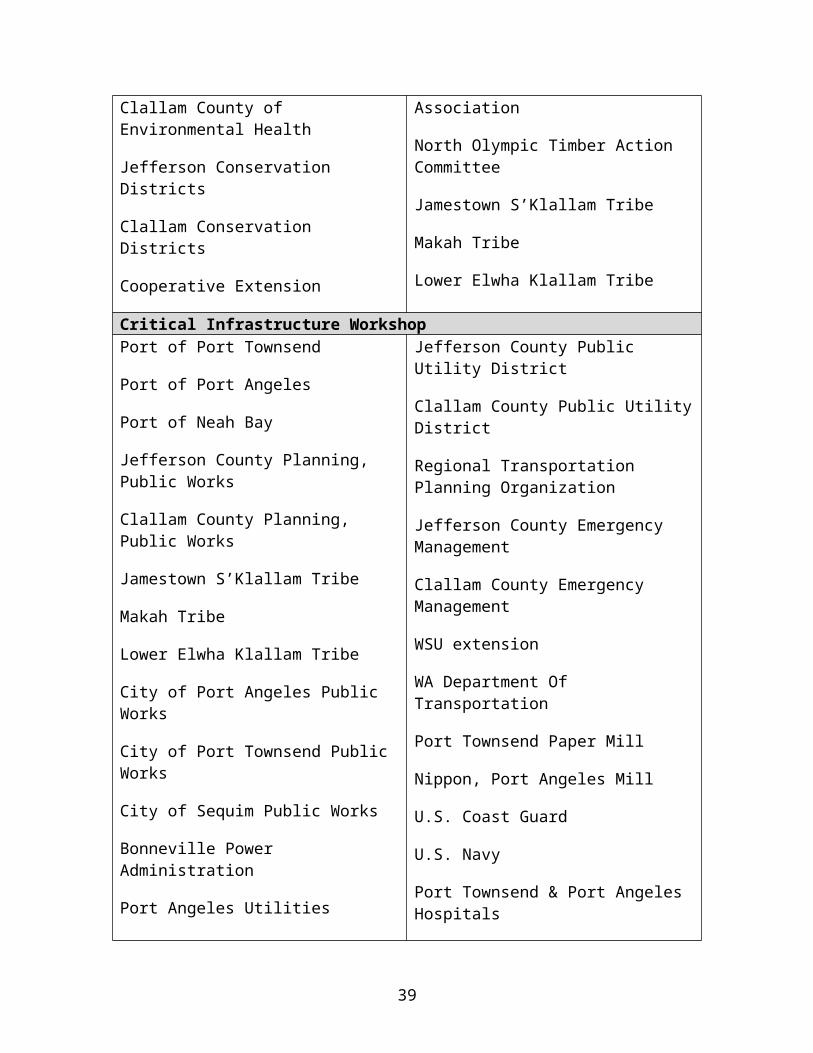
Figure 18.50 How sea surface temperature affects the annual window for HABs in Puget Sound. Graphic shows potential increase in the number of days above the 55.4°F (13°C) threshold where HABs occur more frequently. A 3.6°F (2°C) increase in sea surface temperature has the potential to double the number of days annually when the waters of Puget Sound are above this threshold. The dark black line and shaded region indicate current conditions. Dashed curves represent 2°C, 4°C, and 6°C increases in the sea surface temperature and the associated increase in the number of days above the threshold.
Another wide-ranging impact to all aspects of community vitality is the size and speed of development and population growth on the North Olympic Peninsula. If climate change continues unabated at its current projected pace, the types and magnitude of impacts across the United States may render the PNW as one of the more hospitable locations in the country, mostly owing to its milder climate and availability of water. This rationale remains speculation on future migration patterns, but it has been found previously that migration has occurred to the PNW region in the past for environmental, and not simply economic reasons51, and the discussion of the habitability of the PNW under climate change has only continued to increase in the popular media52.
b) Draft Vulnerabilities and Prioritization Matrix
On November 10th, 2014 a diverse range of stakeholders met in Sequim, WA to discuss Climate Change impacts relevant to issues of Community Vitality on the North Olympic Peninsula. This workshop included a review of climate change science, and identification and ranking of regional vulnerabilities. Areas of concern were ranked on their “sensitivity” to climate change impacts and their “adaptive capacity” or ability to
39

respond to this change. This ranking is a helpful method for prioritizing climate change adaptation planning across a diverse range of vulnerabilities.
Below is the vulnerability table drafted collaboratively by three breakout sessions at the workshop, covering issues of: High-value Community Sites; Land-use Planning and Population Growth; Current and Future Demographics. Each of the ranked vulnerabilities is described in more detail following the table in its given vulnerability category. This detailed information was gathered during workshop discussions of the ranking of each of the vulnerabilities, and includes aspects of both the sensitivity and adaptive capacity discussions.
Table 9. Community Vitality Vulnerability Ranking TableSensitivity: Low HighS0
S1 S2 S3 S4
Adaptive Capacity:LowHigh
AC0
*Open space forests *Urban areas/Ports
AC1
*Young families*Downtown Port Townsend*Seiku/Clallam Bay/ Makah
*Water Supply
AC2
*Health System monitoring and response*Port Angeles Ediz hook
*Low-income retirees*Development on high-bank shorelines*Dungeness Spit to John Wayne marina*Olympic National Park
*Low-Income Families*Veterans/Homeless*Development in low-bank shorelines
AC3
*Economically advantaged citizens
*Port Hadlock & Port Ludlow*Quilcene/Brinnon/Center Rd. Valley*Ft Worden/Ft Townsend/ Ft Flagler
*Open space/Ag. Land*Stormwater management
*Ft Worden lighthouse
AC4
*Energy management
*Low land river corridors
40
Vulnerability Ranking Descriptions:
Urban Areas/Ports: Many urban areas of the North Olympic Peninsula are found on low-bank waterfront sites. Commercial districts are vulnerable to sea level rise, storm surge and wind damage. Climate change therefore presents a threat to both economic sustainability as well as the services provided in these urban and port districts. Some of the region’s most important sectors are found in these regions: maritime industries, tourism, banking, government and retail.
Water Supply: Water supply is vulnerable to the projected decrease in precipitation during the warm and dry months of summer and current storage scenarios could be insufficient under drying conditions. Additionally, water delivery systems (sometimes piping for over 20 miles) are vulnerable to landslides and extreme weather events. Because water is essential for all life on the Peninsula, sensitivity is perceived as very high. (Note that this vulnerability was covered in more detail in the Water Resources workshop.)
Open Space Forests: The group evaluated ecosystems of value to this community for the quality of life they offer (ecosystem services were covered in another workshop). For forestry, this included: recreation, views, foraging and spiritual values. Forests were identified as sensitive to climate change due to increased likelihood of forest fire and drought and their ability to adapt is low due to the long life cycles of dominant tree species.
Young Families: This group is sensitive to utilities cost, recreational opportunities, cold and flu seasons, subsistence opportunities, impacts from divorce, lack of family wage jobs, drug and alcohol use, and has potentially very little resources for adaptation; needs improved education, family wage jobs.
Low-income Families: This group often stretches budgets to cover utilities and resides in aging households subject to extreme weather events (pests, wind, rain). Climate Change could impact their ability to maintain a healthy environment and access to affordable, healthy food (including subsistence). Group has existing support services helpful in adaptation (Habitat for Humanity, Goodwill, public transport, foodbank), but they need access to healthy foods, education, public health.
Veterans/Homeless: This group experiences exposure to outside environments (rainfall and temperatures) which could become more moderate. However, they could see continued exposure to increased extreme events, zoonotic disease and bacterial exposure. Current challenges include access to housing, no VA hospital, depression,
High Vulnerability
Medium-High Vulnerability
41
drug and alcohol use, competition for limited resources, and personal transportation is expensive and often unobtainable. There currently is have access to shelters, food bank, public transport, but need housing, medical, and drug and alcohol counseling.
Downtown Port Townsend: Under climate change, the area could see sea-level rise and an influx of climate refugees. The area has seen some flooding of basements and a high water table, closures due to flooding, road issues, undermining of structures. There are economic challenges for existing businesses in their ability to get insurance, financing, and regulatory issues. Area does enjoy a strong tourism base and strong community support and iconic value. Need investment in new, more flood tolerant infrastructure, and roads and buildings along with public awareness/education. Currently, many owners likely do not have money to invest in building improvements.
Seiku/Clallam Bay/Neah Bay: Currently experience severe weather storms, and droughts have impacted water supply. Could expect climate change impacts to limit transportation options; temperature/ocean acidification impacting fish and shellfish and commercial impacts, water supply issues due to changes in snowpack, and runoff issues, along with sea-level rise. Challenges to adaptation include general remoteness, ongoing regulatory disputes, public awareness and education, and funding. Strengths in adaptation include a resilient population with self-sufficiency including subsistence gathering.
Development in low-bank shorelines: Three Crabs, Dungeness Spit, Hood Canal, Beckett Point, Diamond Point: these three areas in particular were identified as vulnerable communities due to high density of residences in areas with potential sea level rise, storm surge and wind damage. They have very little adaptive capacity due to the proximity of buildings to current high water mark. The group was in agreement that future planning must prohibit building on parcels without significant set-back, and acknowledged that many existing parcels may be unbuildable.
Low-income Retirees: Group often stretches budgets to cover utilities and resides in aging households subject to extreme weather events (pests, wind, rain). Climate Change could impact ability to maintain a healthy environment and access to affordable, healthy food (including subsistence). Group has existing support services helpful in adaptation (Habitat for Humanity, Goodwill, public transport, foodbank), but they need access to healthy foods, education, public health.
Development on High Bank shorelines: Bluffs are popular for the building of view homes. But these are extremely vulnerable to increased erosion due to landslides, sea level rise, storm surge and high impact weather events. Feeder bluffs are particularly vulnerable. Recent Shoreline Management Plans address this concern better than
Medium Vulnerability
42
previous planning efforts, but this group felt that greater set backs would be required to protect bluffs and homes from anticipated impacts.
Dungeness Spit to John Wayne Marina: Under climate change, this area could see more runoff, higher water temperatures, sea level rise, bluff and beach erosion affecting wildlife preserves, salt water intrusion to groundwater, flooding and inundation, fish/shellfish impacts with resulting impacts on cultural and recreational values. Currently the system experiences pollution and agricultural runoff. Adaptation resources include highly resilient and resourceful communities with climate change awareness, need political awareness of communities at risk; elevating or relocation of infrastructure (limited roads); but continued access to tidelands is important.
Olympic National Park: Under climate change, the park could see more forest fires, road damage due to flooding, forest impact by pests, invasive species. Influential to adaptation options is the size of the park, constant oversight and federal funding, national significance/visibility, diversity of species. (See Adapting to climate change at Olympic National Forest and Olympic National Park53 for more detail.) Could continue to see challenges in channels of communication with local municipalities, along with continued shortfalls in federal funding.
Ft. Worden Lighthouse: Under climate change, could experience sea level rise worsening of existing beach erosion, erosion of historic structures. There is some state funding available as well as historic preservation funding for adaptation response, but existing structures are old and fragile. Long term preservation of the lighthouse may not be feasible.
Medium-Low Vulnerability
Health System Monitoring and Response: System currently mostly deals with care for retirees/elderly, but need tools to predict emergent climate change issues along with better infrastructure, strong emergency response, infectious disease monitoring, and the ability to attract high quality medical professionals.
Port Angeles Ediz Hook: Hook is susceptible to Sea Level Rise. Currently Hook protects inner area except for East/SouthEast storms, no current flooding, but sea level rise could surpass flooding thresholds. There are adaptation challenges in the form of regulations and financing, though the removal of dams may help long term reinforcement and stabilization of sediment. Prevailing winds are in favor of continued sediment building, would need more financing for additional armoring.
Open Space/Aggricultural Land: The group evaluated ecosystems of value to this community for the quality of life they offer (ecosystem services were covered in another
43
workshop). For agricultural lands, this included: the growing of food locally, the importance of agriculture to the region historically, recreation and views. Agricultural lands are seen as being relatively adaptable due to their ability to respond to extreme weather events, though flooding is a risk.
Stormwater Management: With increased precipitation during extreme weather events, stormwater systems are more likely to be overwhelmed by volume as grasses and other pervious surfaces absorb less runoff and contaminants. This, in turn, results in poor treatment.
Economically advantaged citizens: This group enjoys recreational opportunities, often live in view lots (potentially higher hazard), subject to climate changes related to air quality (pollen) and ability to recreate. Group does have access to development strategies that are sustainable and support adaptation, need education and perhaps changes to regulation/enforcement.
Port Hadlock and Port Ludlow: These areas could see climate change impacts of sea level rise and summer drought. Piers and waterfront homes are particularly vulnerable, the changing precipitation intensity could impact the aquifer (covered further in Water Resources). Areas face ongoing issues in economic development and regulation, but benefit from central location, location on some higher ground, strong communities. Existing infrastructure includes sewage treatment plant, the Northwest School of Wooden Boat Building, septic infrastructure.
Quilcene/Brinnon/Center Rd. Valley: Area may see more intense rainfall, sea level rise, flooding in heavy rains from climate change. More intense rainfall could impact septic’s drainage. Ocean acidification could have impacts on businesses, area already includes low-income population, limited sewage systems. Current population is used to waterfront access, need flood control for road structures, septic systems. Might be funding if roads are involved.
Fort Worden/Fort Townsend/Fort Flagler: Under climate change, could experience sea level rise worsening of existing beach erosion, erosion of historic structures. There is some state funding available as well as historic preservation funding for adaptation response, but existing structures are old and fragile. May need to be flexible in the management of other fort amenities.
Low-land River corridors: The group evaluated ecosystems of value to this community for the quality of life they offer (ecosystem services were covered in another workshop). For low-land river corridors and flooding estuaries, this included: birding and other wildlife habitat, views, open space, recreation. These areas are, by nature, adaptable to weather conditions and therefore rank low in vulnerability.
Low Vulnerability
44

Energy Management; ?
3. WATER RESOURCES
a) Relevant Climate Projections
Water Resources is a focus area aimed generally at topics of water supply, water quality, and watersheds. In addition to the general trends in temperature, precipitation, and ocean conditions described earlier in this report, there are additional climate change impacts specifically relevant to water resources, including shifting hydrologic basin types and timing of seasonal streamflows.
Figure 19: Overview of the Water Resources focus area with key rivers and watershed boundaries as well as other water infrastructure.
Warmer overall temperatures will drive historical snow events towards the thaw threshold, leading to more precipitation throughout the fall-winter-and spring falling as rain instead of snow. This shifting freezing threshold will be particularly pronounced in those high elevation zones such as the Olympic Mountains where snowfall has historically maintained glaciers and influenced entire ecosystems as a partial-snow
Potential Opportunity
45
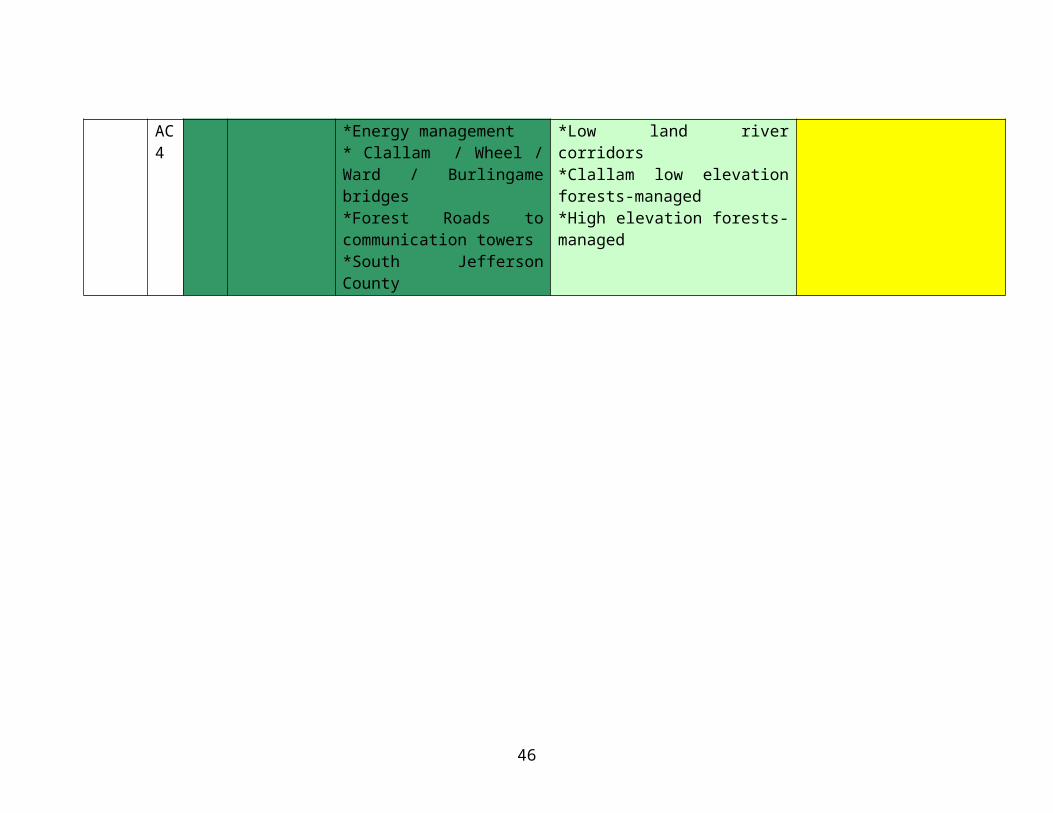
hydrologic basin. Figure 20 below shows projected shifts in hydrologic basin types for the PNW region.
Figure 20.54 Shifting hydrologic basin types in the PNW under climate change. This projection shows the shifting of hydrologic basins on the North Olympic Peninsula away from a transition (rain & snow) watershed to rain dominant by the end of the century under climate change. With global temperature rise showing little sign of future abatement, this future may vary in timing but not in ultimate outcome.
Shifts in hydrologic basin types necessarily influence the way that the precipitation is stored and the timing of its release and flow from high elevation sources to downstream lowlands. The general projection of increased fall and winter precipitation and decreased summer precipitation in the region, paired with the shift towards a more rain dominant watershed, suggests long-term changes to watershed flow on the North Olympic Peninsula. In Figure 21 below, projected hydrographs for both the Elwha and Dungeness rivers are displayed.
46

Dungeness River Hydrograph(near river outlet)
Elwha River Hydrograph (near McDonald bridge near Port Angeles)
Figure 21.55 Hydrograph projections for the Dungeness and Elwha rivers. The blue line is the historical flow, while the red line is the projected average flow with the red shading showing variability. Flow amount is shown with monthly values, starting in October and ending in September. The A1B scenario represents a future where little attempt is made at greenhouse gas (GHGs) emissions reductions, B1 represents a future where reductions in current amounts of GHGs are undertaken.
In Figure 21 above, it can be seen that a shift away from a transition hydrologic basin towards more rain dominant for the Dungeness means increased winter flows and reduced summer flows. For the Elwha, which was historically a more rain dominant watershed, there is less of a shift in timing of flow, but instead a projected simple increase in amount of winter flow and reduction in summer flow.
b) Draft Vulnerabilities and Prioritization Matrix
On November 12th, 2014 a diverse range of stakeholders met in Sequim, WA to discuss Climate Change and issues of Water Resources on the North Olympic Peninsula. This workshop included a review of climate change science, and identification and ranking of regional vulnerabilities. Areas of concern were ranked on their “sensitivity” to climate change impacts and their “adaptive capacity” or ability to respond to this change. This
47

ranking is a helpful method for prioritizing climate change adaptation planning across a diverse range of vulnerabilities.
Below is the vulnerability ranking table drafted collaboratively by three breakout sessions at the workshop, covering issues of: Water Supplies; Water Quality; Watersheds. Each of the ranked vulnerabilities is described in more detail following the table in its given vulnerability category. This detailed information was gathered during workshop discussions of the ranking of each of the vulnerabilities, and includes aspects of both the sensitivity and adaptive capacity discussions.
Table 10. Water Resources Vulnerability Ranking TableSensitivity: Low HighS0 S1 S2 S3 S4
Adaptive Capacity:LowHigh
AC0 *Forest Water Quality
AC1 *Urban Run-off*Soil erosion
*Water supplies for wildlife*Emerging vegetation/ bacteria/ wildlife/ Algaes and water quality*Alpine and sub-alpine zones
AC2 *Coastal Septic Systems Water Quality
*Coastal Wells Water Quality*Clallam Bay/Seiku Water Supply
*Jefferson/Clallam PUD Municipal Groundwater systems*Rural/Residential/Agriculture Water Quality*Wildlife*Floodplains
* Surface Water Supplies of City of Port Townsend, Clallam PUD, City of Port Angeles, Dry Creek, City of Sequim
AC3 *Combined Sewer Overflow in Port Angeles* Lake Crescent Water
*Private Wells
48
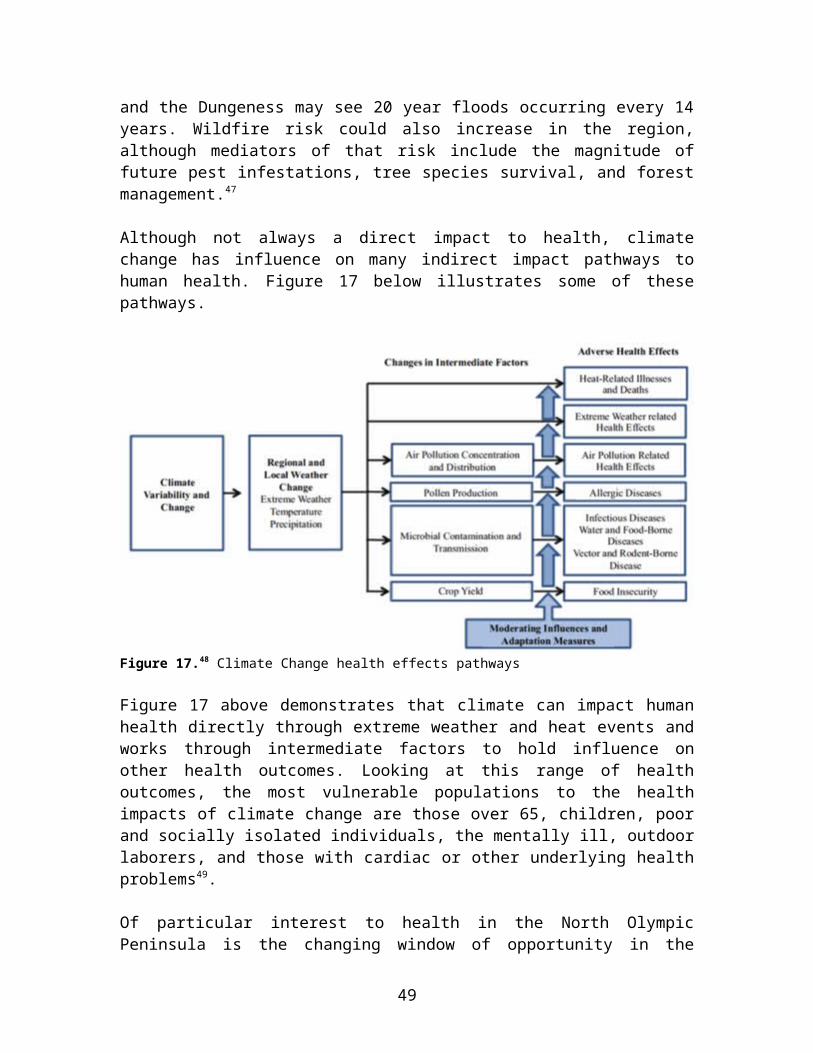
SupplyAC4
Vulnerability Ranking Descriptions:
Water Supplies for Wildlife: Climate change could: decrease snow pack; change precipitation timing and intensity; reduce stream flow; cause rain on snow event / high water events; increase forest fires; change stream morphology; raise stream temperatures, and increase competition with the human population. Impacts will be influenced by ongoing restoration projects, development, road decommissioning, regulations, water discharge, extensive monitoring for fish populations and stream flow levels. For adaptation, some of the potential approaches include: protection of existing habitat; less development; maintaining existing watershed functions; active monitoring for stream blockages; possible additional allocation of water to maintain stream levels in late summer. Better data on how much water really is needed for fish would be useful. Another adaptation strategy could be to use multipurpose storage that could be used for humans or fish. All suggested adaptation strategies appear to be quite difficult to implement.
Emerging vegetation/ bacteria/ wildlife/ algaes & water quality: Existing issues include fecal coliform reproducing in rivers, Harmful Algae Blooms (emerging Diarrhetic Shellfish Poisoning), Algae blooms in Anderson Lake (highly eutrophic), altered biodiversity, increased Macro algae blooms (anthropogenic nitrogen is a direct influence). Leland Lake, Lake Sutherland currently see freshwater plants. Climate change could influence windows of opportunity and strength of proliferation of these organisms. Confounding issues include nutrient loading, human introduction of species.
Alpine and sub-alpine zones: Under climate change, the area could see declining snowpack and glaciers, increase of spring/winter/fall precipitation, declining summer precipitation, more frequent extreme events, and more warming events. Currently, the area is seeing a historical warming of temperatures and changes in precipitation patterns, there also already appears to be stress on vegetation and forests, and a proclivity towards more nonnative/invasive species. Climate changes may include drier summers and less rainfall, whichincreases forest fire risk, more groundwater and flooding = greater soil moisture content? Could see greater threat to disease and beetles, stress and erosion. Adaptation success may depend on existence of glaciers, protection status. The systems will likely adapt/change because it is protected space, but what it changes into will not be the same.
High Vulnerability
Medium-High Vulnerability
49

Forest Water Quality: The area has already seen impacts from pine bark beetle and high temperatures in water (lack of canopy) leading to high dissolved oxygen influenced by logging and agricultural/residential conversion of forest lands. Impacts and adaptation will be influenced by success of mandated buffers around streams.
Urban Run-off: The area is already seeing extreme precipitation lead to increased turbidity and bacteria, metals run off from roads, leading to dissolved oxygen and fecal coliform outbreaks. First large fall rain event washes summer accumulation into creeks such as manure from agriculture sources. Lighter rain can drive contaminants into the groundwater. Climate change could increase the dry season with contaminant loading that is liberated during more intense fall rain events, may be large enough events to liberate contaminants that previously were too heavy for transport (eg. metals on roads). Relevant to adaptation, there are existing state laws for septics and wells and Dept. of Ecology flow control. Currently have stormwater systems in place but may need additional capacity and treatment, which are available but high cost.
Soil Erosion: Already see increased erosion and resulting turbidity during extreme events (Johnson Creek), see erosion at Matriotti Creek due to agriculture influence. The Elwha River is largely incised because of peak flows, Chimacum Creek has been plugged up with overflows. There is concern about logging in steep terrain and erosion or landslides. There is potential future alteration to bank stability species (due to pine beetles, for example), also influence of increased peak flows and landslides. Other influences to impacts include dam removal (Elwha), flood plain control (Dungeness) and agriculture influence (livestock eroding bank). Erosion is in some ways a natural process that can assist in adaptation (e.g. floodplains).
Surface Water Supplies of City of Port Townsend, Clallam PUD, City of Port Angeles, Dry creek, City of Sequim: Supplies could see climate change influence on: recharge rate which may differ due to changes in precipitation intensity and timing (impact is not known currently, additional modelling or monitoring would be beneficial); lower stream flow which may drive less stream diversion to meet fish regulations;, high water events which can cause turbidity issues; increased water demand due to water needed to fight an increased number of fires; increased demand due to warmer temperatures; earlier and longer growing season could increase demand for irrigation water; increased climate refugees could increase demand; fires in a watershed could cause turbidity (so have to rely on stored water); and could see increased evaporation due to increased temperatures. For historical reference: in Port Townsend low snowpack has caused issues in past; Clallam PUD has seen low flow due to snowpack and timing of rains; Makah have had water supply issues; Beaver Creek and Lake Pleasant have had issues. Warming temperature have had impacts on algal/water quality issue in Port Townsend. Generally, reduced snowpack impacts refilling of reservoirs though this doesn’t impact areas further west that are rain-dominant watersheds. Adaptation options could be tied to storage capacity, conservation programs and water use efficiency laws, accurate data on how much water fish actually need, county infrastructure planning, interties with
50

other systems, conservation and education. These actions could be challenging due to implement due to the range of interested stakeholders with divergent interests and needs.
Jefferson/Clallam PUD groundwater Water Supplies: System could see recharge rates and amounts altered by snow pack decrease (as noted above, more data is needed); changes in precipitation timing and intensity; low stream flow; rain on snow event / high water events; increased forest fires; higher temperatures and evaporation; increased competition for resources (irrigation, population, fires). Jefferson PUD has seen drought followed by rain, where the overall recharge rate was less than expected, perhaps due to rain coming when plants were actively growing. Historically, drought events correlate with drops in static water levels tied to timing and quantity of precipitation. Ongoing influences include potential for pollution from septics or fertilizers. Adaptation opportunities could include conservation methods and rate structures, alteration of storage methods, interties between systems, and regulatory changes that support these actions.
Rural/Residential/Agriculture Water Quality: Currently, some manure lagoons occasionally see overflow during extreme precipitation events, not known if this also sees seepage to groundwater; other pollutants include pesticides, herbicides, fertilizer, contaminants on hardscape (Marrowstone has cisterns). Capacity of manure lagoons may not be adequate under climate change, and shoreline and natural buffers could diminish. Existing processes relevant to adaptation include enforcement and education.
Private Wells: Wells can be influenced by climate change where sea level rise can cause salt water intrusion; there is some impact of lower snowpack on wells; shallow wells are highly sensitive for infiltration; recharge rate may differ due to changes in precipitation intensity and timing; there could be increased demand due to warmer temperatures; earlier and longer growing season could increase demand for irrigation water; could see increased demand from climate refugees. Other factors can influence the water table - in the past, irrigation ditches were leaking, and when those were piped, that reduced the water table and wells dried up. In Elwha - 5 or 6 people have lost their wells (could be from dams but not sure, Laird’s Corner and Lower valley); Clallam PUD has previously had some shortages due to low stream flow and regulatory constraints - needed to implement conservation measures. There has already been saltwater intrusion in Marrowstone and other Jefferson County areas. Confounding issues includes behavior (Marrowstone increased usage when PUD water was brought in), water pricing, zoning and regulation. There is the potential that sea level rise may cause the groundwater table to rise in coastal areas. Adaptation strategies include the potential for interties with existing water systems, reuse of greywater, or reclamation system for irrigation; can influence personal behavior with metering; put in cisterns; rainwater catchment; education on conservation; native plant education; regulatory refinement to affect
Medium Vulnerability
51

usage rate; comprehensive planning; ; agreements with irrigation companies. The approach may vary across different systems. These actions may not be that monetarily expensive but the challenge is the need to communicate to and influence the actionsof many individuals.
Wildlife: A changing climate could impact wildlife through extreme weather, drought and wildfires. Currently the region has a moderate climate with diverse wildlife populations; elk populations are staying low. Under climate change could see limited food at higher elevations, lack of snowpack, increased stress, and more interactions with humans if animals are driven from higher elevations and do not have food. Could see more human interaction, more hunting, more fencing, more management, more diseases (pine beetle). Current confounding issues include development, harvesting, hunting, forestry. For adaptation success, need to identify key species, indicator species to monitor to help guide response. Habitat management can involve: hunting/harvest, access to habitat/connectivity, population/habitat monitoring, corridors, open space, and access to water.
Floodplains: Under climate change, could see increased frequency of storm events, rain events. Increased frequency/severity of drought events; changes in hydrograph, pulse. Currently see impact from levees, bridges, diversions, upland land use practices, storm water discharge. Could see increased erosion, scouring, more big cobbles, uplands sediment sources, increased flooding, changes in side channel habitat, property damage, increased storm flashiness of floods, impacts on estuaries, intrusion issues for groundwater. Adaptation opportunities vary from place to place – sometimes unrestricted, sometimes protected; there is an improving political/funding climate – i.e. work on Dungeness; issues are knownwhich makes it easier to map and manage. For adaptation, need space, access to floodplain, regulatory – enforcement and improvement of regulations, management input – time, funding, public outreach. Political climate can be difficult as there are many private owners on floodplain.
Coastal Wells Water Quality: Sensitivity of the wells depends on groundwater flow and recharge and irrigation methods. Climate change could bring diminished opportunity for groundwater recharge, along with impacts from sea level rise and coastal storms. Currently, diminishment of water table through use drops water table and allows saltwater intrusion, coastal development also has influence.
Clallam Bay / Seiku Water Supply: groundwater-based system; currently not as much snowpack-driven as for systems further east, so impact is a bit less.
Medium-Low Vulnerability
Low Vulnerability
52
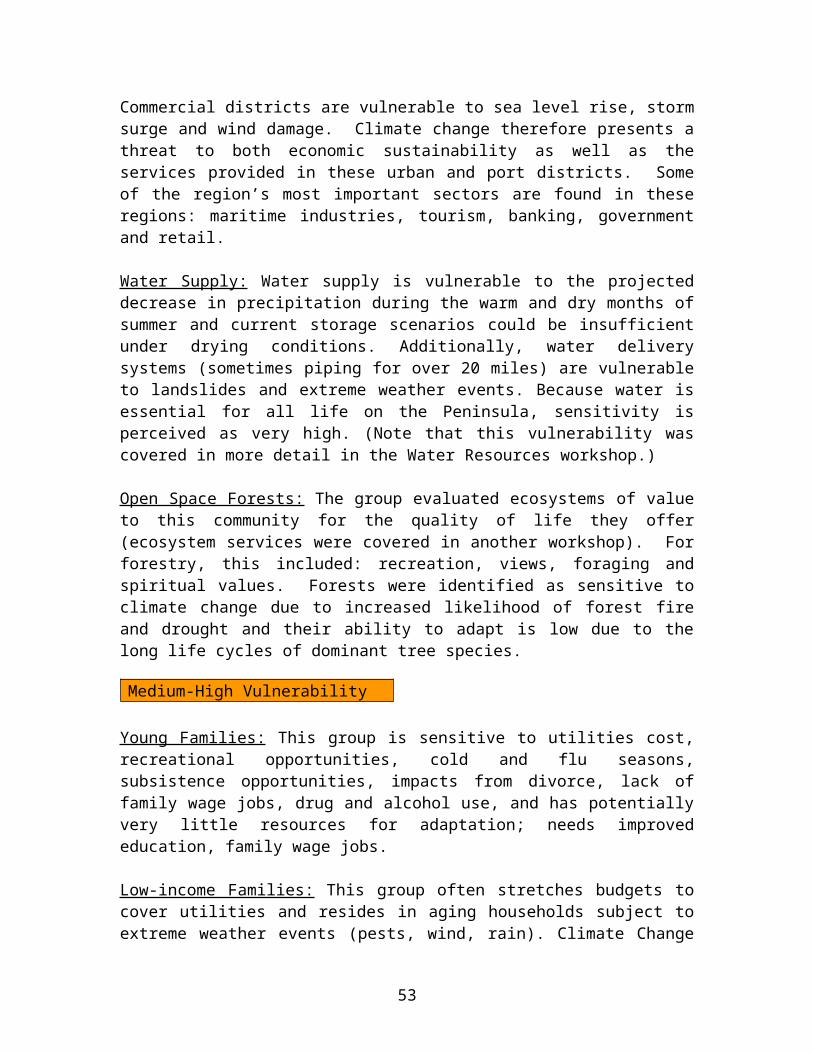
Coastal Septic System Water Quality: Systems are already compromised at Golden Sands, Three Crabs, Beckett Pt. Climate change could influence evaporation rate (for mound systems), and sea level rise could inundate septic fields. Related issues are enforcement and corrective actions (supposed to be inspected each year), also differing quality in maintenance and management. Many individual responsibilities would play into adaptation strategies.
Combined Sewer Overflow (CSO) in Port Angeles: Extreme precipitation events cause CSO, currently 100 overflow events a year (tracking started in 2000) but with new system (designed and funded) should have 1 event a year by 2016. Climate change could increase the frequency of CSO, impact is mostly to Port Angeles harbor. System is seeing upgrade to conveyance of west Port Angeles to treatment plant, will also have a storage tank to hold overflow.
Lake Crescent Water Supply: Currently not as much snowpack-driven as for systems further east, so impact is a bit less; supply does not currently have issues, adaptive capacity is good.
Vulnerability Issues Needing “Adaptive Capacity” Ranking
The following issues received a Sensitivity Ranking but no ranking of Adaptive Capacity during the workshop (due to time limitations). The descriptions of their Sensitivity follow the table below. If you would like to provide input on these issues please add your own Adaptive Capacity ranking for each vulnerability (using the criteria outlined on page 1), as well as providing a brief description on your rationale for the ranking.
Vulnerability Issue
Sensitivity Ranking
Adaptive Capacity Ranking:?
Rationale for Adaptive Capacity Ranking
Shorelines/ Estuaries
S3
Wetland function S3Native and non-native vegetation- upland and riparian
S3
Development from climate refugees
S2
Homeowners S3
Vulnerability Description for Sensitivity Rankings
53
Shorelines/ Estuaries: Under climate change these areas could experience increased frequency and severity of severe storms, sea level rise, warmer waters, alteration to erosion patterns, and altered algal bloom events. These areas already see increased periodic flooding and salt water intrusion. Warming water trends stress the ecosystem, increase flora/fauna susceptibility to parasites, bacteria, and disease. Sea level rise could promote a higher incidence of salt water intrusion in marshes/estuaries and stress the plant community. Could also see changes in estuary freshwater lens, thermocline due to changes in temperature and freshwater inputs. There is potential for increased estuary turbidity due to increased sediment load, more intense stream pulse, and potentially scouring. Other confounding issues are the management difficulties of these areas (e.g. property owner-driven protection measures), as well as the development pressure, existing armoring, nutrient runoff (stormwater, agriculture sources), and current large scale restoration (such as the Elwha estuary, Dungeness floodplain, Pysht).
Wetland Function: Relevant climate change issues include water availability, drought, rates of inflow and outflow (changing precipitation patterns, snowmelt), flooding (potential increased heavy nutrient load), increased sediment deposits could fill up wetlands. Biggest current impact to this system comes from human society, and some animal alterations (e.g. beavers). Climate change could lead to an overall disturbance of ecological balance – changing condition, changing hydrology – shift in plants communities, nutrient load, algae bloom, low oxygen levels, changing invertebrate population. Wetlands are complex and affected in different ways – or if inundated, they become flooded. Wetlands dry up if not fed by snow pack, wetlands can disappear. Would nutrient discharge from wetlands spike with extreme events?
Native and non-native vegetation - upland and riparian: Relevant climate change impacts include: high stream flow, low stream flow, drought, wildfire, air temperature increases, and reduction in snowpack. Historically have seen a moderate climate, precipitation and hydrology extremes do not support same vegetation complex in same places, can stress species, encourage non-natives. Climate change could cause a loss of streamside vegetation (shade and wood), streams may become wider and shallower, bug infestations (driving catastrophic fire, disease susceptibility). Future confounding factors include higher management costs, more sedimentation, the use of more pesticides, surface and stream bank erosion, and a potential decline in forestry (which could remove roads and limit ability to access areas during fires)
Development from Climate Refugees: Climate change could result in higher temperatures and reduced snow pack, building on the existing sunny Sequim effect – it’s going to get even nicer – regionally Sequim is attractive and may become more so. However, existing national perception is this is gray, rainy place. If the region becomes more attractive due to climate change, that equals more people, more development, more impervious surface (stormwater increase), more warming (from urban heat island
54

effect), more habitat lost, increased demand for water, and the potential for fragmented habitat.
Homeowners: Main climate change impact could come from sea level rise. Group already experiences extreme precipitation, increased flooding, increased bluff failure of high bank. Confounding issues include the existing coastal armoring, regulatory environment; having people want to build exposed homes – view homes have higher value.
4. NATURAL AND MANAGED ECOSYSTEMS
a) Relevant Climate Projections
Natural and Managed Ecosystems is a focus area aimed generally at topics of Fisheries and Aquaculture; Agriculture and Forestry; Wildlife. In addition to the general trends in temperature, precipitation, and ocean conditions described earlier in this report, there are additional climate change impacts, specifically air and river water temperatures impact to ecosystems and water availability in soils.
Figure 22: Natural and Managed Ecosystem overview for the Focus Area. Data layers include primary crop, shellfish harvest sites, sensitive aquatic sites, and rare plant locations.
General increases in air temperatures will also drive increases in sea surface temperatures and river warming. Ecosystems have developed to thrive and tolerate
55
certain temperature thresholds that may be altered or exceeded under climate change. Figure 23 below shows changes to air and river temperatures and their relevance to the overall vitality of salmon species.
Figure 2356. Current and projected air and river water temperatures. Average weekly August air temp (shading) and river water temperatures (dots) for historic conditions, 1970-1999 (left panel) and future projections, 2040s (high emissions scenario – right panel). The Dungeness River (upper right quadrant) will likely remain cool (see blue dot in right panel) into mid century, even as land temperatures increase, owing to steep gradient and snowmelt that supplies water to the river over the summer.
The shifts in timing and amounts of precipitation in the fall-winter months, and the reduction in summer precipitation and river flows will hold direct impact to the amount of water stored in soils and available for forests, agriculture, and wildlife. Figure 24 below shows projected soil water storage from now until the end of the century for Clallam County.
56
Figure 24.57 Projected changes to soil water storage in Clallam County. Monthly averages of soil water storage for four time periods for the RCP4.5 future emission scenario (reduced future GHG emissions) and RCP8.5 scenario (continued levels of current GHG emissions) simulations. The average of 30 climate models is indicated by the solid lines and their standard deviations are indicated by the respective shaded envelopes.
Climate change impacts to agriculture in the NOP region will vary greatly by type of agricultural commodity and ultimate severity of climate change. The overarching relevant impacts of concern to all agricultural sector sin the PNW include; increases in mean summer temperatures, increases in mean cool-season temperatures, increases in length of growing season, increases in length of growing season, increase in mean evapotranspiration, decrease in summer soil moisture, decrease in mean summer precipitation, and increase in mean winter precipitation58. Figure 25 illustrates the connection between these impacts and particular portions of the agricultural sector.
57

Figure 2559. PNW portions of the agricultural sector by market value ($billion) in 2007, alongside their sector specific potential climate change impacts.
Much like the plants and animals that make up the agricultural sector, those natural and managed forest ecosystems will be vulnerable to the same suite of climate change impacts. These impact are expected in a magnitude to substantially affect PNW forest’s “distribution, growth, and functioning”60. Generally, impacts include limited future sub-alpine forests, water availability changes and tree growth, increasing annual and extreme temperatures, altered carbon cycling, changing windows of opportunity for bark beetles and defioliating insects, and altered wildfire regimes61.
b) Draft Vulnerabilities and Prioritization Matrix
On November 13th, 2014 a diverse range of stakeholders met in Blyn, WA to discuss Climate Change impacts relevant to issues of Natural and Managed Ecosystems on the North Olympic Peninsula. This workshop included a review of climate change science, and identification and ranking of regional vulnerabilities. Areas of concern were ranked on their “sensitivity” to climate change impacts and their “adaptive capacity” or ability to respond to this change. This ranking is a helpful method for prioritizing climate change adaptation planning across a diverse range of vulnerabilities.
Below is the vulnerability ranking table drafted collaboratively by three breakout sessions at the workshop, covering issues of: Fisheries and Aquaculture; Agriculture and
58

Forestry; and Wildlife. Each of the ranked vulnerabilities is described in more detail following the table in its given vulnerability category. This detailed information was gathered during workshop discussions of the ranking of each of the vulnerabilities, and includes aspects of both the sensitivity and adaptive capacity discussions.
Table 11. Natural and Managed Ecosystems Vulnerability Ranking TableSensitivity: Low HighS0 S1 S2 S3 S4
Adaptive Capacity:LowHigh
AC0
*Wild Salmon*Nearshore environment-natural context
AC1
*Wet-lands
*Waterfowl*Clallam low elevation forests-Natural regeneration*Chimacum Agriculture
*Wild/commercial shellfish stocks*Nearshore environment-urban context*Food chain base (fish, insects, plankton)*Amphibians*Sea and shorebirds
AC2
*Marine mammals*SouthEast Jefferson Co. Forests*High elevation forests -natural regeneration*Shellfish hatchery*Raptors*Songbirds
*Nearshore environment-estuary context*Marine and Freshwater Fish
AC3
*Dungeness Agriculture*Quilcene Agriculture*Salmon aquaculture*Large land mammals
*Salmon hatchery*Small land mammals
AC4
*Clallam low elevation forests-managed*High elevation forests-managed
59
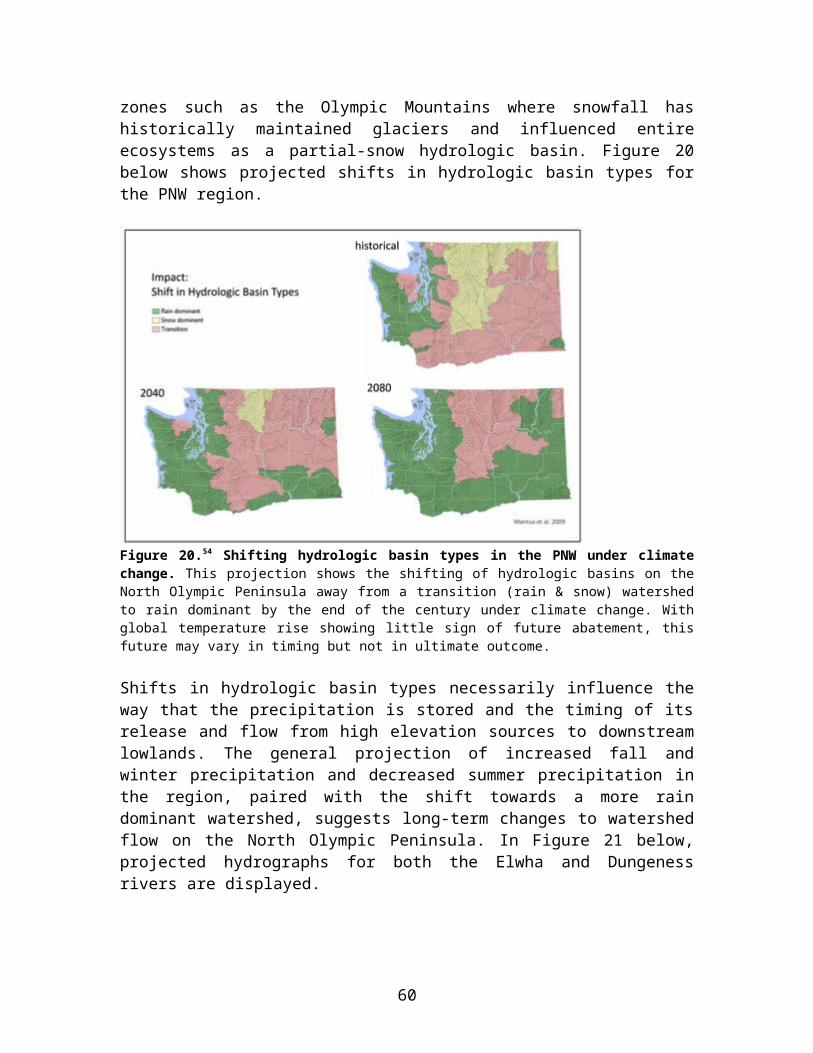
Vulnerability Ranking Descriptions:
Wild Salmon: Juvenile salmon have a critical 2-3 month survival period in nearshore habitat, during which they can be impacted by elevated water temperature, low oxygen and predation. Under climate change, salmon may have to face: low water levels and and changes in run timing. Hatcheries may face depleted oxygen and may need to move to higher flow sites or artificially oxygenate their water supply. There is also potential for increased plankton blooms and challenges to wild salmon food sources. Existing compacting issues include the mining of sand and gravel deposits near streams (which allow recharge.) At a hatchery at Low Creek (need to confirm location) they are already pumping ground water and filtering for use in their facility instead of using streamflow, owing to poor seasonal water quality. For adaptation, Hatchery and Wild stocks have a certain degree of innate plasticity as colonizer fish but are also already meeting existing critical thresholds in some areas.
Nearshore Environment-natural context: Historically these areas have been affected by ocean chemistry, temperatures, dissolved oxygen, dinoflaggelate blooms, and alterationto Strait of Juan de Fuca circulation. Could be impacted under climate change by amount and timing of freshwater inputs, erosion, sediment transport, improving environments for invasives gaining footholds. Other influential factors include runoff from non-point pollution sources, armoring, lack of riparian habitat. Conservation practices can help with adaptation in this environment, it is also influenced by sediment transport, and organisms in tidal zones have some adaptive capacity with shifting tidelines.
Wild/commercial shellfish stocks: In wild/seeded beds seeing a lack of recruitment for pacific oyster (non-native), native hood canal oysters doing a little better in their habitat niche, Geoducks are also showing some resiliency to the current changing climate conditions but all are facing high temperatures and algae blooms. Failures at hatcheries=failure of seed stocks. It is expected that for the foreseeable future failures at hatcheries will continue. Hood canal oysters can deal with anoxic, high freshwater input environments, hatcheries are already facing the continuous treatment of water inputs and outputs to their plants. For adaptation, wild/seeded stock may have some plasticity, and ability to select species for survival, non-native types seem to have more efficient metabolism, but takes many years to acquire strains. Olympia oysters in estuary may have historically seen high pHs but have a narrow preference for habitat and pacific oysters (non-native) are already highly dominant. Geoduck are all from native stock and have more efficient metabolism
Nearshore environment-urban context: Historically, these areas have been affected by ocean chemistry, temperatures, dissolved oxygen, dinoflaggelate blooms, and alteration
High Vulnerability
60

to strait mixing zones. Could be impacted under climate change by amount and timing of freshwater inputs, erosion, sediment transport, and improving environments for invasives gaining foothold. Other influential factors include runoff from non-point source pollution, armoring, lack of riparian habitat. Conservation practices can help with adaptation in this environment, it is also influenced by sediment transport, organisms in tidal zones have some adaptive capacity with shifting tidelines.
Food chain base (fish, insects, plankton): Relevant changing climate conditions include warmer air and water, changing chemical composition of water, flow regimes, increased turbidity scouring, erosion issues, population/development, water usage, herbicides, fertilizers, sea level rise, summer droughts, declining snow pack. Currently, upwelling brings nutrients and changes PH (plankton vulnerable to higher acidity), drought has impacted fish die off of salmon and migrators in the past; flooding, scouring of Redds; turbidity can impact forage fish and salmon; erosion; debris flow – scours system, which impacts insects, freshwater plankton, forage fish; insects – have been impacts on snowfly; sea level rise may impact range; timing for salmon runs and waterflow regime – can also impact forage fish; temperature impact on insects; acidification; plankton; algal and fungus blooms impact O2 which kill juveniles and forage fish. Pesticides/herbicides/fertilizers; water demand; microplastics impact on forage fish and plankton. Relevant to adaptation there is quick evolution for insects; some are migratory/mobile; some flexibility in what they eat (plankton types for forage fish); some salmonids evolve fast; near shore restoration/protection can help adaptation; could introduce calcium or nutrients; create conditions that allow us to have functional foodweb.
Amphibians: Climate change could introduce issues of droughts and high flows of water; humidity or moisture levels; microclimate changes; overall air and water temp; pH; changing water chemistry such as dissolved O2; habitat migration. Droughts have already been harmful, habitat loss due to floods and erosion; predatory/prey abundance or loss; temperature and water chemistry fluctuations in the past. Climate change could also increase invasive species which could displace or increase predators or competition; loss of food web species; loss or increase of habitat; drought / reproductive issues; susceptibility to diseases. Confounding issues include development that displaces habitat; toxins from pollution, herbicides, etc; invasive species; plastics. Adaptation will depend on evolution or genetic diversity, mobility, humans, but need education and political policy and will to drive action; could also consider assisted migration.
Sea and shorebirds; Potential climate change issues include: changing water temperature (which impacts food sources, and can cause algae bloom which killed off surf scoters previously) and quality and storm intensity and frequency, seasonal shift. These bird move and feed with the ocean’s and shoreline’s climate and food sources. As climate changes & ocean acidity increases the birds are pressured to adjust their feeding patterns and migration routes. Relocation of feeding flyways will cause reduced success in finding food and increase competition with resident species. Climate change shifts
61

and disrupts a natural timetable for migration and feeding patterns. Changing sea levels will modify and in some instances eradicate breeding grounds that are at, or near, sea level. Flooding of nesting areas can destroy nests and/or increase exposure to predators. Other relevant issues include over fishing, which traps fish-eating birds and also reduces their access to forage fish. Increased development of shorelines for business, industry, and homebuilding reduces the space available for the birds to feed, rest, and nest. Forage fish declines due to over harvest, plus water contamination also adversely impact birds. In adaptation, these birds can fly and adapt diets, but more bound to flyways that are water related; they will always need food and safe nesting areas.
Waterfowl: Climate change influence to this group could include: water flow volume, temperature, storms and storm surge. Storm intensity and frequency disrupt nesting. Waterfowl are habituated to specific nesting locations and earlier more intense weather shifts under climate change could devastate breeding if young are in nests or unable to swim and feed themselves. Storm and rising water can disrupt migration, and feeding between wintering site and breeding/nesting grounds. For adaptation, this group can fly and swim, but need adequate safe water, marshlands to feed and nest as well as open flyways and air quality.
Clallam low elevation forests-Natural regeneration; The group differentiated between naturally regenerated forests and managed forests since impacts such as drought and fire are more severe in wilderness versus managed, working forests. No forests are highly adaptable due to the slow life cycle of dominant tree species. The Clallam low elevation forests are susceptible to drought, fire and heat stress.
Chimacum Agriculture: The Chimacum valley has very little water available for agriculture during the growing season, making it sensitive to drought and heat stress. There are adaptive measures that could mitigate some of this risk, but currently the basin has extremely limited restrictions to new water use by Dept. of Ecology, making it poorly adaptable at this time. The region is vulnerable to flooding, but has a historical precedence of seasonal flooding that is tolerated by current agricultural soils and cropping systems, reducing the vulnerability. This is Jefferson County’s most productive farmland and highly valued for the community benefits it provides.
Nearshore environment-estuary context: Historically, these areas have been affected by ocean chemistry, temperatures, dissolved oxygen, dinoflaggelate blooms, alteration to strait mixing zones. Could be impacted under climate change by amount and timing of freshwater inputs, erosion, sediment transport, and improving environments for invasives gaining foothold. Other influential factors include runoff from non-point pollution sources, armoring, and lack of riparian habitat. Conservation practices can help
Medium-High Vulnerability
62
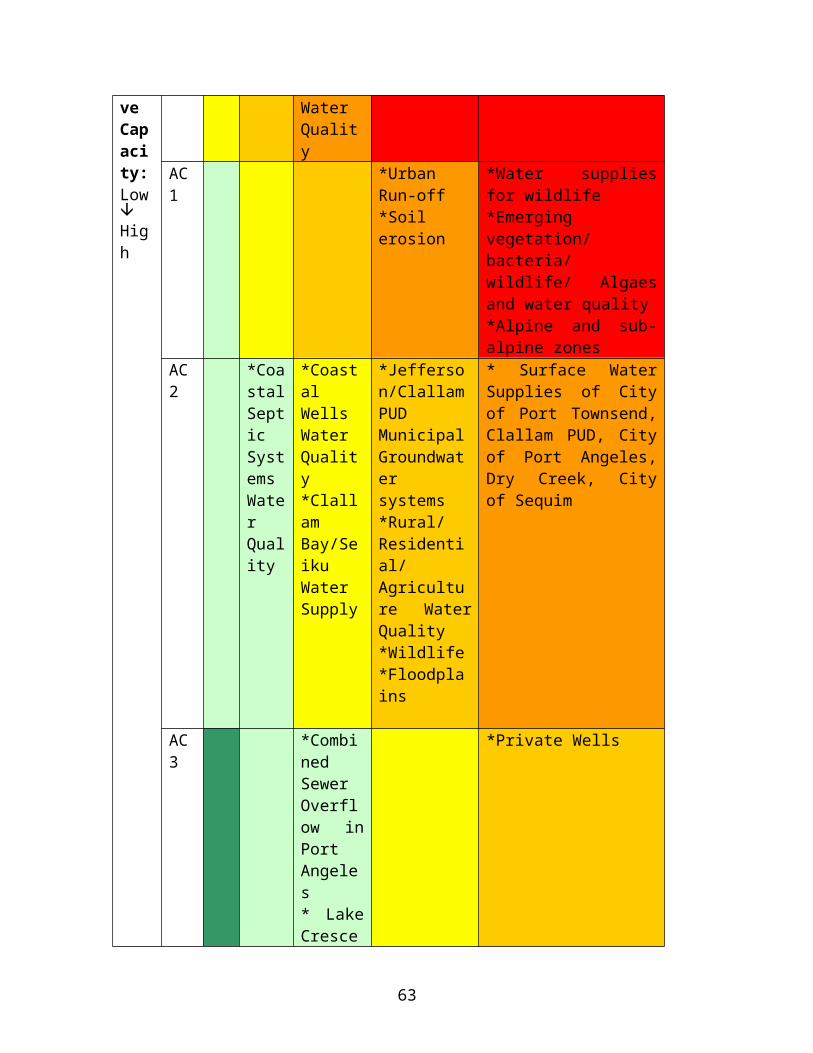
with adaptation in this environment, it is also influenced by sediment transport, and organisms in tidal zones have some adaptive capacity with shifting tidelines.
Marine and Freshwater Fish: Relevant changing climate conditions include ocean acidification; sea level rise; amount of cover available; flow regimes and timing; temperature and sediment changes. Currently, drought periods cause die offs of freshwater fish, in high water get die off of freshwater fish; warmer temperatures causelow dissolved O2, high stress and food web impacts; sedimentation causeschanges in vision/breathing (impacted salmon in the past). With ocean acidification, marine and anadronomous fish like salmon will see changes to food supply. The estuary availability with change with sea level rise. Other climate change impacts include: the ability to go upstream due to low flows, availability of cover, food and 02; and floodingcausing changes to cover (if wood leaves the system), scouring of beds and redds and impacts to food. Confounding issues includes marine debris and microplastics, multiple pollutant pathways, stormwater, pesticides, insecticides, habitat loss, shoreline armoring, channel simplification, habitat structures. For adaptation, there is mobility within the aquatic system, some memory of adaptability, some ability to change food source; need some habitat diversity and refuge (food, cover, etc.) for the transition.
Marine mammals: Climate change can influence water temperature and clarity; ocean acidification; extreme precipitation; drought. Food sources like salmon could be impacted due to climate factors and reduced food supply. Also could see increased runoff w/ pollutants. Food chain decreases due to climate change. Currently, toxins in food chain impact immune system; sonar issues and boats, have seen food chain impacts; water temperature and clarity. For adaptation, can move to new areas; endangered species protections; existing restoration projects; fishing regulations. Need to maintain good conditions for food chains; control toxics (sea debris and runoff); and ensure food chain preservation.
SouthEast Jefferson Co. Forests: The forests in this area are vulnerable to many of the same threats as in other areas (drought, heat stress, fire, pest pressure) and are equally slow in adapting due to the long life of dominant species. However, this region receives more rain than the more northern rain shadow regions, likely providing it more buffering to stressors. Managed forests will also be able to replant with species that are better adapted to expected increases in temperatures and develop/ use other management techniques to help mitigate climate change.
High elevation forests - natural regeneration: These forests are susceptible to increased risk of drought, heat stress, pest pressure and fire in an already inhospitable environment. Thin soils and slow growth make these forests especially vulnerable, and species are slow to adapt due to their long life cycles. However, these ecosystems are
Medium Vulnerability
63

somewhat acclimated to harsh conditions and experience cooler temperatures in the heat of summer, providing them some potential resilience.
Shellfish hatchery: Hatchery closest to ocean and upwelling is the highest hit by Ocean Acidification, and seeing extreme variation in water chemistry. Source water can be extremely hypoxic. When shellfish are moving from eggs to larva 80-90% of their weight is shell. In wild/seeded beds seeing a lack of recruitment for pacific oyster (non-native), native hood canal oysters doing a little better in their habitat niche, Geoducks are also showing some resiliency but all are facing high temperatures and algae blooms. Failures at hatcheries=failure of seed stocks. It is expected that for the foreseeable future failures at hatcheries will continue. Hood canal oysters can deal with anoxic, high freshwater input environments, hatcheries are already facing the continuous treatment of water inputs and outputs to their plants. For adaptation, hatcheries can treat water, hang matrixes of algae and shellfish to improve water quality, with enough money lots of technology to access. Wild/Seeded stock may have some plasticity, and ability to select species for survival, non-native types seem to have more efficient metabolism, but takes many years to acquire strains. Olympia oysters in estuaries may have historically seen high pHs but have a narrow preference for habitat and pacific oysters (non-native) are already highly dominant. Geoduck are all from native stock and have more efficient metabolism.
Raptors: Under climate change could see change in nesting location, territorial range, migration routes and migration food sources. They could also see alteration of seasonal timing of nesting, and reduced food sources for feeding young. This could mean increased stress on adult birds to find food and feed young. Also, currently seeing habitat shrinkage, decline in some food source species of birds, animals, and fish. Changing food sources are a concern, migratory pressures change. For adaptation, they do have ability to fly and hunt, and can change prey base. Need to ensure stability to habitat and food source and migratory routes.
Songbirds: Climate change could influence seasonal shifts, changes to food sources, migratory pressures change; change to water flow volume, temperature, storms and storm surge. Could see adjusted migration and breeding schedules and migration routes. Warmer climates produce greater varieties of insects and food grains/berries. Birds depend on climate conditions and temperatures to produce vegetation, which feeds them or shelters the insects they eat. Trees leafing out too early or too late for migrating birds could expose nests to predators, both aerial and terrestrial. As birds are forced to fly further north to find right breeding conditions territorial competitions could develop between resident and migratory species. Confounding issues include tall buildings/structures built in migratory flyways, many with lights that disorientate birds. Migratory songbirds fly at night to avoid heat and predators. As humans light the night, the birds are threatened. In adaptation, these birds can fly and adapt diets. Need safe areas to fly and appropriate habitat and food sources.
64
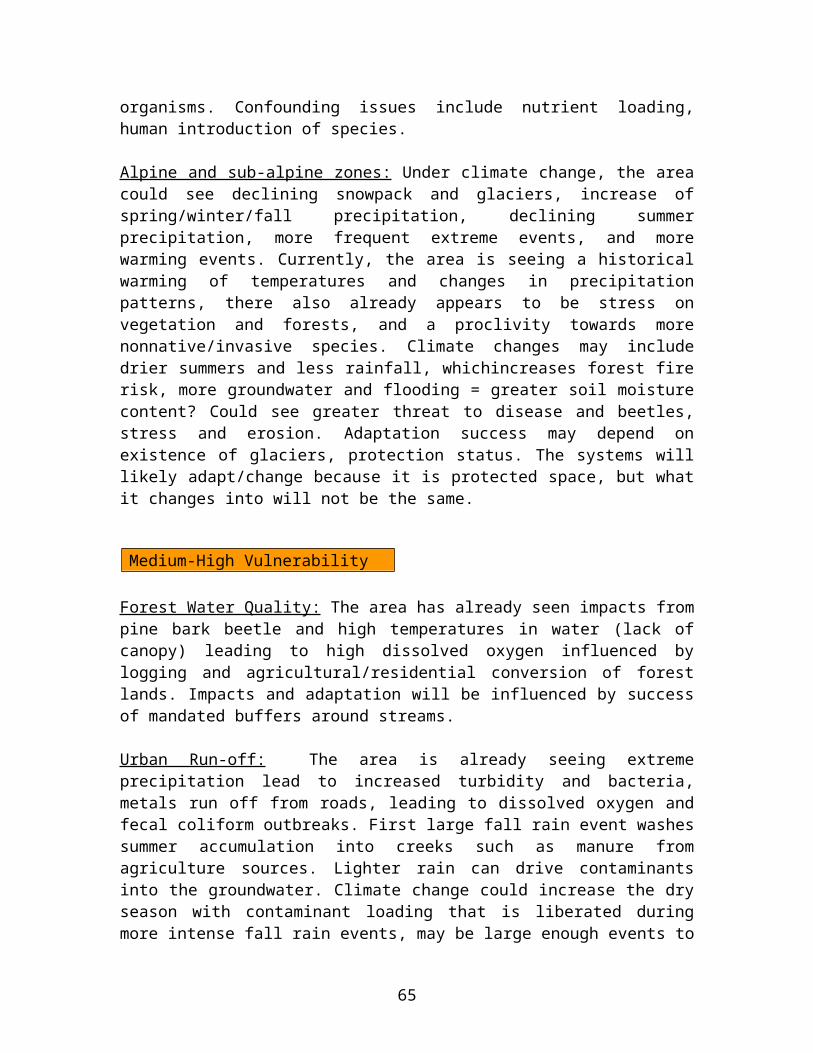
Salmon hatchery: Juvenile salmon have a critical 2-3 month survival period in nearshore habitat, which can be depleted by temperatures, hypoxia, low oxygen and is extremely predatory. Under climate change salmon may have to face low water levels and the stress of staging, run timing could change, hatcheries may face depleted oxygen and need to move to higher flow sites. There is also potential for increased plankton blooms and challenges to wild salmon feed source. Existing compacting impacts include water quality issues (see Wild salmon). For adaptation, Hatchery and Wild stocks have a certain degree of innate plasticity as colonizer fish but are also already meeting existing critical thresholds in some areas.
Small land mammals: Relevant climate change conditions include temperature, snowpack, wildfire and drought. Less snowpack can mean less insulation for marmots, more rain can flood burrows, the subalpine may dry out without snowpack, and wildfire can displacesmall mammals. Other impacts could include: less vegetation with drought, or maybe new vegetation; emerging other animal migrants; predators like coyotes may get into the high country quicker and can kill off young; availability of food may change due to drought; migration patterns may change; and wildfire. Currently impacted by humans/forest harvesting/invasive species. In adaptation, large mammals have more flexibility in their food source and more mobility than small mammals. Need to preserve and maintain wildlife corridors and healthy ecosystem in general.
Wetlands: Natural wetlands are subject to change with the climate due to changes in precipitation patterns, which could potentially dry up wetlands seasonally or year-round in conditions of drought and increased evaporation during dry summer months. Conversely, they could expand due to increased precipitation during wet months. The function and nature of wetlands is to absorb and hold water, providing them some resilience by design.
Dungeness Agriculture: The Dungeness region has some of the finest agricultural soils on the Olympic Peninsula and water rights that support vibrant agriculture. These conditions also make the area attractive to development, and with the potential for increased development pressure due to climate migration, land conversion puts agriculture in the Dungeness at risk. The area is also low-lying and subject to increased flood risk and potential sea level rise or storm surge. As there is much open space and farmland is well suited to absorbing seasonal fluctuations in precipitation, and since agriculture is highly adaptable due to annual cropping cycles, this region is considered at a low risk.
Quilcene Agriculture: Similar to the Dungeness above, the Quilcene agricultural area, located primarily around the Little Quilcene fork, is fairly adaptable to expected impacts
Medium-Low Vulnerability
Low Vulnerability
65
of climate change. Agriculture is able to adjust better than many industrial sectors due to annual cropping cycles and having open space to act as a sponge for erratic and increased precipitation. This region also has strong water rights and volume that will buffer it from the impacts of drought and heat stress. A dramatic drop in volume in the river would impact water availability over time.
Salmon aquaculture: Under climate change, hatcheries may face depleted oxygen and need to move to higher flow sites. Also potential for increased plankton blooms and challenge to wild salmon feed source. In adaptation, aquaculture has capacity for selection of species strain, changing dissolved oxygen (though both may have difficulty with rate of change). Feed technologies are improving, feed conversion ratios are generally improving, and Australia is able to farm in warmer waters.
Large land mammals: Relevant climate change conditions and impacts are the same as for small land mammals, see above. In adaptation, large mammals have more flexibility in their food source and more mobility than small mammals. Need to preserve and maintain wildlife corridors and healthy ecosystems in general.
Clallam low elevation managed forests: These forests are somewhat buffered from risks of drought, fire, pest pressure and heat stress due to greater rainfall and temperatures moderated by proximity to the Strait and coast. Managed systems also allow for practices to mitigate risks, such as planting varieties better suited to heat and drought.
High elevation managed forests: Managed forests offer more resilience as the tools for mitigation increase, though the costliness of employing intensive management may make it impractical. These forests will be sensitive to the same risks as others on the Peninsula: drought, heat stress, risk of fire, pest pressure. And the thin soils and extreme conditions make this ecosystem less resilient than low elevation forests, though adaptive capacity may be increased due to acclimation to harsh conditions.
None identified.
5. CRITICAL INFRASTRUCTURE
a) Relevant Climate Projections
Critical Infrastructure is a focus area aimed generally at topics of: Low-lying Infrastructure; Transportation Corridors and Emergency Management; and Utilities, Sewer & Solid Waste. In addition to the general trends in temperature, precipitation, and ocean conditions described earlier in this report, there are additional climate
Potential Opportunity
66

change impacts specifically relevant to critical infrastructure, including sea level rise and long-term viability of transportation corridors.
Figure 26. Overview for Critical Infrastructure Focus Area including slope stability, transportation corridors, and critical infrastructure buildings such as hospitals, EMS, and Fire stations.
This project involves the creation of region-specific sea level rise projections that take into account vertical land movement from tectonic forces and include mapping of 10-year storm surge maximums. More information on this modeling is located in the Appendix The figures below show sea level rise maps created from two different emissions scenarios and for three locations: Port Townsend, Port Angeles, and Neah Bay.
67
Figure 27: Low Severity Sea Level rise and coastal flood risk map for Port Townsend.
68
Figure 28: High-Severity Sea Level Rise and Coastal Flood Risk map for Port Townsend
69
Figure 29: Low-Severity Sea Level Rise and Coastal Flood Risk map for Port Angeles
70
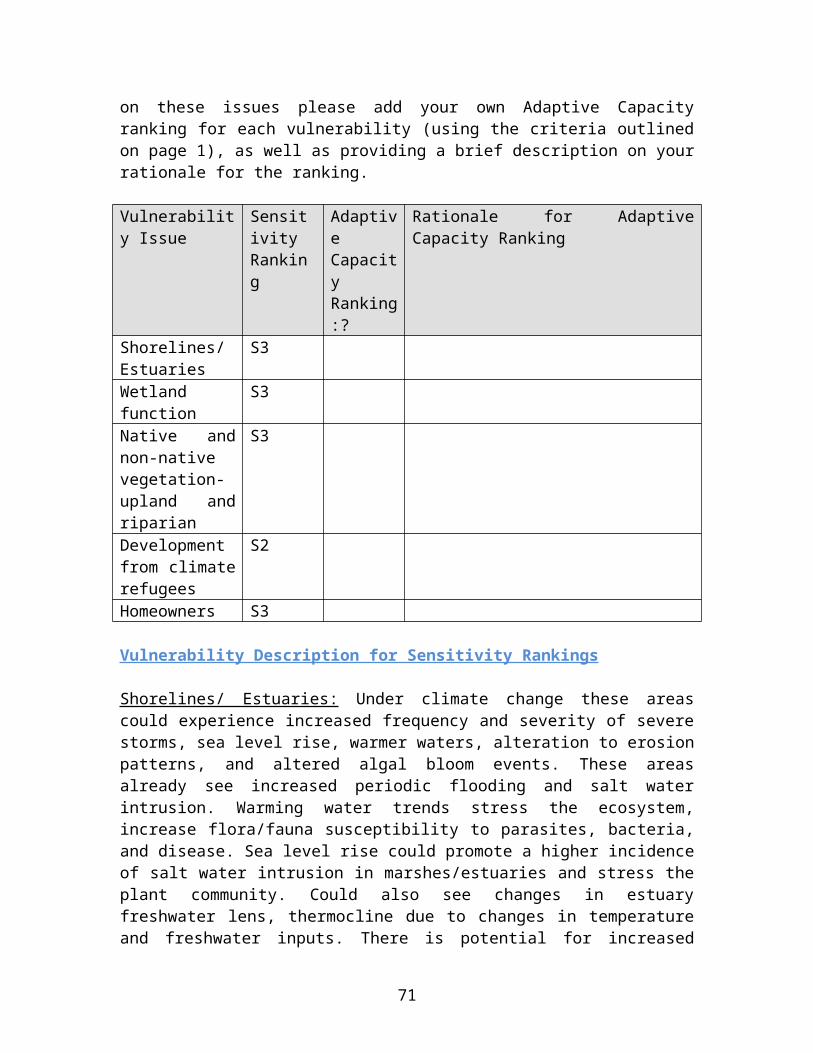
Figure 30: High-Severity Sea Level Rise and Coastal Flood Risk map for Port Angeles
Figure 31: Low-Severity Sea Level Rise and Coastal Flood Risk map for Neah Bay
71

Figure 32: High-Severity Sea Level Rise and Coastal Flood Risk map for Neah Bay
The North Olympic Peninsula is connected to the population centers of Seattle and Tacoma by a small network of highways and the marine ferry system. The Washington Department of Transportation has explored potential climate change impacts to these networks and ranked transportation corridors based on their perceived vulnerability. Figure 33 below displays Olympic Peninsula transportation vulnerabilities to sea level rise and extreme events.
72
Figure 3362. Olympic Peninsula climate change transportation vulnerabilities identified by WA DOT.
Vulnerability findings from Figure 35 above include: “SR 101 between mileposts 165 and 185 is subjected to impacts from creeks and rivers that are aggrading due to increased sedimentation. This is likely to increase as the glaciers and snow fields melt in the mountains. This area is also likely to experience more extreme weather events. SR 101 near Discovery Bay is susceptible to impacts from higher sea levels at 4 and 6 feet. SR 105 would be affected by a 4- and 6-foot sea level rise and flood the road. SR 112 between mileposts 29 and 40 is affected by unstable soils. This would be made worse by more extreme precipitation events that would saturate the soils. SR 116 currently has only a few feet of freeboard. The road is an earthen causeway with culverts at the susceptible points, and sea level increases will flood the road. Flooding the road could lead to roadway instability in addition to closure during high tide events.”63
b) Draft Vulnerabilities and Prioritization Matrix
On November 14th, 2014 a diverse range of stakeholders met in Port Angeles, WA to discuss Climate Change impacts relevant to issues of Critical Infrastructure on the North Olympic Peninsula. This workshop included a review of climate change science, and identification and ranking of regional vulnerabilities. Vulnerabilities were ranked on their “sensitivity” to climate change impacts and their “adaptive capacity” or ability to respond to this change. This ranking is a helpful method for prioritizing climate change adaptation planning across a diverse range of vulnerabilities.
73

Below is the vulnerability ranking table drafted collaboratively by three breakout sessions at the workshop, covering issues of: Low-lying Infrastructure; Transportation Corridors and Emergency Management; Utilities, Sewer & Solid Waste. Each of the ranked vulnerabilities is described in more detail following the table in its given vulnerability category. This detailed information was gathered during workshop discussions of the ranking of each of the vulnerabilities, and includes aspects of both the sensitivity and adaptive capacity discussions.
Table 12. Critical Infrastructure Vulnerability Ranking TableSensitivity: Low HighS0 S1 S2 S3 S4
Adaptive Capacity:LowHigh
AC0 *Clallam Bay/Seiku Sewage Treatment (Short-term)
*Clallam Bay/Seiku Sewage Treatment (Long-term)
*Port of Port Townsend Boat Haven*Port of Port Townsend Point Hudson
AC1 *3 Crabs Road* Downtown Port Townsend, Kah Tai Lagoon area*Roads in Clallam Bay
AC2 *Vacuum Sewer System at Elwha Lowlands*Highway 116*Highway 19/20/Port Townsend Ferry
*Septic Systems*Highway 112* Hoko/Ozette road*Forest Roads for fighting fires
*Clallam Bay/Seiku Sewer System (overall)*Stormwater Outfall Infrastructure*Highway 101
AC3 *Electrical Transmission Infrastructure*Public Warning Systems (All Hazards)
* Clallam / Wheel / Ward / Burlingame bridges*Forest Roads to communication towers*South Jefferson County
*Port Angeles Landfill*Highway 104/ Hood Canal Bridge*Morse Creek and Hot Springs Road* City of P.A. Industrial waterfront, Ediz Hook and Lower Elwha
*Sewer Outfall Infrastructure
AC4
74
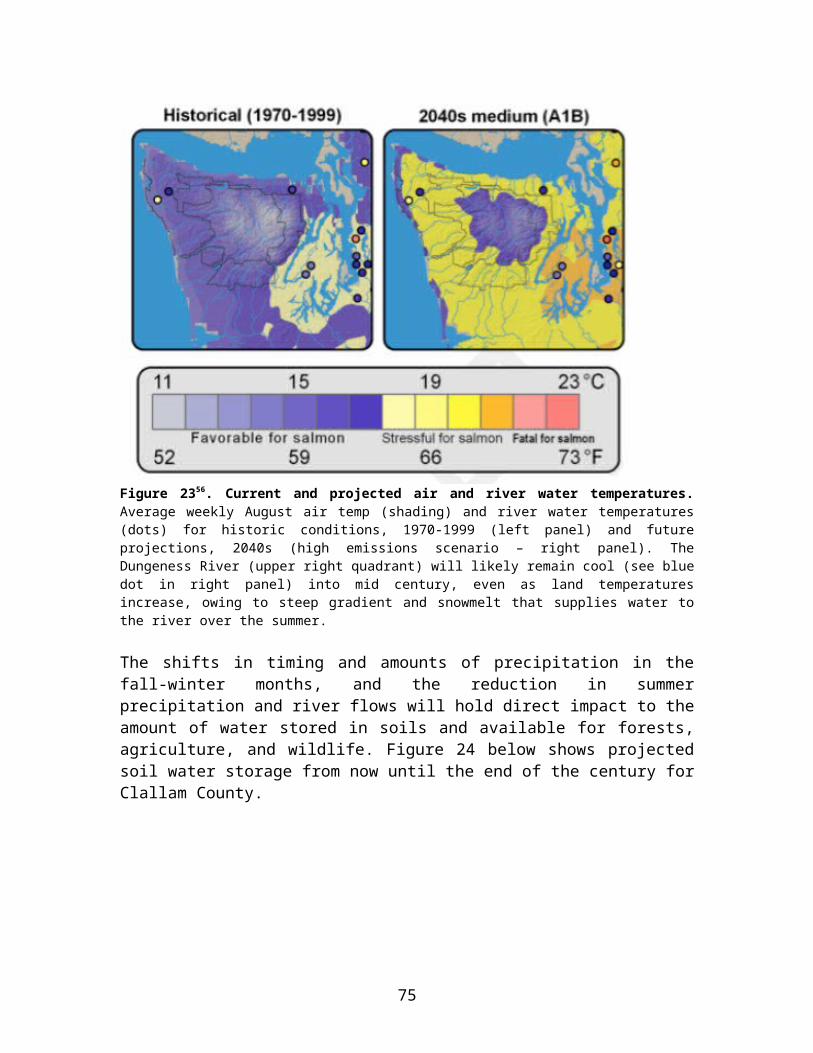
Vulnerability Ranking Descriptions:
Clallam Bay, Seiku sewage treatment (Long-term): Relevant climate change impacts are sea level rise and river flooding. Currently there is existing nuisance flooding during high flow events. Could see erosion or nuisance flooding in sewage treatment infrastructure. Possibly some impact to Clallam Bay sewage treatment plant if river flooding magnitude increases. System is quite old. Currently do have a good manager. Prison nearby may present opportunities for sharing wastewater treatment resources. System could be moved or protected. Protection of surrounding vegetation (forestland) might also protect infrastructure. All of these adaptation options are potentially quite expensive.
Port of Port Townsend Boat Haven: The port is susceptible to climate change’s influence on sea level rise and storm events/ surge. Currently, its stormwater outfall is near maximum water level during storm events. If impact was large enough to cause failure of the tide gate, it could lead to damage to stormwater filter medium and would put the system out of operation. The follow-on impacts could mean the yard permit is threatened (currently supports > 500 jobs). Regarding adaptation, the Port does have some financial capacity, and is a compact and localized system. It also has resourceful tenants and maintenance staff with the skills to address engineering problems. Yet the Port funding base is inadequate for a total system re-build. Need political will to increase port funding. A cost analysis tool that could help the port guide investment decisions would be useful.
Port of Port Townsend Point Hudson: The port is susceptible to climate change’s influence on sea level rise and storm events/surge. The old Coast Guard station buildings on sand spit are not well built and there is currently nuisance flooding during large rainfall events. Additional flooding could be expected due to sea level rise which could compromise buildings even more. Thecurrent jetty is old and failing, and no money is available for upgrades. It is the anchor and protection for downtown (east end) and is failing today. Adaptation capability and options are the same as for Port of Port Townsend Boat Haven above.
Clallam Bay/Seiku Sewage Treatment (short-term): Relevant climate change impacts could come from sea level rise and river flooding. Currently there is existing nuisance flooding during high flow events. Could see erosion or nuisance flooding in sewage treatment infrastructure. Possibly some impact to Clallam Bay sewage treatment plant if river flooding magnitude increases. System is quite old. Currently do have a good
High Vulnerability
Medium-High Vulnerability
75

manager. Prison nearby may present opportunities for sharing wastewater treatment resources? System could be moved or protected. Protection of surrounding vegetation (forestland) might also protect infrastructure. All of these adaptation options are potentially quite expensive.
3 Crabs Road: Could see impact from sea level rise. Road has been there since 1970, was wetlands or shoreline before; has seen localized flooding, about 50 houses located there. Land-use policiesfor the area are also a relevant factor.. For adaptation, could open up historic ponds, make drainage improvements; some work is being done by North Olympic Salmon Coalition, but only at the very end of the road. May not be many adaptation options as surrounding area is all low lying.
Downtown Port Townsend, Kah Tai lagoon area: Could see climate change influence of sea level rise, bluff and beach erosion. Currently seeing erosion of the bluff and beach. Could see potential impacts to existing waste water treatment plant of wastewater outfall. There is a general lack of money for wastewater infrastructure upgrades, only have a small income/tax stream. Kah Tai lagoon is largely an undeveloped park. In the short-term, downtown Port Townsend probably would need some money for a new water removal system, for when the underground is flooded. In the long-term adaptation the underground would likely need to be filled in to protect existing buildings. Also, utilities might need to be elevated.
Roads in Clallam Bay: Under climate change, could see increased flood magnitude in the Clallam River. Currently see minor flooding of homes. Flooding could block road that leads to sheriff headquarters at Slip Point. There are potential impacts to two bridges that cross the river, the river mouth position influences how the river floods, if the river mouth is unobstructed the river doesn’t flood. Relevant to adaptation, Wheel bridge could be raised or modified to clear log jams. Two other bridges could be possibly raised. Maybe modification of the river mouth? Generally, river mouth modifications are frowned upon. Wheel bridge is part of the DNR bridge upgrade plan, which might present opportunities. (Wheel bridge and other bridges were also covered below as part of a different breakout group.)
Clallam Bay/Seiku Sewer System (overall): Clallam system has existing exposure in its outflow pipe (river flooding risk) and the plant itself, existing leaky pipes have inputs from ground water causing treatment levels at capacity. Seiku has a middle point pump station that is low-lying and has been previously overloaded (serves 100 people). For adaptation, Clallam Bay could pump sewage up to the prison treatment plant. Around 1000-1200 people are served by this system. Need to either: rebuild two plants, interconnect two plants, or build a pump station to the prison. System serves economically distressed community so may have adaptation funds available, half of funding is potentially available but need 10 million total for construction (feeling hopeful within 5 years will get money).
76

Stormwater Outfall Infrastructure: Stormwater system has diversified inputs and outputs, historically outfalls were not below high tide line but that could shift, causing pushback up the pipe depending on head pressure, in Port Angeles it is near Coho ferry terminal. Currently the pump stations in Port Townsend are at flooding risk as they are 1 to 2 ft above sea level, if stations at the 3ft level were compromised would impact 1/3 of Port Townsend. For adaptation, choices are: increase pipe diameters, segment system, use upland storage (Port Angeles is building this), or pump outflow. There is existing flooding of streets when storms occur with high tides. Could pump sewer outflow, would be cheaper than building a plant. Wastewater pumping would be much more difficult because of the diverse inputs/outputs of the system. Large scale precipitation events are currently not treated, the water is assumed to be clean enough. Rain gardens are not a permanent fix, they also take rebuilding after they are used up.
Highway 101: Under climate change the highway could see sea level rise, landslides, river flooding, landslides and culverts. Could see increased flooding during storm surge with sea level rise; increased river flooding, increased landslides due to heavy precipitation; road physically moved due to landslides; section by Discovery Bay is defined by WSDOT as susceptible to impacts at sea level rise of 4’ and 6’ (sections of 101 are moderate or high impact in WSDOT study). This corridor is a critical access to large parts of the North Olympic Peninsula, with no transportation backups. Adaptation could center around culvert alteration or replacement, slope stabilization efforts, funding is a high priority; one supporting factor is the fact that the highway is identified as moderate/high vulnerability in WSDOT assessment. Likely need a feasibility study conducted for Discovery Bay in the longer term, implementation could still be quite difficult.
Septic Systems: Currently, groundwater table can rise and flood out drain fields, need mounding when you do not have adequately draining soil. There are permanently high water tables close to beaches, existing issues at Brinnon-Quilcene, Golden Sands. Beckett Point got neighborhood together to grind and pump waste up to a community drain field. Adaptation options include: re-engineering individual septics, re-engineering neighborhood septics (easy with enough money). Political climate is tough for managing individual’s rights when it comes to their systems. Regulators can use dye tests to show homeowners when a system is failing, have a program for homeowners to conduct their own inspections.
Highway 112: Climate change could impact the highway through sea level rise, landslides, river flooding, culvert damage. Could see increased flooding during storm surge with Sea Level Rise (SLR); increased river flooding, increased landslides due to heavy precipitation; road could physically move due to landslides; treefalls could restrict access; road is used for correction center access; 112 is ranked as moderate to high impact in WSDOT study. Confounding existing issues include the funding available for
Medium Vulnerability
77
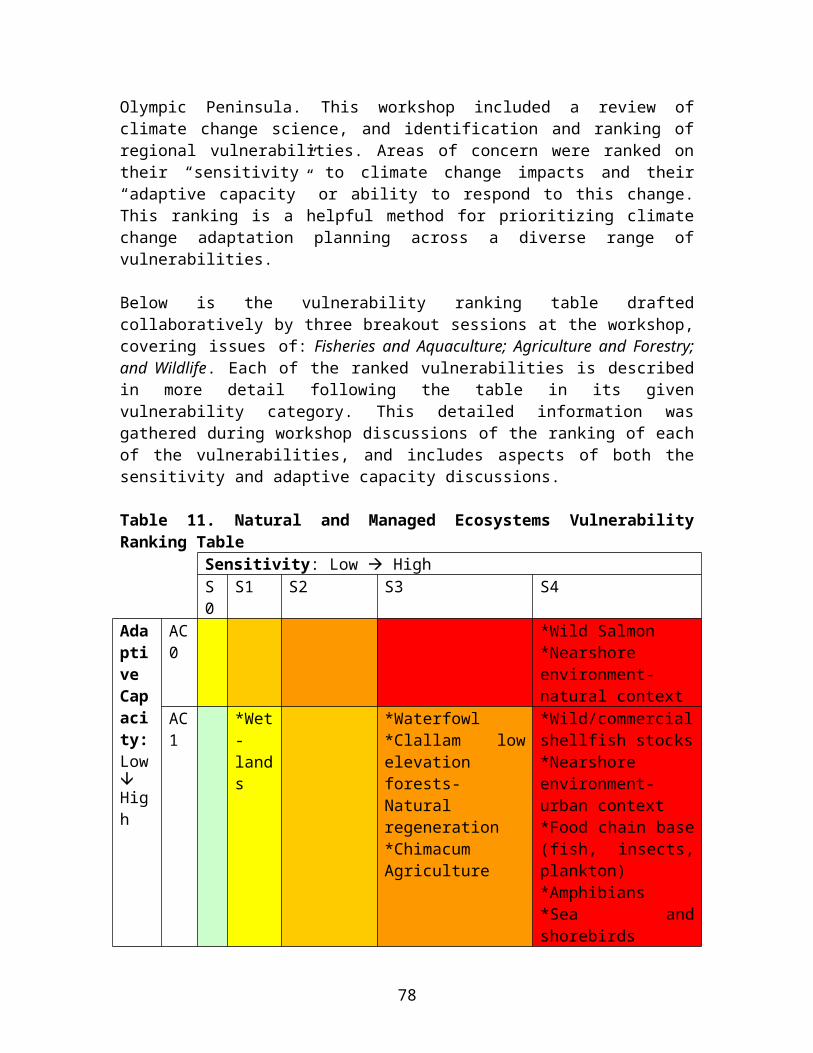
maintenance and land use planning policies. Relevant to adaptation, there currently exists a management process for short term closures and repairs; also there is a current work policy for replacing culverts; identified as moderate/high vulnerability in WSDOT assessment. Could move the highway; replace the culverts; riprap shoreline edge; prevent future landslides by diverting water.
Hoko/Ozette road: Climate change influence would center around changes to river flows, as road is already affected by scour and there have been road failure issues in the past. Confounding existing issues include logging and land use policies; it is only one road in for 50 homes plus the park. For adaptation, could continue maintenance, seek out money to move road if needed. Would likely need a lot of advanced planning; there may be limited options to move, finding funding could be challenging.
Forest Roads for fighting fires: Roads could be impacted under climate change by temperature increase, drought, wind and insects. Higher temperatures, longer dry periods, wind potential (impacts helicopters usage for fighting fires). There is fuel already on the ground and will likely get worse; also seeing decommissioning of forest roads; lack of culvert replacement. For adaptation to fire risk, could make sure fire fighters have access via keys, etc.; roads need to be maintained; policy changes by Olympic National Park to fight fires.
Sewer Outfall Infrastructure: Sewer treatment is concentrated at one source. In Port Angeles, Hill Street/Marine Drive serving west Port Angeles is currently inundated at high water. Stormwater system has more diversified inputs and outputs. Currently the pump stations in Port Townsend are at flooding risk as they are 1 to 2 ft above sea level, if stations at the 3ft level were compromised would impact 1/3 of Port Townsend. For adaptation, choices are: increase pipe diameters, segment system, use upland storage (Port Angeles is building this), or pump outflow. Could pump sewer outflow, would be cheaper than building a plant.
Vacuum Sewer System at Elwha Lowlands: Exposure to climate change could center around questions of if the groundwater table may rise (owing to dam removal) or if flood plain may change, could be inundation of low lying vacuum chambers/ pump stations, may be currently engineered for 100 year events. For adaptation, location in lowlands means moving system uphill is probably central option, tribe has upland options.
Highway 116: Under climate change, could experience sea level rise for 1 mile section. Culverts have been identified as moderate vulnerability in WSDOT assessment. Could replace with bridge or higher causeway, which would not be horribly expensive but priority may be less. Could see increased flooding during storm surge with sea level rise
Medium-Low Vulnerability
78

(moderate impact in WSDOT study – “SR 116 currently has only a few feet of freeboard.”). It impacts access to Marrowstone Island.
Highway 19/20/Port Townsend Ferry: Under climate change could see landslide and sea level rise. It was identified as a moderate impact in WSDOT study. While ferry dock itself is less vulnerable, one can’t leave the ferry without getting on Hwy 20 which may be impacted by sea level rise; ferry is also a backup for the Hood Canal Bridge. Relevant to adaptation, have culverts and drainage and existing maintenance process; connection to ferry gives higher priority; plus access to Port Townsend Water St retail; identified as moderate vulnerability in WSDOT assessment. Could conduct a feasibility study; may need to relocate ferry terminal; implementation could be difficult.
Port Angeles Landfill: Landfill is seeing ongoing remediation (relocation of waste 100-200yds past erosion zone) and is engineered for 50-100 years. Bank directly west was armored and may be creating embayment at erosion site, eroded at 1ft/yr historically and now eroding at 2-3ft/yr. Regarding adaptation, there is ongoing remediation efforts, if embayment is created by erosion in area the wave energy could be diminished. The armoring to the west is protecting that bluff but may cause erosion in other areas.
Highway 104/ Hood Canal Bridge: Climate change impact could come with Sea level rise. Currently see short term closures. Per WSDOT study, a 6’ SLR results in high impact scenario. Have existing process for short term closures; bridge designed to accommodate certain level of floods; existing WSDOT study ranks it as a high priority. Could redesign for higher sea level rise; depends on life cycle; takes advanced planning; toll option for funding. Critical access to the North Olympic Peninsula; life of bridge is 75 years so may be replaced then anyway.
Morse Creek and Hot Springs Road: Changing river flows would be the central impact of climate change, already sees scouring from river. Bridges can fail due to river flows. It is currently old bridge technology; very limited number of houses; except Morse Creek provides critical access from Port Angeles to the west; Hot Springs Rd is also critical access. Regarding adaptation, there is a scour program to inspect annually; existing processes include deflectors, etc.; identified as moderate vulnerability in WSDOT assessment. Need planning and investment and studies.
City of Port Angeles Industrial waterfront, Ediz Hook and Lower Elwha: Would see climate change impact from coastal flooding, sea level rise, changing wind patterns or storm magnitude. Currently see landfill bluff erosion, damage and flooding on trail east of Port Angeles, Tumwater Creek flooding, levee erosion on the Elwha, Ediz Hook armoring. Could see increased frequency and duration of coastal flooding, potential storm impacts due to change in wind DIRECTION, utility impacts (i.e. exposed power poles on Ediz Hook), wastewater treatment at the Nippon mill and possibly the City of Port Angeles site? Impacts to fuel storage near Nippon mill? Need funding for infrastructure upgrades. Existing infrastructure tends to be old and in poor condition,
79

earthquake/tsunami hazard is recognized but generally not adapted to. For adaptation, local government policies and practices can potentially address some issues. Ediz Hook is managed in part at the federal level, so some local state and federal money resources. There is space for relocation of some infrastructure. Need money, updates to policies and practices, plans and regulations, along with education and outreach to local population to build political will.
Clallam / Wheel / Ward / Burlingame bridges: Changing riverflows would be the central impact of climate change, already sees scouring from river. Bridges can fail due to river flows. It is currently old bridge technology; very limited number of houses. Regarding adaptation, there is a scour program to inspect annually; existing processes include deflectors, etc.; identified as moderate vulnerability in WSDOT assessment. Need planning and investment and studies.
Forest Roads to communication towers: Under climate change could see fire and extreme events causing washout. Currently have roads there but often blocked and not maintained, downed trees and erosion. There is Illegal dumping blocking roads; fuel already on ground and will get worse; decommissioning of forest roads; lack of culvert replacement. Need to complete inventory of all towers and roads that access them, along with commitment to road maintenance and funding.
South Jefferson County: Under climate change could see increasing flood risk due to precipitation. Storm surge and winds knocked out Hood Canal Bridge (see Hood Canal Bridge summary above). Currently, flooding leads to contamination of wastewater systems. Also see seawater intrusion into residential and community wells. Need better land planning and management.
Electrical Transmission Infrastructure: Some vaults are currently inundated, transformers in neighborhoods are sometimes in standing water, Port Townsend downtown deals with this. Potential risk to transmission lines in wildfire risk zones. For adaptation, can mitigate wildfire risk by brush control (fuel management), not known how dangerous water in vaults is? Need to pump out?
Public Warning Systems (for tsunamis and otherhazards): System could see impact from sea level rise. Currently see some saltwater intrusion into electronics (AHAB tsunami sys), could expect more of same. Adaptation could include armoring for systems and/or a move to higher ground.
Low Vulnerability
Potential Opportunity
80
D. Prioritizing Vulnerabilities and Adaptation Planning
1. Workshop Participant Review; Ongoing Data Gathering
At the end of each workshop the week of November 10th-14th, notes were collected from the project team leaders concerning each breakout session vulnerability discussion and sensitivity and adaptive capacity rankings. These notes were collated and vulnerability issues were placed on a vulnerability matrix for each workshop. These summaries were sent electronically to workshop participants, who were asked to review the information with two questions in mind:
1. Do you feel the vulnerabilities and their rankings in the matrix adequately address issues of Water Resources and climate change in the region? And if not, how would you amend and/or rank vulnerabilities differently and what would be the outcome of that change?
2. In the detailed descriptions of each vulnerability, were the main points from your discussion group captured? What other information needs to be amended or altered, or what are relevant outstanding questions that require resolution?
Participants were also given an opportunity to provide feedback on other Climate Change issues potentially not covered in the workshops.
The project team will follow up on this commenting with additional data gathering from workshop participants and other subject matter experts. This information will be used to decide which vulnerabilities will be treated in the project’s next steps, which include:
A prioritization of highly vulnerable resources, locations, or systems; A prioritized set of adaptation strategies and actions based on climate science
and the knowledge of local stakeholders;
81

E. Appendix
1. Glossary
Climate systemThe climate system is the highly complex system consisting of five major components: the atmosphere, the hydrosphere, the cryosphere, the lithosphere, and the biosphere, and the interactions among them. The climate system evolves in time under the influence of its own internal dynamics and because of external forcings such as volcanic eruptions, solar variations, and anthropogenic forcings such as the changing composition of the atmosphere and land use changes.
Human systemAny system in which human organizations and institutions play a major role. Often, but not always, the term is synonymous with society or social system. Systems such as agricultural systems, political systems, technological systems, and economic systems are all considered human systems for the purposes of this project.
Natural systemA natural system is a stable interacting compilation of non-man-made biological and/or physical entities. Examples of natural systems at risk to climate change include: dominant biomes (plants and wildlife), glaciers, coral reefs and atolls, mangroves, boreal and tropical forests, polar and alpine ecosystems, prairie wetlands, and remnant native grasslands.
VulnerabilityThe propensity or predisposition to be adversely affected. Vulnerability encompasses a variety of concepts including sensitivity or susceptibility to harm and lack of capacity to cope and adapt.64
82

2. GIS Mapping and Analysis
This section summarizes the data sources, processes, and methods used to develop GIS mapping and analysis for the NOPRCD Climate Change Vulnerability Assessment and Adaptation Plan. All GIS data and maps developed as part of this project will be provided to NOPRCD and its governmental and tribal partners for future reference and use.
Data Sources The GIS data used in this project was acquired from a number of federal, state, and local sources. Only published and verified data sources were selected. An abbreviated list of the most essential GIS data layers, as well as their sources, are provided in Table X.X. For a complete list, refer to Appendix X.X.
Table A. GIS Layers and Sources
GIS Layers Source
Aerial Orthoimagery (Overview Maps)
United States Department of Agriculture (USDA) National Agriculture Imagery Program (NAIP) 2013 (1 meter resolution), http://www.fsa.usda.gov/FSA/apfoapp?area=home&subject=prog&topic=nai
Aerial Orthoimagery(Sea Level Rise Scenarios)
United States Geological Survey (USGS) 2009(1 foot resolution), http://nationalmap.gov/
Hydrography, Clallum CountyUSGS National Hydrography Dataset (NHD), http://nhd.usgs.gov/; Clallum County GIS, http://www.clallam.net/maps/mapdata.html
Hydrography, Jefferson County USGS NHD; Washington State Geospatial Portal (WSGP), http://geography.wa.gov/
Transportation, Clallum County Clallum County GIS, http://www.clallam.net/maps/mapdata.html
Transportation, Jefferson CountyJefferson County GIS, http://www.co.jefferson.wa.us/idms/shapefiles.shtml
Critical Infrastructure, Clallum County Clallum County GIS; WSGP
Critical Infrastructure, Jefferson County Jefferson County GIS; WSGP
LIDAR DEM, Port Townsend Puget Sound LIDAR Consortium (PSLC), http://pugetsoundlidar.ess.washington.edu/
LIDAR DEM, Port Angeles PSLC
LIDAR DEM, Neah Bay United States Army Corp of Engineers (USACE),http://coast.noaa.gov/
83

Data Processing and Mapping Once obtained, procedures to assure quality and comparability were applied to all GIS data. This included an assessment of overall alignment of spatial data and existence and accuracy of metadata by Adaptation International staff, as well as the use of a standard horizontal (NAD 1983 HARN, US Feet) and vertical datum (NAVD 88, US Feet). For this project, all data were projected using NAD 1983 HARN StatePlane Washington North FIPS 4601 in US feet. For all data not in this projection upon receipt, a transformation was applied.
Map layout and design are the product of Adaptation International staff, and were created using ArcGIS 10.2 software. Sea Level Rise Scenarios Adaptation International staff developed locally specific relative sea level rise projections, based on the best available climate change science, for use in this project. These projections were mapped for the three focus areas (Neah Bay, Port Angeles, and Port Townsend) using LIDAR derived digital elevation models (DEMs).
LIDAR (LIght Distance And Ranging, also known as Airborne Laser Swath Mapping or ALSM) is a technology that employs an airborne scanning laser rangefinder to produce high-resolution topographic surveys of unparalleled detail. LIDAR data for Neah Bay was collected by the United States Army Corp of Engineers (USACE) and made available through the National Oceanic and Atmospheric Administration’s (NOAA) Digital Coast web portal http://coast.noaa.gov/digitalcoast/. LIDAR data for Port Angeles and Port Townsend were collected by the Federal Emergency Management Agency (FEMA)--specifically data from the 2012 Jefferson-Clallum LIDAR Project--and made available through the Puget Sound Lidar Consortium (PSLC). Note that registration is required to access PSLC data (http://pugetsoundlidar.ess.washington.edu/).
Aerial orthoimagery, used as base for the sea level rise projections, was obtained through the United States Geological Survey (USGS) via the http://nationalmap.gov/ web portal. The analysis used the most recently available imagery with 1-foot resolution, which was recorded in 2009. The metadata for the aerial imagery is available.
Additionally, key resources, landmarks, and infrastructure within the three focus areas were mapped using a combination of obtained GIS data, information provided by the consultant team, and through review of the orthoimagery. The precise location of community resources was confirmed by project staff and stakeholders during the engagement workshops.
84

Complete List of MapsA total of 10 maps were developed for this project and are provided as part of this report.
Representing the entirety of the study area, four overview maps were created from GIS data classified into one or more of the following categories: Water Resources,Critical Infrastructure,Natural and Managed Ecosystems,And Community Vitality.
Each of these categories is consistent with the distinct classifications used during the engagement workshops, and also found within this report.
Furthermore, for each of the three focus areas (Neah Bay, Port Angeles, and Port Townsend), both a low sea level rise scenario and a high sea level rise scenario were mapped. As a result, a total of six sea level rise projection maps were created.
A complete list of maps created for this project is provided in Table X.X.
Table B. Complete List of MapsOverview MapsWater ResourcesCritical InfrastructureNatural and Managed EcosystemsCommunity Vitality
Sea Level Rise ScenariosPort Angeles Port Townsend Neah BayLow Scenario Low Scenario Low ScenarioHigh Scenario High Scenario High Scenario
Detailed list of GIS Data layers used
85

Projection: NAD 1983 HARN StatePlane Washington North FIPS 4601 (US Feet)
Critical Infrastructure Geospatial DataData Layer Available
Clallum CountyAvailableJefferson County Source
Transportation
Roads Yes Yes Clallum and Jefferson County GIS
Railways Yes Yes Washington State Geospatial Portal (WSGP)
Bridges Yes Yes WSGP
Culverts Yes Yes WSGP
Health CareHospitals Yes Yes WSGP
Clinics Yes Yes WSGP
Nursing Homes Yes Yes WSGP
Assisted Living Yes Yes WSGP
Adult Family Homes Yes Yes WSGP
Emergency ResponseEMS Yes Yes WSGP
Police/Guard Yes Unknown Clallum County GIS
Fire Station Yes Yes WSGP
EducationSchools Yes Unknown Clallum County GIS
HistoricHistoric Registry Yes Yes WSGP
UtilitiesRadio Yes Unknown Clallum County GIS
Electric Yes Unknown Clallum County GIS
Electric/Water Yes Unknown Clallum County GIS
Water Yes Unknown Clallum County GIS
Waste Water Yes Unknown Clallum County GISWaste Water Treatment Plant Yes Unknown Clallum County GIS
Hazard AreasSlope Stability Yes Yes WSGP
Shoreline Slope Stability Yes Yes WSGP
Seismogenic Features Yes Yes WSGP
86
Erosion Hazard Yes Yes WSGP
Levee Inventory Yes Yes WSGP
Floodplains Yes Yes WSGPWildland Urban Interface (Fire Risk) Yes Yes WSGP
Projection: NAD 1983 HARN StatePlane Washington North FIPS 4601 (US Feet)
Water Resources Geospatial DataData Layer Available
Clallum CountyAvailableJefferson County Source
HydrographyWatersheds (HUC 8, 10, and 12) Yes Yes National Hydrography Database
(NHD)Water Bodies Yes Yes NHDFlow Lines (Rivers and Streams) Yes Yes NHD
Wetlands Inventory 2011 Yes Yes Washington State Geospatial
Portal (WSGP)
Floodplains Yes Yes Federal Emergency Management Agency (FEMA)
Water QualityNon-attainment Areas (TMDLs) Yes Yes WSGP
Point-source Pollution (Dairies) Yes Yes WSGP
Monitoring Stations Yes Yes WSGP
Water SupplyLakes and Reservoirs Yes Yes WSGP
Fish Passage Barrier InventoryCulverts Yes Yes WSGP
Misc Barriers Yes Yes WSGP
Dams Yes Yes WSGP
ShorelineShoreline Stability Yes Yes WSGP
Levee Inventory Yes Yes WSGP
Projection: NAD 1983 HARN StatePlane Washington North FIPS 4601 (US Feet)
87
Natural and Managed Ecosystems Geospatial DataData Layer Available
Clallum CountyAvailableJefferson County Source
Agriculture
Land Use and Land Cover Yes Yes Washington State Geospatial Portal (WSGP)
Primary Crop Group Yes Yes WSGP
Soils / Prime Farmland Yes Yes WSGP
Dairies Yes Yes WSGP
FisheriesAquatic Parcels Yes Yes WSGPShellfish Harvest Locations Yes Yes WSGP
Fish Passage Barriers Inventory Yes Yes WSGP
ForestryActive Applications Yes Yes WSGP
Applications (All) Yes Yes WSGP
Biodiversity
Endangered Species Yes Yes US Fish and Wildlife Service (USFWS)
Habitat Conservation Plan Parcels Yes Yes WSGP
Sensitive Aquatic Areas Yes Yes WSGPRare Plants and High Quality Ecosystems Yes Yes WSGP
Invasive Species Yes Yes WSGP
Hazard AreasSlope Stability Yes Yes WSGP
Shoreline Slope Stability Yes Yes WSGP
Seismogenic Features Yes Yes WSGP
Erosion Hazard Yes Yes WSGP
Levee Inventory Yes Yes WSGP
Floodplains Yes Yes WSGPWildland Urban Interface (Fire Risk) Yes Yes WSGP
Projection: NAD 1983 HARN StatePlane Washington North FIPS 4601 (US Feet)
88

Community Vitality Geospatial DataData Layer Available
Clallum CountyAvailableJefferson County Source
Boundaries
Counties Yes Yes Washington State Geospatial Portal (WSGP)
City Limits (polygon) Yes Yes WSGPPopulated Places (Points) Yes Yes WSGP
Urban Growth Areas Yes Yes WSGPPublic Lands (Federal, State, Municipal, and Tribal)
Yes Yes WSGP
Cadastral Yes Yes Clallum and Jefferson County GIS
Zoning
Zoning (by County) Yes Yes Clallum and Jefferson County GIS
Population
2010 Census Yes Yes US Natural Resources Conservation Service (NRCS)
Projected Population Yes Yes US Environmental Protection Agency (EPA)
Health CareHospitals Yes Yes WSGP
Clinics Yes Yes WSGP
Nursing Homes Yes Yes WSGP
Assisted Living Yes Yes WSGP
Adult Family Homes Yes Yes WSGP
Emergency ResponseEMS Yes Yes WSGP
Police/Guard Yes Unknown Clallum County GIS
Fire Station Yes Yes WSGP
EducationSchools Yes Unknown Clallum County GIS
HistoricHistoric Registry Yes Yes WSGP
Air and Water QualityTotal Maximum Daily Loads (TMDL) Yes Yes WSGP
Water Quality Assessment Yes Yes WSGP
89
Ozone Yes Yes WSGP
Particulate Matter Yes Yes WSGP
90

F. References
91

1 Hewitson, B., A.C. Janetos, T.R. Carter, F. Giorgi, R.G. Jones,W.-T. Kwon, L.O. Mearns, E.L.F. Schipper, and M. van Aalst, 2014: Regional context. In: Climate Change 2014: Impacts, Adaptation, and Vulnerability. Part B: Regional Aspects. Contribution of Working Group II to the Fifth Assessment Report of the Intergovernmental Panel on Climate Change [Barros, V.R., C.B. Field, D.J. Dokken, M.D. Mastrandrea, K.J. Mach, T.E. Bilir, M. Chatterjee, K.L. Ebi,Y.O. Estrada, R.C. Genova, B. Girma, E.S. Kissel, A.N. Levy, S. MacCracken, P.R. Mastrandrea, and L.L.White (eds.)].Cambridge University Press, Cambridge, United Kingdom and New York, NY, USA, pp. 1133-1197.2 U.S. Bureau of the Census, Population Estimates Program (PEP). Updated annually. http://www.census.gov/popest/index.html. Census Bureau, 2010 Census of Population, Public Law 94-171 Redistricting Data File. Updated every 10 years. http://factfinder2.census.gov.3 Mote, P., A. K. Snover, S. Capalbo, S. D. Eigenbrode, P. Glick, J. Littell, R. Raymondi, and S. Reeder, 2014: Ch. 21: North- west. Climate Change Impacts in the United States: The Third National Climate Assessment, J. M. Melillo, Terese (T.C.) Rich- mond, and G. W. Yohe, Eds., U.S. Global Change Research Program, 487-513.
4 http://nca2014.globalchange.gov/highlights/overview/overview5 U.S. Global Change Research Program. National Climate Assessment, 2014. http://nca2014.globalchange.gov/6 http://nca2014.globalchange.gov/highlights/overview/overview7 Dalton, M., Mote, P., Snover, A. 2013. Climate Change in the Northwest: Implications for our Landscapes, Waters and Communities. Island Press. http://www.cakex.org/sites/default/files/documents/ClimateChangeInTheNorthwest.pdf8 University of Washington, Climate Impacts Group, 2013. Climate Change Impacts and Adaptation in Washington State: Technical Summaries for Decision Makers. http://cses.washington.edu/cig/reports.shtml
9 University of Washington, Climate Impacts Group, 2013. Climate Change Impacts and Adaptation in Washington State: Technical Summaries for Decision Makers. http://cses.washington.edu/cig/reports.shtml10 National Climate Change Viewer (NCCV), U.S. Geological Survey http://www.usgs.gov/climate_landuse/clu_rd/nex-dcp30.asp 11 National Climate Change Viewer (NCCV), U.S. Geological Survey http://www.usgs.gov/climate_landuse/clu_rd/nex-dcp30.asp 12 University of Washington, Climate Impacts Group, 2013. Climate Change Impacts and Adaptation in Washington State: Technical Summaries for Decision Makers. http://cses.washington.edu/cig/reports.shtml13 University of Washington, Climate Impacts Group, 2013. Climate Change Impacts and Adaptation in Washington State: Technical Summaries for Decision Makers. http://cses.washington.edu/cig/reports.shtml
14 University of Washington, Climate Impacts Group, 2013. Climate Change Impacts and Adaptation in Washington State: Technical Summaries for Decision Makers. http://cses.washington.edu/cig/reports.shtml15 University of Washington, Climate Impacts Group, 2013. Climate Change Impacts and Adaptation in Washington State: Technical Summaries for Decision Makers. http://cses.washington.edu/cig/reports.shtml16 National Climate Change Viewer (NCCV), U.S. Geological Survey http://www.usgs.gov/climate_landuse/clu_rd/nex-dcp30.asp 17 National Climate Change Viewer (NCCV), U.S. Geological Survey http://www.usgs.gov/climate_landuse/clu_rd/nex-dcp30.asp
18 University of Washington, Climate Impacts Group, 2013. Climate Change Impacts and Adaptation in Washington State: Technical Summaries for Decision Makers. http://cses.washington.edu/cig/reports.shtml19 University of Washington, Climate Impacts Group, 2013. Climate Change Impacts and Adaptation in Washington State: Technical Summaries for Decision Makers. http://cses.washington.edu/cig/reports.shtml20 U.S. Global Change Research Program. National Climate Assessment, 2014. http://nca2014.globalchange.gov/21 BESR (Board on Earth Sciences and Resources) & OSB (Ocean Studies Board), 2012. Sea-Level Rise for the Coasts
of California, Oregon, and Washington: Past, Present, and Future. The National Academies Press.
22 Contribution of Working Group I to the Fourth Assessment Report of the Intergovernmental Panel on Climate Change, 2007Solomon, S., D. Qin, M. Manning, Z. Chen, M. Marquis, K.B. Averyt, M. Tignor and H.L. Miller (eds.)Cambridge University Press, Cambridge, United Kingdom and New York, NY, USA. Available; http://www.ipcc.ch/publications_and_data/ar4/wg1/en/contents.html23 (Station SC02; http://sideshow.jpl.nasa.gov/post/links/SC02.html).
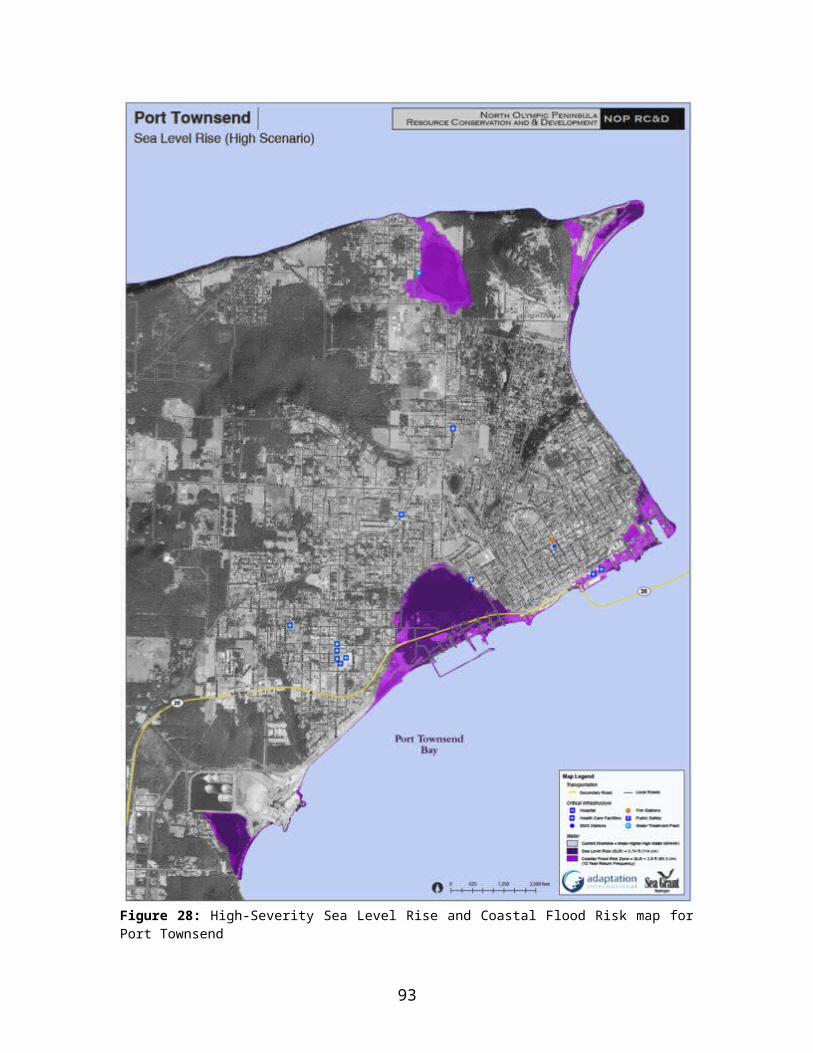
24 (http://sideshow.jpl.nasa.gov/post/series.html). 25 BESR (Board on Earth Sciences and Resources) & OSB (Ocean Studies Board), 2012. Sea-Level Rise for the Coasts of California, Oregon, and Washington: Past, Present, and Future. The National Academies Press.
26 North Pacific Landscape Conservation Cooperative, 2013. Climate Change Effects and Adaptation Approaches for Terrestrial Ecosystems, Habitats, and Species; A Compilation of the Scientific Literature for the North Pacific Landscape Conservation Cooperative Region. http://www.nwf.org/~/media/PDFs/Global-Warming/2014/Executive-Summaries-of-all-three-NPLCC-reports.pdf
27 BESR (Board on Earth Sciences and Resources) & OSB (Ocean Studies Board), 2012. Sea-Level Rise for the Coasts of California, Oregon, and Washington: Past, Present, and Future. The National Academies Press.28 data from http://tidesandcurrents.noaa.gov 29 University of Washington, Climate Impacts Group, 2013. Climate Change Impacts and Adaptation in Washington State: Technical Summaries for Decision Makers. http://cses.washington.edu/cig/reports.shtml30 Mote, P.W., & Salathé, E.P., 2010. Future climate in the Pacific Northwest. Climatic Change, 102(1-2): 29-50.31 Feely, R.A., Klinger, T., Newton, J.A., Chadsey, M., 2012. Scientific Summary of Ocean Acidification in Washington
State Marine Waters. Washington State Blue Ribbon Panel on Ocean Acidification. Technical summary available at: https://fortress.wa.gov/ecy/publications/SummaryPages/1201016.html
32 U.S. Global Change Research Program. National Climate Assessment, 2014. http://nca2014.globalchange.gov/33 U.S. Global Change Research Program. National Climate Assessment, 2014. http://nca2014.globalchange.gov/34 U.S. Global Change Research Program. National Climate Assessment, 2014. Northwest Region. http://nca2014.globalchange.gov/report/regions/northwest35 U.S. Global Change Research Program. National Climate Assessment, 2014. Northwest Region. Coasts. http://nca2014.globalchange.gov/report/regions/coasts 36 University of Washington, Climate Impacts Group, 2013. Climate Change Impacts and Adaptation in Washington State: Technical Summaries for Decision Makers. http://cses.washington.edu/cig/reports.shtml37 Dalton, M.M., P.W. Mote, and A.K. Snover [Eds.]. 2013. Climate Changein the Northwest: Implications for Our Landscapes, Waters, and Communities. Washington, DC:Island Press.38 Tillmann, P., D. Siemann, & P. Glick. Executive Summaries for Marine & Coastal, Freshwater, and Terrestrial Ecosystems. Climate Change Effects & Adaptation Approaches in Ecosystems, Habitats, and Species: A Compilation of Scientific Literature for the North Pacific Landscape Conservation Cooperative Region. 2013. http://www.nwf.org/~/media/PDFs/Global-Warming/2014/Executive-Summaries-of-all-three-NPLCC-reports.pdf39 Olympic National Forest and Olympic National Park. Gen. Tech. Rep. PNW-GTR-844. Portland, OR: U.S. Department of Agriculture, Forest Service, Pacific Northwest Research Station. 130 p. http://www.fs.fed.us/pnw/pubs/pnw_gtr844.pdf40 Washington State Blue Ribbon Panel on Ocean Acidification. Ocean Acidification; From Knowledge to Action, Washington’s Strategic Response, 2012. https://fortress.wa.gov/ecy/publications/publications/1201015.pdf41 Miller, I.M, Shishido, C., Antrim, L., Bowlby, C.E. (Eds.), 2013. Climate Change and the Olympic Coast National Marine Sanctuary: Interpreting Potential Futures. U.S. Department of Commerce. http://sanctuaries.noaa.gov/science/conservation/cc_ocnms.html42 From IPCC-WGII-AR5-Earth Systems-Chap 1843 From IPCC-WGII-AR5-Earth Systems-Chap 18, pg. 9044 AR5, Annex II, Glossary45 Dalton, M., Mote, P., Snover, A. 2013. Climate Change in the Northwest: Implications for our Landscapes, Waters and Communities. Island Press. http://www.cakex.org/sites/default/files/documents/ClimateChangeInTheNorthwest.pdf46 Mantua et al. Climatic Change (2010) 102:187–223 http://www.hydro.washington.edu/pub/leesy/water_temp/Mantu_etal_2010.pdf47 Halofsky, Jessica E.; Peterson, David L.; O’Halloran, Kathy A.; Hawkins Hoffman, Catherine, eds. 2011. Adapting to climate change at Olympic National Forest and Olympic National Park. Gen. Tech. Rep. PNW-GTR-844. Portland, OR: U.S. Department of Agriculture, Forest Service, Pacific Northwest Research Station. 130 p. http://www.fs.fed.us/pnw/pubs/pnw_gtr844.pdf48 Dalton, M., Mote, P., Snover, A. 2013. Climate Change in the Northwest: Implications for our Landscapes, Waters and Communities. Island Press.

http://www.cakex.org/sites/default/files/documents/ClimateChangeInTheNorthwest.pdfDalton, M., Mote, P., Snover, A. 2013. Climate Change in the Northwest: Implications for our Landscapes, Waters and Communities. Island Press. http://www.cakex.org/sites/default/files/documents/ClimateChangeInTheNorthwest.pdf49 University of Washington, Climate Impacts Group, 2013. Climate Change Impacts and Adaptation in Washington State: Technical Summaries for Decision Makers. http://cses.washington.edu/cig/reports.shtml
50 Moore et al., 2008. Impacts of Climate Variability and Future Climate Change on Harmful Algal Blooms and Human Health. Environmental Health 7 (Suppl 2): S451 Portland State University, College of Urban and Public Affairs, 2011. Environment Migrants and the Future of the Willamette Valley. http://www.pdx.edu/usp/sites/www.pdx.edu.usp/files/Environmental_Migrants.pdf52 http://www.adn.com/article/20141120/should-canada-have-plan-climate-refugees; http://www.bizjournals.com/portland/blog/sbo/2014/07/uw-professor-northwest-is-a-potential-climate.html 53
54 Washington State Department of Transportation (WSDOT), 2011. Climate Impacts Vulnerability Assessment. http://www.wsdot.wa.gov/NR/rdonlyres/B290651B-24FD-40EC-BEC3-EE5097ED0618/0/WSDOTClimateImpactsVulnerabilityAssessmentforFHWAFinal.pdf55 Climate Impacts Group, Pacific Northwest (PNW) Hydroclimate Scenarios Project. http://warm.atmos.washington.edu/2860/56 Halofsky, Jessica E.; Peterson, David L.; O’Halloran, Kathy A.; Hawkins Hoffman, Catherine, eds. 2011. Adapting to climate change at Olympic National Forest and Olympic National Park. Gen. Tech. Rep. PNW-GTR-844. Portland, OR: U.S. Department of Agriculture, Forest Service, Pacific Northwest Research Station. 130 p. http://www.fs.fed.us/pnw/pubs/pnw_gtr844.pdf [see 42 above] 57 National Climate Change Viewer (NCCV), U.S. Geological Survey http://www.usgs.gov/climate_landuse/clu_rd/nex-dcp30.asp 58 Dalton, M., Mote, P., Snover, A. 2013. Climate Change in the Northwest: Implications for our Landscapes, Waters and Communities. Island Press. http://www.cakex.org/sites/default/files/documents/ClimateChangeInTheNorthwest.pdf59 Dalton, M., Mote, P., Snover, A. 2013. Climate Change in the Northwest: Implications for our Landscapes, Waters and Communities. Island Press. http://www.cakex.org/sites/default/files/documents/ClimateChangeInTheNorthwest.pdf60 Dalton, M., Mote, P., Snover, A. 2013. Climate Change in the Northwest: Implications for our Landscapes, Waters and Communities. Island Press. http://www.cakex.org/sites/default/files/documents/ClimateChangeInTheNorthwest.pdf61 Dalton, M., Mote, P., Snover, A. 2013. Climate Change in the Northwest: Implications for our Landscapes, Waters and Communities. Island Press. http://www.cakex.org/sites/default/files/documents/ClimateChangeInTheNorthwest.pdf62 Washington State Department of Transportation (WSDOT), 2011. Climate Impacts Vulnerability Assessment. http://www.wsdot.wa.gov/NR/rdonlyres/B290651B-24FD-40EC-BEC3-EE5097ED0618/0/WSDOTClimateImpactsVulnerabilityAssessmentforFHWAFinal.pdf63 Washington State Department of Transportation (WSDOT), 2011. Climate Impacts Vulnerability Assessment. http://www.wsdot.wa.gov/NR/rdonlyres/B290651B-24FD-40EC-BEC3-EE5097ED0618/0/WSDOTClimateImpactsVulnerabilityAssessmentforFHWAFinal.pdf64 AR5, Annex II, Glossary