introductory spatial statistics workshop part 1: interpolation with geostatistical analyst · ·...
TRANSCRIPT
Introductory Spatial Statistics Workshop
Part 1: Interpolation with Geostatistical
Analyst
Jeff W. Hollister
St. Lawrence University
6 December 2002
Spatial Statistics Workshop: Geostatistical Analyst Slide 2 of 26
Introduction
What is interpolation?
• Spatial prediction
• Tobler’s Law
Types of interpolation
• Deterministic• Exact or inexact (smoothed)
• Geostatistical
Spatial Statistics Workshop: Geostatistical Analyst Slide 3 of 26
Introduction:Deterministic
Interpolators
Inverse Distance Weighting (IDW)
• Description
• Exact, Deterministic Interpolator
• Requires little input
• Predicted values weighted by
distance
• No assumptions required
Spatial Statistics Workshop: Geostatistical Analyst Slide 4 of 26
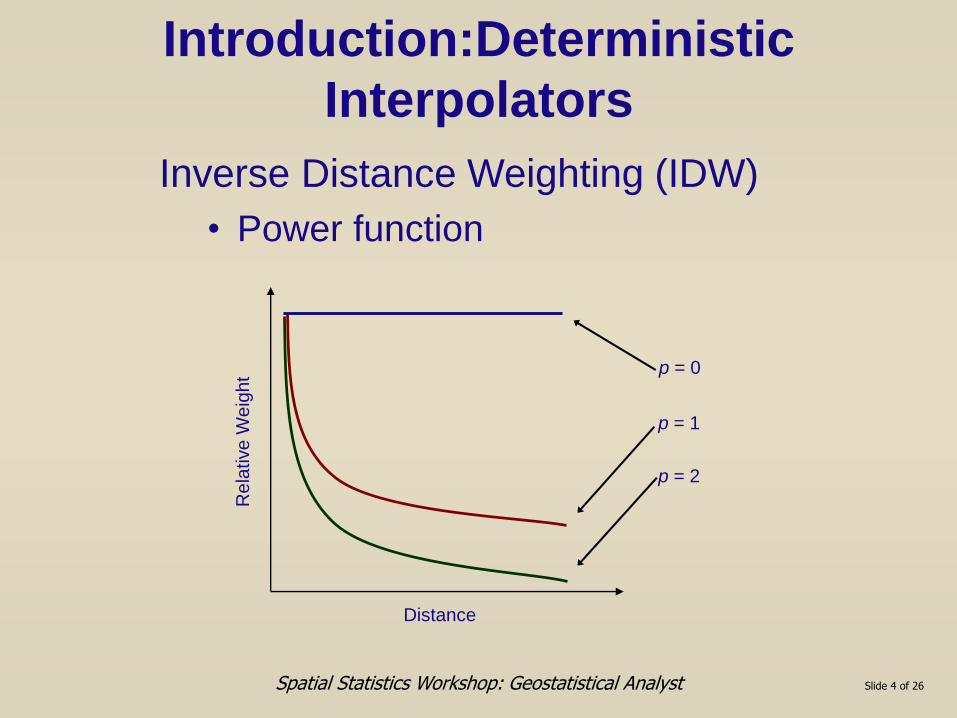
Introduction:Deterministic
Interpolators
Inverse Distance Weighting (IDW)
• Power function
Distance
Re
lative
We
igh
t p = 0
p = 1
p = 2
Spatial Statistics Workshop: Geostatistical Analyst Slide 5 of 26
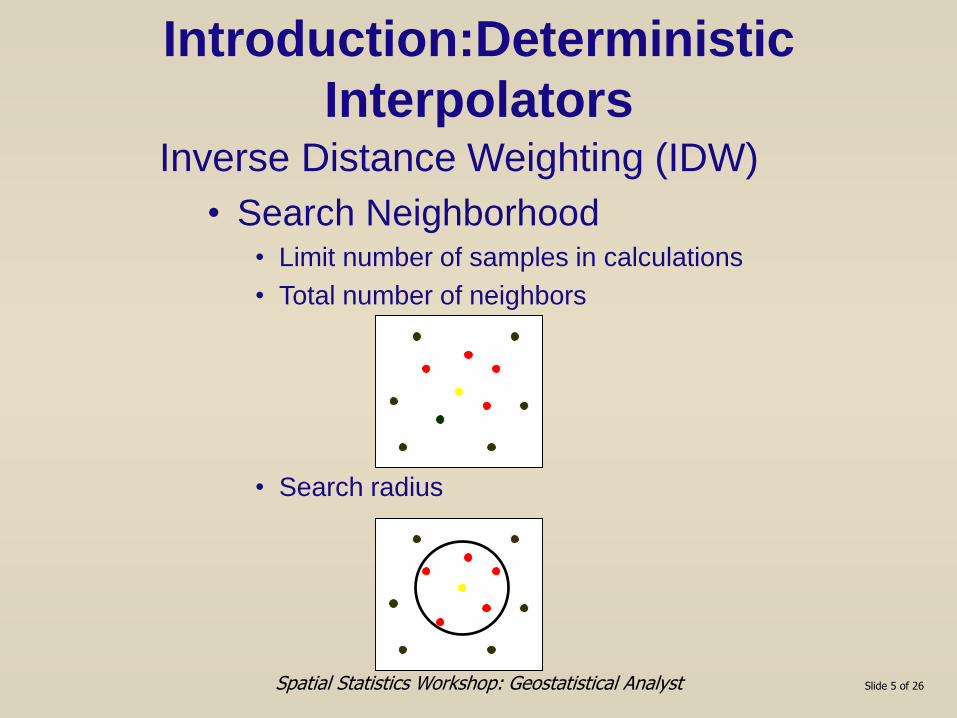
Inverse Distance Weighting (IDW)
• Search Neighborhood• Limit number of samples in calculations
• Total number of neighbors
• Search radius
Introduction:Deterministic
Interpolators
Spatial Statistics Workshop: Geostatistical Analyst Slide 6 of 26
Introduction:Deterministic
Interpolators
Radial Basis Functions (RBFs)
• Description
• Exact, Deterministic Interpolator
• Requires slightly more input than IDW
• Like fitting a rubber sheet to the data
points
• Used for calculating gently varying
surfaces
• No assumptions required
Spatial Statistics Workshop: Geostatistical Analyst Slide 7 of 26
Introduction:Deterministic
Interpolators
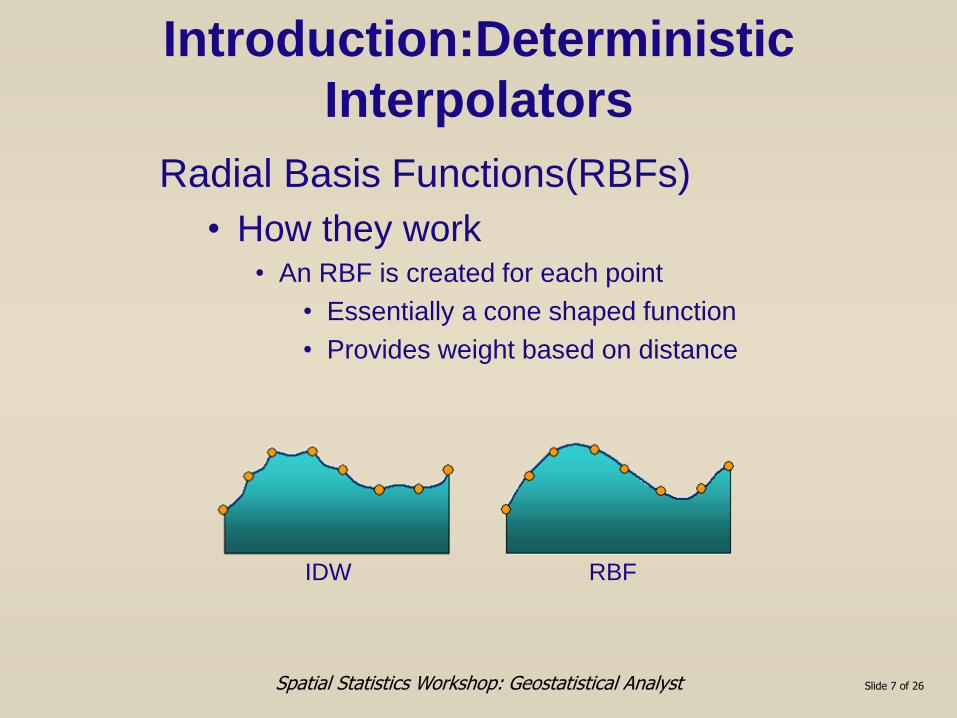
Radial Basis Functions(RBFs)
• How they work• An RBF is created for each point
• Essentially a cone shaped function
• Provides weight based on distance
IDW RBF
Spatial Statistics Workshop: Geostatistical Analyst Slide 8 of 26
Introduction:Deterministic
Interpolators
Radial Basis Functions(RBFs)
• Many algorithms• Completely regularizd spline
• Spline with tension
• Multiquadratic RBFs
• Inverse multiquadratic RBFs
• Thin plate spline
• Parameter• Controls the “smoothness” of the surface
• Higher values = more smoothing
Spatial Statistics Workshop: Geostatistical Analyst Slide 9 of 26
Introduction:Deterministic
InterpolatorsPolynomial Functions
• Description
• Inexact, deterministic interpolators
• Global and Local
• Global
• Coarse scale patterns
• Slowly varying surface
• Long-range or global trends
• Local
• Fine scale patterns
• Sensitive to neighborhood definition
• No assumptions required
Spatial Statistics Workshop: Geostatistical Analyst Slide 10 of 26
Introduction:Deterministic
InterpolatorsPolynomial Functions
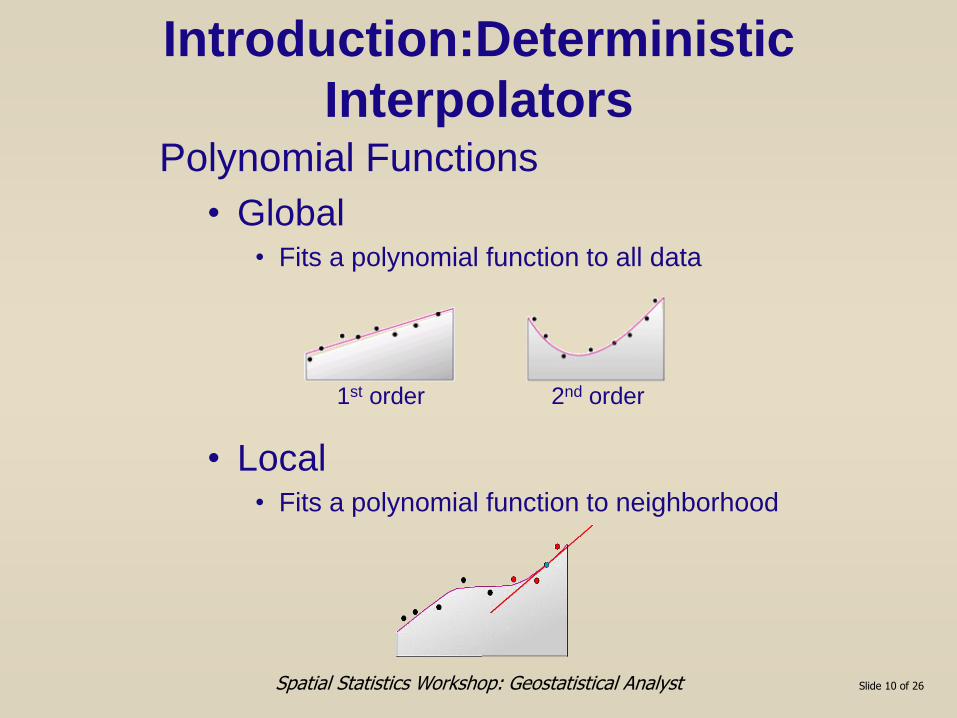
• Global• Fits a polynomial function to all data
• Local• Fits a polynomial function to neighborhood
1st order 2nd order
Spatial Statistics Workshop: Geostatistical Analyst Slide 11 of 26
Introduction:Geostatistical
InterpolatorsKriging
• Description
• Exact or inexact, geostatistical
interpolator
• Requires considerable input
• Several different types
• Ordinary, Simple, Universal
• Co-kriging
Spatial Statistics Workshop: Geostatistical Analyst Slide 12 of 26
Introduction:Geostatistical
InterpolatorsKriging
• Description(cont.)
• Requires several assumptions
• Stationarity
• Some methods assume normality
• Isotropy
• Fits a theoretical statistical model to
empirical data
• Allows for estimate of prediction error
Spatial Statistics Workshop: Geostatistical Analyst Slide 13 of 26
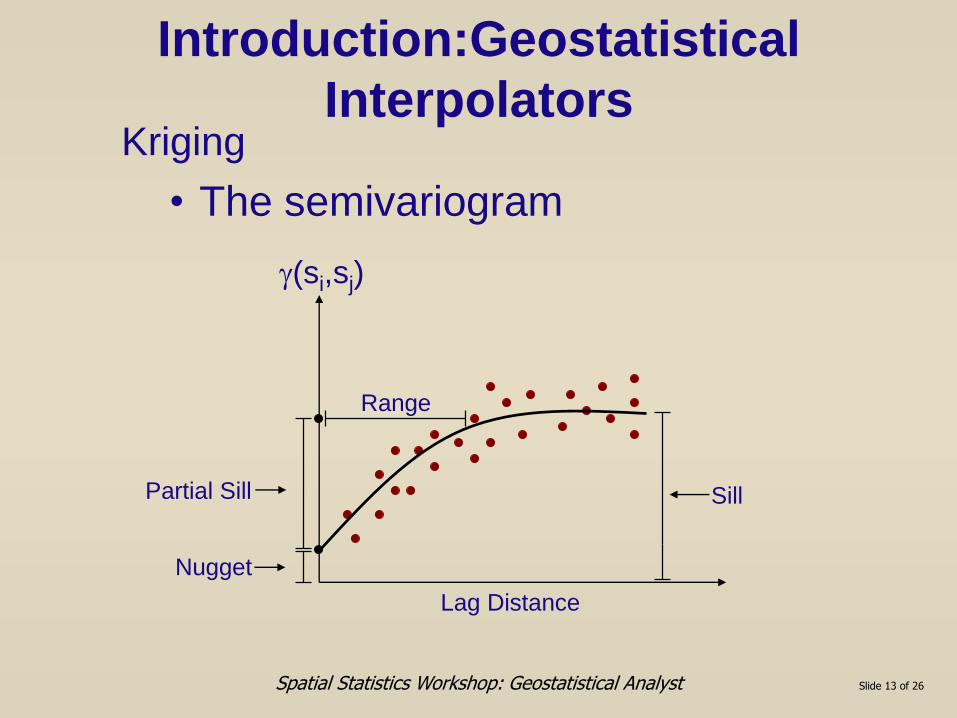
Introduction:Geostatistical
InterpolatorsKriging
• The semivariogram
Lag Distance
Nugget
Range
(si,sj)
Partial Sill Sill
Spatial Statistics Workshop: Geostatistical Analyst Slide 14 of 26
Refrences
• Johnston, K., Ver Hoef, J. M., Krivoruchko, K.,
Lucas, N. 2001. Using ArcGIS Geostatistical
Analyst. ESRI, Redlands, CA.• also available in ArcGIS online help
Spatial Statistics Workshop: Geostatistical Analyst Slide 15 of 26
Demo:
Geostatistical Analyst
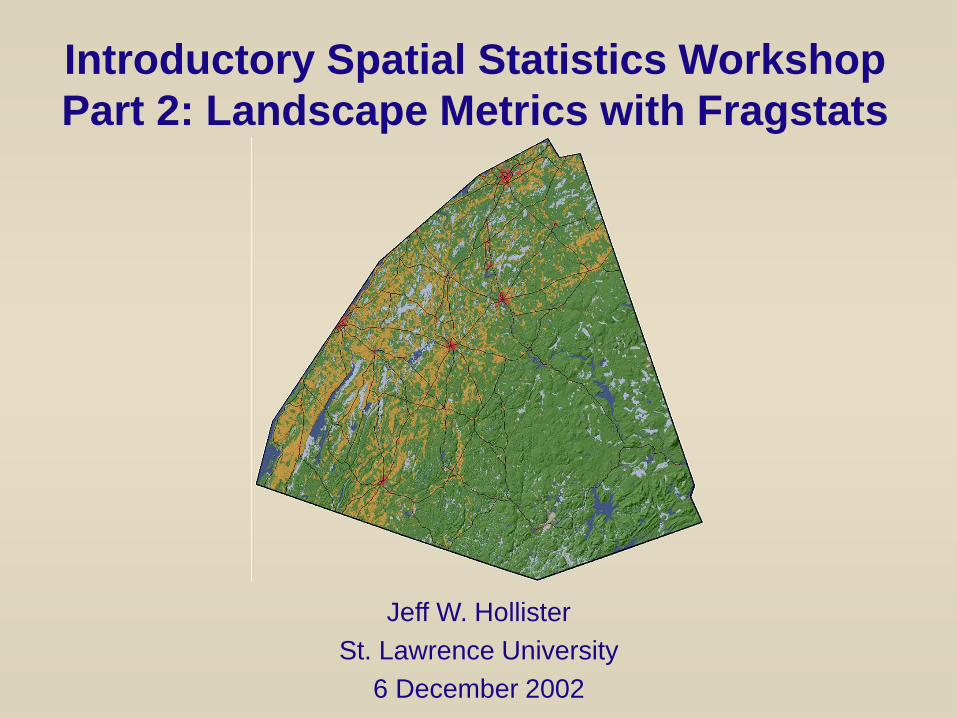
Introductory Spatial Statistics Workshop
Part 2: Landscape Metrics with Fragstats
Jeff W. Hollister
St. Lawrence University
6 December 2002
Spatial Statistics Workshop: Geostatistical Analyst Slide 17 of 26
Introduction
What are landscape metrics?
• Composition
• Configuration
Why are these important?
• Basic concept of Landscape Ecology
• Ecological processes are linked to ecological patterns
• Comparison
• Prediction
Spatial Statistics Workshop: Geostatistical Analyst Slide 18 of 26
Data Types
What types of data can be used?
• Aerial photographs
• Satellite imagery
• Published data
• Field data
How is this data used?
• Thematic GIS data
• e.g. Land Use/Land Cover in an Anderson Level I classification
Spatial Statistics Workshop: Geostatistical Analyst Slide 19 of 26
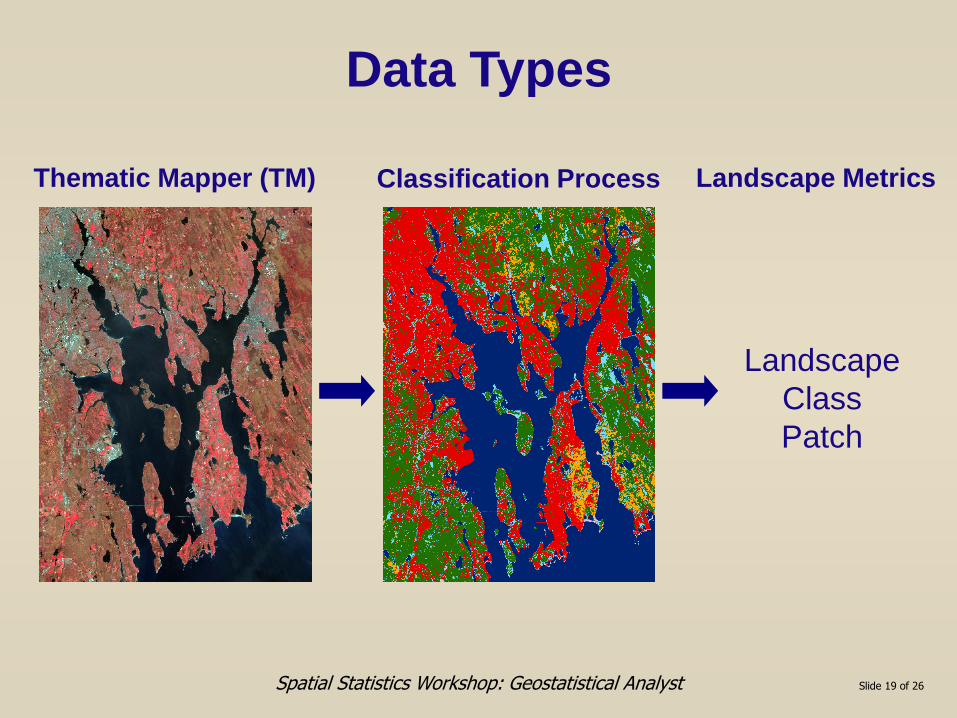
Data Types
Thematic Mapper (TM) Classification Process Landscape Metrics
Landscape
Class
Patch
Spatial Statistics Workshop: Geostatistical Analyst Slide 20 of 26
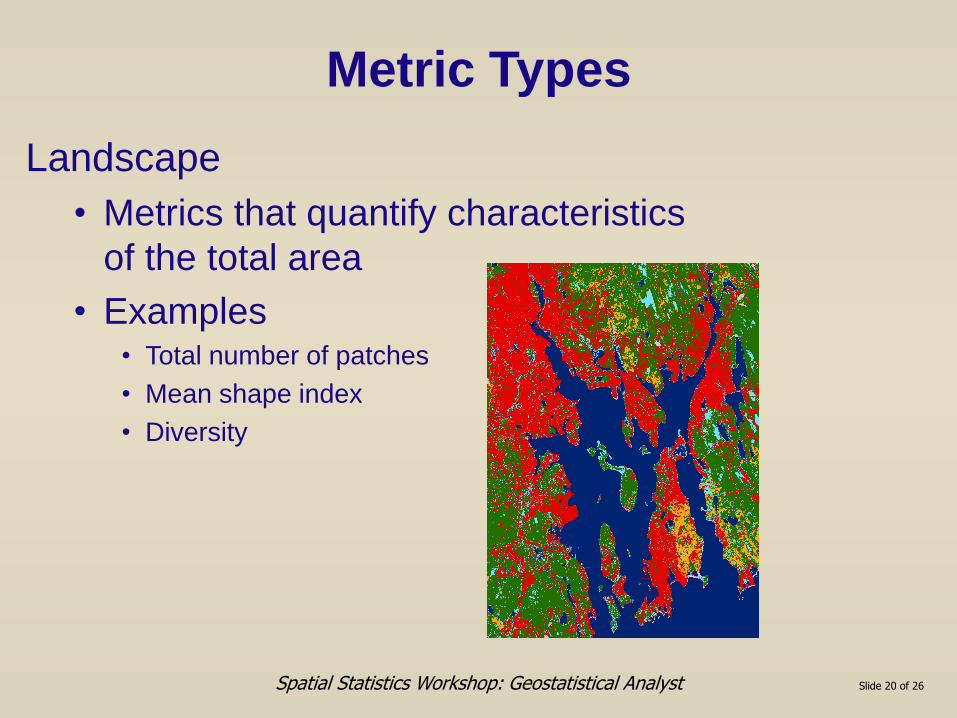
Metric Types
Landscape
• Metrics that quantify characteristics
of the total area
• Examples • Total number of patches
• Mean shape index
• Diversity
Spatial Statistics Workshop: Geostatistical Analyst Slide 21 of 26
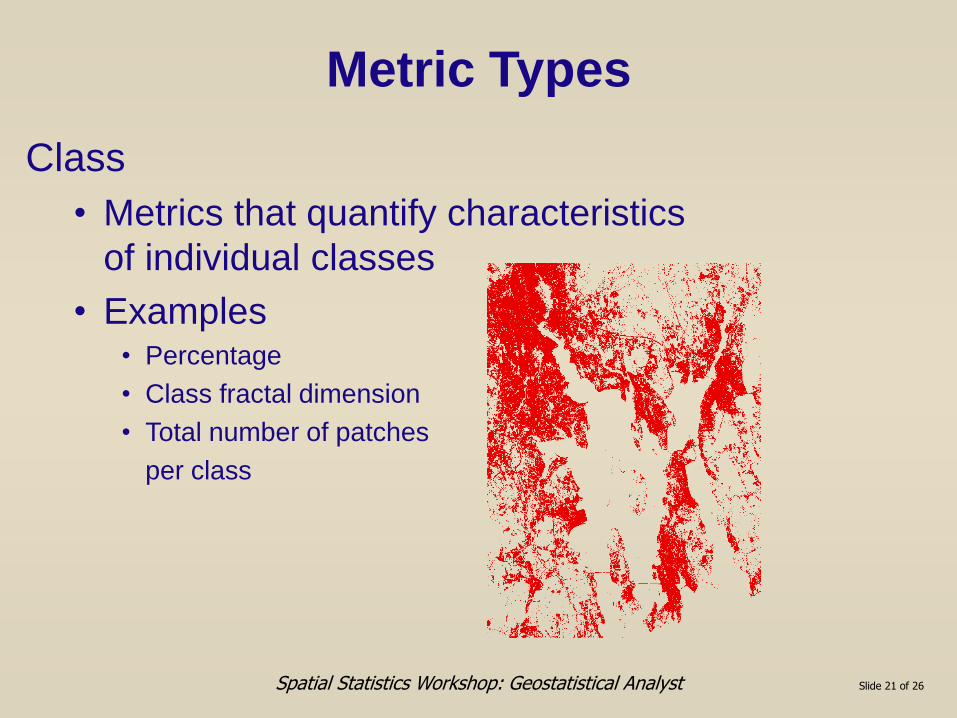
Metric Types
Class
• Metrics that quantify characteristics
of individual classes
• Examples• Percentage
• Class fractal dimension
• Total number of patches
per class
Spatial Statistics Workshop: Geostatistical Analyst Slide 22 of 26
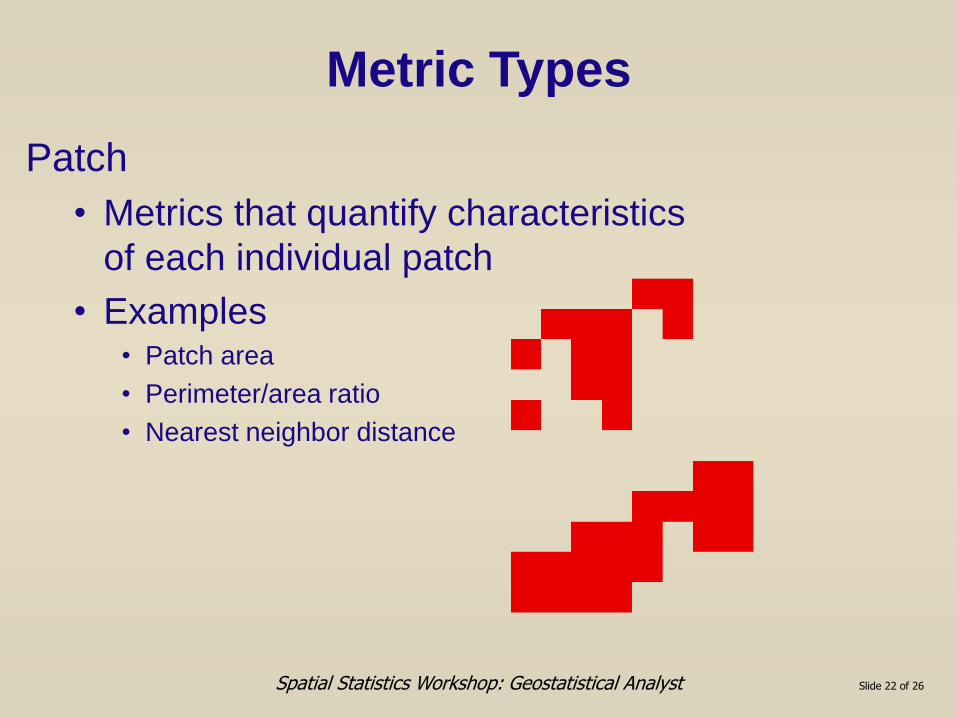
Metric Types
Patch
• Metrics that quantify characteristics
of each individual patch
• Examples• Patch area
• Perimeter/area ratio
• Nearest neighbor distance
Spatial Statistics Workshop: Geostatistical Analyst Slide 23 of 26
Metric Types
Metrics describe various aspects
of landscape structure
• Area/Density/Edge
• Shape
• Core Area
• Isolation/Proximity
• Contrast
• Contagion/Interspersion
• Connectivity
• Diversity
Spatial Statistics Workshop: Geostatistical Analyst Slide 24 of 26
Caveats
Think before you leap!!!
• Clear purpose
• Classification scheme
• Scale
• Patch
• Correlation
• Ecological vs. statistical significance
• Edge Effects
Spatial Statistics Workshop: Geostatistical Analyst Slide 25 of 26
References
Turner, M.G., Gardner, R.H.,O’Neill, R.V. 2001. Chapter 5. Landscape Ecology in Theory and Practice:Pattern and Process. Springer-Verlag, New York.
McGarigal, K. 2001. Fragstats Manuals. Available On-line at http://www.umass.edu/landeco/research/fragstats/fragstats.html or through the software help pages
Gustafson, E. J. 1998. Quantifying landscape spatial pattern: What is the state of the art. Ecosystems:143-156.
Spatial Statistics Workshop: Geostatistical Analyst Slide 26 of 26
Demo:
Fragstats Version 3.3
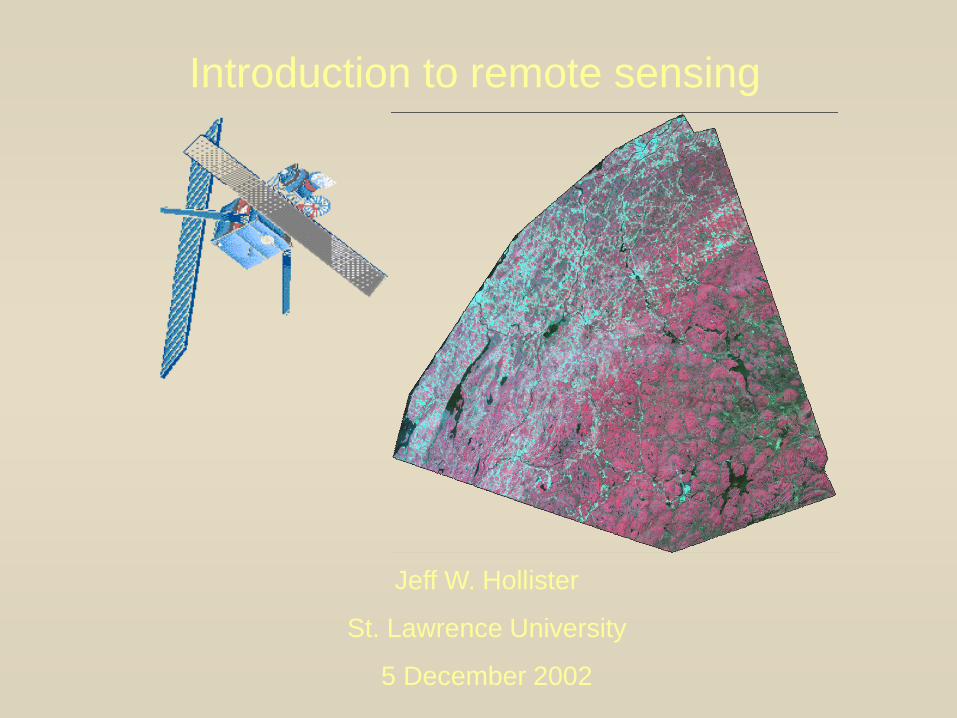
Introduction to remote sensing
Jeff W. Hollister
St. Lawrence University
5 December 2002
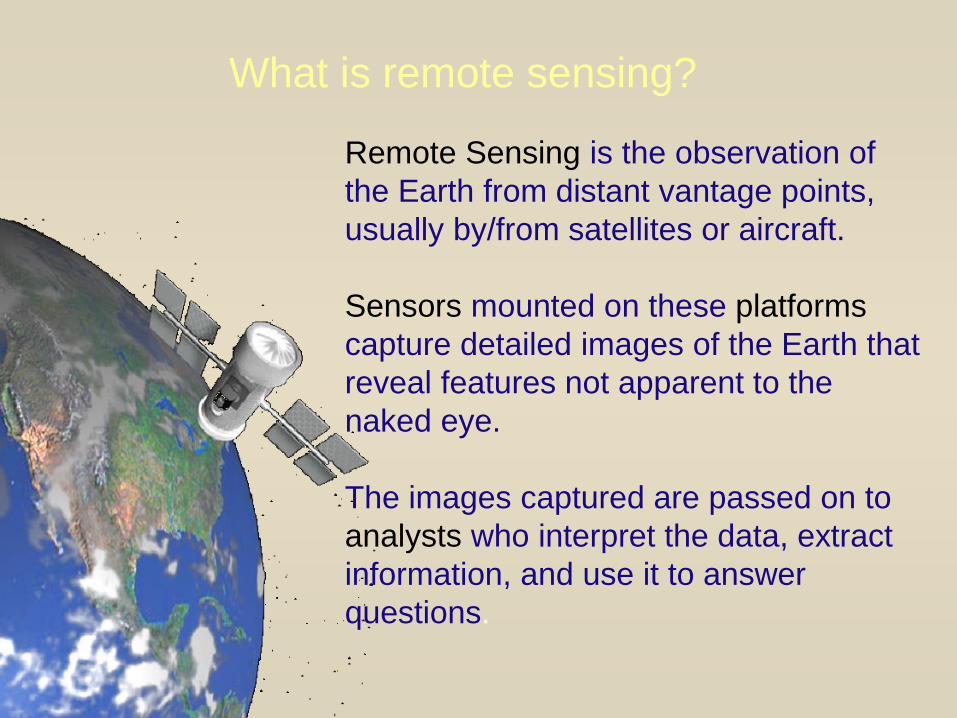
What is remote sensing?
Remote Sensing is the observation of
the Earth from distant vantage points,
usually by/from satellites or aircraft.
Sensors mounted on these platforms
capture detailed images of the Earth that
reveal features not apparent to the
naked eye.
The images captured are passed on to
analysts who interpret the data, extract
information, and use it to answer
questions.
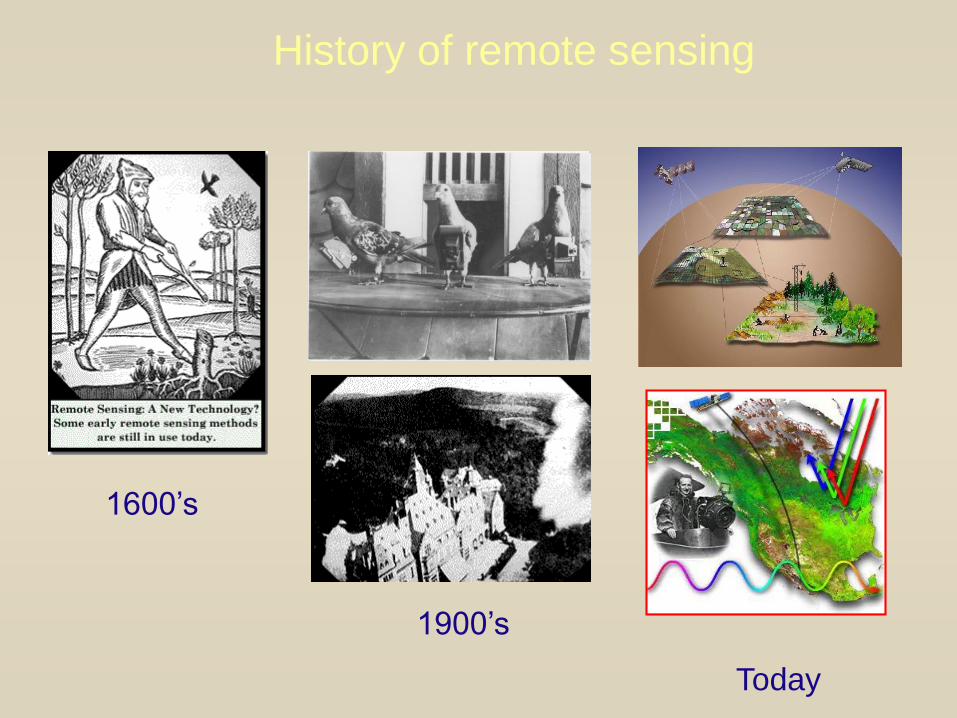
History of remote sensing
1600’s
1900’s
Today
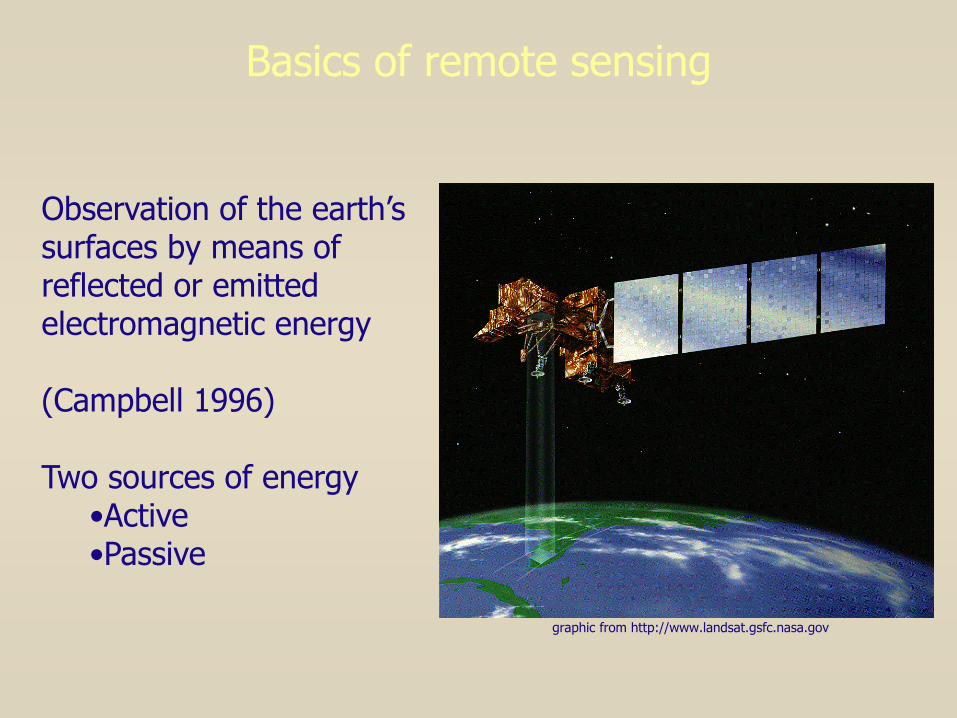
Observation of the earth’s surfaces by means of reflected or emitted electromagnetic energy
(Campbell 1996)
Basics of remote sensing
graphic from http://www.landsat.gsfc.nasa.gov
Two sources of energy•Active•Passive
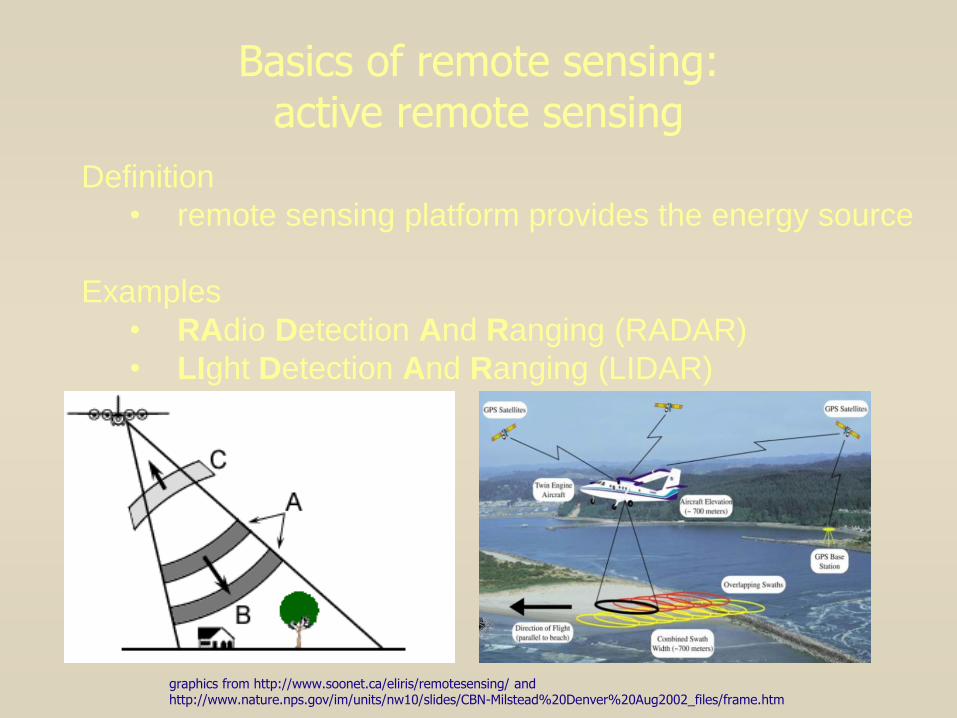
Basics of remote sensing:active remote sensing
Definition
• remote sensing platform provides the energy source
Examples
• RAdio Detection And Ranging (RADAR)
• LIght Detection And Ranging (LIDAR)
graphics from http://www.soonet.ca/eliris/remotesensing/ and http://www.nature.nps.gov/im/units/nw10/slides/CBN-Milstead%20Denver%20Aug2002_files/frame.htm
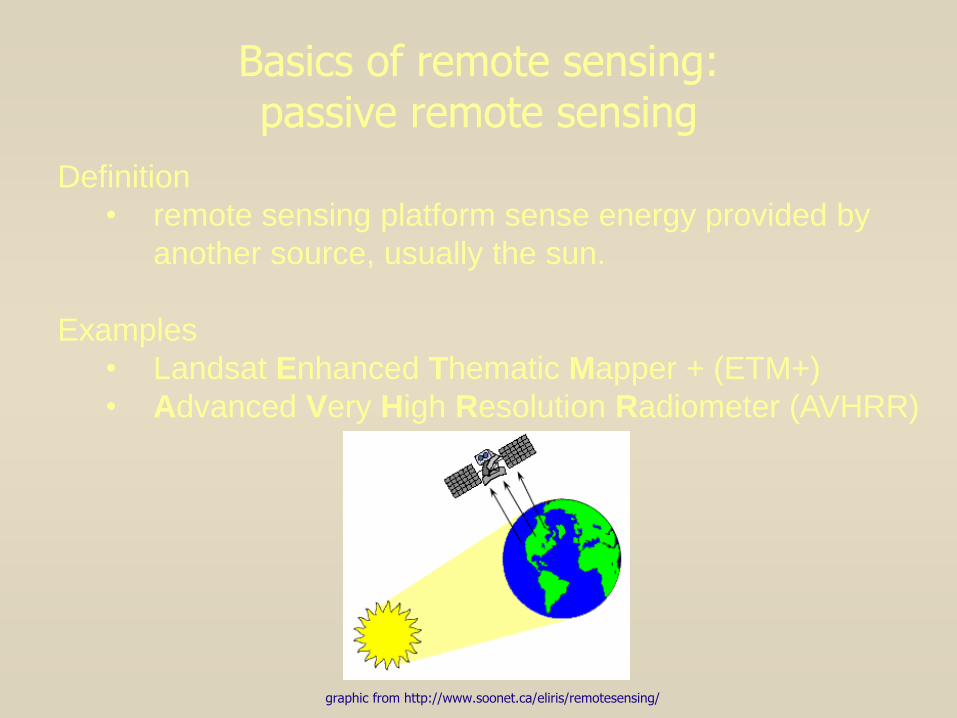
Basics of remote sensing:passive remote sensing
Definition
• remote sensing platform sense energy provided by
another source, usually the sun.
Examples
• Landsat Enhanced Thematic Mapper + (ETM+)
• Advanced Very High Resolution Radiometer (AVHRR)
graphic from http://www.soonet.ca/eliris/remotesensing/
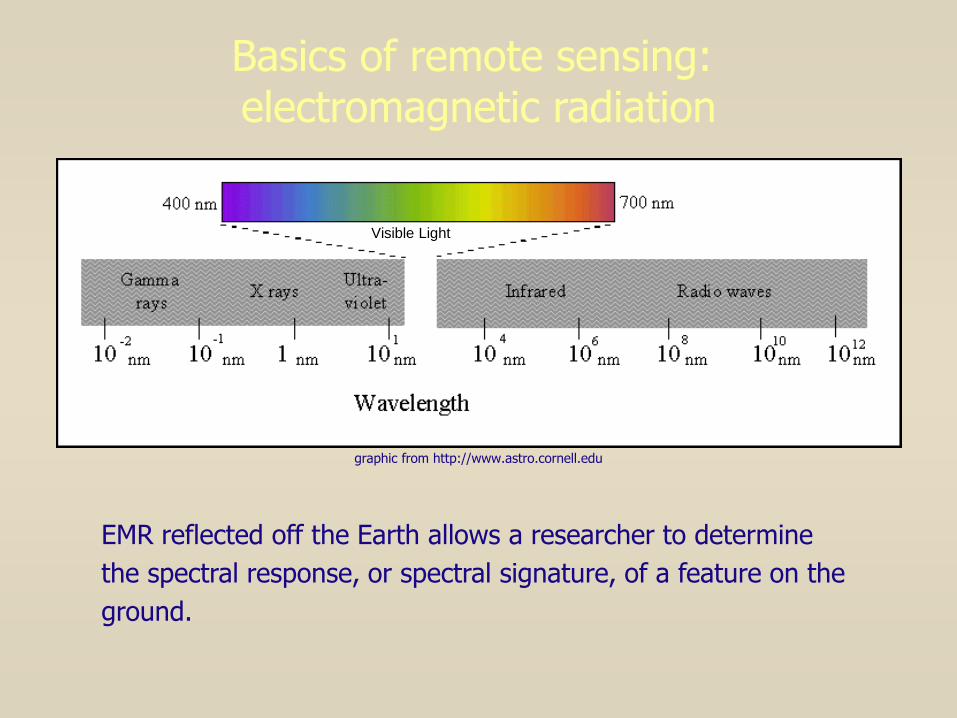
Basics of remote sensing: electromagnetic radiation
Visible Light
EMR reflected off the Earth allows a researcher to determine
the spectral response, or spectral signature, of a feature on the
ground.
graphic from http://www.astro.cornell.edu
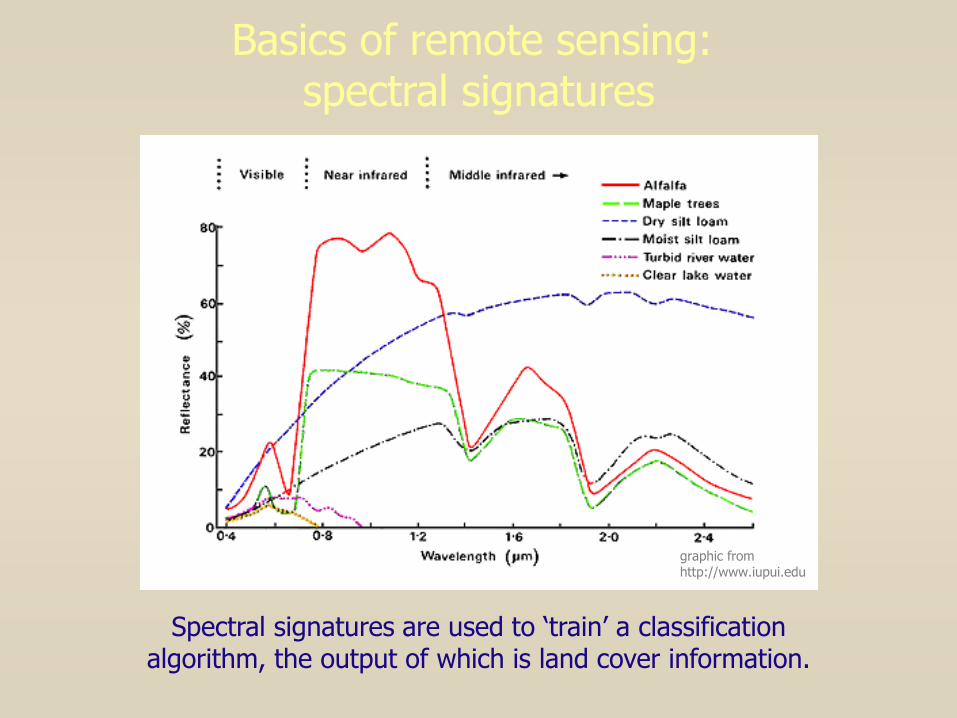
Basics of remote sensing: spectral signatures
Spectral signatures are used to ‘train’ a classification algorithm, the output of which is land cover information.
graphic from http://www.iupui.edu
Basics of remote sensing: resolution
Definition
• Spectral and spatial structure of satellite images
Spectral resolution
• Describes the number of bands and range of wavelengths
represented by the satellite (i.e., Systeme Pour
l'Observation de la Terre (SPOT-XS) 4 bands, and
500 – 1750 nm)
• High spectral resolution = many bands and wide range
of wavelengths
Spatial resolution
• Describes the size of the smallest unit of area,
represented by a picture element or pixel, in a satellite
image (i.e., SPOT-XS 20m pixels)
• High spatial resolution = small pixel size
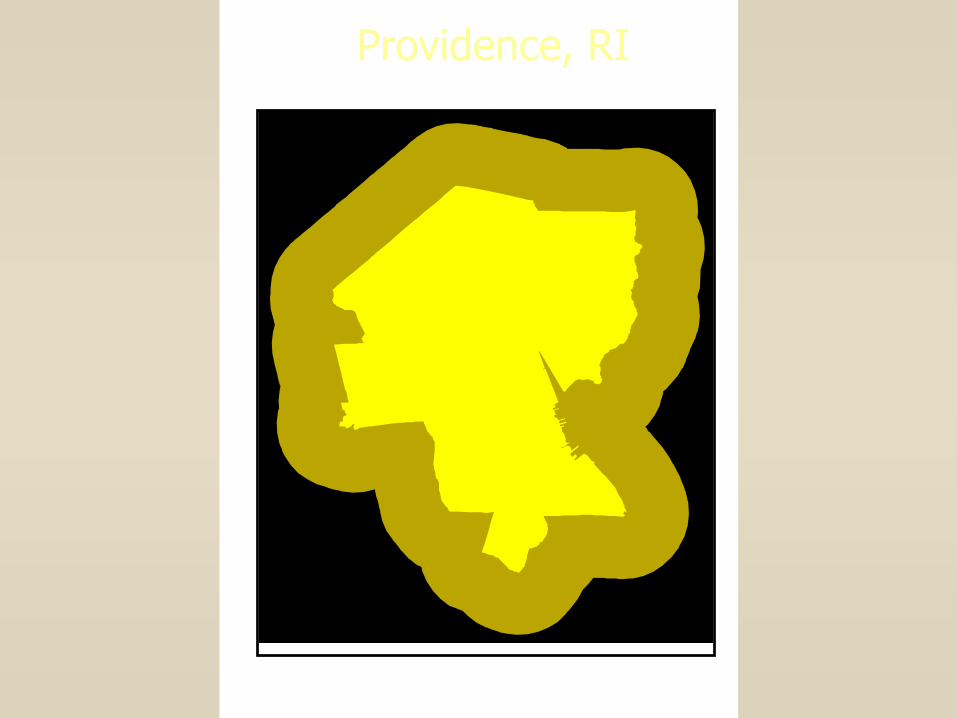
5 0 5 10 Kilometers
N
one mile buffer zonecity limit
Providence,
Rhode Island
Providence, RI
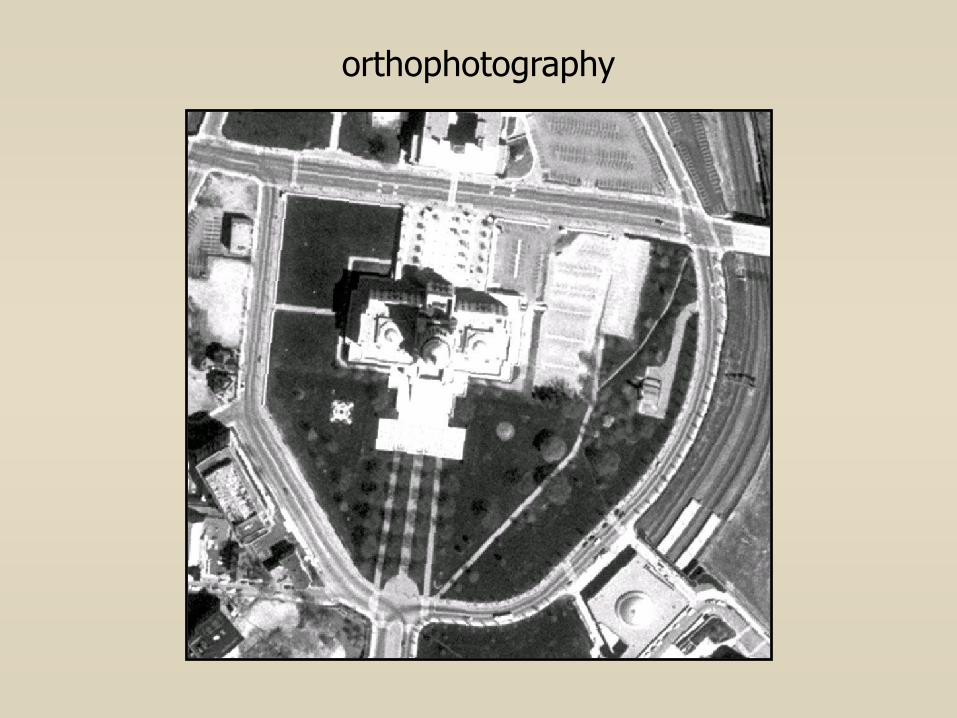
orthophotography
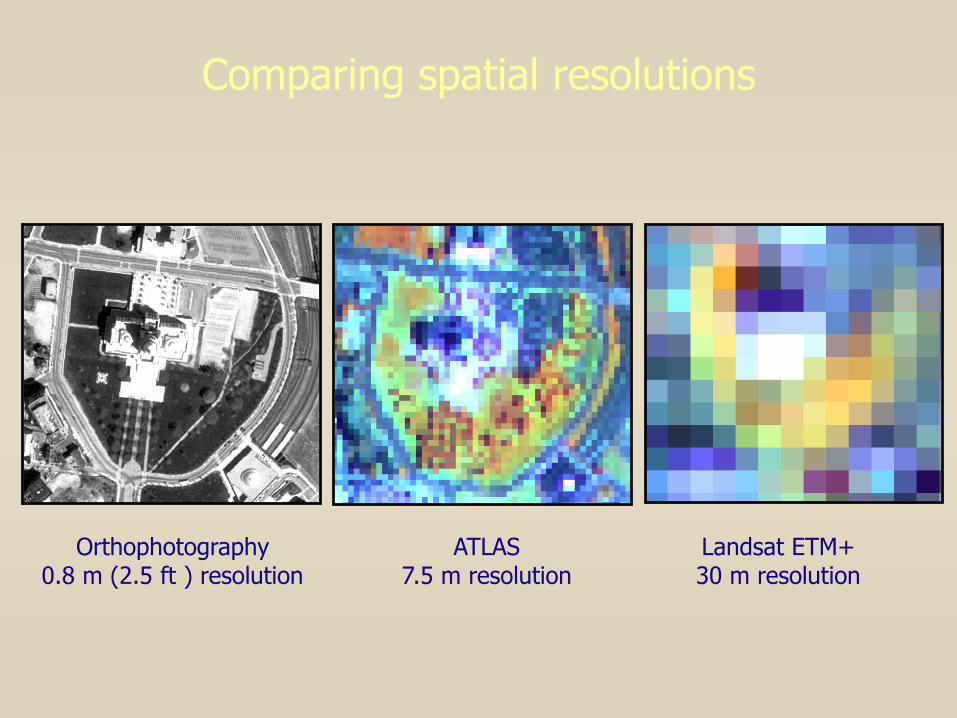
Comparing spatial resolutions
Orthophotography0.8 m (2.5 ft ) resolution
Landsat ETM+30 m resolution
ATLAS7.5 m resolution
Page 39 of
20
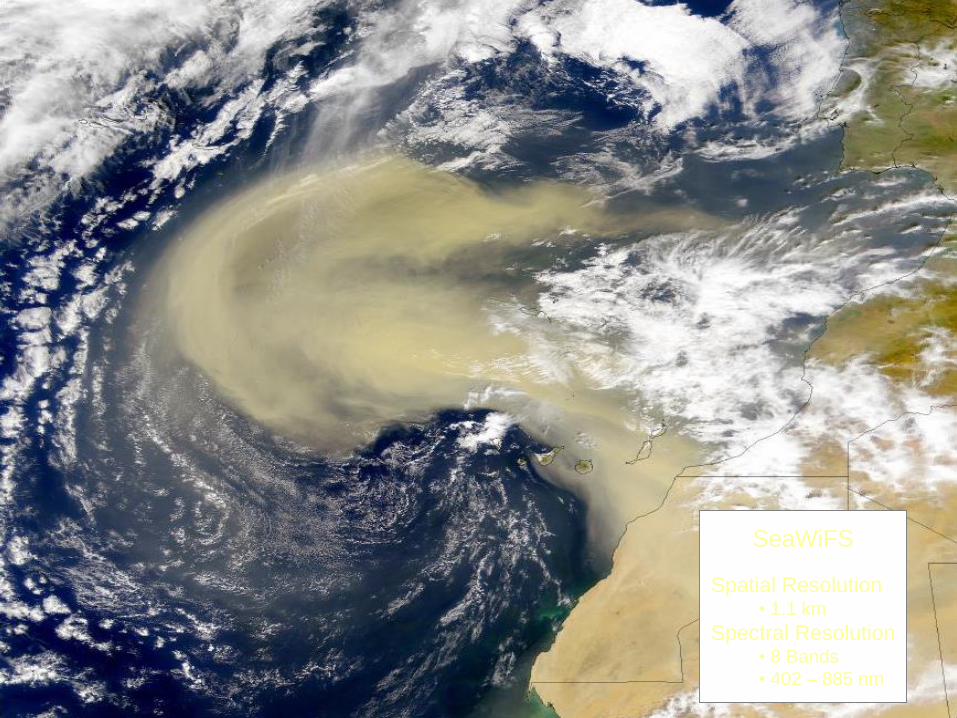
SeaWiFS
Spatial Resolution• 1.1 km
Spectral Resolution• 8 Bands
• 402 – 885 nm
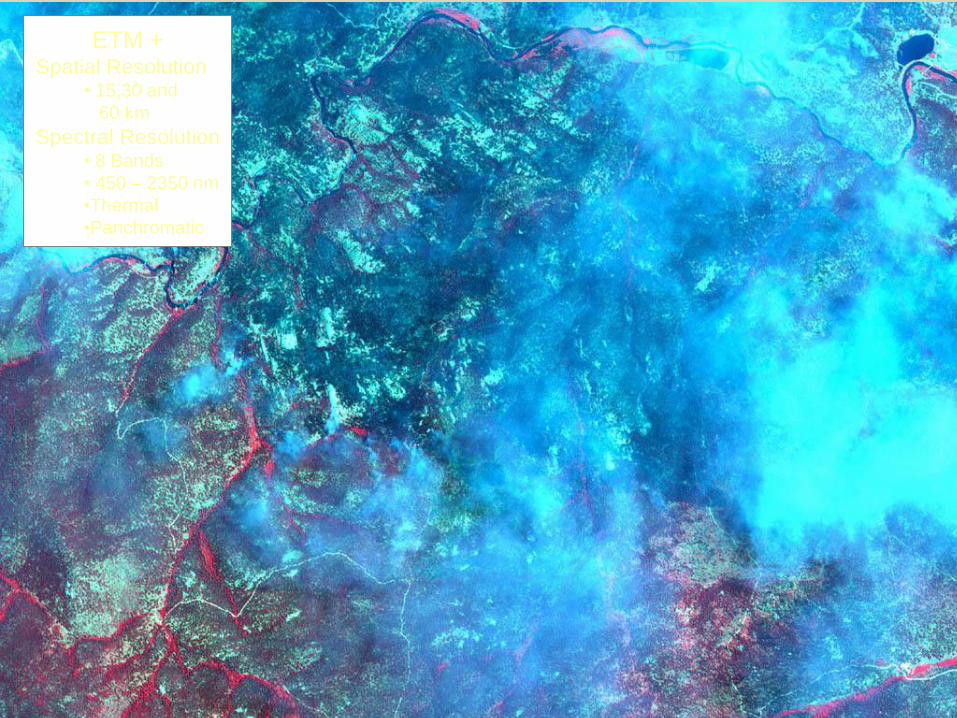
ETM +Spatial Resolution
• 15,30 and
60 km
Spectral Resolution• 8 Bands
• 450 – 2350 nm
•Thermal
•Panchromatic
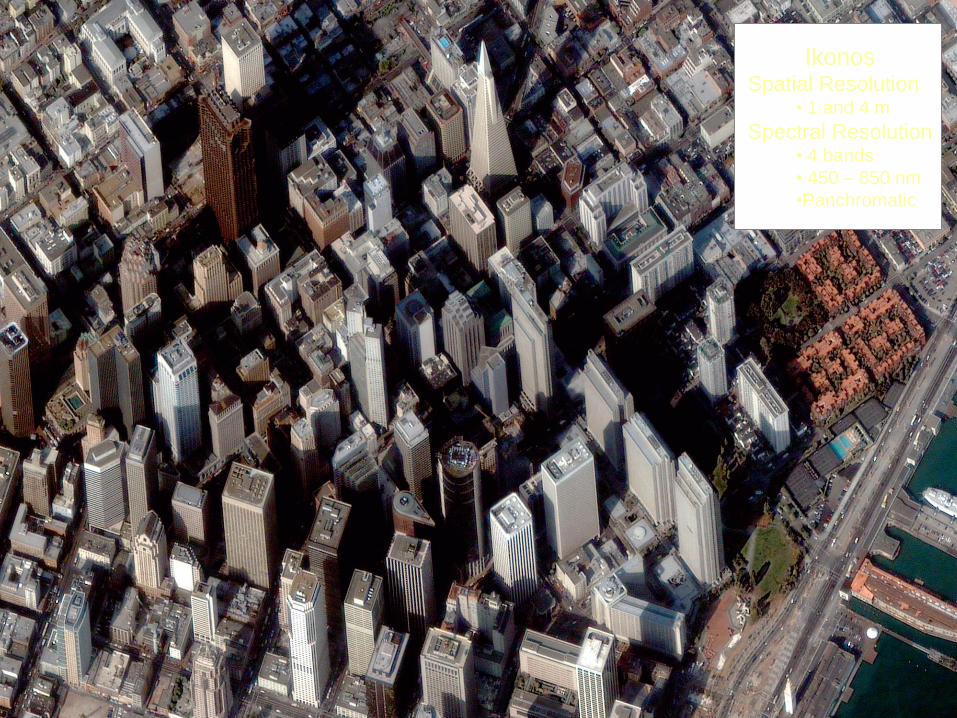
IkonosSpatial Resolution
• 1 and 4 m
Spectral Resolution• 4 bands
• 450 – 850 nm
•Panchromatic
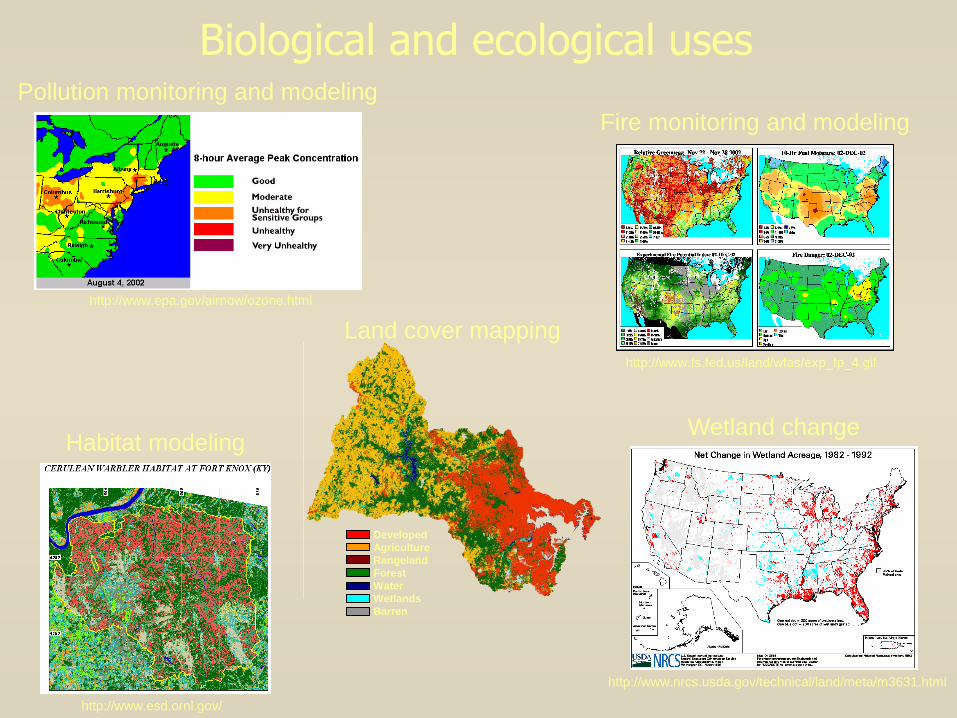
Biological and ecological uses
Developed
Agriculture
Rangeland
Forest
Water
Wetlands
Barren
Land cover mapping
Fire monitoring and modeling
http://www.fs.fed.us/land/wfas/exp_fp_4.gif
Wetland change
Pollution monitoring and modeling
Habitat modeling
http://www.epa.gov/airnow/ozone.html
http://www.esd.ornl.gov/
http://www.nrcs.usda.gov/technical/land/meta/m3631.html

Acknowledgements
Thanks to Greg Bonynge and Y.Q. Wang for
letting me steal many of their slides